
H-NS Can Facilitate Specific DNA-binding by RNA Polymerase in AT-rich Gene Regulatory Regions
Extremely AT-rich DNA sequences present a challenging template for specific recognition by RNA polymerase. In bacteria, this is because the promoter −10 hexamer, the major DNA element recognised by RNA polymerase, is itself AT-rich. We show that Histone-like Nucleoid Structuring (H-NS) protein can facilitate correct recognition of a promoter by RNA polymerase in AT-rich gene regulatory regions. Thus, at the Escherichia coli ehxCABD operon, RNA polymerase is unable to distinguish between the promoter −10 element and similar overlapping sequences. This problem is resolved in native nucleoprotein because the overlapping sequences are masked by H-NS. Our work provides mechanistic insight into nucleoprotein structure and its effect on protein-DNA interactions in prokaryotic cells.
Published in the journal:
. PLoS Genet 9(6): e32767. doi:10.1371/journal.pgen.1003589
Category:
Research Article
doi:
https://doi.org/10.1371/journal.pgen.1003589
Summary
Extremely AT-rich DNA sequences present a challenging template for specific recognition by RNA polymerase. In bacteria, this is because the promoter −10 hexamer, the major DNA element recognised by RNA polymerase, is itself AT-rich. We show that Histone-like Nucleoid Structuring (H-NS) protein can facilitate correct recognition of a promoter by RNA polymerase in AT-rich gene regulatory regions. Thus, at the Escherichia coli ehxCABD operon, RNA polymerase is unable to distinguish between the promoter −10 element and similar overlapping sequences. This problem is resolved in native nucleoprotein because the overlapping sequences are masked by H-NS. Our work provides mechanistic insight into nucleoprotein structure and its effect on protein-DNA interactions in prokaryotic cells.
Introduction
Transcription is initiated by binding of RNA polymerase to specific DNA sequences known as promoters [1]. Following promoter recognition the resulting complex undergoes a process of isomerisation. Hence, ∼14 base pairs (bp) of DNA, close to the transcription start site, are unwound [2]. RNA polymerase then engages in abortive cycles of initiation before escaping the promoter to form an elongation complex [3]. It has long been known that promoter unwinding is facilitated by the weak base stacking interactions associated with AT-rich DNA. Thus, the eukaryotic TATA box (5′-TATAAA-3′) is unwound during transcription initiation [4]. Similarly, the prokaryotic −10 hexamer (5′-TATAAT-3′), recognised by Domain 2 of the RNA polymerase σ70 subunit, participates in DNA opening [5]. Because DNA elements recognised by RNA polymerase are AT-rich, chromosomal regions, where DNA AT-content is unusually high, prove particularly challenging templates for recognition. For example, the horizontally acquired sections of some bacterial chromosomes have an elevated AT-content. As a result, RNA polymerase may bind cryptic promoters [6] or initiate transcription promiscuously [7].
In Escherichia coli, gene regulatory regions are targeted by chromosome folding proteins [8]. Hence, in addition to their architectural role, these proteins can influence RNA polymerase-DNA interactions [9]. The Histone-like Nucleoid Structuring (H-NS) protein recognises AT-rich DNA and is associated with horizontally acquired genes [10]–[13]. The prevailing view is that, when bound at such regions, H-NS silences transcription [14]. However, the precise mechanism remains elusive; models proposing exclusion of RNA polymerase from, and trapping of RNA polymerase at, H-NS bound regions have both been proposed [15]. Since these models are not mutually exclusive a third possibility is that a myriad of different configurations exist. Interestingly, two recent studies have reported close association between RNA polymerase and H-NS [16], [17]. In one case, H-NS stimulated rather than repressed gene expression [17].
In this work we describe an undocumented role for H-NS; facilitating the correct recognition of promoters by RNA polymerase. The ehxCABD operon from Shiga toxin-producing E. coli (STEC) has an unusually high AT-content. Consequently, the operon regulatory region contains multiple sequences that resemble −10 hexamers. We show that, despite the apparent ambiguity of this DNA template, RNA polymerase initiates transcription specifically from a single promoter in vivo. However, in vitro, RNA polymerase is unable to differentiate between this promoter and adjacent binding sites. We show that H-NS plays a critical role by blocking access of RNA polymerase to the adjacent binding sites. Thus, H-NS ensures correct positioning of RNA polymerase.
Results
Promoter activity locates to the upstream section of theehxCABD gene regulatory region
The ehxCABD operon is located on the pO157 plasmid and its derivatives. The operon encodes an enterohemolysin and proteins for its post-translational modification and export [18]. The 248 bp of regulatory DNA immediately upstream of the operon has an AT-content of 71%. H-NS has been implicated in regulating expression of the operon but a comprehensive molecular analysis is lacking [19]–[21]. As a first step we determined which section of the regulatory DNA contained promoter activity. Note that the ehxCABD regulatory DNA has an almost identical sequence in multiple E. coli serotypes and we arbitrarily used the ehxCABD regulatory sequence described by Rogers et al. [20]. We began by generating DNA fragments carrying discrete sections of the ehxCABD regulatory region (illustrated in Figure 1Ai). The fragments encompass 248 bp of DNA adjacent to the first gene in the operon (fragment F1), the downstream part of this region (fragment F2) or the upstream section of the locus (fragment F3). We assayed each fragment for promoter activity using two plasmid based systems (illustrated in Figure 1Aii). Hence, pRW50 and pLux encode the reporter proteins β-galactosidase and Luciferase respectively. Note that pRW50 was used to report promoter activity in E. coli K-12 whilst pLux was used with E. coli O157:H7 as a control for effects of STEC encoded transcriptional regulators. The raw activity data, for each DNA fragment, in each plasmid, is summarised in Figure 1B. Our results show that the F1 and F3 fragments stimulate transcription, to similar levels, in all of the assays. No detectable transcription was driven by the F2 fragment. Therefore, the ehxCABD promoter must be located in the upstream portion of the regulatory region common in both F1 and F3.

RNA polymerase utilises a single promoter within theehxCABD F3 fragment in vivo
Our next aim was to identify transcription start sites in the F3 fragment. To do this we conducted mRNA primer extension experiments. We used RNA extracted from E. coli JCB387 cells, carrying the F3 fragment cloned in plasmid pRW50. Our analysis yielded two extension products of 155 and 154 nucleotides (nt) in length (Figure 1C). The transcript start, corresponding to the more abundant 154 nt extension product, is labelled +1 in Figure 1D. A consensus extended promoter −10 element (5′-TGnTATAAT-3′) was found 8 bp upstream of the transcription start site. A four out of six match to a promoter −35 element (5′-TTGACA-3′) was observed further upstream. Throughout this work we refer to this promoter, highlighted green in Figure 1D, as PehxCABD. The two primer extension products, differing in length by a single nt, both likely originate from this promoter. Importantly, we confirmed that PehxCABD was the only promoter present in the F1 fragment. Thus, using RNA extracted from E. coli JCB387 cells carrying the F1 fragment cloned in plasmid pRW50, we observed only primer extension products corresponding to PehxCABD (Figure S1).
RNA polymerase binds multiple sites within theehxCABD F3 fragment in vitro
Our primer extension analysis shows that, in vivo, RNA polymerase initiates ehxCABD transcription with precision (Figure 1). This is remarkable given the abundance of potential −10 hexamer sequences in this regulatory region (two such sequences are highlighted red in Figure 1D). To better understand how specificity is achieved we examined recognition of the naked F3 fragment by RNA polymerase. We utilised two in vitro DNA footprinting techniques. First, we exploited the properties of Fe2+ chelated Bromoacetamidobenzyl-EDTA (FeBABE). FeBABE is a DNA cleavage reagent that can be attached to specific cysteine side chains in proteins. Once attached, FeBABE cleaves nucleic acids within a 12 Å radius of the attachment site. Thus, FeBABE conjugated with the RC461 derivative of E. coli σ70 cleaves promoter −10 elements [22]. Figure 2Ai shows the pattern of FeBABE cleavage observed with the F3 fragment. As expected, the PehxCABD −10 element was cleaved (highlighted by green box in Figure 2Ai). However, we also observed DNA cleavage at additional sites overlapping PexhCABD (highlighted by red stars in Figure 2Ai). In complementary experiments KMnO4 footprinting was used to detect DNA unwinding by RNA polymerase. We observed DNA melting at the PehxCABD −10 element (highlighted by a green box in Figure 2Aii) and at additional sites (highlighted by yellow stars in Figure 2Aii). It did not escape our attention that the additional sites of FeBABE and KMnO4 reactivity align with each other and with sequences that resemble −10 hexamers highlighted in Figure 1D. Nevertheless, we were concerned that the additional FeBABE and KMnO4 reactivity signals might originate from RNA polymerase bound at PehxCABD. To exclude this possibility we ran identical reactions with unrelated cbpA P6 promoter DNA. In these experiments no DNA cleavage products were observed other than those at the cbpA P6 −10 hexamer. We conclude that the naked PehxCABD F3 fragment must contain multiple overlapping RNA polymerase binding sites.

Co-binding of RNA polymerase and H-NS at theehxCABD regulatory region
Factors present in vivo must influence RNA polymerase interactions with PehxCABD. Such factors may explain why the additional RNA polymerase binding sites observed in vitro do not generate transcripts in vivo. Our attention turned to H-NS, which is known to recognise AT-rich regulatory regions and influences ehxCABD expression [19]–[21]. Thus, we used chromatin immunoprecipitation (ChIP) to measure binding of RNA polymerase and H-NS to PehxCABD in vivo. Recall that, in ChIP experiments, a cell's nucleoprotein is cross-linked with formaldehyde, extracted, and then fragmented by sonication. Antibodies directed against the protein of interest are then used to select DNA fragments with which the protein is cross-linked. Finally, PCR is used to identify recovered DNA fragments. Figure 3A shows PCR analysis of DNA immunoprecipitated with anti-RNA polymerase (β subunit) or anti-H-NS. Control experiments, in which we analysed total cellular DNA, or DNA recovered from a mock immunoprecipitation, are also shown. The PehxCABD DNA is detected in the total DNA sample, the anti-β, and anti-H-NS immunoprecipitates. Importantly, the PehxCABD DNA was not detected in the mock immunoprecipitate. In a set of control PCR reactions we probed the lacZ and yabN loci. Note that these loci are not transcribed in the conditions used here and are not bound by H-NS. As expected, lacZ and yabN were not detected in the immunoprecipitates.
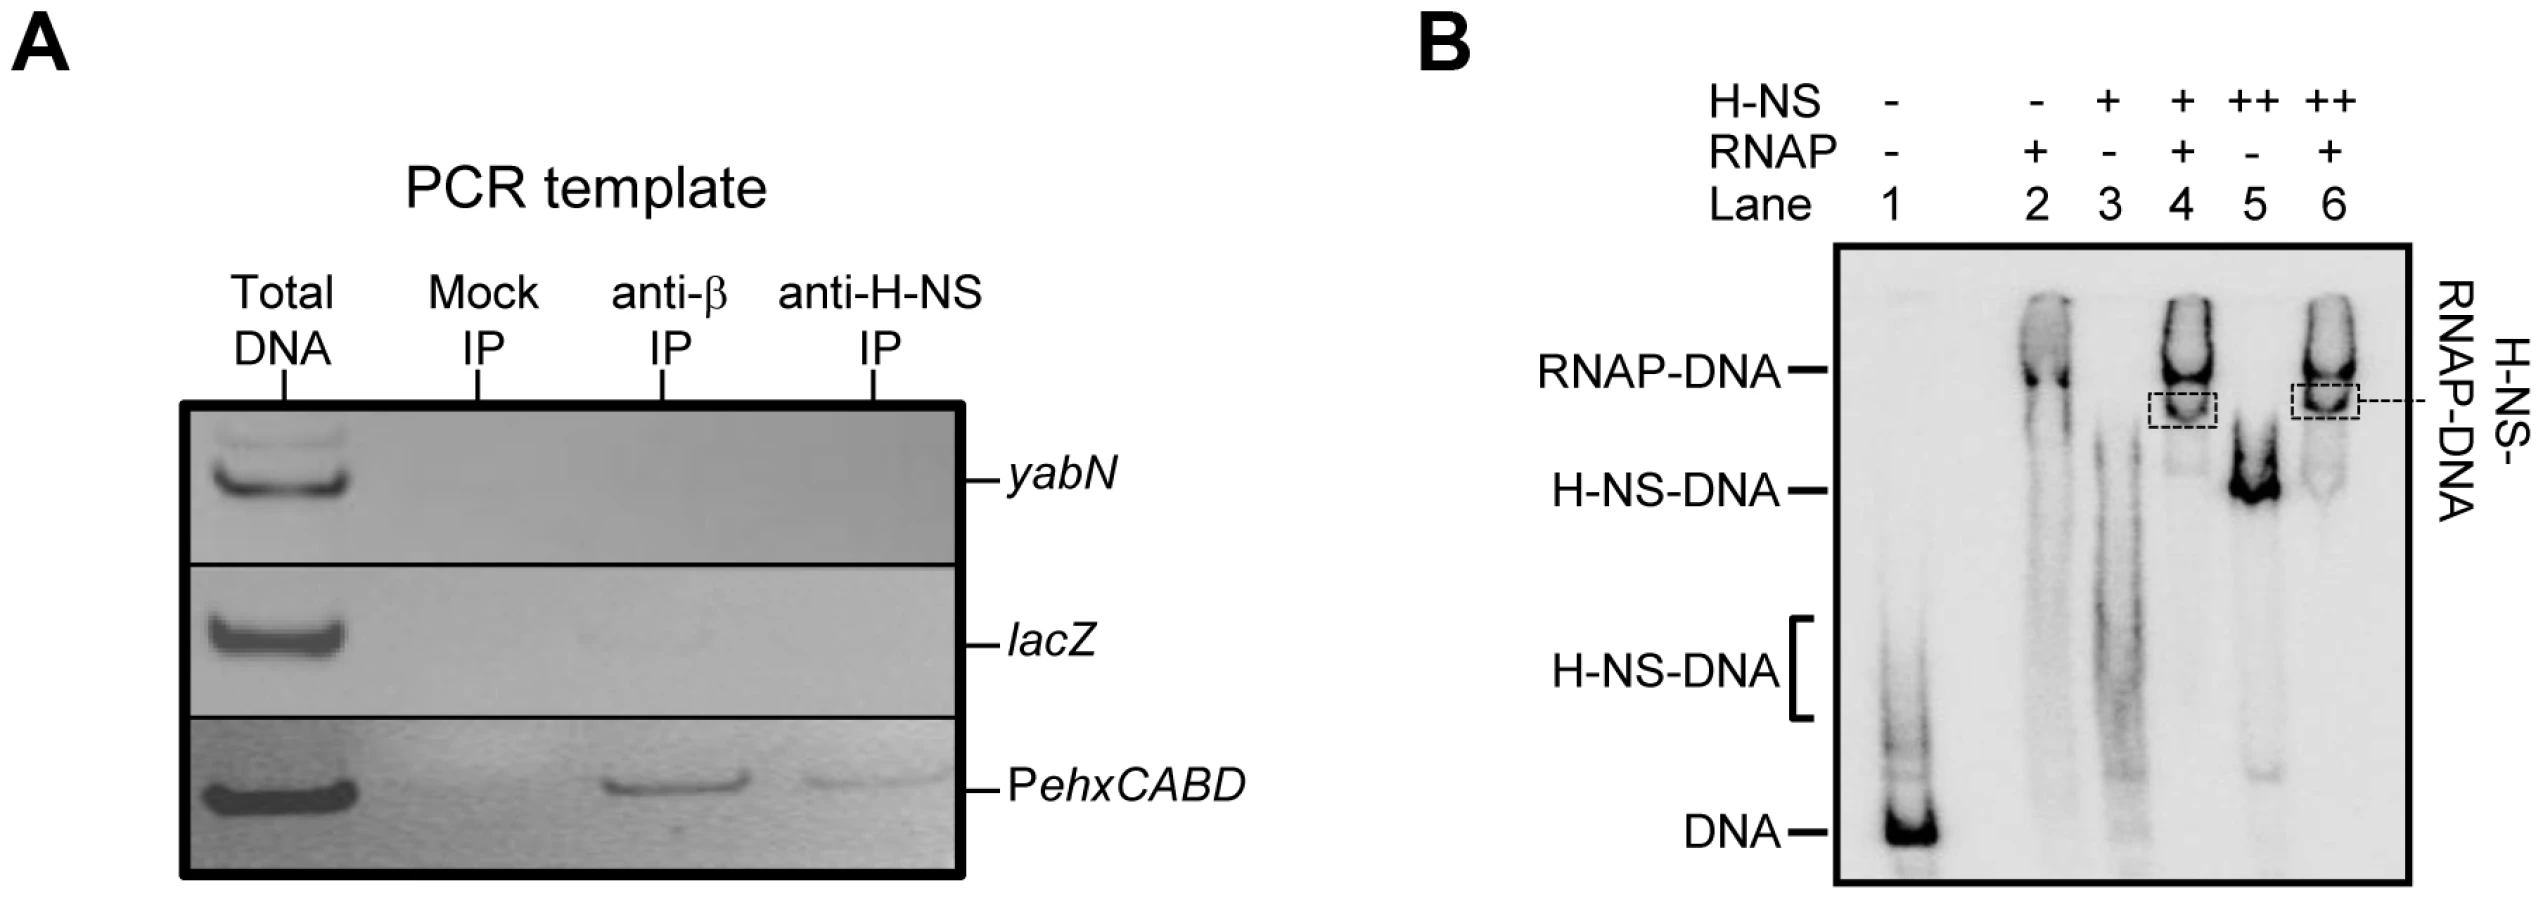
We next reconstituted co-association of RNA polymerase, H-NS and PexhCABD in vitro. Electrophoretic Mobility Shift Assays (EMSA) were used to probe the complexes formed. The result is shown in Figure 3B. The data show that RNA polymerase (lane 2) and H-NS (at two different concentrations, lanes 3 and 5) form distinguishable complexes with the DNA. When H-NS and RNA polymerase are added in unison an additional complex can be detected (boxed in lanes 4 and 6). To confirm that this additional complex contained both H-NS and RNA polymerase the band was extracted, submitted to tryptic digest, and the resulting peptides analysed by mass spectrometry. Both RNA polymerase and H-NS were present in the excised band.
Correct positioning of RNA polymerase at PehxCABD requires H-NS
To more precisely understand the ternary H-NS-RNA polymerase-DNA complex we repeated our σ70RC461-FeBABE analysis. The data show that, in the presence of H-NS, the signal for RNA polymerase binding at the PehxCABD −10 element is retained. Conversely, binding of RNA polymerase at adjacent sites is lost (Figure 4A). In a complementary experiment we used DNAse I footprinting to locate H-NS binding in the absence of RNA polymerase. The data show that H-NS recognises the same AT-rich region, extending from +10 to −30, as the transcriptional apparatus (Figure 4B). Thus, the binding sites for H-NS and RNA polymerase overlap. To assess how H-NS effects RNA polymerase interactions with PexhCABD in vivo we repeated our primer extension analysis. We used RNA extracted from wild type E. coli K-12 and cells lacking hns. As described above, RNA from wild type cells yielded two extension products of 155 and 154 nt in length (Figure 4C lane 5). These extension products were also observed when we analysed RNA from Δhns cells (Figure 4C lane 6). Strikingly, RNA from Δhns cells yielded a further 9 extension products of between 138 and 194 nt in length. These additional primer extension products align with the additional sites of RNA polymerase binding observed in Figure 4A. Finally, it is noteworthy that, in order to observe the primer extension products in Lane 6 of Figure 4C, we had to “overload” the sample onto the gel. This suggests that the net result of reduced RNA polymerase binding specificity is a reduction in transcription. Consistent with this, we observed reduced expression from the F3 fragment, in cells lacking H-NS, using our LacZ reporter assay (Figure S2).

Transcription from PehxCABD is inhibited by overlapping RNA polymerase binding sites
Our data suggest that PehxCABD is flanked by at least two overlapping elements that can bind RNA polymerase. If this model is correct there should be competition between RNA polymerase molecules for binding the various targets. A logical consequence of this competition would be reduced transcription from PehxCABD. To test this model we disrupted either the PehxCABD −10 hexamer or the overlapping RNA polymerase binding elements. The mutations utilised are illustrated in Figure 1D. Figure 5A shows LacZ activity data from wild type E. coli cells carrying the various promoter::lacZ fusions. The -41G mutation increases LacZ expression that is further increased by the -7T-5T-4T mutations. Conversely, the -13G mutation, in the canonical PehxCABD −10 element, reduces LacZ expression.

We next sought to confirm the stimulatory effect of H-NS on specific recognition of PehxCABD by RNA polymerase. Thus, we compared the effects of H-NS and the -41G mutation using in vitro transcription assays. The F3 DNA fragment was cloned upstream of the λoop terminator in plasmid pSR. In the context of this construct PehxCABD produces transcripts, of 178/179 nt in length, that can be quantified after electrophoresis. Additional transcripts, corresponding to the Δhns primer extension products in Figure 4C, should also be generated. On this basis, we expected to detect an abundant 162 nt transcript (corresponding to the 138 nt extension product in Figure 4C) and scarce transcripts sized between 183 nt and 218 nt (equivalent to the primer extension products in the 159–194 nt range). The results of the analysis with and without H-NS are shown in Figure 5Bi alongside a set of “marker” transcripts (Lane 1). Lane 2 shows the result in the absence of H-NS. As expected we observed two intense bands corresponding to the 178/179 and 162 nt products. Note that because the bands in the 183–218 nt range are less abundant and poorly resolved in this assay they were not clearly visible. The 108 nt “RNAI” transcript is from the pSR replication origin and acts as an internal control. Addition of H-NS to the reactions specifically stimulated transcription from PehxCABD (Lanes 2–5). Figure 5Bi shows the effect of the -41G mutation, it is indistinguishable from the effect of H-NS. Note that both the addition of H-NS, and the introduction of the -41G mutation, resulted in a decrease in the relative abundance of the 162 nt transcript compared to the RNAI control transcript (Figure 5B).
Discussion
Co-binding of H-NS and RNA polymerase at gene regulatory regions
The data presented here demonstrate that nucleoprotein organisation, as well as primary DNA sequence, controls the specificity of regulatory DNA for RNA polymerase. In our model, RNA polymerase competes with itself for binding to AT-rich sequences overlapping PehxCABD (Figure 6). In the context of native nucleoprotein this self-competition is negated. This is because RNA polymerase has instead to compete with H-NS (Figure 6). Hence, evolution of RNA polymerase binding targets likely involves a trade-off between attaining the optimal DNA sequence for correct chromosome folding and precise transcription initiation. We note the PehxCABD has a consensus extended −10 element. Such sequences are incredibly rare, being found in only 3 of the 554 documented promoters in E. coli [23]. We speculate that, in very AT-rich gene regulatory regions, closer matches to the consensus RNA polymerase recognition elements are highly beneficial. Thus, in the presence of H-NS, RNA polymerase is able to recognise PehxCABD because of its close similarity to a consensus promoter. Conversely, adjacent AT-rich sequences are ignored. Interestingly, the net effect of H-NS on transcription from PehxCABD is positive and this results from correct positioning of RNA polymerase by H-NS (Figures 4 and 5). Park and co-workers [17] recently documented a mechanism for positive regulation of malT by H-NS. Although H-NS exerts its effect on malT by binding the malT mRNA there are some clear parallels with the mechanism described here. Hence, the incoming ribosome is unable to correctly recognise the 5′ end of the malT mRNA because the Shine Dalgarno sequence is ambiguous. H-NS corrects mispositioning of the ribosome by binding to an adjacent AU-rich element. We note that the effect of H-NS on binding of RNA polymerase to PehxCABD is similar to the effect of CRP on binding of RNA polymerase to the acsP2 promoter [24]. However, the molecular mechanisms underlying the effects are different. Hence, at acsP2, CRP makes direct contacts with RNA polymerase that ensure it engages the promoter precisely.

Comparison with previous studies of theehxCABD gene regulatory region
Rogers et al. [20] previously studied a 1338 bp DNA fragment carrying 126 bp of the ehxCABD gene regulatory region, the entire 516 bp ehxC gene, and 695 bp of ehxA. The fragment was fused to lacZ and, on detection of LacZ expression, it was concluded that a promoter must be located within the 126 bp regulatory section of the 1338 bp fragment. We show that, when examined in isolation, the 126 bp of DNA immediately upstream of ehxC is not able to promote transcription (see the F2 fragment in Figure 1). Similarly, no mRNA species were found to originate in this section of the regulatory region (highlighted blue in Figure S1). Thus, the only plausible explanation for the observations of Rogers et al. is that they unwittingly measured transcription from spurious promoters located within the AT-rich ehxCABD coding sequence. More recently, Iyoda and co-workers [21] examined the full ehxCABD regulatory region (similar to our F1 fragment). The authors found that deleting the upstream part of the regulatory region greatly reduced transcription. Building on the assumptions of Rogers et al. (2009) the authors presumed that they had removed the binding site for a transcriptional activator. A speculative binding site for the activator was identified; this sequence aligns with the PehxCABD consensus extended −10 hexamer. Clearly, a more likely explanation is that Iyoda and co-workers had simply removed PehxCABD. Taken together, these data suggest that control of ehxCABD expression is more complex than previously thought. In particular, the possibility that additional promoters exist within the ehxCABD coding sequence is intriguing [20]. Should any such promoters be repressed by H-NS, as suggested by Rogers et al. [20], this would further ensure specific transcription initiation from PehxCABD. We also speculate that small differences in the DNA sequence of the ehxCABD regulatory region, in different E. coli isolates, may provide information about how H-NS regulated promoter regions evolve. Further biochemical and genetic dissection of the ehxCABD locus should provide the necessary insight.
Methods
Strains and plasmids
Wild type E. coli strains JCB387 and M182 have been described previously [25], [26]. The Δhns M182 derivative (JRG4864) is described by Wyborn et al. [27]. Plasmids pRW50 and pLux are described by Lodge et al. [28] and Burton et al. [29] respectively. Plasmid pSR is described by Kolb et al. [30]. More detailed descriptions of strains and plasmids are provided in Table S1.
Protein preparations and DNA footprinting
H-NS and RNA polymerase were prepared as described previously [22], [25]. DNA fragments for footprinting and EMSA experiments were derived from Qiagen maxi-preparations of plasmid pSR. Thus, the ehxCABD F3 fragment was excised from pSR by sequential digestion with HindIII and then AatII. After digestion fragments were labelled at the HindIII end using [γ-32P]-ATP and polynucleotide kinase. DNAse I and KMnO4 footprints were then performed as described by Grainger et al. [25]. FeBABE footprinting reactions were completed according to the methodology of Bown et al. [22]. Radio-labelled DNA fragments were used at a final concentration of ∼10 nM. Note that, apart from the KMnO4 reactivity assays, all in vitro DNA binding reactions contained a vast excess (12.5 µg ml−1) of Herring sperm DNA as a non-specific competitor. We checked that our reaction conditions were meaningful by comparing the affinity of H-NS for PehxCABD and the well-characterised H-NS target proU. We found that the affinity of H-NS for the two DNA fragments was similar in our conditions (Figure S3). Footprints were analysed on a 6% DNA sequencing gel (molecular dynamics). The results of all footprints and EMSA experiments were visualized using a Fuji phosphor screen and Bio-Rad Molecular Imager FX.
In vitro transcription assays
The in vitro transcription experiments were performed as described previously Savery et al. [31] using the system of Kolb et al. [30]. A Qiagen maxiprep kit was used to purify supercoiled pSR plasmid carrying the different promoter inserts. This template (∼16 µg ml−1) was pre-incubated with purified H-NS in buffer containing 20 mM Tris pH 7.9, 5 mM MgCl2, 500 µM DTT, 50 mM KCl, 100 µg ml−1 BSA, 200 µM ATP, 200 µM GTP, 200 µM CTP, 10 µM UTP with 5 µCi [α-32P]-UTP. The reaction was started by adding purified E. coli RNA polymerase. Labelled RNA products were analysed on a denaturing polyacrylamide gel.
Promoter DNA fragments and in vivo gene expression assays
Luciferase assays were done as described by Burton et al. [29] using E. coli O157:H7. β-galactosidase assays were completed using the protocols of Miller [32] with E. coli JCB387, M182 or the Δhns derivative. All assay values are the average of three independent experiments and, in all cases, cells were grown aerobically, at 37°C, in LB media. The ehxCABD F1 fragment was synthesised by DNA2.0 (USA). The F3 fragment was generated using overlapping oligonucleotides (5′-ggctgcgaattctatcttacaaatcaatcatctgagtgttataatataacttagctgtgatatgtgtaagaatgtttaggcaat-3′ and 5′-cgcccgaagcttcatctctcccaaccaaaacaacattagcgataataatatattgcctaaacattcttacacatatca-3′). Similarly, F2 was generated using 5′-ggctgcgaattctgtttttagatgcttcttgcttaaaagaatataattcctgttcttttatatagagttctttaca-3′ and 5′-cgcccgaagcttcataatgtttaaacaaataagaaaattcagtaaatgtaaagaactctatataaaagaac-3′. Mutations were introduced using derivatives of these oligonucleotides. All ehxCABD regulatory region sequences are numbered with respect to the transcription start point (+1) and with upstream and downstream locations denoted by ‘−’ and ‘+’ prefixes respectively.
Primer extension assays
Transcript start sites were mapped by primer extension, as described in Lloyd et al. [33], using RNA purified from strains carrying the F3 DNA fragment cloned in pRW50. The 5′ end-labelled primer D49724, which anneals downstream of the HindIII site in pRW50 was used in all experiments. Primer extension products were analysed on denaturing 6% polyacrylamide gels, calibrated with size standards, and visualized using a Fuji phosphor screen and Bio-Rad Molecular Imager FX.
Chromatin immunoprecipitation
Chromatin Immunoprecipitation was done exactly as described previously [8], [34]. Briefly, formaldehyde crosslinked nucleoprotein, obtained from growing JCB387 cells carrying the F3 fragment in plasmid pRW50, was fragmented by sonication. Some of this sample was retained as the “total DNA” fraction. DNA cross-linked with RNA polymerase or H-NS was then precipitated using a rabbit polyclonal antibody against H-NS or an antibody against the RNA polymerase β-subunit (Neoclone). A control mock immunoprecipitation (with no antibody) was done in parallel. After immunoprecipitation the protein-DNA complexes were de-cross-linked and the DNA was recovered using a Qiagen PCR purification kit. Recovered DNA was resuspended in 50 µl of elution buffer and 1 µl of this solution was used as a template in a 50 µl PCR. The reactions were run for 28 cycles of amplification before 5 µl was loaded onto a 7.5% polyacrylamide gel. After electrophoresis PCR products were visualised with ethidium bromide. The oligonucleotide primers for amplification of the yabN [34] and lacZ [8] open reading frames, in their chromosomal context, have been described previously. To amplify PehxCABD we used 5′-ggctgcctcgagtatcttacaaatcaatcatctgagtgttataatataacttagctgtga-3′ and 5′-cgcccgggatcccatctctcccaaccaaaacacattagcg-3′.
Supporting Information
Zdroje
1. LeeDJ, MinchinSD, BusbySJ (2012) Activating transcription in bacteria. Annu Rev Microbiol 66 : 125–152.
2. BurgessRR, AnthonyL (2001) How sigma docks to RNA polymerase and what sigma does. Curr Opin Microbiol 4 : 126–131.
3. KapanidisAN, MargeatE, HoSO, KortkhonjiaE, WeissS, et al. (2006) Initial transcription by RNA polymerase proceeds through a DNA-scrunching mechanism. Science 314 : 1144–1147.
4. KimJL, NikolovDB, BurleySK (1993) Co-crystal structure of TBP recognizing the minor groove of a TATA element. Nature 365 : 520–527.
5. ZhangY, FengY, ChatterjeeS, TuskeS, HoMX, et al. (2012) Structural basis of transcription initiation. Science 338 : 1076–1080.
6. IslamMS, BingleLE, PallenMJ, BusbySJ (2011) Organization of the LEE1 operon regulatory region of enterohaemorrhagic Escherichia coli O157:H7 and activation by GrlA. Mol Microbiol 79 : 468–483.
7. JeongJH, KimHJ, KimKH, ShinM, HongY, et al. (2012) An unusual feature associated with LEE1 P1 promoters in enteropathogenic Escherichia coli (EPEC). Mol Microbiol 83 : 612–622.
8. GraingerDC, HurdD, GoldbergMD, BusbySJ (2006) Association of nucleoid proteins with coding and non-coding segments of the Escherichia coli genome. Nucleic Acids Res 34 : 4642–4652.
9. BrowningDF, GraingerDC, BusbySJ (2010) Effects of nucleoid-associated proteins on bacterial chromosome structure and gene expression. Curr Opin Microbiol 13 : 773–780.
10. NavarreWW, PorwollikS, WangY, McClellandM, RosenH, et al. (2006) Selective silencing of foreign DNA with low GC content by the H-NS protein in Salmonella. Science 313 : 236–238.
11. LucchiniS, RowleyG, GoldbergMD, HurdD, HarrisonM, et al. (2006) H-NS mediates the silencing of laterally acquired genes in bacteria. PLoS Pathog 2 (8) e81.
12. OshimaT, IshikawaS, KurokawaK, AibaH, OgasawaraN (2006) Escherichia coli histone-like protein H-NS preferentially binds to horizontally acquired DNA in association with RNA polymerase. DNA Res 13 : 141–153.
13. GordonBR, LiY, CoteA, WeirauchMT, DingP, et al. (2011) Structural basis for recognition of AT-rich DNA by unrelated xenogeneic silencing proteins. Proc Natl Acad Sci 108 : 10690–10695.
14. DormanCJ (2007) H-NS, the genome sentinel. Nat Rev Microbiol 5 : 157–161.
15. LimCJ, LeeSY, KenneyLJ, YanJ (2012) Nucleoprotein filament formation is the structural basis for bacterial protein H-NS gene silencing. Sci Rep 2 : 509.
16. ShinM, LagdaAC, LeeJW, BhatA, RheeJH, et al. (2012) Gene silencing by H-NS from distal DNA site. Mol Microbiol 86 : 707–719.
17. ParkHS, OstbergY, JohanssonJ, WagnerEG, UhlinBE (2010) Novel role for a bacterial nucleoid protein in translation of mRNAs with suboptimal ribosome-binding sites. Genes Dev 24 : 1345–1350.
18. SchmidtH, KernbachC, KarchH (1996) Analysis of the EHEC hly operon and its location in the physical map of the large plasmid of enterohaemorrhagic Escherichia coli O157:H7. Microbiology 142 : 907–914.
19. LiH, GranatA, StewartV, GillespieJR (2008) RpoS, H-NS, and DsrA influence EHEC hemolysin operon (ehxCABD) transcription in Escherichia coli O157:H7 strain EDL933. FEMS Microbiol Lett 285 : 257–262.
20. RogersMT, ZimmermanR, ScottME (2009) Histone-like nucleoid-structuring protein represses transcription of the ehx operon carried by locus of enterocyte effacement-negative Shiga toxin-expressing Escherichia coli. Microb Pathog 47 : 202–211.
21. IyodaS, HondaN, SaitohT, ShimutaK, TerajimaJ, et al. (2011) Coordinate control of the locus of enterocyte effacement and enterohemolysin genes by multiple common virulence regulators in enterohemorrhagic Escherichia coli. Infect Immun 79 : 4628–4637.
22. BownJA, OwensJT, MearesCF, FujitaN, IshihamaA, et al. (1999) Organization of open complexes at Escherichia coli promoters. Location of promoter DNA sites close to region 2.5 of the sigma70 subunit of RNA polymerase. J Biol Chem 274 : 2263–2270.
23. MitchellJE, ZhengD, BusbySJ, MinchinSD (2003) Identification and analysis of ‘extended −10’ promoters in Escherichia coli. Nucleic Acids Res 31 : 4689–4695.
24. BeattyCM, BrowningDF, BusbySJW, WolfeAJ (2003) Cyclic AMP Receptor Protein-Dependent Activation of the Escherichia coli acsP2 Promoter by a Synergistic Class III Mechanism. J Bacteriol 185 : 5148–5157.
25. GraingerDC, GoldbergMD, LeeDJ, BusbySJ (2008) Selective repression by Fis and H-NS at the Escherichia coli dps promoter. Mol Microbiol 68 : 1366–1377.
26. BusbyS, KotlarzD, BucH (1983) Deletion mutagenesis of the Escherichia coli galactose operon promoter region. J Mol Biol 167 : 259–274.
27. WybornNR, StapletonMR, NorteVA, RobertsRE, GraftonJ, et al. (2004) Regulation of Escherichia coli hemolysin E expression by H-NS and Salmonella SlyA. J Bacteriol 186 : 1620–1628.
28. LodgeJ, FearJ, BusbyS, GunasekaranP, KaminiNR (1992) Broad host range plasmids carrying the Escherichia coli lactose and galactose operons. FEMS Microbiol Lett 74 : 271–276.
29. BurtonNA, JohnsonMD, AntczakP, RobinsonA, LundPA (2010) Novel aspects of the acid response network of E. coli K-12 are revealed by a study of transcriptional dynamics. J Mol Biol 401 : 726–742.
30. KolbA, KotlarzD, KusanoS, IshihamaA (1995) Selectivity of the Escherichia coli RNA polymerase E sigma 38 for overlapping promoters and ability to support CRP activation. Nucleic Acids Res 23 : 819–826.
31. SaveryNJ, LloydGS, KainzM, GaalT, RossW, et al. (1998) Transcription activation at Class II CRP-dependent promoters: identification of determinants in the C-terminal domain of the RNA polymerase alpha subunit. EMBO J 17 : 3439–3447.
32. Miller J (1972) Experiments in Molecular Genetics. Cold Spring Harbor, NY: Cold Spring Harbor Laboratory Press.
33. LloydGS, HollandsK, GodfreyRE, BusbySJ (2008) Transcription initiation in the Escherichia coli K-12 malI-malX intergenic region and the role of the cyclic AMP receptor protein. FEMS Microbiol Lett 288 : 250–7.
34. GraingerDC, OvertonTW, ReppasN, WadeJT, TamaiE, et al. (2004) Genomic studies with Escherichia coli MelR protein: applications of chromatin immunoprecipitation and microarrays. J Bacteriol 186 : 6938–6943.
35. ChintakayalaK, SinghSS, RossiterAE, ShahapureR, DameRT, et al. (2013) E. coli Fis Protein Insulates the cbpA Gene from Uncontrolled Transcription. PLoS Genet 9 (1) e1003152 doi:10.1371/journal.pgen.1003152
Štítky
Genetika Reprodukční medicínaČlánek vyšel v časopise
PLOS Genetics
2013 Číslo 6
- Kazuistika – Perspektivy využití precizované medicíny v rámci personalizované specifické terapie onkologických pacientů
- Nobelova cena za chemii pro genetické nůžky: Objev, který změní naši budoucnost?
- Technologie na bázi RNA v klinické praxi: od přebarvených petúnií k terapii vzácných a dosud jen obtížně léčitelných chorob u lidí
- „Nepředstavovali jsme si, že náš výzkum povede přímo ke vzniku nových léků, dokonce ještě za našeho života“
- Bezplatné služby pro diagnostiku ATTRv amyloidózy pro kardiology
Nejčtenější v tomto čísle
- BMS1 Is Mutated in Aplasia Cutis Congenita
- Sex-stratified Genome-wide Association Studies Including 270,000 Individuals Show Sexual Dimorphism in Genetic Loci for Anthropometric Traits
- Distinctive Expansion of Potential Virulence Genes in the Genome of the Oomycete Fish Pathogen
- Distinct Neuroblastoma-associated Alterations of Impair Sympathetic Neuronal Differentiation in Zebrafish Models
Zvyšte si kvalifikaci online z pohodlí domova
Mazová zátka a její řešení
nový kurzVšechny kurzy