
Deregulation of the Protocadherin Gene Alters Muscle Shapes: Implications for the Pathogenesis of Facioscapulohumeral Dystrophy
Generation of skeletal muscles with forms adapted to their function is essential for normal movement. Muscle shape is patterned by the coordinated polarity of collectively migrating myoblasts. Constitutive inactivation of the protocadherin gene Fat1 uncoupled individual myoblast polarity within chains, altering the shape of selective groups of muscles in the shoulder and face. These shape abnormalities were followed by early onset regionalised muscle defects in adult Fat1-deficient mice. Tissue-specific ablation of Fat1 driven by Pax3-cre reproduced muscle shape defects in limb but not face muscles, indicating a cell-autonomous contribution of Fat1 in migrating muscle precursors. Strikingly, the topography of muscle abnormalities caused by Fat1 loss-of-function resembles that of human patients with facioscapulohumeral dystrophy (FSHD). FAT1 lies near the critical locus involved in causing FSHD, and Fat1 mutant mice also show retinal vasculopathy, mimicking another symptom of FSHD, and showed abnormal inner ear patterning, predictive of deafness, reminiscent of another burden of FSHD. Muscle-specific reduction of FAT1 expression and promoter silencing was observed in foetal FSHD1 cases. CGH array-based studies identified deletion polymorphisms within a putative regulatory enhancer of FAT1, predictive of tissue-specific depletion of FAT1 expression, which preferentially segregate with FSHD. Our study identifies FAT1 as a critical determinant of muscle form, misregulation of which associates with FSHD.
Published in the journal:
. PLoS Genet 9(6): e32767. doi:10.1371/journal.pgen.1003550
Category:
Research Article
doi:
https://doi.org/10.1371/journal.pgen.1003550
Summary
Generation of skeletal muscles with forms adapted to their function is essential for normal movement. Muscle shape is patterned by the coordinated polarity of collectively migrating myoblasts. Constitutive inactivation of the protocadherin gene Fat1 uncoupled individual myoblast polarity within chains, altering the shape of selective groups of muscles in the shoulder and face. These shape abnormalities were followed by early onset regionalised muscle defects in adult Fat1-deficient mice. Tissue-specific ablation of Fat1 driven by Pax3-cre reproduced muscle shape defects in limb but not face muscles, indicating a cell-autonomous contribution of Fat1 in migrating muscle precursors. Strikingly, the topography of muscle abnormalities caused by Fat1 loss-of-function resembles that of human patients with facioscapulohumeral dystrophy (FSHD). FAT1 lies near the critical locus involved in causing FSHD, and Fat1 mutant mice also show retinal vasculopathy, mimicking another symptom of FSHD, and showed abnormal inner ear patterning, predictive of deafness, reminiscent of another burden of FSHD. Muscle-specific reduction of FAT1 expression and promoter silencing was observed in foetal FSHD1 cases. CGH array-based studies identified deletion polymorphisms within a putative regulatory enhancer of FAT1, predictive of tissue-specific depletion of FAT1 expression, which preferentially segregate with FSHD. Our study identifies FAT1 as a critical determinant of muscle form, misregulation of which associates with FSHD.
Introduction
Developmental genetics has provided considerable insight into the regulatory networks controlling overall skeletal muscle development. Perturbation of these common mechanisms is associated with congenital abnormalities of the muscle lineage as well as with later-onset muscle pathologies [1]. In contrast, less is known about the mechanisms of functional diversification within the muscle lineage. Such diversification may be either metabolic - fast versus slow fibres, for example - or morphological, such as the position and shape of individual muscles. Genes controlling diversification too are likely to be of clinical significance [2]–[4], since several human muscular dystrophies do not affect all muscles evenly, but specifically target regionalized groups [5]. This is true for limb girdle muscular dystrophy (LGMD), oculopharyngeal muscular dystrophy (OPMD), myotonic dystrophies with oculomotor involvement, distal myopathies, scapuloperoneal dystrophy, and facioscapulohumeral dystrophy (FSHD) [5]–[6]. In no case, however, is the rationale for this geographic specificity currently understood.
One characteristic example of focal myopathies is FSHD, which affects subsets of muscles in the facial and shoulder areas [6]. The main form of FSHD - FSHD1 - is an autosomal dominant disorder associated with the contraction of an array of 3.3 Kb macrosatellite repeats (D4Z4), located at the subtelomeric 4q35 locus [6]. The mechanism by which the D4Z4 contraction triggers the disease represents one of the most enigmatic conundrums for human geneticists and remains incompletely understood. The D4Z4 array has been suggested to act as an insulator between telomeres and subtelomeric genes [7]–[8], such that its contraction might result in regulatory changes in neighbouring genes that could in turn alter muscle physiology [6], [9]–[11]. Despite intense focus on deregulated 4q35 genes, including one of the close neighbours, FRG1 [12], and despite numerous large-scale investigations aimed at uncovering additional relevant candidates, none of the genes reported accounts for all aspects of FSHD, and additional players are still actively sought [6], [9], [13]. An emerging model is that the pathogenic effect of D4Z4 contraction in FSHD1 is mediated in part by DUX4, a retrogene present within D4Z4 repeats themselves encoding a homeobox containing transcription factor that is normally silent in muscle [14]–[15]. In FSHD1 patients, the contraction of the D4Z4 repeat array leads to a change in chromatin structure that facilitates DUX4 expression [16]. Furthermore, the pathogenicity of the D4Z4 contraction requires polymorphisms distal to the last D4Z4 repeat, that create a polyadenylation signal and thereby stabilize DUX4 mRNA [17]. This stabilized RNA thus leads to increased expression levels in FSHD muscles of a pathogenic isoform of DUX4, which activity is thought to be toxic for muscles through transcriptional activation of various target genes including Pitx1 and p53 [18]–[21]. Another less frequent form of FSHD, clinically identical to FSHD1, is observed in absence of D4Z4 contraction. These cases, referred to as contraction-independent FSHD, include cases called FSHD2, that were shown to exhibit hypomethylated D4Z4 repeats, recently shown to be caused by mutations in the SMCHD1 gene [22]. FSHD2 is caused by the combination of such SMCHD1 mutations with a DUX4 permissive (polyA) context, and also leads to DUX4 overexpression [22]. While FSHD2 cases represent so far the majority of contraction-independent cases, rare cases of contraction-independent FSHD with typical symptoms may also occur without hypomethylation, and be caused by yet unidentified pathogenic contexts. Neither the specificity of SMCHD1 or of DUX4 expression nor of its target genes identified so far [18]–[21], [23]–[24], provide sufficient account for the specificity of the muscle map and the non-muscular symptoms that characterize FSHD.
The regional specificity in the map of muscles affected in FSHD suggests that the causal abnormality interferes with a muscle subtype-specific developmental process. A gene involved in functional diversification during muscle development would thus provide a logical candidate to fill this gap. We focused on the cell adhesion molecule FAT1 because Fat-like protocadherins are known modulators of the planar cell polarity (PCP) pathway [25]–[27], a genetic cascade involved in coordinating tissue polarity, morphogenetic movements, and polarized cell flow [28]–[30]. Fat1 has been reported to be expressed in developing muscles and tendons [31] and to be regulated by muscle developmental genes such as Pax3, Lbx1, or Met [32]–[34]. Thus, FAT1 may control muscle shape through PCP-like mechanisms analogous to those involved in polarized migration of vascular endothelial smooth muscle cells [35].
Here, we report the unexpected finding that Fat1-deficient mice reproduce the highly selective muscular and non-muscular aspects of the clinical picture of FSHD. We show that Fat1 is required during development to shape specific groups of shoulder and facial muscles by modulating the polarity of myoblast migration. While constitutive inactivation of Fat1 leads to neonatal lethality due to defects in kidney development [36], Fat1 hypomorphic mice exhibit defects of muscle integrity with a topography prefiguring the map of muscles affected in FSHD. Furthermore, conditional mutagenesis suggests that a cell-autonomous function of Fat1 in migrating muscle cells may account for a significant part of its muscle shaping function. The human FAT1 gene is located only 3.6 Mb from the critical FSHD genomic region at 4q35, and emerges as a potential transcriptional target of DUX4 or p53 [18], [37]–[38]. We present evidence of altered FAT1 levels in some foetal FSHD1 cases, in muscle, but not brain, accompanied with epigenetic modifications characteristic of silenced chromatin. Finally, we identified genetic variants deleting variable lengths of a putative cis-regulatory enhancer in the FAT1 locus, which segregate with FSHD. Thus, either in presence or absence of D4Z4 contractions, mechanisms leading to tissue-specific deregulation of FAT1 expression are associated with FSHD and may contribute to causing regional-specific muscle shape abnormalities that prefigure muscle degeneration in the adult.
Results
Fat1 regulates myoblast polarity during planar migration
In search of mechanisms that control muscle position and form, we studied Fat1 expression at stages of muscle morphogenesis. We chose first to study a muscle with a characteristic fan-shaped form, the subcutaneous muscle cutaneous maximus (CM). During embryogenesis, following delamination from the dermomyotomal lip at forelimb levels, CM precursors, identified through their specific expression of GDNF, reach the base of the limb, turn, and spread under the skin in a radial manner [39]–[40] (Figure 1A). This migration pattern reflects collective and polarized cell migration, visible owing to expression of the MLC3F2E reporter line or of the muscle fate marker MyoD, through the formation of chains of myoblasts aligned in radial directions (Figure 1B and 1E top right panel). At the stages of CM migration, whole mount X-gal staining in embryos carrying a LacZ reporter gene-trap insertion in the mouse Fat1 gene revealed a hot-spot of Fat1 expression highlighting the migration area (Figure 1C, Figure S1). We found that CM myoblasts express Fat1 RNA and appear to be positioned in a subcutaneous layer which itself expresses Fat1 RNA, this surrounding subcutaneous tissue displaying a rostrocaudal gradient of intensity, with highest intensity caudal to the extremity of the CM (Figure 1C; D). Thus, CM myoblasts express Fat1 and appear to migrate along an increasing gradient of Fat1 expression.

We therefore asked whether Fat1 was required for CM location and/or form. We first took advantage of a mouse model carrying a gene-trap insertion in the mouse Fat1 gene [41]–[42] (allele referred to as Fat1LacZ). Initial differentiation along the muscle lineage was unaffected in Fat1LacZ/LacZ embryos since CM myoblasts retained expression of broadly-expressed markers such as MyoD (n = 6), and markers of subsets of myoblasts (such as Six1 (n = 2), gdnf (n = 2), and Lbx1 (n = 2); data not shown). This allowed us to use MyoD expression to monitor precursor migration in Fat1 mutants. In E12.5 Fat1LacZ/LacZ embryos, we observed 1) an aberrant morphology of the CM muscle, reduced in size, and with ill-defined anterior limits (Figure 1E), 2) a dispersion of migrating myoblasts not only within the CM but also in ectopic areas traditionally devoid of muscle cells. In the CM, higher magnification observations revealed that migration myoblasts failed to show a preferential alignment of their nuclei into migratory chains (Figure 1E–H). This phenotype was associated with morphological changes in individual myoblasts, such as the loss of long cytoplasmic protrusions extending from the leading edge and rounded morphology of some nuclei within the chains (Figure 1G, H). In further support of a role for Fat1 in migration polarity, numerous clusters of ectopic myoblasts or disoriented single myoblasts were found in the shoulder region of E12.5 mutants, either in ectopic places, or within additional shoulder muscles such as the spinotrapezius muscle (Figure 1E orange arrowheads in orange dotted area; Figure S2, red arrows).
Regulation of myoblast polarity requires FAT1 transmembrane domain
Further genetic evidence of such a function of FAT1 in control of muscle shape was obtained with another targeted allele of the Fat1 locus, which we engineered by flanking two exons, 24 and 25, the latter containing the transmembrane domain, with LoxP sites (Figure S3A, targeted allele referred to as Fat1Fln). Crossing of mice carrying the conditional Fat1Fln allele with a ubiquitous CRE-expressing mouse line produced, by germline excision of the floxed exons, a constitutively recombined allele, Fat1ΔTM, which encodes FAT1 protein isoforms lacking the corresponding transmembrane domain (Figure 2A,B). Analysis of myogenic differentiation by in situ hybridization with a myoD probe indicated that Fat1ΔTM/ΔTM embryos exhibited phenotypes identical to those seen in Fat1LacZ/LacZ embryos (data not shown). This new allele also allowed studying later steps of muscle differentiation by crossing Fat1ΔTM mice with a transgenic line in which nls-LacZ reporter activity is driven by an enhancer from the mlc3f gene (MLC3F-2E) [43]. Expression of this transgene (MLC3F-2E:LacZ) is detected slightly later than myoD expression as it reflects differentiation in myocytes and sarcomere assembly [43], hence it allows visualising muscle shapes, but not migrating myoblasts. MLC3f-2E expression in Fat1ΔTM/ΔTM embryos revealed again the altered morphology of the CM muscle, with missoriented chains of myocytes in the ventral/pectoral half of the CM and shoulder belt muscles (Figure 2D, and Figure S3B). Furthermore, Fat1ΔTM/ΔTM embryos were found to exhibit an extra muscle ectopically located in the shoulder area (Figure 2D). Finally, we also visualized multinucleated myofibres owing to the nuclear β-galactosidase staining at late gestation stages, and confirmed the persistence of misoriented myofibers in the mature CM muscle of Fat1ΔTM/ΔTM E18.5/P0 embryos (Figure 2D). Taken together, our data show that Fat1 is required to control the shape and position of subsets of migratory muscles in the developing embryo, by controlling coordinated polarity of collectively migrating myoblasts.

The developmental map of Fat1-dependent muscles
We next wished to extend our description of the map of Fat1-dependent muscles by exploring the phenotypes exhibited by Fat1ΔTM/ΔTM embryos carrying the MLC3F-2E transgene at later developmental stages (E14.5 and E15.5), when migration has been completed and muscle shapes are determined. In the scapulohumeral area of all Fat1ΔTM/ΔTM;MLC3F-2E embryos examined, we consistently observed an extra muscle in a stereotyped ectopic position, systematically attached between the spinodeltoid muscle and the triceps brachii muscles (Figure 3A,B). Just dorsal to the spinodeltoid, we found a subcutaneous portion of the spinotrapezius muscle (SpTS) to be drastically reduced in Fat1ΔTM/ΔTM;MLC3F-2E embryos (Figure 3A, orange arrows). Observation from a dorsal point of view reveals that midline junction of the CM muscle and of Rhomboid muscles (Rh) is delayed, so that a large gap is seen in the back of an E14.5 Fat1ΔTM/ΔTM embryo (Figure 3B, orange line). Numerous mispositionned myofibres create ectopic bridges between the acromiotrapezius and spinotrapezius muscles in Fat1ΔTM/ΔTM;MLC3F-2E embryos (Figure 3B; read arrows in top and middle picture). Analysis of muscles in the face at E14.5, E15.5, and at P0, reveals abnormalities in shape, myofibre orientation, and density in several subcutaneous muscles in the facial skin (Figure 3C, red arrows) that occupy positions reminiscent of the position of human muscles of facial expression. The flat structure of these subcutaneous muscles is analogous to that of the CM muscle, and the alterations observed in Fat1ΔTM/ΔTM neonates also include random orientation of multinucleated myofibres (Figure 3C). In contrast, deeper muscles such as the masseters display normal shape in Fat1ΔTM/ΔTM mutants (see Figure 3C and data not shown). Of notice, although muscle shape defects were found in stereotyped places, their severity was variable, and Fat1ΔTM/ΔTM embryos were frequently asymmetrically affected (Figure S4, see also Figure S12A). As previously observed in Fat1LacZ/LacZ mutants, examination of muscle development at E14.5 and E15.5 in Fat1ΔTM/ΔTM embryos confirmed that Fat1 loss of function selectively affects muscles of the facial and scapulohumeral ares, and that Fat1 is not required to shape other migratory muscles such as the diaphragm or hindlimb muscles, which were identical between wild type and Fat1ΔTM/ΔTM embryos (Figure S4 and data not shown). Overall, in addition to the abnormal shape of the cutaneous maximus muscle, we found that Fat1 was required to shape selective and stereotyped groups of muscles in the scapulohumeral interface, as well as subcutaneous muscles of the face.

Mice with reduced Fat1 expression develop early regionalized muscle wasting restricted to mis-shaped muscles
We next asked what the consequences of these muscle shape abnormalities were at postnatal stages. Constitutive deletion of Fat1 was initially shown to lead to neonatal lethality most likely due to defects in kidney filtration [36], [42]. Likewise, constitutive deletion of the transmembrane domain (Fat1ΔTM/ΔTM mice) also leads to more than 50% lethality at birth, with only a small proportion of mutants surviving to adulthood (Figure S3C). We chose to examine adult Fat1LacZ/LacZ mutants, since the hypomorphic Fat1LacZ allele, which results from an insertion of a gene-trap construct in an intron, not deleting any functional domain, allows expression of variable amounts of residual Fat1 RNA and FAT1 protein in Fat1LacZ/LacZ mutants (Figure 2E, Figures S5, and S13). This hypomorphic allele, in the genetic background we used, allowed bypassing the neonatal lethality in Fat1LacZ/LacZ mutants, with more than half the mutant mice surviving after 3 months (Figure 4C), and enabled us to study the postnatal consequences of reduced Fat1 levels. The variable amounts of residual Fat1 correlates with the variability in the severity of phenotypes and in the age of death of Fat1LacZ/LacZ mice. A fraction of these adult phenotypes, in particular the lethality, is likely to result from systemic consequences of kidney phenotype. Indeed, analysis of kidney morphology in the subset of Fat1LacZ/LacZ mice that exhibited severe weight loss revealed features characteristic of polycystic kidneys, such as cysts formed of enlarged tubules in the cortical renal area (data not shown). Therefore, to score with an objective criterion the progression through adult phenotype stages, body weight was measured for each individual and compared to its own maximal weight [44]. We arbitrarily set the moment a Fat1LacZ/LacZ mutant mouse has lost 10% of its weight as the visible onset of symptoms associated with kidney malfunction or with other phenotypes likely to have systemic consequences. Mutant mice showing more than 10% loss at the stage of analysis were defined as “symptomatic” (related to generalized symptoms, and not to muscles only), and the degree of severity was recorded as percentage weight loss, while Fat1LacZ/LacZ mutant mice that did not exhibit any weight loss yet were defined as presymptomatic. Although this threshold of 10% weight loss was defined arbitrarily, and even though we cannot exclude that kidney phenotypes also have systemic consequences earlier than this limit, it is difficult, during symptomatic phase, to attribute a primary cause to the symptoms observed. We therefore focused on the presymptomatic phase for most of our studies of adult muscle, and also chose to exclude from our adult studies mutant mice with an impaired growth curve. While Fat1LacZ/LacZ mice at symptomatic stages (with 20–30% body weight loss) displayed generalized muscle mass reduction (Figures S6B–C, presymptomatic mutant mice showed scapular winging, whereas lumbar posture and hindlimb function appeared unaffected (Figure 4A). Postural abnormalities affecting the shoulder area, indicating weakness of the muscles involved in scapular movements, can be seen when presymptomatic mice move on a cage grid, especially in situations in which they challenge the shoulder girdle muscles by transferring bodyweight rostrally on their forelimbs. These postural abnormalities were accompanied by functional motor defects evidenced in rotarod assays at presymptomatic stages (Figure 4E). Early symptomatic mice (around the 10% threshold) also showed kyphosis, a curvature of the spine known as a hallmark of muscle wasting in the shoulder girdle (Figure 4D, F), without displaying skeletal abnormalities (Figure 4B, X-ray). Similar observations were made in the small proportion of Fat1ΔTM/ΔTM mice that survived to adult stages.

We next investigated the pathological basis for the selective postural abnormality of the scapulae at presymptomatic stages. Dissection of individual muscles in presymptomatic Fat1LacZ/LacZ mice revealed a significant mass reduction for both rhomboid muscles when compared to controls (Figure 4D). As expected from the embryonic defect, a severe reduction in thickness of the CM muscle was also observed, although its subcutaneous location made accurate dissection and therefore mass measurement unfeasible. Defects in myofibre orientation similar to those observed at late embryonic stages were confirmed in CM (Figure S6D and data not shown) and in rhomboid muscles (Figure 4G) at all stages examined. In contrast, masses of muscles with unaltered shape when examined during development (i.e hindlimb muscles such as gastrocnemius or soleus) were also not significantly reduced at presymptomatic stages (Figure 4D, Figure S6B, S7). This argues that persistence in mature muscles of misoriented myofibres resulting from fusion of depolarized myoblasts contributes to the shoulder muscle phenotype in presymptomatic mice, although it does not rule out an additional direct function of Fat1 in muscle, whose loss may also cause muscle degeneration. Lastly, another consequence of developmental dysgenesis that is likely to contribute to focal muscle wasting is the persistence of ectopic muscles (Figure S7). Such ectopic muscles were found to share tendon attachment sites with existing muscles (typically two ipsilateral muscles) including shoulder belt muscles (trapezius, LD, pectoral muscles), and the humeral muscle triceps brachii (Figure S7). This association correlated with a unilateral reduction of the corresponding muscle mass, reduction that nevertheless did not result significant until early symptomatic stages (Figure 4D and data not shown).
The phenotypes resulting from developmental dysgenesis were not restricted to muscle shape and mass. Histological analyses revealed that a significant reduction in fibre diameter was detectable already at early symptomatic stages in those muscles in which we detected developmental defects, including the CM, Rhomboids (Figure 4G, superior and profundis), and Trapezius muscle (Figure 5C, pooled analysis). This was also true for Fat1ΔTM/ΔTM mice analysed at presymptomatic stages (Figure S8). In contrast, at presymptomatic stages, analysis of myofiber diameters in muscles whose shape was unaffected at developmental stages (such as gastrocnemius or soleus, and also diaphragm) revealed no significant abnormality as compared to control mice (Figure 4D, Figure S6B, and data not shown). In affected muscles (trapezius, rhomboid, Pectoralis Major, LD, and CM), we observed a range of additional abnormalities including inflammatory infiltrations between myofibres, most frequently perivascular, in both presymptomatic Fat1LacZ/LacZ and Fat1ΔTM/ΔTM mice (Figure S6D and Figure S7). Fibre necrosis was also observed at more advanced symptomatic stages (beyond 10% weight loss, Figure S7L and data not shown), but as mentioned earlier, it is impossible to distinguish whether any abnormality at symptomatic stage is strictly related to muscle defects, or reflects systemic consequences of unrelated phenotypes. Finally, observation of myofibre structure in affected muscles (trapezius, rhomboid, Pectoralis Major, LD, and CM) revealed progressive disruption of higher level organization, with appearance at presymptomatic stages of multiple faults disrupting the regular alignment of sarcomeric structures (Figure 5A, D), and the detachment of the sarcolemma from the contractile apparatus (Figure 5D). Overall, alterations of muscle integrity at pre-symptomatic stages were only detected in those muscles in which we reported fully penetrant myoblast or myofibre orientation defects (CM, Rhomboids, and Tapezius). Analysis of neuromuscular junctions in affected shoulder muscles also revealed a proportion of junctions showing fragmentation (Figure 5B), denervation, and atrophy (Figure S9). Such defects did not reflect a primary failure of NMJ innervations, as all neuromuscular junctions observed at early postnatal stages (P3) were indistinguishable from wild type (data not shown). Nevertheless, although the muscles that were spared during development and at presymptomatic stages (e.g gastrocnemius, soleus, masseters) were seen to harbour histological signs of muscle atrophy (evenly reduced myofiber diameter) at advanced symptomatic stages (Figure S6B), we did not observe muscle degeneration, inflammation, necrosis, or fragmentation of the contractile apparatus (data not shown). These results are consistent with the possibility that the developmental abnormalities of muscle shape constitute a topographic frame in which muscles might be predisposed to undergo early onset muscle wasting, prior to the appearance of systemic consequences of non-muscle phenotypes and the concomitant generalization of muscle wasting. These findings do not exclude however the possibility that Fat1 may play additional roles during muscle biology other than controlling shape during development.

Ablation of Fat1 functions in premigratory myoblasts with Pax3-cre is sufficient to alter muscle shape
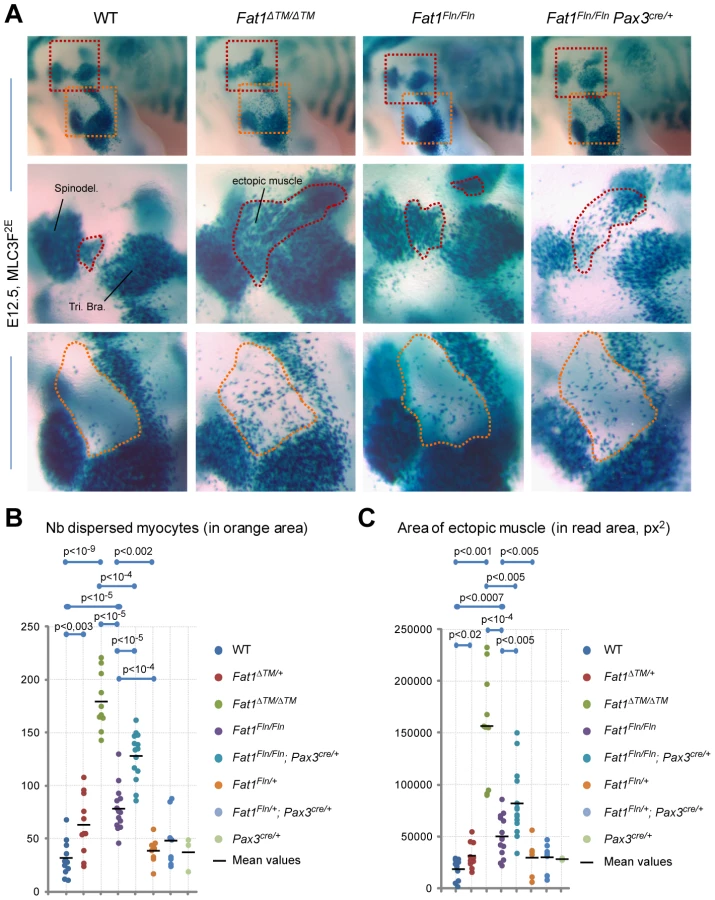
We next asked if the function of Fat1 in shaping facioscapulohumeral muscles was exerted cell-autonomously in migrating muscle precursors. In order to perform tissue-specific ablation of Fat1 in muscles at a stage compatible with migration, we reasoned that transgenic lines in which CRE expression would reproduce that of genes of the muscle differentiation cascade, such as myoD or Myf5, would occur too late to have an impact on the migration itself. Therefore, to ablate Fat1 exons 24 and 25 in premigratory myoblasts, we took advantage of the Pax3-cre knock-in line [45] (Figure S10). Our conditional allele of Fat1 (Fat1Fln) initially includes the neo cassette that was used to engineer the mouse model. Although presence the neo cassette caused mild lowering of Fat1 expression levels (Figure S11), this only resulted in subtle, although statistically significant, morphological defects in Fat1Fln/Fln embryos/mice compared to controls (Figure 6 and Figure S12). This allowed using the Fat1Fln/Fln mutants for conditional studies with tissue-specific CRE lines, without requiring Flp/FRT recombination to further ablate the neo cassette. We therefore compared muscle development in Fat1Fln/Fln;Pax3cre/+ and Fat1Fln/Fln embryos, taking advantage of the MLC3F-2E transgene 1) to visualize the shape of every muscle and 2) to quantify the number of muscle cells dispersed in ectopic areas. We followed muscles belonging to Pax3-derived territories in the scapulohumeral area, where ablation of Fat1 leads to measurable phenotypes in Fat1ΔTM/ΔTM;MLC3F-2E+ embryos (Figure 6A). First, we found significantly higher numbers of dispersed myocytes in the forelimb of Fat1Fln/Fln;Pax3cre/+ embryos than in Fat1Fln/Fln embryos (Figure 6A, B). Second, an ectopic muscle similar to the one found in Fat1ΔTM/ΔTM embryos could be measured in Fat1Fln/Fln;Pax3cre/+ embryos, and its surface was significantly larger than in Fat1Fln/Fln embryos (Figure 6A, C). At later developmental stages, in addition to confirming the persistence and position of this ectopic muscle in Fat1Fln/Fln;Pax3cre/+ embryos, as in Fat1ΔTM/ΔTM; MLC3F-2E+ embryo. Furthermore we also detected a reduced density of myofibers in the CM muscle and in the subcutaneous part of the spinotrapezoid muscle (Figure S12). As the Pax3cre/+ line is a CRE knock-in, but also a knock-out of the endogenous Pax3 locus, the resulting loss of one copy of Pax3 may be in itself sufficient to enhance FAT1-dependent phenotypes. To rule this out, we have evaluated the effect of combining a Pax3cre/+ context to the recombined Fat1ΔTM allele, and found no enhanced phenotype in either Fat1ΔTM/+:Pax3cre/+ or Fat1ΔTM/ΔTM:Pax3cre/+ embryos compared to Fat1ΔTM/+ or Fat1ΔTM/ΔTM embryos, respectively (data not shown). Finally, Fat1Fln/Fln;Pax3cre/+ embryos did not display significantly more abnormalities in the subcutaneous facial muscles or in the spinotrapezius muscle than the mild phenotypes observed in Fat1Fln/Fln embryos (Figure S12), consistent with the fact that facial muscles do not belong to the Pax3-CRE lineage [46]. Furthermore, if ablation in facial neural crest cells, driven by Pax3-CRE activity, had been responsible for altering muscle shape, it would have done so as efficiently in facial muscles as in trunk muscles. The lack of enhancement of facial muscle phenotypes in Fat1Fln/Fln;Pax3cre/+ compared to Fat1Fln/Fln embryos thereby also excludes a contributing role of Fat1 expression in neural crest-derived cells. Thus ablating Fat1 in Pax3-derived cells is sufficient to partially reproduce the defects observed in scapulohumeral muscles of the constitutive Fat1 mutants, indicating that Fat1 is required cell-autonomously in migrating myoblasts to control the polarity of their migration.
Later FAT1 expression in differentiated muscles
As we asked whether in addition to the control of muscle migration, Fat1 may play additional roles in mature muscle, we noticed that in mouse, Fat1 is also expressed in differentiated muscle fibres after migration stages. This expression can be detected through the pattern of β-galactosidase expression in Fat1LacZ/+ embryos, and by in situ hybridization (Figure 7A). Furthermore antibodies against FAT1 C-terminal cytoplasmic tail detected a protein localized in stripes within muscle fibres (Figure 7B–D), on either side of alpha-actinin-positive sarcomere boundaries (so called Z-bands, Figure 7B). In adult mouse muscle, the stripes of FAT1 protein are closely juxtaposed with DHPR, a calcium channel present in transverse (t)-tubules [47] (Figure 7B). Such localization is consistent with Fat1 also playing a direct role in muscle biology, distinct from its early function in orienting myoblast polarity. Consistent with previous reports showing that cytoplasmic variants in FAT1 proteins exhibit distinct subcellular localisation [48], and that the cytoplasmic domain can translocate in the nucleus [49], another antibody directed against the cytoplasmic domain (FAT1-1465 antibody) also detected FAT1 protein in significant proportion of nuclei in adult mouse muscle fibres (data not shown). Western blot analyses indicated that a full length FAT1 protein is only detected in whole embryo extracts (at E12.5, Figure 2B) or in isolated brain tissue, but not in muscle tissue, where the most abundant bands detected with anti-FAT1-ICD antibodies were smaller molecular weight proteins (Figure S13), which production is spared by the genetic alterations in both Fat1LacZ/LacZ and Fat1ΔTM/ΔTM mutants (Figure 7C,D, Figure S5, S11, S13 and data not shown). While some of these smaller isoforms might be cleavage products of full length FAT1 [50]–[52], additional short isoforms are also consistent with gene products resulting from transcript initiation at alternative downstream promoters, as proposed by genome browsers (Ensembl, UCSC; Figure S5A, with EST-based genes referenced in NCBIM37 mouse genome and in GRCh37 human genome assemblies). Neither the gene trap insertion after the first exon (this study), nor the removal of the entire first exon (in the published knockout allele [36]), suppress such gene products. Deletion of the transmembrane domain in Fat1ΔTM/ΔTM mutants also allowed expression of protein products with unchanged size (Figure S13), although it nevertheless led to a more severe phenotype with drastic neonatal lethality (compare Figure S3C and Figure 4C). Quantitative RT-PCR confirmed the presence of significant amounts of Fat1 RNA containing the last exons (26 to 28) in Fat1ΔTM/ΔTM mutants, albeit at reduced levels when compared to wild types (Figure S11). Thus, in the case of all mutant alleles, the remaining smaller isoforms might still carry out Fat1 functions at least partially, resulting in hypomorphic phenotypes with variable severity. Consistently, in immunohistochemistry experiments on muscle sections, residual FAT1 staining is also observed in myofibres of Fat1ΔTM/ΔTM mutants and Fat1LacZ/LacZ mice, and staining intensity in Fat1LacZ/LacZ mice that survived to adulthood inversely correlated with phenotype severity at the level of individual myofibers (Figure 7C,D and data not shown). Presence of unchanged smaller FAT1 isoforms in muscles of Fat1ΔTM/ΔTM mutants precludes using this mouse line to investigate their function. However, it indicates that the phenotype of muscle migration is not the consequence of their deletion, but results from ablation (constitutive or driven by Pax3-cre) of the transmembrane domain in full length FAT1 proteins that are abundant at developmental stages (Figure 2B).

Fat1-deficient mice present characteristics of FSHD
Strikingly, the topography of selective alterations in muscle shape that we observed during development in Fat1 mutant mice closely resembles the map of muscles affected in early phases of human FSHD. Muscle shape abnormalities such as those seen in facial subcutaneous muscles, in trapezius, or in rhomboid muscles are expected to result in lack of facial skin mobility and scapular winging, two symptoms that are frequently the first clinical manifestations of FSHD. The selective muscle weakness observed in presymptomatic Fat1 mutants in muscles belonging to the developmental map was also reminiscent of the early phase of FSHD. Even at the scale of EM observations, defects in myofibre structure, such as sarcolemma detachment (Figure 5D), included aspects similar to those reported in FSHD biopsies [53]. Finally, asymmetry of muscle symptoms is an important aspect of FSHD symptoms. Asymmetries in muscle shape abnormalities were observed not only in the robust phenotypes displayed by Fat1ΔTM/ΔTM embryos, but also in the very subtle phenotypes associated with by mild lowering of FAT1 expression in Fat1Fln/Fln embryos (Figure 6, Figure S12A). In this context, it was interesting to note that the human FAT1 gene is located at 4q35.2, 3.6 Mb proximal to the D4Z4 array whose contraction is associated with FSHD (Figure 8A). We therefore asked whether in addition to muscle phenotypes, Fat1-deficient mice may also share similarities with non muscular symptoms of FSHD. Besides muscular abnormalities, the phenotypic spectrum of FSHD patients also includes vision defects linked to vascular abnormalities [6], [54]–[55]. As previously reported, constitutive FAT1 loss-of-function causes abnormalities in eye development, with variable severity and penetrance [36]. The Fat1LacZ/LacZ mice surviving as adults carried milder phenotypes ranging from residual patterning defects (aniridia, small eye, Figure 8B) to perfectly shaped eyes and retina, in which analysis of vasculature with IB4 or PECAM staining revealed numerous areas with intraretinal telangiectasia, microvascular lesions, micro-aneurysms, and frequent retinal detachments (Figure 8C). Additional non-muscular symptoms associated with FSHD also include high frequency hearing loss, although the cause of these deficits remains underexplored. Fat1-deficiency was recently reported [56] to cause mild morphological defects in the inner ear, such as reduced cochlear elongation, and to exacerbate the appearance of ectopic sensory hair caused by loss of FAT4, another FAT-like protocadherin, reflecting their cooperation during in elongation and sensory hair cell patterning in the cochlea [26], [56]–[58]. Furthermore, owing to expression of the MLC3f-2E transgene during inner ear development [59], we observed shortening of the endolymphatic duct and endolymphatic sac in Fat1ΔTM/ΔTM embryos at E12.5 (7 affected sides out of 12), this shortening being frequently asymmetric (Figure 8D, E). These phenotypes are expected to influence audition. Thus, in addition to the similarity of muscle abnormalities, adult Fat1 mutant mice also show non-muscular defects reminiscent of clinical symptoms of FSHD. Nevertheless, the severity scale of these phenotypes includes phenotypes more dramatic than those seen in FSHD, and Fat1-deficiency also leads to phenotypes such as the previously reported kidney abnormalities, that have no equivalent in FSHD.

Deregulated FAT1 expression in human FSHD1 foetal muscles
Considering the gene location and the provocative similarities between Fat1-deficiency in mouse and FSHD, we therefore asked whether alterations in Fat1 expression might be an essential step in the molecular mechanism leading to FSHD pathology in human. As in spite of the essential role of Fat1 in kidney development, FSHD is not known to be associated with kidney abnormalities, if a mechanism linking FSHD to Fat1 exists, it is expected to involve partial functional alterations only, such as tissue-specific deregulation of FAT1 during development. We thus first asked whether in addition to the previously reported gene expression changes [9]–[11], [60], any deregulation of FAT1 expression levels could be detected in the classical context of FSHD1, in which the pathology is due to the presence of a contracted D4Z4 array on a permissive/pathogenic DUX4-activating context (4qA haplotype) [17]. This possibility was reinforced by the finding that FAT1 appears to be downregulated by DUX4-fl, but not by DUX4-short in human myoblasts [18]. This result was further validated by qPCR, after lentiviral infection of human myoblasts with DUX4-fl as compared with GFP control (Figure S15D), indicating that DUX4 overexpression is capable of lowering FAT1 expression in cultured muscle cells. As our results in mice point to the crucial role of FAT1 deregulation during development, we aimed to analyse FAT1 expression in rare cases of biopsies from foetuses with a prenatal diagnosis of FSHD1, in spite of the fact that stages of myoblast migration were not accessible to experimentation in this context. Nevertheless, the observation that FAT1 protein is a component of differentiated muscle fibres, enriched in the t-tubule system, is consistent with additional later functions of FAT1 necessary for muscle integrity.
Possible alterations of FAT1 expression were therefore assessed in muscle biopsies of human FSHD1 cases at foetal stages through a series of independent approaches. Human FAT1 protein was detected by immunohistochemistry in human muscle biopsies from control foetuses of various stages with antibodies against FAT1 C-terminal cytoplasmic tail, with a striped pattern similar to that seen in mice (Figure 9A, Figure S15). We thus first studied FAT1 expression levels in tissues from an FSHD1 human foetus carrying a pathogenic 4qA allele harbouring 1.5 D4Z4 copies, expected from previous family history to lead to severe infantile FSHD (Figure S14). Immunocytochemistry with anti-FAT1 antibodies on sections from the quadriceps muscle revealed an overall decrease in FAT1 protein levels compared to quadriceps biospies from control foetuses (Figure 9A), with an irregularly stripped pattern of FAT1 in myofibres that otherwise show a normal distribution of other muscle proteins, such as DHPR. To assess this FAT1 lowering quantitatively, mRNA expression levels were then followed by qRT-PCR in muscle biopsies from 4 FSHD human foetuses carrying pathogenic 4qA alleles harbouring 1.5, 4.3, and 7 D4Z4 copies (referred to as F1, to F4, respectively; Figure S14A). In F1 foetus, FAT1 levels were reduced 5-fold in the deltoid (a muscle belonging to the FSHD map) and 3-fold in the quadriceps muscles (a muscle traditionally affected only at late stages in the human disease; Figure 9B). This was also confirmed by Western Blot with anti-FAT1-ICD antibodies (Figure S15A). Additional regulatory changes were detected (Figure S15B), such as an increased level of MURF1 or dysferlin RNAs, while RNA of other muscle components, such as DHPR or γ-Sarcoglycan, were unchanged, ruling out secondary effects of loss of muscle integrity at this stage or quality of the biopsy. In contrast, no significant difference in FAT1 mRNA levels could be observed in brain when comparing FSHD and control samples from the same foetuses (Figure 9B). Reduction of FAT1 mRNA levels, albeit to a lesser extent (25% reduction; Figure 9B), and aberrant protein localisation (Figure S15C) were observed in the quadriceps of a second FSHD foetus harbouring 4.3 D4Z4 repeats (F2), from an independent family with previous FSHD history (Figure S14). Finally, no significant quantitative changes were observed in muscle biopsies of twin FSHD foetuses with 7 D4Z4 repeats (Figure 9B), although accumulation of FAT1 protein could be observed in some myofibre nuclei (data not shown), a localization never observed in age matched control biopsies, but reminiscent of adult mouse muscles. In contrast to foetal stages, analysis of FAT1 mRNA levels in a series of adult FSHD1 biopsies or FSHD-derived myoblasts did not reveal any significant change compared to control biopsies or myoblasts (data not shown), a result consistent with published data [10], [60], or with data available on GEO NCBI. Overall, these results indicate that 1) a reduction of FAT1 levels in differentiated muscles can be observed is some FSHD1 cases but is not common to all FSHD1 cases at the stages examined; 2) the observed changes in FAT1 expression levels in FSHD1 occur only during development.

We next asked whether the changes we observed were accompanied with alterations in chromatin state around regulatory sequences of the FAT1 locus. We thus performed chromatin immunoprecipitations (ChIP) on muscle biopsies derived from these same FSHD1 and control foetuses (Figure 9C), looking for potential changes in the levels of two widely studied chromatin marks: H3K4me3 (trimethylation of histone H3 on lysine 4), a mark of active promoters, and H3K27me3 (trimethylation of histone H3 on lysine 27), which marks transcriptionally silent chromatin [61]–[62]. Consistent with RT-PCR data, we observed a significant decrease in the level of H3K4me3 decorating the FAT1 promoter region in the two FSHDs foetuses with less than 5 repeats, but not in the foetuses with 7 repeats, as compared to 4 control muscle biopsies of similar age range (Figure 9C right). However, all 4 FSHD1 foetuses nevertheless showed a significant increase in H3K27me3 levels (Figure 9C left). These data are consistent with a switch in chromatin conformation towards the silenced state in the same FSHD1 samples in which RNA levels were reduced, a switch that has the potential to account for a large part of the observed decrease in FAT1 levels.
CGH-based identification of contraction-independent FSHD cases carrying deletions of an intronic regulatory element of FAT1
FAT1 deregulation is not the only gene expression change reported to be associated with the D4Z4 contraction causing FSHD1. As we also wished to determine to what extent the changes we found were relevant to the specific clinical phenotype, rather than a silent consequence of the D4Z4 contraction, we therefore extended our investigation to contraction-independent FSHD cases. Such patients have typical FSHD symptoms, but are not genetically associated to a pathogenic contraction of the D4Z4 array on chromosome 4. A large fraction of these contraction-independent FSHD cases is now known as FSHD2, in which hypomethylated D4Z4 repeats are combined with with a normal sized D4Z4 array on chromosome 4 permissive for DUX4 expression [22], [63]–[64]. Besides, other rare cases of contraction-independent FSHD cases remains unexplained, and represent interesting candidates to test whether alterations of the FAT1 locus might be directly associated with FSHD. To identify such alterations of the FAT1 locus, we performed an array-based comparative genomic hybridization screen (CHG [65]), a method used to uncover copy number variants. The custom-designed CGH array we employed covered the whole FAT1 genomic region, including non-coding sequences. In our CGH survey of 29 FSHD cases, including 10 FSHD1 cases and 19 contraction-independent cases (5 of which at least not showing D4Z4 hypomethylation, see Table S1 for clinical and genetic characterization of patients), we detected 5 cases exhibiting loss of portions of the intron 17 (between exons 17 and 18), or intron 16 of the FAT1 gene (Figure 10A,B, Figure S16). Besides the overlap with exon 17, we noticed that these deletions mapped near or within a hot spot of H3K4me1 methylation, a hallmark of cis-regulatory enhancers [61], spanning across intron 16 and part of intron 17 (Figure 10A, and Encode high throughput data, available on the UCSC browser [66]). According to the ENCODE ChIP seq data set [67], this element appears labeled as having strong enhancer activity in a human skeletal muscle myoblast line (HSMM) but not in 8 other non-muscle cell lines (Figure S16B). Examining the chromatin status at this locus by ChIP experiments, we consistently found that in control foetal muscle biopsies, intron 16 but also intron 17 were decorated by high levels of the enhancer signature H3K4me1 and negligible amounts of H3K4me3 (promoter signature) (Figure 10D, blue lanes, and data not shown), providing further in vivo support to the possibility that this sequence might indeed act as regulatory element in vivo.

To determine whether loss of functional portions of the putative enhancer were associated with FSHD, we analyzed copy number variants (CNVs) in a set of 40 healthy controls, 19 contraction-independent FSHD cases, and 10 FSHD1 cases. As the sensitivity of the CGH method might not allow detecting all cases with accurate precision, we applied a more precise qPCR method, and evaluated relative copy numbers by comparing 3 positions within and around the putative enhancer to a control spot on another chromosome (Figure 10A, C; 3 additional positions shown in Figure S16). Having set the threshold for considering a genome as carrying reduced copy numbers (loss) to 75% of the value in a healthy control used as reference genome, we found some healthy controls that exhibited reduced copy numbers of genomic regions at the core of the H3K4me1 hotspot in intron 16 (5% of controls) or in either surrounding exons (10% of control cases in both cases). This finding is consistent with a study, available through public datablases, that identified cases with loss of similar genomic segments at this locus in a group of 90 healthy individuals [68]. Thus, such deletions/copy number reductions are not sufficient on their own to cause FSHD symptoms, when occurring on only one allele of FAT1. However, in all three positions, the proportion of FSHD cases (all cases included) who exhibited loss was significantly higher than the proportion of healthy controls carrying reduced copy numbers at the same spot (Figure 10C,D; X2 test, p values<0.016; <0.00075; and <0.00041, for exon 17; enhancer; and exon 16, respectively). Cases with a deletion spanning the whole region were also significantly more frequent in the FSHD group than among controls. When considering only contraction-independent FSHD cases, as much as 47% carried the CNV including the putative enhancer, as compared to 5% of controls, and up to 68% carried a CNV encompassing at least one of the three considered positions, as opposed to 20% of the controls (Figure 10C,D, Fischer test, p<0.0004 and p<0.0001 for enhancer and exon 16, respectively). Conversely, when considering the distribution of cases with increased copy numbers (gain, above a threshold of 1.25× over the average control value) we found that there were significantly less FSHD cases with gain-CNVs than among the control group (X2 test, p<0.017 and p<0.014 when considering all FSHD cases or contraction-independenty cases only, respectively). Finally, we also analyzed the methylation status at D4Z4 repeats on chromosome 4 on a subset of our group of contraction-independent FSHD patients (5 out of 19), and found no indication of hypomethylation (at the CpoI site, Table S1) on the proximal D4Z4 unit [64]. This does not exclude that others patients in our c.i-FSHD group would be diagnosed as FSHD2, but indicates that FSHD can occur in non-contracted patients independently of the hypomethylation, known FSHD2 hallmark [22], [64]. Together, these results indicate that partial or complete deletions of FAT1 intron 16/17 putative enhancer represent a polymorphism not sufficient to cause FSHD by itself when present on one allele only of chromosome 4, but which segregates with FSHD. Therefore, this CNV can be combined with pathogenic or sub-pathogenic contexts, and may act as a novel disease modifier in FSHD.
Discussion
FAT-like cadherins play various roles in tissue morphogenesis, by modulating cell polarity, adhesion and tissue growth. Here we show that during development, FAT1 controls the shape of subsets of muscles in the facial and scapulohumeral regions, and does so by modulating the polarity of collective myoblast migration, a function in accordance with the emerging link between planar cell polarity and collective directional migration events [29]–[30], [69]. These muscle shape abnormalities are predictive of early onset muscle wasting, as observed in Fat1-deficient mice that bypassed neonatal lethality. Using Pax3-cre for conditional ablation of Fat1 functions in premigratory myoblasts, we show that a cell autonomous requirement for Fat1 function in the migrating myoblasts accounts for a significant component of this role in shaping muscles. Taken together, the location of the human FAT1 gene next to the critical FSHD locus at 4q35, the similarity between the Fat1-dependent muscles and those affected in FSHD, and the appearance in Fat1 mutants of non-muscle features of FSHD, suggest a possible role of FAT1 in the pathophysiology of this disease. In our human studies, we found two ways by which altered FAT1 regulation underlies a link with FSHD: 1 - we observed muscle-specific lowering in foetal FSHD1 biopsies; 2 - we identified a polymorphism deleting a putative cis-regulatory enhancer in the FAT1 locus, which significantly segregated with FSHD. Together, these results strongly support the idea that tissue-specific de-regulation of FAT1 expression/function might play a critical role in FSHD pathophysiology.
Fat1 is required in migrating myoblasts to shape selective muscles in the face and shoulder
The altered myoblast migration polarity caused by loss of Fat1 functions leads to selective developmental dysgenesis of scapulo-humeral and subsets of subcutaneous muscles of the face. Understanding how Fat1 controls muscle shape required first determining which part of its expression domain accounts for this function. In addition to the muscles, Fat1 is expressed in several of the cell types that interact with migrating muscle cells. The highest expression was seen in non-muscle cells, such as the subcutaneous layer towards which CM myoblasts migrate (Figure 1). This muscle-skin interface is analogous to the bone-muscle interfaces (tendons, joints) of skeletal muscles, where Fat1 also accumulates at later stages (Figure 7A). Here, however, we show that ablating the floxed transmembrane domain of FAT1 with a Pax3-cre knock-in line leads to efficient excision in premigratory muscles of the limb but not the face, and reproduces at least partially the migration phenotype observed in constitutive Fat1 knockouts in the scapulohumeral region. Pax3-cre excision does not occur in motor neurons, hence ablation in this cell type does not contribute to the phenotype observed in Fat1Fln/Fln;Pax3 cre/+ embryos. No significant muscle shape defects were caused by Pax3-cre -mediated Fat1 ablation in subcutaneous muscles of the face. This is not surprising, as muscles in the face do not derive from Pax3-expressing precursors but were previously shown to derive from a subset of islet1-expressing pharyngeal mesoderm cells [46], [70]. In addition to trunk migrating myoblasts, Pax3-cre-mediated excision occurs in dorsal neural tube and neural crest. Although Fat1 expression is detected in Schwann cells (neural crest-derived) along the nerves at P0, we did not detect such an expression at the stage of muscle migration (E12.5, see Figure S11C), making it unlikely to for Fat1 to control migration polarity by acting in neural crest derivatives. Furthermore, as Pax3-cre-derived neural crest amply colonizes the developing face, the lack of enhanced muscle phenotype in the face of Fat1Fln/Fln;Pax3 cre/+ embryos disqualifies the neural crest component of Fat1 expression from playing a major contribution in muscle shaping, and strongly suggests that Fat1 is required cell-autonomously in migrating myoblasts to control the polarity of their migration. As however, the muscle phenotype of Fat1Fln/Fln;Pax3 cre/+ embryos is significantly weaker than the phenotype of constitutive mutants, it leaves the possibility that other component of Fat1 expression domain may also contribute to its function in muscle patterning.
The rationale for why such a selective group of muscles is affected by Fat1 loss of function is still unclear. This group of muscle includes subsets of migratory muscles of the face and shoulder area. In the face, defects are restricted to branchiomeric muscles derived from the second brachial arch (subcutaneous muscles of the skin, Figure 3), while first branchial arch derived muscles (masseters and temporalis), as well as extraocular muscles, are unaffected (Figure 5 and data not shown) [70]–[72]. The scapulohumeral region can be divided in two components: 1) the CM, as well as humeral muscles (triceps, deltoid, or muscles which pattern is affected by the supernumerary muscle) derive from somitic Pax3-driven hypaxial migratory precursors (Figure S10); 2) In contrast, some of the shoulder muscles such as the acromiotrapezius and spinotrapezius, or the rhomboids, belong to the cucullaris group and were previously shown to derive from non-somitic, occipital lateral plate mesoderm [46], [72]–[73]. Such specificity is in apparent contrast with the broader expression domain of Fat1 in muscles as observed at E12.5 and later (Figure 1, 7, and S1), although clear differences in expression levels between muscles can be distinguished (Figure 7A). Given that distinct regulatory programs govern the development of these muscle groups [2], [74], the selective impact of Fat1 on muscle shapes could be determined by its interaction with some of the selective myogenic regulators.
Does altered muscle shape predispose to muscle wasting?
Advanced symptomatic stages in Fat1-deficient mice are likely systemic consequences of such non-muscle phenotypes. Nevertheless, the muscle wasting and dystrophic features measured at presymptomatic stages were detectable selectively in those muscles that exhibited myofiber orientation defects, even in cases with no other detectable phenotypes. Despite the important variability in postnatal phenotype strengths observed with the Fat1LacZ allele, myofibre orientation defects and dystrophic features in the CM and shoulder muscles (Rhomboids, Trapeze) were observed in all mutant cases examined, not only of embryos, but also at adult stages, even in cases of Fat1LacZ/LacZ mice surviving to old ages with no other detectable phenotype. This specificity argues against the idea that restricted topography of muscle defects would be a consequence of renal problems or of other non-muscular defects. Furthermore, the observed match between the topography of the developmental phenotype and the specific map of muscles that undergo wasting at presymptomatic stages in adult Fat1LacZ/LacZ mice supports the idea that the selective muscle degeneration might occur as a consequence of the altered muscle shape. Future experiments will be necessary to determine whether the limited defects observed in Pax3-cre/Fat1 embryos are sufficient to predispose muscles to early onset degeneration, and whether additional triggers might be required for degeneration to occur in adult life. Among phenotypes observed in adult Fat1-deficient muscles, it will also be interesting to distinguish secondary consequence of the altered muscle shapes, from phenotypes reflecting additional, independent functions of Fat1, whether exerted in muscles too or in other cell types.
Tissue-specific de-regulation of FAT1 as a potential mechanism in FSHD pathogenesis
The spatial distribution of muscles mis-shaped as a result of Fat1 loss of function as seen at E14.5/E15.5 (Figure 3) appears to overlap very closely with, and thus to predict, the map of muscles affected at early stages in FSHD. Furthermore, the observation of non-muscle phenotypes such as defects in retinal vascularisation or inner ear patterning also bears some similarities with symptoms observed in FSHD patients. Despite this strong concordance between the phenotype of Fat1-deficient mice and FSHD symptoms, the selectivity of the shared phenotypes raises a paradox. Fat1 expression during development is not restricted to FSHD-relevant tissues, and constitutive deletion of Fat1 leads to pronounced renal defects and neonatal lethality. Even the Fat1 hypomorphic phenotypes presented above cannot be considered as an exact phenocopy of FSHD. Overall this mouse model is also more severe than FSHD, and 50% of the mice die within 3 months, likely of milder versions of the kidney phenotype (such as polycystic kidney). In contrast, FSHD is not known as a lethal disease, and has no reported association with kidney problems. Absence of renal dysfunction in FSHD is a strong indication that FSHD cannot simply be considered a “FAT1 knockout”. Thus, cases of patients with severe FAT1 loss of functions and kidney failure might be fatal before onset of muscle dystrophy and might thus fail to be classified as FSHD. In support of this hypothesis, a rare case of a 5-year-old girl carrying a duplication of the D4Z4 array and showing vascular retinopathy and sensorineural deafness was also reported to have focal glomerulosclerosis of the kidney [75]. Instead, lack of association between FSHD and renal dysfunction indicates that any FSHD mechanism involving FAT1 alterations must necessarily preserve FAT1 expression/function in kidney (at least). Our results with mice suggest that such selective alterations of FAT1 function/expression may matter during development, in muscle precursors, at a stage when their migration occurs, for which FSHD human material was not available so far - and can ethically not be sought. FAT1 levels may not be changed to an equal extent in all tissues and times, consistent with our observation that FAT1 levels were reduced in disease-relevant muscles but not in brain, and at foetal but not adult stages. Thus, an engineered mouse model in which Fat1 functions are specifically ablated in muscles and preserved in the renal system, even though lacking effects of other DUX4 target genes, may represent a more suitable tool to study consequences of the muscle abnormalities in adult, and a better model reflecting the tissue-specific FAT1 depletion that we propose might be occurring in FSHD.
Loss of a putative FAT1 enhancer as a novel disease modifier in FSHD
The finding that human cases of contraction-independent FSHD, with such a characteristic and restricted set of clinical symptoms, segregate with the deletion of a putative regulatory genomic element in the FAT1 locus instead of the traditional D4Z4 contraction, strongly supports the idea that altered FAT1 regulation plays a key role in the pathology. The putative cis-regulatory enhancer reported in this study, which deletion segregates with FSHD in contraction-independent cases is likely to carry tissue-specificity information driving FAT1 expression in FSHD-relevant cell types, and future experiments are required to demonstrate such activity. The finding that healthy controls can exhibit heterozygous loss of this fragment of the FAT1 locus, containing two exons and an enhancer, is consistent with the observation that heterozygous loss of Fat1 functions in mice does not have major consequence of life span, health, and muscle integrity. However, we did observe a significant degree of haploinsufficiency in Fat1ΔTM/+ embryos, evidenced by the presence of subtle muscle shape defects (Figure 6B,C, see indicated p values), the most frequent position being between the acromyotrapezius and spinotrapezius muscles (as in Figure 3B). Such phenotypes were also consistently detected in Fat1Fln/Fln embryos (Figure 6 and Figure S10D), in which expression levels were similar to those measured in Fat1ΔTM/+ embryos (Figure S10B, C), suggesting that muscles in the shoulder area are highly sensitive to Fat1 dosage. While copy number variants outside of the putative enhancer might occur without causing any regulation change, we reasoned that the further such deletions would extend into the ENCODE predicted enhancer, the more functional transcription factor binding sites they may remove, hence increasingly interfering with FAT1 regulation on the deleted allele, thereby sensitizing the locus to additional contexts that may additionally impact on FAT1 expression.
Interestingly, two of the FSHD1 cases presented here were monozygotic twins, both carrying a contracted 4q35 allele with 3 D4Z4 units, one of the twins being asymptomatic while the other twin had been diagnosed with a classical FSHD. We found that the twin with FSHD symptoms displayed reduced copy numbers throughout the length of the studied area, encompassing both exons 16 and 17 and the intron 16 putative enhancer, while the asymptomatic twin exhibited reduced copy numbers only at the distal-most region towards exon 16, this difference possibly representing a de novo somatic mutation (Figure 10 and Table S1). Although this correlation does not constitute a demonstration of causality, it provides support to the hypothesis that this lowered copy numbers (heterozygous) of FAT1 exons 17/16 and of portions of the putative FAT1 enhancer portions have the potential to worsen FSHD symptoms when combined to a pathogenic context. However, obtaining a formal demonstration of this hypothesis will require studying phenotypes/genotype correlations on a large cohort of patients, and knowing in each case if the FSHD-causing genetic context is FSHD1, FSHD2, or other un-identified contraction-independent contexts. Overall, deregulation of the FAT1 gene is associated with FSHD, either as a consequence of DUX4 overexpression, and/or epigenetically encoded in FSHD1 and FSHD2, or through the deletion of a putative enhancer that segregates with contraction-independent FSHD patients.
An additional function for FAT1 in muscle differentiation and/or physiology?
Among possible products of the Fat1-gene, our results in mice indicate that the control of migration polarity and muscle shape requires a Fat1 RNA containing a transmembrane domain encoded by the floxed exons and deleted in the Fat1ΔTM allele. In contrast, other functions can be executed by incomplete Fat1 isoforms. Residual RNAs containing 3′ Fat1 exons can rescue (to an extent correlating with RNA levels) kidney defects and their consequences, but not muscle dysgenesis. Interestingly, however, both mouse models retain the capacity to produce FAT1 protein isoforms containing an intracellular domain, albeit at reduced levels quantified by qPCRs (Figure S10B,C), ruling out a major contribution of these isoforms to the muscle shape phenotypes observed in both mouse models. In muscle fibres, FAT1 is a novel component of t-tubules. Does Fat1 expression in differentiating and mature muscle reflect additional functions in muscle biology? The presence of FAT1 protein in close association with the contractile apparatus, as soon as differentiation starts, may reflect a role in sarcomere assembly. These FAT1-enriched stripes are maintained in mature muscle fibres, tightly juxtaposed with the t-tubule system (Figure 7B). This may indicate a further involvement in excitation-contraction coupling, an essential process required throughout adult life for muscle function and maintenance. However, this striped pattern is established as early as the contractile apparatus assembles (Figure 7C), before the alignment and docking of T-tubules to the contractile apparatus takes place, the latter phenomenon occuring postnatally in mice [76]. This indicates that in muscle, FAT1 isoforms are not inserted in the t-tubule compartment itself, but may be located at an interface juxtaposing t-tubules and the contractile units, possibly reflecting a new function for Fat1 for example during assembly of the t-tubule network. As myoblast migration precedes differentiation and sarcomere assembly, the accumulation of these FAT1 protein isoforms in the contractile apparatus occurs too late to be accountable of the function in migration polarity.
FAT-like proteins were previously reported to be subject to various cleavage events by Furin convertase or by α - or γ-secretases [50]–[52]. Furthermore, alternative splicing events in the cytoplasmic exons were reported to influence subcellular targeting of FAT1 proteins [48]. Our work in mice unexpectedly indicated that in addition to producing a large transmembrane protein and its cleavage products, the Fat1 gene also produces small molecular weight protein products which appear not to contain a transmembrane domain, and synthesis of which is largely preserved in both Fat1-deficient mouse models, although at reduced levels. Bioinformatic scans and existing ESTs reported on all genomic browsers are indeed consistent with the possibility that short isoforms may result from transcript initiation at alternative downstream promoters, and may code for protein products devoid of leader peptide and transmembrane domain and potentially produced in the cytosol (lacking a leader sequence). Thus, understanding the roles played by the isoforms of FAT1 produced in muscles will require first characterizing the exact exon and domain composition of the Fat1 RNA and protein isoforms produced in muscle (wild type and Fat1ΔTM/ΔTM), and second designing novel strategies to ablate them independently of the transmembrane domain containing isoforms.
Interestingly, residual expression of such muscle-specific isoforms is genetic background dependent and its levels in Fat1LacZ/LacZ mice inversely correlated with phenotype severity. Furthermore, reduced expression levels and abnormal sub-cellular localization were observed in muscle of human foetal cases with expected severe and early onset FSHD1 (as predicted by the degree of D4Z4 contraction and family history), while no significant changes in RNA levels were detected in adult FSHD1 muscles compared to controls. These observations are consistent with the idea that deregulated FAT1 expression in differentiated muscle may be predictive of early (infantile) onset and severe dystrophy. These data suggest that the causes of the early phase, common to all FSHD patients and restricted to muscles of the face and shoulder, might be uncoupled from the causes of later phases of the disease - which spreads to other muscles, a condition that occurs in a subset of FSHD patients with childhood onset, the latter ending up wheel-chair bound [6].
Link with the known mechanisms in FSHD1
Recent studies have brought to light several possible molecular pathways by which the D4Z4 contraction on a 4qA allele may exert its pathological effect in FSHD1. Among those, stabilization of DUX4-fl mRNAs by polyA-creating polymorphisms was shown to enable expression of a toxic form of DUX4, the latter causing muscle dystrophy through altered regulation of numerous target genes, including Pitx1, p53, and other germline-specific genes or myogenic regulators [17]–[21], [23]–[24]. Another mechanism involves production by the contracted region of DBE-T, a chromatin-associated long-non-coding RNA that causes de-repression of several 4q35 genes [77], including FRG1, whose overexpression was previously proposed to contribute to causing muscle degeneration too [11]–[12]. Other mechanisms also influencing 4q35 gene expression include a telomeric position effect, according to which propagation across 4q35 of changes in methylation or chromatin conformation might be due to the loss of the CTCF barrier function of the D4Z4 array [8], [13], [78]. The relative contribution of DUX4-mediated gene regulation and of mechanisms leading to altered 4q35 gene expression is controversial [9], [17] and may reflect an underestimated diversity in the clinical expression of FSHD1 [79]–[80]. Understanding which of these mechanisms, or what combination, contributes to modifying tissue-specific distribution of FAT1 will require developing cellular or animal models adequately reproducing FSHD mechanisms and mimicking in vitro key steps of muscle shape development. This will also allow defining whether there are differences in the sensitivity to a contracted allele between developmental stages and adult muscle, but also between FAT1 isoforms. DUX4 can repress FAT1 expression in human myoblasts ([18] and Figure S15D). Such regulatory influence could involve some DUX4 target genes such as p53 [37]–[38], or myogenic transcription factors. Our data suggest that irrespective of whether FAT1 is regulated by DUX4, by DBE-T, or by anyone of their respective downstream or upstream targets, this regulation must occur primarily during development, in the cell type in which FAT1 is required to control migration polarity. This model does not exclude the possibility that the pathogenic 4q35 allele may further contribute to directly triggering muscular dystrophy in adult muscle, through additional mechanisms independent of FAT1 de-regulation.
Can deregulated FAT1 in FSHD lead to altered PCP/Frizzled signaling?
A number of clinical features of FSHD, including non-muscular symptoms such as hearing loss and retinal vasculopathy [81]–[82], carry the signature of defects in the Wnt/PCP pathway [26], a cascade of tissue polarity regulating genes, involving non-canonical Wnt/Frizzled signalling (core PCP genes) and modulated by the protocadherins FAT and Dachsous [25], [27]. Sensory hair cell polarity in the cochlea is the best mammalian PCP paradigm, and deafness has become a traditional hallmark of altered PCP signalling [26], [57]–[58]. Even through the anatomical nature of auditory abnormalities in FSHD is not known, it will be relevant to explore whether it carries further characteristics in common with altered PCP. Furthermore, vascular abnormalities in the retina, also known as Coats disease, are phenotypically similar to familial exudative vitroretinopathy (FEVR), recently linked to mutations in the Wnt receptor Frizzled4 (FZD4) and its ligand Norrin [83]–[85]. Moreover, the Wnt/PCP pathway is also known to play key roles in muscle biology. PCP-activating Wnts, such as Wnt11 or Wnt7a act as instructive signals for myofibre orientation during muscle morphogenesis [86], for muscle satellite cell expansion through symmetric division [87], and for neuromuscular synapse development [88]. Thus, altered regulation of FAT1 may in turn de-regulate the function or expression of its genetic partners, such as other components of the planar cell polarity cascade but also of the Hippo pathway. Mutations in other components of these genetic cascades may also play a causal role in a subset of the FSHD patients lacking the D4Z4 contraction. Overall, by linking FSHD to FAT1, our work opens new avenues for the exploration and treatment of this and other neuromuscular disorders.
Methods
Ethics statement
Animals were maintained and sacrificed in accordance with institutional guidelines. Adult mice were either sacrificed for experiments through anaesthesia, or euthanized by cervical dislocation. Efforts were made to minimize the number of adult Fat1-deficient mutant mice examined after more than 25% weight loss.
Human DNAs were obtained from FSHD and control cases at La Timone Hospital (Marseille, France). The protocol for their collection was approved by the Université de la Méditerranée (Marseille, France) Committee on Human Research and an agreement of informed consent authorizing scientific experiments was signed by each individual patients. Human Tissues samples were obtained from abortus cases at La Timone Hospital (Marseille, France) and at AP-HP (Assistance Publique-Hopitaux de Paris, France). The protocol for their collection was approved by the Université de la Méditerranée (Marseille, France) Committee on Human Research and an agreement authorizing scientific experiments was signed by the parents. Termination of pregnancy (performed at the stages corresponding to individual cases) was decided after late prenatal diagnosis.
Mouse lines
Characterization and genotyping of the Fat1LacZ allele
Fat-LacZ mice, previously generated using the genetrap ES line KST249 (see detailed characterization below), were obtained from Marc Tessier-Lavigne. Initial characterization of the transgene insertion site on Fat1 transcript was performed by 5′RACE PCR (as documented on the international genetrap consortium databases (http://www.genetrap.org/cgi-bin/annotation.py?cellline=KST249) indicated insertion downstream of the first exon. Genome walking experiments (LAM-PCR, GATC Biotech; plasmid rescue, restriction analysis by Southern blot) consistently indicated that multiple copies of the transgene were inserted in tandem, thus preventing so far identification of genomic sequences flanking the transgene. Genotyping was performed on genomic DNA using the following PCR to detect the transgene (primer sets OF47 : 5′ GGA ACT TCT CAG ATC TGC GGG CTGC 3′; and OF48 : 5′-TCT CAT CTT GGG TGA GGT GGG TCCC-3′; or OF49 : 5′-GGA ACT TCT GGA TCT GCG ATC TGCG-3′ and OF57 : 5′ CCC CAA ACA CTG CCA ACT ATG-3′). To recognise heterozygotes (one mutant allele) from homozygotes (two mutant alleles) at postnatal and adult stages, we performed dot blot hybridization experiments (using a beta-geo probe made with OF47-OF48 PCR product, dig-labelled by random priming) and discriminated difference in staining intensity, or qPCR analysis, using OF47 and OF48 primers for the transgene, and the following primers as reference (met primers wt: FM20 : 5′ AAG CTT CTG GTT CTG ATG CTC TGT CAG -3′; Met-610 : 5′ - AGG ATT GAT CAT TGG TGC GGT C – 3′). At embryonic stages, we also performed X-gal staining on yolk sacs (or any dissected fragment of embryo), the intensity of staining being a reliable indicator of the genotype until E16.5.
To follow progression through adult phenotype, each mouse's weight was measured weekly, and the weight at a given stage is compared to it maximal measured weight. Mice with less than 10% weight loss are considered presymptomatic (with respect to systemic consequences of phenotypes such as kidney filtration defects).
Transgenic mouse lines
Gdnf-lacZ mice were used with permission of Genentech, and genotyped as previously described [40]. Mlc3f-2E transgenic mice were kindly provided by Robert Kelly, and genotyped as previously described [43]. Pax3-cre knock-in (Pax3tm1(cre)Joe line [89]) mice were used with permission of Jonathan Epstein and genotyped with the following generic CRE-specific primers: MSP4 : 5′-ATC CGA AAA GAA AAC GTT GA-3′; MSP5 5′-ATC CAG GTT ACG GAT ATAG T-3′. Rosa26-YFP mice (Gt(ROSA)26Sortm1(EYFP)Cos line, [90]) were kindly provided by Teddy Fauquier and obtained from the Jackson laboratory (mouse strain 006148), and were genotyped following Jaxmice instructions.
Generation of Fat1 conditional and constitutive mutants
Mice carrying a conditional Fat1ΔTM allele were constructed in the research facility of iTL (ingenious Targeting laboratories, genetargeting.com). Construction of mice with the conditional Fat1ΔTM allele began by isolation of the 129 SvEv BAC clone RP22 : 41E14, containing the murine sequence of the Fat1 locus, including the exons 24 and 25, which we aimed to flox, exon 25 containing the transmembrane domain. An 11 kb region used to construct the targeting vector was first subcloned from the BAC using a homologous recombination-based technique. The region was designed such that the short homology arm (SA) extends about 2.3 kb to the 5′-end of the LoxP/FRT-flanked Neo cassette. The long homology arm (LA) extends 6.22 kb to the 3′-end of the single Lox P site. The single Lox P site is inserted upstream of exon 24 in intron 23–24, and the LoxP/FRT-flanked Neo cassette is inserted downstream of exon 25 in intron 25–26. The target region is ∼2.6 kb containing exons 24–25. The BAC was sub cloned into a ∼2.4 kb pSP72 (Promega) backbone vector containing an ampicillin selection cassette for retransformation of the construct prior to electroporation. A pGK-gb2 LoxP/FRT-flanked Neomycin cassette was inserted into the gene as described in Figure S4. The targeting construct can be linearized using NotI prior to electroporation into ES cells. Ten micrograms of the targeting vector was linearized by NotI, and transfected by electroporation of iTL1 129/SvEv embryonic stem cells. After selection with G418 antibiotic, surviving clones were expanded for PCR analysis to identify recombinant ES clones. Screening primers A1 and A2 were designed downstream of the short homology arm (SA) outside the 3′ region used to generate the targeting construct. PCR reactions using A1 or A2 with the F3 primer (located within the Neo cassette) amplify 2.42 or 2.51 kb fragments, respectively. The control PCR reaction was performed using the internal targeting vector primers AT1 and AT2, which are located at the 3′ and 5′ ends, respectively, of the SA. This amplifies a product 2.05 kb in size. Primers for PCR Screening : A1 : 5′ - AAG CTT CCT GCT GTC ACT AAG G -3′; A2 : 5′ - ACG TGC ATG TTA ACT GGG TAC AC-3′; AT1 : 5′ - AGG TTC TGA ACA GGG AAT GAA ACG – 3′; AT2 : 5′ - TCT GTT GAG CAT ATG TGC AGA TC – 3′; OUT1 : 5′ - GGC TGC TAC GTC TCA GGG C – 3′; F3 : 5′ - GCA TAA GCT TGG ATC CGT TCT TCG GAC – 3′. Individual clones from positive pooled samples were screened using A1 and F3 primers. Positive recombinant clones were identified by a 2.42 kb PCR fragment. A PCR was performed on SA positive clones to detect presence of the third LoxP site using the LOX1 and SDL2 primers. This reaction amplifies a wild type product 390 bp in size, and a product from the targeted locus of 452 bp in size. 3 clones were reconfirmed for SA integration and third LoxP site retention using the same methods as described above. All reconfirmed clones were sequenced to verify SA integration and retention of the third LoxP site. Secondary confirmation of positive clones identified by PCR was performed by Southern Blotting analysis. DNA was digested with NcoI, and electrophoretically separated on a 0.8% agarose gel. After transfer to a nylon membrane, the digested DNA was hybridized with a probe targeted against the 3′ external region. PB1/2 Probe Primers: PB1 5′-TCA GCT CAC CCA GCT AAT GC – 3′; PB2 5′-TCA ACG ACA GCG TTG ACA AGG – 3′. Positive clones identified by PCR were further confirmed by Southern Blotting analysis with an internal probe. DNA was digested with NcoI, and electrophoretically separated on a 0.8% agarose gel. After transfer to a nylon membrane, the digested DNA was hybridized with a probe targeted against the 3′ internal region. Two clones were confirmed as correctly targeted and used for injection in blastocysts. Targeted iTL1 (129/SvEv) embryonic stem cells were microinjected into C57BL/6 blastocysts. Resulting chimeras with a high percentage agouti coat color were mated to wild-type C57BL/6 mice to generate F1 heterozygous offspring. Tail DNA was analyzed as described in Figure S4A from pups with agouti coat color. Heterozygous F1 offspring carrying the targeted allele were further reconfirmed using the PCR conditions used for ES screening (A1 and F3 primers). Germline transmission of the targeted allele was obtained for one recombined ES clone.
Mice carrying the targeted locus (refered to as Fat1Fln allele, as it contains the floxed exon and the neo cassette) were amplified, and kept as either heterozygotes or homozygotes, as Fat1Fln/Fln males and females are viable and largely fertile. Mice carrying the Fat1Fln allele were crossed with mice carrying the ubiquitous cre (Deleter-cre line, official name Tg(CMV-cre)1Cgn [91]) to produce offspring with a recombined allele (Refered to as Fat1ΔTM). After elimination of the Deleter-cre transgene, a line with the recombined allele was maintained separately from the line carrying the original Fat1Fln allele. Fat1ΔTM/+ (also carrying the MLC3F-2E transgene) were bred to produce Fat1ΔTM/ΔTM embryos or mice. Genotyping primers (numbered according to Figure S3): Primer 1 (OF165) : 5′ - GTA GGG ACG TTC TGT GAG GTG AGC G – 3′ ; primer 2 (OF166): 5′ – CTG TGG AAA GGG CGC AGC AGA AAC G - 3′; primer 3 (ON17) : 5′ - AAC TCG CCC TCA GAC AGC GAC TCC - 3′; Primer 4 (ON16); 5′ – GGG ATC CAG ATC TAC CAC TTT AGC TG – 3′; Primer 5 (Uni): 5′ - AGC GCA TCG CCT TCT ATC GCC TTC; Primer 6 (LAN1): 5′ – CCA GAG GCC ACT TGT GTA GC – 3′.; Primer 7 (ON30) : 5′ – GTC CGA AGA ACG GAT CCA AGC TTA TGC – 3′. A combination of primers OF165 and OF166 amplifies a band of 458 bp on the wild-type DNA, a band of 520 bp corresponding to the Fat1Fln allele, and no product from the Fat1ΔTM allele. The Fat1ΔTM allele is recognised by a 305 bp product obtained with a combination of OF165 and ON30 primers. The neo cassette can be removed using FRT/Flp recombination (performed with ActFlpe mice, official name Tg(ACTFLPe)9205Dym [92]), generating a new conditional allele referred to as Fat1Flox. The Fat1Fln and Fat1Flox alleles can be recognised from each other using specific PCR products (For Fat1Fln, the combination of ON17 and Uni primer yields a 406 bp product; for Fat1Flox, the combination of ON17 and ON30 yields a 345 bp PCR product). In the current study, all the conditional experiments were done using the Fat1Fln allele. To perform the conditional ablation, of Fat1 in Pax3-cre-derived tissues, we mated Fat1Fln/Fln mice with Pax3cre/+ mice. Because of our observation of female germline activity of the Pax3-cre line, we exclusively selected Fat1Fln/+; Pax3cre/+ males to perform crosses with Fat1Fln/+ or Fat1Fln/Fln females (also carrying the MLC3F-2E transgene) to produce conditional embryos.
Human tissue collection
Human Tissues samples were obtained from abortus cases (see ethics statement) after termination of pregnancy, decided after late prenatal diagnosis (of FSHD1 or of non muscular medical symptoms for control cases). The cases used, and their respective stages are described in Figure S8A. Four cases of foetuses diagnosed with FSHD were used (Figure S8A) referred to as F1, F2, F3 and F4, respectively. Family history included in the F1 case early-onset and severe FSHD phenotypes in a sibship carrying the same haplotype (family tree shown in Figure S8D). In the she second (F2) and third (F3 and F4, twin foetuses) cases one parent had FSHD. FSHD diagnosis was characterized by standard procedures involving southern blotting using a combination of restriction enzymes and probes, to characterize contraction status, 10 versus 4 chromosome, and haplotype. The p13E-11 probe was used on genomic DNA digested with EcoRI alone or with EcoRI and BlnI, hence determining D4Z4 array length and distinguishing and 4q contractions from 10q contractions [93]. Molecular combing is then performed with a combination of probes (including those for D4Z4, the p13E-11, qA and qB-specific probes, and 10q versus 4q specific) allowing to distinguish simultaneously 10q from 4q as well as qA from qB haplotypes and the degree of contraction [94] (see also simplified probe set in Figure S14B–E). Control biopsies (Figure S14A) were also obtained from abortus cases, for which termination of pregnancy was performed on the basis of medical diagnosis different from FSHD or other muscle related diseases. Detailed information on clinical and genetic diagnostic for the patients used for CGH and qPCR studies is provided in the Table S1.
X-gal staining, immunohistochemistry, antibodies
X-gal staining was performed using classical procedures on embryos or postnatal tissues previously fixed in paraformaldehyde (PFA) 4% (time depending on strength of lacZ expression), rinsed in PBS, and incubated in X-gal in combination with potassium ferri - and ferro-cyanide (FeCN). Staining was terminated by rinsing in PBS, and post-fixing in PFA4%. Embryos were transferred in 100% glycerol for imaging and counting dispersed myoblasts.
For adult murine tissues, anaesthetized mice were perfused with PFA 4% in phosphate buffer saline (PBS) prior to dissection. Shoulder belt muscles were carefully dissected under a stereomicroscope, rinsed in PBS, shortly incubated with fluorescent alpha-Bungarotoxin to visualise neuromuscular junctions. When necessary, observation under fluorescence was used to visualise and sub-dissect zones enriched in neuromuscular junctions. Samples were cryoprotected in 25% sucrose (in PBS), embedded in a mix with 7.5% gelatine and 15% sucrose in PBS, and frozen for cryostat sections.
Immunofluorescence was performed using primary antibodies to neurofilament (NF-M, Ab1789, Chemicon), tau (AbCAM), laminin (Sigma), alpha-actinin (Clone EA-53, Sigma), Ryanodine Receptor RyR1 (MA3-925, Thermo scientific), Dyhydropyridine Receptor alpha 1S (MA3-920, Thermo scientific), rabbit anti-GFP (invitrogen). Antibodies against FAT1 were the following: two rabbit polyclonal antibodies raised against human FAT1, HPA001869, HPA023882 from SIGMA (epitopes described in the human protein Atlas (http://www.proteinatlas.org) recognised two regions of the extracellular domain of FAT1 indicated FAT1-1869 and FAT1-23882, respectively, in Figure 2A, B. Two antibodies against the intracellular domain of mouse FAT1 were used: Fat1-ICD from ref [35], and an additional anti-Fat1 rabbit antisera (Rb1465) we raised against a GST-fusion protein encompassing the intracellular domain of mouse FAT1 (see complete procedure below). Secondary antibodies used were Cy3 - or Cy5-conjugated (Jackson Immunoresearch) or conjugated with Alexa-488 or Alexa-555 (Invitrogen). NMJs were visualised with Alexa-488 conjugated alpha-Bungarotoxin (1/2000), and F-actin with alexa-594 or Alexa-647 conjugated-Phalloidin (Invitrogen). Retinal vasculature was visualised with Alexa-488-conjugated GS-IB4 (Invitrogen), as described [83], including CaCl2 1 mM and MgCl2 1 mM in all incubating solutions. Image acquisition was performed with a Zeiss Axioplan equipped with Apotome.
Ultrastructure studies
For electron microscopy analysis, muscles were dissected from mice previously perfused in 4% PFA, and post-fixed in 2% PFA, 2.5% glutaraldehyde, 50 mM CaCl2 in 0.1 M cacodylate buffer (pH 7.4). Muscles were additionally postfixed with 1% OsO4, 0.1M cacodylate buffer (pH 7.4) for 2 h at 4°C and dehydrated in a graded series of ethanol, with a 2h incubation step with 2% uranyl acetate in 70% Ethanol at 4°C. Samples were further dehydrated and embedded in epon resin. Thin (70-nm) sections were stained with uranyl acetate and lead citrate and examined by transmission electron microscope (Zeiss EM 912). Images were acquired with a digital camera Gatan Bioscan 792, using the Digital Micrograph software.
In situ hybridizations and measurement of myoblast orientation
Embryos were collected in PBS and fixed in 4% PFA. In situ hybridizations were performed with a MyoD RNA probe on whole mount E12.5 embryos, according to previously published procedures [95]. In order to assess the orientation of myoblasts, the CM muscle sheet was dissected and flat mounted, after completion of the ISH procedure, for high magnification imaging with a Zeiss Axioplan. For each muscle, three areas in stereotyped positions of the CM (3 positions in which the main chain direction made a 10°, 45°, and 70° angle with the DV axis, respectively) were imaged at 63X resolution. Scoring myoblast direction was done using AxioVision image software (Zeiss Imaging). For each picture, three to four chains were outlined. For each cell, an angle between the closest outlined chain and the nucleus direction was measured. Every cell for which the nucleus was visible was assigned such an angle. The distribution of angles was thus determined for each embryo side (two CM muscles per embryo), by defining angle ranges of 10°, and determining the percentage of cells showing an angle in the given angle range. This distribution was averaged between 3 wild types embryos sides (n = 3), and 5 Fat1LacZ/LacZ embryo sides (n = 5).
Western blot analysis
Tissue extracts were prepared in EBM buffer (20 mM Tris–HCl pH 7.5, 150 mM NaCl, 1% Triton, 5 mM EDTA, 5 mM EGTA, 10% glycerol) supplemented with protease inhibitors [95]. To enrich the lysates in membrane associated proteins, lysates were lectin-purified by incubation with Lectin-sepharose beads. For immunoblotting, 50 µg of protein extracts were separated by SDS–PAGE using 3–8% gradient gels (Invitrogen), blotted onto nitrocellulose membrane and detected with specific antibodies. Immunoblots were revealed by ECL (Amersham).
Anti-FAT1 antisera production and purification
We first constructed a GST-FAT1 fusion protein, containing the C-terminal part of the intracellular domain of mouse FAT1 (from aa 4451 to 4588; an epitope entirely contained by exon 28, and comprising approximately one third of the cytoplasmic domain), in PGEX2 vector. Serum was collected from two rabbits immunized with the GST-FAT1 fusion protein (Rb 1465 and 1464). Antibodies were affinity purified from the two antisera, using the same GST-FAT1 (GST-Fat1-aa4451-4588) fusion protein, loaded on Affi-gel 15 support in poly-prep chromatography columns, following the manufacturer's instruction (Biorad).
RNA extraction and Real-Time quantitative Polymerase Chain Reaction (RT-PCR)
In both mouse and human samples, total RNA was isolated using Trizol reagent (Gibco, BRL). RNA was resuspended in 100 µl DEPC-treated H2O and quantified by spectrophotometry; samples used for RT-PCRs had a 260/280 absorbance ratio greater than 1.8. cDNA was synthesized from 1 µg of total RNA using Superscript III (Invitrogen) or the First Strand cDNA Synthesis Kit (Fermentas RevertAid: K1622) and random oligonucleotides.
In mouse RNA samples, expression levels of Fat1, Creatine kinase B (CKB) or HPRT were determined by semi-quantitative and/or quantitative RT-PCRs using real-time sybrgreen PCR assay (life technologies), using the following primer sets. Fat1 Primer set exons 20–21 (product size: 511 or 525 bp), 5′ CCA CGC GGT TGT CAT GTA CG 3′ (exon 20-Fw), and 5′ TCC AGT AGG CGA GGG ATT GC 3′ (exon 21-rev). Fat1 Primer set exon 6–8 (product size: 545): 5′ AAG CCC CTT GAT GCA GAA CA 3′ (exon6-Fw); 5′ TCA GCG TTC CTC CCT TTG TC 3′ (exon8-rev). Fat1 primer set exons 24–25 (product size 142 bp) 5′ TGC TGT CTG TCA GTG TGA CTC AGG C 3′ (exon 24-Fw); 5′ GAG AGG CAT CCT CAC AGT GCT TCC C 3′ (exon 25-rev); Fat1 primer set exons 26–28 (product size varies according to splice variants expressed; 3 products are observed:268 bp, 304 bp; and 330 bp) 5′ CGC TTA GCT CCT TCC AGT CAG AGT CC 3′ (exon 26-Fw); 5′ GGG TGG GTG TAT GGA CTC GAA CTG G 3′ (exon 28-Rev); HPRT primer set: HPRT-fw: 5′ CAC AGG ACT AGA ACA CCT GC 3′ HPRT-rev: 5′ GCT GGT GAA AAG GAC CTC T 3′. Creatine kinase B-type (CKB); CKB-Fw: 5′ ACG ACC ACT TCC TCT TCG ATA A 3′; CKB-rev: 5′ TTT TCA GTG TCA GCA ACA GCT T 3′. For qPCR experiments, the HPRT gene was used as endogenous reference gene to normalize the data across all samples. For each gene examined, primers were chosen at the junction between two exons, to distinguish by their size the RT-PCR products from the genomic DNA PCR products. For Fat1 primer sets, sizes expected from genomic PCR amplicons, in case of genomic DNA contamination, have been indicated on Figures S4 and Figures S5).
Expression of the human FAT1 gene was monitored by a real time quantitative RT-PCR method using TaqMan gene expression assay reference number Hs00170627_m1 targeting the 5′ part of the FAT1 sequence (Applied biosystem), or using real-time sybrgreen PCR assay (Roche) (see primers below). The ubiquitous beta-glucuronidase (GUS), was used as endogenous reference gene to normalize the data across all samples. FAT1 primers were chosen at the exon2-3 junction: forward primer: 5′ - CAT TAG AGA TGG CTC TGG CG-3′; reverse primer: 5′ - ATG GGA GGT CGA TTC ACG-3′). (Fw GUS: 5′-CTC ATT TGG AAT TTT GCC GAT T-3′; Rev GUS: 5′ - CCG AGT GAA GAT CCC CTT TTT A-3′). Primers used for other muscle genes: DHPR-Fw: 5′ - CGC AAC TGG TGG GTT GCC AGC-3′; DHPR-Rev: 5′ - GGC CCA TCC TCC AGC AAC GC -3′; MURF1-Fw: 5′ - CTT GAC TGC CAA GCA ACT CA -3′; MURF1-Rev: 5′ - CAA AGC CCT GCT CTG TCT TC -3′; DYSF-Fw: 5′ - GAA GCC AAG GTC CCA CTC CGA -3′; DYSF-Rev: 5′ - CAG GCA GCG GTG TGT AGG ACA -3′; Calp3-Fw: 5′ - TCT CTT CAC CAT TGG CTT CGC -3′; Calp3-Rev: 5′ - TGC TGC TTG TTC CCG TGC -3′; B2M-Fw: 5′ - CTC TCT TTC TGG CCT GGA GG -3′; B2M-Rev: 5′ - TGC TGG ATG ACG TGA GTA AAC C -3′; γSARC-Fw: 5′ - CGA CCC GTT TCA AGA CCT TA-3′; γSARC-Rev: 5′ - CCT CAA TTT TCC CAG CGT GA -3′. Similar results were obtained with two other normalizing genes (β-2-microglobulin (B2M) or the human acidic ribosomal phosphosprotein (PO)).
Each experiment was performed in triplicate and repeated at least three times against age matched unaffected foetuses used as controls (see Figure S6A). For quantitative RT-PCR experiments, relative quantities of RNA expression were calculated using the comparative cycle threshold (ΔΔCt) method [96] and were normalized with GUS RNA levels as endogenous reference gene. Briefly, the fold change of RNA expression levels was calculated by the equation 2−ΔΔCt, where Ct is the cycle threshold. The cycle threshold (Ct) is defined as the number of cycles required for the fluorescent signal to cross the threshold in qPCR. ΔCt was calculated by subtracting the Ct values of the endogenous control (GUS) from the Ct values of the RNA of interest (FAT1 or control muscle genes, such as DHPR, MURF1, DYSF, Calp3, γ-Sarcoglycan). ΔΔCt was then calculated by subtracting ΔCt of the sample used as control from the ΔCt of FSHD biopsies.
Repression of FAT1 by DUX4-fl
Human primary myoblasts unaffected by muscle disease were infected with lentivirus carrying either DUX4-fl or GFP as control for 24 hr. RNA was extracted with Qiagen RNeasy kit, DNAse'd with Ambion Turbo DNAse and reverse transcribed with Invitrogen SuperScript III according to manufacturers' instructions. Real time quantitative PCR was performed with the following primers: FAT1-f 5′ – GGA AAG CCT GTC TGA AGT GC - 3′; FAT1-r 5′ – TGT ATG TCC GGC AGA GGA AC -3′; RPL13a-f 5′ – AAC CTC CTC CTT TTC CAA GC - 3′; RPL13a-r 5′ – GCA GTA CCT GTT TAG CCA CGA - 3′. FAT1 values were normalized to the internal standard RPL13a and expressed as percent relative to control condition.
Chromatin immunoprecipitation assay
ChIP assays were performed on chromatin from fetal muscle biopsies (tissue samples obtained as described above) using the Magna A ChIP kit (Millipore/Upstate). For chromatin preparation, muscle samples (∼50 mg) were weighed, cut in small pieces, and cross-linked with 1.5% paraformaldehyde for 10 minutes, the cross-linking reaction being stopped by addition of glycin. Nuclei were extracted from the tissue samples by using a 2 ml dounce tissue grinder and the kit's cell lysis buffer. Chromatin was then sheared by sonication and quantified after DNA extraction. Immunoprecipitations were performed on 5 µg of Chromatin, with 3 µg of the following antibodies: anti-H3K4me3 (17–614, Millipore), anti-H3K27me3 (07–449, Millipore), and anti-H3K4me1 (ab8895, Abcam), following the ChIP kit instructions, using _proteinA-conjugated mareferredbeads. Immunoprecipitaded material was then washed, cross linking was reversed with proteinase K at 56° for 2 h, and DNA was extracted. The presence of individual regulatory regions in immunoprecipitated chromatin was analyzed by qPCR using sybr green (Invitrogen) on a Biorad CFX96 apparatus. Relative quantities of each chromatin bound fragment expression were calculated using the comparative cycle threshold (ΔΔCt) method again [96] and were normalized either relative to the amount of input DNA (in the same amount of chromatin before immunoprecipitation, quantified with the same PCR), or with levels of the promoter region of a normalizing genes GUSB.
Oligonucleotides for FAT1 Promoter are: FAT1_P1_Fw: 5′ CTT AAG TTT GCC CTG GTC GGA AGC C 3′; FAT1_P1_Rev: 5′ AAA GTC CTC GGC AGC TCC GTG ATC C 3′; Oligonucleotides for the 17/18 intronic enhancer were: FAT1_inton17_Fw: 5′ gga gtg ggg agg agg gaa gag tgg g 3′; FAT1_intron_Rev: 5 ctt ccc tct tgc tct tct tct agc c 3′. Primers for the normalizing GUSB promoter were: GUSB_E/P_Fw: 5′ AGA GGA TGT AGA CCA GGC AAA AGC C 3′; GUSB_E/P_Rev: 5′ TAG AGG ACA GGA CAT GAC ATC AGG C-3′. All sequences were selected based on the Encode ChIP tracks on the UCSC browser (available with the base genome Human Mar. 2006 (NCBI36/hg18)).
Genomic DNA array screen for microdeletions in FSHD patients
DNA was hybridized on a Nimblegen HD2.1 genomic array consisting of 135,000 probes targeting the 4q35.2 genomic region. Probes were designed with a spacing of 10 bp between consecutives probes in the exonic/intronic regions and 100 bp in the intergenic regions. Labeling of DNA and hybridization was based on the Nimblegen protocols. Arrays were scanned with the MS200 scanner (Roche) and the acquired paired files were analyzed using the CGHweb algorithms [97]. To visualize the deletion/duplication events, coordinates were formatted as a bed file and added in the custom tracks of the genome browser (genome.ucsc.edu). Patients that had CNVs in the intron 16–17 area are refered to with the number corresponding to their number in the patient summary table (Table S1).
A first PCR validation was performed using primers flanking the deleted area. This approach is expected to yield a PCR product of approximately 1500 bp from a control locus, and a smaller size product in the case of the deleted allele, the deletions being approximately 1 kb long. Primer sequences are: Del-Fw: 5′ - CCT TCA CCT GCA GTA AG-3′; Del-Rev: 5′ - CTA GGA TTC CTA AGA GC -3′. This approach led to validate the presence of both the 1500 band and the smaller band in the three independent patients (numbers 11, 12 and 25), plus patient 13 (sibling of 12), as carrying a deleted allele as well. Moreover, 20 unaffected controls were tested with this method and only yielded the control 1500 bp band, indicating the absence of deleted alleles.
Further validation of the deletion was performed by quantitative PCR, comparing the relative amount of PCR products scanning the deleted area, using as reference a PCR product outside the considered zone, a method used to quantify copy number variations [96], [98]. All DNA samples, whether from healthy controls or from FSHD patients, were normalized with the ADORA Reference PCR, against one healthy control DNA used as standard DNA (set to 100%). The reference primers are as follows: chr17p12 : ADORA2B-2F: 5′-GTC ACT CTT TTC CAG CCA GC-3′ ; ADORA2B-2R:5′-AAG TCT CGG TTC CGG TAA GC – 3′. The primers corresponding to the deleted area were as follows: qPCR-primer-1 : 5′ – GCA ACA GAG GCC AAT GGA AA – 3′; qPCR-primer-2 : 5′ – CTG AAA AGA TTT CAG GTT ACA CGC T – 3′; qPCR-primer-3 : 5′ – TTC GGT AAG ATG GGA GCA GCC TTC C - 3′; qPCR-primer-4 : 5′ – GGT CCT GAC AAG CTA ATC CTG AGG G - 3′; qPCR-primer-5 : 5′ – GGA GTG TGG TGT GTT CTA GGT TAT GG – 3′; qPCR-primer-6 : 5′ – AGC AGA CAA GAG CAC AAG GCA TTT C – 3′; qPCR-primer-7 : 5′ – GGA ACA CAG CCA AAT CTA TAT GGG – 3′; qPCR-primer-8 : 5′ – TCT TCC TCC TCA CAC TCC CTT TC – 3′; qPCR-primer-9 : 5′ – CCT GGG CAA TGA GTG TAA CTC C – 3′; qPCR-primer-10 : 5′ – CCA ACC TCC TCC CTA CTC CAC TT -3′; qPCR-primer-11 : 5′ – CCA GTG GCA GCA GGT CTG ATT AAG C - 3′; qPCR-primer-12 : 5′ – GGG AAA CGT AGA ATT CAA GAA GTC GC - 3′ (primers numbered as in Figure 10A and Figure S16A).
Assay of hypomethylation status at D4Z4 repeats
Among contraction-independent cases, a large proportion, referred to as FSHD2, harbours hypomethylated D4Z4 [63]–[64], while others do not and are expected to carry unrelated causal abnormalities. Hypomethylation was assessed for 8 patients as indicated in the patient summary table, by digesting genomic DNA, with BlnI, CpoI and Eco91I, and hybridizing the southern blot with the p13E-11 probe, as described [64]. Numbers indicated represent the percentage of methylated proximal D4Z4 unit at chromosome 4q35.
Statistical analysis
Results were expressed as the mean ± s.e.m. Statistically significant differences were assessed by unpaired t-Student test, or Mann-whitney test for non-Normally distributed data, X2 test or Fischer tests (for linkage studies), calculated with the StatEL add-in program to excel. The Kaplan-Meier plot was made with the StatEL add-in program to excel, and P value was calculated with the logrank test. * indicates P value<0.05; ** indicates P value<0.001.
Supporting Information
Zdroje
1. ShiX, GarryDJ (2006) Muscle stem cells in development, regeneration, and disease. Genes Dev 20 : 1692–1708.
2. SambasivanR, Gayraud-MorelB, DumasG, CimperC, PaisantS, et al. (2009) Distinct regulatory cascades govern extraocular and pharyngeal arch muscle progenitor cell fates. Dev Cell 16 : 810–821.
3. ShihHP, GrossMK, KioussiC (2008) Muscle development: forming the head and trunk muscles. Acta Histochem 110 : 97–108.
4. LisiMT, CohnRD (2007) Congenital muscular dystrophies: new aspects of an expanding group of disorders. Biochim Biophys Acta 1772 : 159–172.
5. EmeryAE (2002) The muscular dystrophies. Lancet 359 : 687–695.
6. TawilR, Van Der MaarelSM (2006) Facioscapulohumeral muscular dystrophy. Muscle Nerve 34 : 1–15.
7. OttavianiA, GilsonE, MagdinierF (2008) Telomeric position effect: from the yeast paradigm to human pathologies? Biochimie 90 : 93–107.
8. OttavianiA, Rival-GervierS, BoussouarA, FoersterAM, RondierD, et al. (2009) The D4Z4 macrosatellite repeat acts as a CTCF and A-type lamins-dependent insulator in facio-scapulo-humeral dystrophy. PLoS Genet 5: e1000394.
9. MasnyPS, ChanOY, de GreefJC, BengtssonU, EhrlichM, et al. (2009) Analysis of allele-specific RNA transcription in FSHD by RNA-DNA FISH in single myonuclei. Eur J Hum Genet 18(4): 448–56.
10. WinokurST, ChenYW, MasnyPS, MartinJH, EhmsenJT, et al. (2003) Expression profiling of FSHD muscle supports a defect in specific stages of myogenic differentiation. Hum Mol Genet 12 : 2895–2907.
11. GabelliniD, GreenMR, TuplerR (2002) Inappropriate gene activation in FSHD: a repressor complex binds a chromosomal repeat deleted in dystrophic muscle. Cell 110 : 339–348.
12. GabelliniD, D'AntonaG, MoggioM, PrelleA, ZeccaC, et al. (2006) Facioscapulohumeral muscular dystrophy in mice overexpressing FRG1. Nature 439 : 973–977.
13. XuX, TsumagariK, SowdenJ, TawilR, BoyleAP, et al. (2009) DNaseI hypersensitivity at gene-poor, FSH dystrophy-linked 4q35.2. Nucleic Acids Res 37 : 7381–7393.
14. SniderL, GengLN, LemmersRJ, KybaM, WareCB, et al. (2010) Facioscapulohumeral dystrophy: incomplete suppression of a retrotransposed gene. PLoS Genet 6: e1001181.
15. DmitrievP, LipinskiM, VassetzkyYS (2009) Pearls in the junk: dissecting the molecular pathogenesis of facioscapulohumeral muscular dystrophy. Neuromuscul Disord 19 : 17–20.
16. van der MaarelSM, TawilR, TapscottSJ (2011) Facioscapulohumeral muscular dystrophy and DUX4: breaking the silence. Trends Mol Med 17 : 252–258.
17. LemmersRJLF, Van der VlietPJ, KloosterR, SacconiS, CamañoP, et al. (2010) A Unifying Genetic Model for Facioscapulohumeral Muscular Dystrophy. Science 329(5999): 1650–1653.
18. GengLN, YaoZ, SniderL, FongAP, CechJN, et al. (2012) DUX4 activates germline genes, retroelements, and immune mediators: implications for facioscapulohumeral dystrophy. Dev Cell 22 : 38–51.
19. WallaceLM, GarwickSE, MeiW, BelayewA, CoppeeF, et al. (2011) DUX4, a candidate gene for facioscapulohumeral muscular dystrophy, causes p53-dependent myopathy in vivo. Ann Neurol 69 : 540–552.
20. AnsseauE, Laoudj-ChenivesseD, MarcowyczA, TassinA, VanderplanckC, et al. (2009) DUX4c is up-regulated in FSHD. It induces the MYF5 protein and human myoblast proliferation. PLoS One 4: e7482.
21. DixitM, AnsseauE, TassinA, WinokurS, ShiR, et al. (2007) DUX4, a candidate gene of facioscapulohumeral muscular dystrophy, encodes a transcriptional activator of PITX1. Proc Natl Acad Sci U S A 104 : 18157–18162.
22. LemmersRJ, TawilR, PetekLM, BalogJ, BlockGJ, et al. (2012) Digenic inheritance of an SMCHD1 mutation and an FSHD-permissive D4Z4 allele causes facioscapulohumeral muscular dystrophy type 2. Nat Genet (12): 1370–4.
23. BosnakovskiD, DaughtersRS, XuZ, SlackJM, KybaM (2009) Biphasic myopathic phenotype of mouse DUX, an ORF within conserved FSHD-related repeats. PLoS One 4: e7003.
24. BosnakovskiD, XuZ, GangEJ, GalindoCL, LiuM, et al. (2008) An isogenetic myoblast expression screen identifies DUX4-mediated FSHD-associated molecular pathologies. EMBO J 27 : 2766–2779.
25. SopkoR, McNeillH (2009) The skinny on Fat: an enormous cadherin that regulates cell adhesion, tissue growth, and planar cell polarity. Curr Opin Cell Biol 21 : 717–723.
26. SimonsM, MlodzikM (2008) Planar cell polarity signaling: from fly development to human disease. Annu Rev Genet 42 : 517–540.
27. TanoueT, TakeichiM (2005) New insights into Fat cadherins. J Cell Sci 118 : 2347–2353.
28. HarumotoT, ItoM, ShimadaY, KobayashiTJ, UedaHR, et al. (2010) Atypical Cadherins Dachsous and Fat Control Dynamics of Noncentrosomal Microtubules in Planar Cell Polarity. Dev Cell (3)389–401.
29. AigouyB, FarhadifarR, StapleDB, SagnerA, RoperJC, et al. (2010) Cell flow reorients the axis of planar polarity in the wing epithelium of Drosophila. Cell 142 : 773–786.
30. Lopez-SchierH, StarrCJ, KapplerJA, KollmarR, HudspethAJ (2004) Directional cell migration establishes the axes of planar polarity in the posterior lateral-line organ of the zebrafish. Dev Cell 7 : 401–412.
31. SmithTG, Van HaterenN, TickleC, WilsonSA (2007) The expression of Fat-1 cadherin during chick limb development. Int J Dev Biol 51 : 173–176.
32. VasyutinaE, SteblerJ, Brand-SaberiB, SchulzS, RazE, et al. (2005) CXCR4 and Gab1 cooperate to control the development of migrating muscle progenitor cells. Genes Dev 19 : 2187–2198.
33. PanteG, ThompsonJ, LamballeF, IwataT, FerbyI, et al. (2005) Mitogen-inducible gene 6 is an endogenous inhibitor of HGF/Met-induced cell migration and neurite growth. J Cell Biol 171 : 337–348.
34. BarberTD, BarberMC, TomescuO, BarrFG, RubenS, et al. (2002) Identification of target genes regulated by PAX3 and PAX3-FKHR in embryogenesis and alveolar rhabdomyosarcoma. Genomics 79 : 278–284.
35. HouR, LiuL, AneesS, HiroyasuS, SibingaNE (2006) The Fat1 cadherin integrates vascular smooth muscle cell growth and migration signals. J Cell Biol 173 : 417–429.
36. CianiL, PatelA, AllenND, ffrench-ConstantC (2003) Mice lacking the giant protocadherin mFAT1 exhibit renal slit junction abnormalities and a partially penetrant cyclopia and anophthalmia phenotype. Mol Cell Biol 23 : 3575–3582.
37. WeiCL, WuQ, VegaVB, ChiuKP, NgP, et al. (2006) A global map of p53 transcription-factor binding sites in the human genome. Cell 124 : 207–219.
38. MeletisK, WirtaV, HedeSM, NisterM, LundebergJ, et al. (2006) p53 suppresses the self-renewal of adult neural stem cells. Development 133 : 363–369.
39. PrunottoC, CrepaldiT, ForniPE, IeraciA, KellyRG, et al. (2004) Analysis of Mlc-lacZ Met mutants highlights the essential function of Met for migratory precursors of hypaxial muscles and reveals a role for Met in the development of hyoid arch-derived facial muscles. Dev Dyn 231 : 582–591.
40. HaaseG, DessaudE, GarcesA, de BovisB, BirlingM, et al. (2002) GDNF acts through PEA3 to regulate cell body positioning and muscle innervation of specific motor neuron pools. Neuron 35 : 893–905.
41. LeightonPA, MitchellKJ, GoodrichLV, LuX, PinsonK, et al. (2001) Defining brain wiring patterns and mechanisms through gene trapping in mice. Nature 410 : 174–179.
42. MitchellKJ, PinsonKI, KellyOG, BrennanJ, ZupicichJ, et al. (2001) Functional analysis of secreted and transmembrane proteins critical to mouse development. Nat Genet 28 : 241–249.
43. KellyRG, ZammitPS, SchneiderA, AlonsoS, BibenC, et al. (1997) Embryonic and fetal myogenic programs act through separate enhancers at the MLC1F/3F locus. Dev Biol 187 : 183–199.
44. YamanakaK, ChunSJ, BoilleeS, Fujimori-TonouN, YamashitaH, et al. (2008) Astrocytes as determinants of disease progression in inherited amyotrophic lateral sclerosis. Nat Neurosci 11 : 251–253.
45. EnglekaKA, GitlerAD, ZhangM, ZhouDD, HighFA, et al. (2005) Insertion of Cre into the Pax3 locus creates a new allele of Splotch and identifies unexpected Pax3 derivatives. Dev Biol 280 : 396–406.
46. TheisS, PatelK, ValasekP, OttoA, PuQ, et al. (2010) The occipital lateral plate mesoderm is a novel source for vertebrate neck musculature. Development 137 : 2961–2971.
47. Franzini-ArmstrongC, JorgensenAO (1994) Structure and development of E-C coupling units in skeletal muscle. Annu Rev Physiol 56 : 509–534.
48. BraunGS, KretzlerM, HeiderT, FloegeJ, HolzmanLB, et al. (2007) Differentially spliced isoforms of FAT1 are asymmetrically distributed within migrating cells. J Biol Chem 282 : 22823–22833.
49. MaggT, SchreinerD, SolisGP, BadeEG, HoferHW (2005) Processing of the human protocadherin Fat1 and translocation of its cytoplasmic domain to the nucleus. Exp Cell Res 307 : 100–108.
50. SadeqzadehE, de BockCE, ZhangXD, ShipmanKL, ScottNM, et al. (2011) Dual Processing of FAT1 Cadherin Protein by Human Melanoma Cells Generates Distinct Protein Products. J Biol Chem 286 : 28181–28191.
51. SopkoR, SilvaE, ClaytonL, GardanoL, Barrios-RodilesM, et al. (2009) Phosphorylation of the tumor suppressor fat is regulated by its ligand Dachsous and the kinase discs overgrown. Curr Biol 19 : 1112–1117.
52. FengY, IrvineKD (2009) Processing and phosphorylation of the Fat receptor. Proc Natl Acad Sci U S A 106 : 11989–11994.
53. ReedP, PorterNC, StrongJ, PumplinDW, CorseAM, et al. (2006) Sarcolemmal reorganization in facioscapulohumeral muscular dystrophy. Ann Neurol 59 : 289–297.
54. FitzsimonsRB, GurwinEB, BirdAC (1987) Retinal vascular abnormalities in facioscapulohumeral muscular dystrophy. A general association with genetic and therapeutic implications. Brain 110(Pt 3): 631–648.
55. GurwinEB, FitzsimonsRB, SehmiKS, BirdAC (1985) Retinal telangiectasis in facioscapulohumeral muscular dystrophy with deafness. Arch Ophthalmol 103 : 1695–1700.
56. SaburiS, HesterI, GoodrichL, McNeillH (2012) Functional interactions between Fat family cadherins in tissue morphogenesis and planar polarity. Development 139 : 1806–1820.
57. SaburiS, HesterI, FischerE, PontoglioM, EreminaV, et al. (2008) Loss of Fat4 disrupts PCP signaling and oriented cell division and leads to cystic kidney disease. Nat Genet 40 : 1010–1015.
58. GoodrichLV (2008) The plane facts of PCP in the CNS. Neuron 60 : 9–16.
59. KellyR, AlonsoS, TajbakhshS, CossuG, BuckinghamM (1995) Myosin light chain 3F regulatory sequences confer regionalized cardiac and skeletal muscle expression in transgenic mice. J Cell Biol 129 : 383–396.
60. TsumagariK, ChangSC, LaceyM, BaribaultC, ChitturSV, et al. (2011) Gene expression during normal and FSHD myogenesis. BMC Med Genomics 4 : 67.
61. HeintzmanND, StuartRK, HonG, FuY, ChingCW, et al. (2007) Distinct and predictive chromatin signatures of transcriptional promoters and enhancers in the human genome. Nat Genet 39 : 311–318.
62. CaoR, WangL, WangH, XiaL, Erdjument-BromageH, et al. (2002) Role of histone H3 lysine 27 methylation in Polycomb-group silencing. Science 298 : 1039–1043.
63. de GreefJC, LemmersRJ, CamanoP, DayJW, SacconiS, et al. (2010) Clinical features of facioscapulohumeral muscular dystrophy 2. Neurology 75 : 1548–1554.
64. de GreefJC, LemmersRJ, van EngelenBG, SacconiS, VenanceSL, et al. (2009) Common epigenetic changes of D4Z4 in contraction-dependent and contraction-independent FSHD. Hum Mutat 30 : 1449–1459.
65. BarrettMT, SchefferA, Ben-DorA, SampasN, LipsonD, et al. (2004) Comparative genomic hybridization using oligonucleotide microarrays and total genomic DNA. Proc Natl Acad Sci U S A 101 : 17765–17770.
66. CelnikerSE, DillonLA, GersteinMB, GunsalusKC, HenikoffS, et al. (2009) Unlocking the secrets of the genome. Nature 459 : 927–930.
67. ErnstJ, KheradpourP, MikkelsenTS, ShoreshN, WardLD, et al. (2011) Mapping and analysis of chromatin state dynamics in nine human cell types. Nature 473 : 43–49.
68. MatsuzakiH, WangPH, HuJ, RavaR, FuGK (2009) High resolution discovery and confirmation of copy number variants in 90 Yoruba Nigerians. Genome Biol 10: R125.
69. BastockR, StruttD (2007) The planar polarity pathway promotes coordinated cell migration during Drosophila oogenesis. Development 134 : 3055–3064.
70. NathanE, MonovichA, Tirosh-FinkelL, HarrelsonZ, RoussoT, et al. (2008) The contribution of Islet1-expressing splanchnic mesoderm cells to distinct branchiomeric muscles reveals significant heterogeneity in head muscle development. Development 135 : 647–657.
71. LescroartF, KellyRG, Le GarrecJF, NicolasJF, MeilhacSM, et al. (2010) Clonal analysis reveals common lineage relationships between head muscles and second heart field derivatives in the mouse embryo. Development 137 : 3269–3279.
72. NodenDM, Francis-WestP (2006) The differentiation and morphogenesis of craniofacial muscles. Dev Dyn 235 : 1194–1218.
73. ValasekP, TheisS, KrejciE, GrimM, MainaF, et al. (2010) Somitic origin of the medial border of the mammalian scapula and its homology to the avian scapula blade. J Anat 216 : 482–488.
74. SambasivanR, KurataniS, TajbakhshS (2011) An eye on the head: the development and evolution of craniofacial muscles. Development 138 : 2401–2415.
75. ReynoldsBC, LemmersRJ, TolmieJ, HowatsonAG, HughesDA (2010) Focal segmental glomerulosclerosis, Coats'-like retinopathy, sensorineural deafness and chromosome 4 duplication: a new association. Pediatr Nephrol (8):1551–1554.
76. TakekuraH, FlucherBE, Franzini-ArmstrongC (2001) Sequential docking, molecular differentiation, and positioning of T-Tubule/SR junctions in developing mouse skeletal muscle. Dev Biol 239 : 204–214.
77. CabiancaDS, CasaV, BodegaB, XynosA, GinelliE, et al. (2012) A Long ncRNA Links Copy Number Variation to a Polycomb/Trithorax Epigenetic Switch in FSHD Muscular Dystrophy. Cell (4):819–31.
78. ZengW, de GreefJC, ChenYY, ChienR, KongX, et al. (2009) Specific loss of histone H3 lysine 9 trimethylation and HP1gamma/cohesin binding at D4Z4 repeats is associated with facioscapulohumeral dystrophy (FSHD). PLoS Genet 5: e1000559.
79. SciontiI, GrecoF, RicciG, GoviM, ArashiroP, et al. (2012) Large-scale population analysis challenges the current criteria for the molecular diagnosis of fascioscapulohumeral muscular dystrophy. Am J Hum Genet 90 : 628–635.
80. SciontiI, FabbriG, FiorilloC, RicciG, GrecoF, et al. (2012) Facioscapulohumeral muscular dystrophy: new insights from compound heterozygotes and implication for prenatal genetic counselling. J Med Genet 49 : 171–178.
81. FitzsimonsRB (2011) Retinal vascular disease and the pathogenesis of facioscapulohumeral muscular dystrophy. A signalling message from Wnt? Neuromuscul Disord 21 : 263–271.
82. PadbergGW, BrouwerOF, de KeizerRJ, DijkmanG, WijmengaC, et al. (1995) On the significance of retinal vascular disease and hearing loss in facioscapulohumeral muscular dystrophy. Muscle Nerve 2: S73–80.
83. XuQ, WangY, DabdoubA, SmallwoodPM, WilliamsJ, et al. (2004) Vascular development in the retina and inner ear: control by Norrin and Frizzled-4, a high-affinity ligand-receptor pair. Cell 116 : 883–895.
84. RobitailleJ, MacDonaldML, KaykasA, SheldahlLC, ZeislerJ, et al. (2002) Mutant frizzled-4 disrupts retinal angiogenesis in familial exudative vitreoretinopathy. Nat Genet 32 : 326–330.
85. ChenZY, BattinelliEM, FielderA, BundeyS, SimsK, et al. (1993) A mutation in the Norrie disease gene (NDP) associated with X-linked familial exudative vitreoretinopathy. Nat Genet 5 : 180–183.
86. GrosJ, SerralboO, MarcelleC (2009) WNT11 acts as a directional cue to organize the elongation of early muscle fibres. Nature 457 : 589–593.
87. Le GrandF, JonesAE, SealeV, ScimeA, RudnickiMA (2009) Wnt7a activates the planar cell polarity pathway to drive the symmetric expansion of satellite stem cells. Cell Stem Cell 4 : 535–547.
88. JingL, LefebvreJL, GordonLR, GranatoM (2009) Wnt signals organize synaptic prepattern and axon guidance through the zebrafish unplugged/MuSK receptor. Neuron 61 : 721–733.
89. LangD, LuMM, HuangL, EnglekaKA, ZhangM, et al. (2005) Pax3 functions at a nodal point in melanocyte stem cell differentiation. Nature 433 : 884–887.
90. SrinivasS, WatanabeT, LinCS, WilliamCM, TanabeY, et al. (2001) Cre reporter strains produced by targeted insertion of EYFP and ECFP into the ROSA26 locus. BMC Dev Biol 1 : 4.
91. SchwenkF, BaronU, RajewskyK (1995) A cre-transgenic mouse strain for the ubiquitous deletion of loxP-flanked gene segments including deletion in germ cells. Nucleic Acids Res 23 : 5080–5081.
92. RodriguezCI, BuchholzF, GallowayJ, SequerraR, KasperJ, et al. (2000) High-efficiency deleter mice show that FLPe is an alternative to Cre-loxP. Nat Genet 25 : 139–140.
93. WrightTJ, WijmengaC, ClarkLN, FrantsRR, WilliamsonR, et al. (1993) Fine mapping of the FSHD gene region orientates the rearranged fragment detected by the probe p13E-11. Hum Mol Genet 2 : 1673–1678.
94. NguyenKM, WalrafenPP, BernardRM, AttarianSM, PhD,, ChaixCB, et al. (2011) Molecular combing reveals allelic combinations in facioscapulohumeral dystrophy. Annals of Neurology (4):627–33.
95. MainaF, PanteG, HelmbacherF, AndresR, PorthinA, et al. (2001) Coupling Met to specific pathways results in distinct developmental outcomes. Mol Cell 7 : 1293–1306.
96. LivakKJ, SchmittgenTD (2001) Analysis of relative gene expression data using real-time quantitative PCR and the 2(-Delta Delta C(T)) Method. Methods 25 : 402–408.
97. LaiW, ChoudharyV, ParkPJ (2008) CGHweb: a tool for comparing DNA copy number segmentations from multiple algorithms. Bioinformatics 24 : 1014–1015.
98. AarskogNK, VedelerCA (2000) Real-time quantitative polymerase chain reaction. A new method that detects both the peripheral myelin protein 22 duplication in Charcot-Marie-Tooth type 1A disease and the peripheral myelin protein 22 deletion in hereditary neuropathy with liability to pressure palsies. Hum Genet 107 : 494–498.
Štítky
Genetika Reprodukční medicínaČlánek vyšel v časopise
PLOS Genetics
2013 Číslo 6
- Kazuistika – Perspektivy využití precizované medicíny v rámci personalizované specifické terapie onkologických pacientů
- Nobelova cena za chemii pro genetické nůžky: Objev, který změní naši budoucnost?
- Technologie na bázi RNA v klinické praxi: od přebarvených petúnií k terapii vzácných a dosud jen obtížně léčitelných chorob u lidí
- „Nepředstavovali jsme si, že náš výzkum povede přímo ke vzniku nových léků, dokonce ještě za našeho života“
- Bezplatné služby pro diagnostiku ATTRv amyloidózy pro kardiology
Nejčtenější v tomto čísle
- BMS1 Is Mutated in Aplasia Cutis Congenita
- Sex-stratified Genome-wide Association Studies Including 270,000 Individuals Show Sexual Dimorphism in Genetic Loci for Anthropometric Traits
- Distinctive Expansion of Potential Virulence Genes in the Genome of the Oomycete Fish Pathogen
- Distinct Neuroblastoma-associated Alterations of Impair Sympathetic Neuronal Differentiation in Zebrafish Models
Zvyšte si kvalifikaci online z pohodlí domova
Mazová zátka a její řešení
nový kurzVšechny kurzy