
A Meta-Analysis of Thyroid-Related Traits Reveals Novel Loci and Gender-Specific Differences in the Regulation of Thyroid Function
Thyroid hormone is essential for normal metabolism and development, and overt abnormalities in thyroid function lead to common endocrine disorders affecting approximately 10% of individuals over their life span. In addition, even mild alterations in thyroid function are associated with weight changes, atrial fibrillation, osteoporosis, and psychiatric disorders. To identify novel variants underlying thyroid function, we performed a large meta-analysis of genome-wide association studies for serum levels of the highly heritable thyroid function markers TSH and FT4, in up to 26,420 and 17,520 euthyroid subjects, respectively. Here we report 26 independent associations, including several novel loci for TSH (PDE10A, VEGFA, IGFBP5, NFIA, SOX9, PRDM11, FGF7, INSR, ABO, MIR1179, NRG1, MBIP, ITPK1, SASH1, GLIS3) and FT4 (LHX3, FOXE1, AADAT, NETO1/FBXO15, LPCAT2/CAPNS2). Notably, only limited overlap was detected between TSH and FT4 associated signals, in spite of the feedback regulation of their circulating levels by the hypothalamic-pituitary-thyroid axis. Five of the reported loci (PDE8B, PDE10A, MAF/LOC440389, NETO1/FBXO15, and LPCAT2/CAPNS2) show strong gender-specific differences, which offer clues for the known sexual dimorphism in thyroid function and related pathologies. Importantly, the TSH-associated loci contribute not only to variation within the normal range, but also to TSH values outside the reference range, suggesting that they may be involved in thyroid dysfunction. Overall, our findings explain, respectively, 5.64% and 2.30% of total TSH and FT4 trait variance, and they improve the current knowledge of the regulation of hypothalamic-pituitary-thyroid axis function and the consequences of genetic variation for hypo - or hyperthyroidism.
Published in the journal:
. PLoS Genet 9(2): e32767. doi:10.1371/journal.pgen.1003266
Category:
Research Article
doi:
https://doi.org/10.1371/journal.pgen.1003266
Summary
Thyroid hormone is essential for normal metabolism and development, and overt abnormalities in thyroid function lead to common endocrine disorders affecting approximately 10% of individuals over their life span. In addition, even mild alterations in thyroid function are associated with weight changes, atrial fibrillation, osteoporosis, and psychiatric disorders. To identify novel variants underlying thyroid function, we performed a large meta-analysis of genome-wide association studies for serum levels of the highly heritable thyroid function markers TSH and FT4, in up to 26,420 and 17,520 euthyroid subjects, respectively. Here we report 26 independent associations, including several novel loci for TSH (PDE10A, VEGFA, IGFBP5, NFIA, SOX9, PRDM11, FGF7, INSR, ABO, MIR1179, NRG1, MBIP, ITPK1, SASH1, GLIS3) and FT4 (LHX3, FOXE1, AADAT, NETO1/FBXO15, LPCAT2/CAPNS2). Notably, only limited overlap was detected between TSH and FT4 associated signals, in spite of the feedback regulation of their circulating levels by the hypothalamic-pituitary-thyroid axis. Five of the reported loci (PDE8B, PDE10A, MAF/LOC440389, NETO1/FBXO15, and LPCAT2/CAPNS2) show strong gender-specific differences, which offer clues for the known sexual dimorphism in thyroid function and related pathologies. Importantly, the TSH-associated loci contribute not only to variation within the normal range, but also to TSH values outside the reference range, suggesting that they may be involved in thyroid dysfunction. Overall, our findings explain, respectively, 5.64% and 2.30% of total TSH and FT4 trait variance, and they improve the current knowledge of the regulation of hypothalamic-pituitary-thyroid axis function and the consequences of genetic variation for hypo - or hyperthyroidism.
Introduction
Through the production of thyroid hormone (TH), the thyroid is essential for normal development, growth and metabolism of virtually all human tissues. Its critical role in heart, brain, bone, and general metabolism is illustrated by the clinical manifestations of thyroid disease, which affects up to 10% of the population. Low thyroid function (i.e., hypothyroidism) can lead to weight gain, high cholesterol, cognitive dysfunction, depression, and cold intolerance, whereas hyperthyroidism may result in weight loss, tachycardia, atrial fibrillation, and osteoporosis. Mild variation in thyroid function, both subclinical and within the normal range, is associated with these TH-related clinical outcomes as well [1]–[4].
The thyroid gland secretes predominantly the pro-hormone thyroxine (T4), which is converted into the active form triiodothyronine (T3) in peripheral tissues. The production of TH by the thyroid gland is regulated by the hypothalamus-pituitary-thyroid (HPT) axis, via a so-called negative feedback loop. Briefly, low levels of serum TH in hypothyroidism result in an increased release of thyroid stimulating hormone (TSH) by the pituitary, under the influence of hypothalamic thyrotropin releasing hormone (TRH) [5]. TSH, a key regulator of thyroid function, stimulates the synthesis and secretion of TH by the thyroid. When circulating TH levels are high, as in hyperthyroidism, TRH and TSH synthesis and secretion are inhibited.
In healthy (euthyroid) individuals, TSH and free T4 (FT4) levels vary over a narrower range than the broad inter-individual variation seen in the general population, suggesting that each person has a unique HPT axis set-point that lies within the population reference range [6]. Besides environmental factors such as diet, smoking and medication, little is known about the factors that influence this inter-individual variation in TSH and FT4 levels [7]–[9]. The heritability of TSH and FT4 has been estimated from twin and family studies at about 65% and 40%, respectively [10]–[12]. However, the underlying genetic variants are not fully established, and the contribution of those discovered so far to the overall variance is modest. Single nucleotide polymorphisms (SNPs) in the phosphodiesterase type 8B (PDE8B), upstream of the capping protein (actin filament) muscle Z-line, β (CAPZB) and, more recently, of the nuclear receptor subfamily 3, group C, member 2 (NR3C2) and of v-maf musculoaponeurotic fibrosarcoma oncogene homolog (MAF/LOC440389) genes have been implicated in TSH variation by genome-wide association studies (GWAS) [13]–[15], whereas SNPs in the iodothyronine deiodinase DIO1 have been associated with circulating levels of TH by candidate gene analysis [16]–[18].
To identify additional common variants associated with thyroid function, we performed a meta-analysis of genome-wide association data in 26,420 euthyroid individuals phenotyped for serum TSH and 17,520 for FT4 levels, respectively. In addition, we also assessed gender-specific effects and correlation with subclinical thyroid dysfunction.
Results
To identify common genetic variants associated with serum TSH and FT4 levels, we carried out a meta-analysis of genome-wide association results from 18 studies for TSH and 15 studies for FT4 levels, which assessed the additive effect of ∼2.5 million genotyped and HapMap-imputed SNPs in relation to those traits in individuals of European ancestry (for cohort description see Table 1 and Table S1). In order to avoid bias due to the presence of thyroid pathologies, prior to analysis we excluded all individuals with TSH values outside the normal range (TSH<0.4 mIU/L and TSH>4.0 mIU/L) and those taking thyroid medication for known thyroid pathologies whenever the relevant information was available. Our meta-analysis was thereby carried out in up to 26,420 and 17,520 euthyroid subjects, respectively for TSH and FT4. Additional exclusion criteria used by individual cohorts are detailed in Table S1.

Using the standard genome-wide threshold of 5×10⁻⁸, we observed significant associations for SNPs at 23 loci, of which 19 were associated with TSH, and 4 with FT4 (Figure S1). The results are presented in Table 2 and Figure 1, Figure 2, Figure 3, Figure 4, Figure 5. In Table S2 single cohort results for each GW significant SNP are reported.


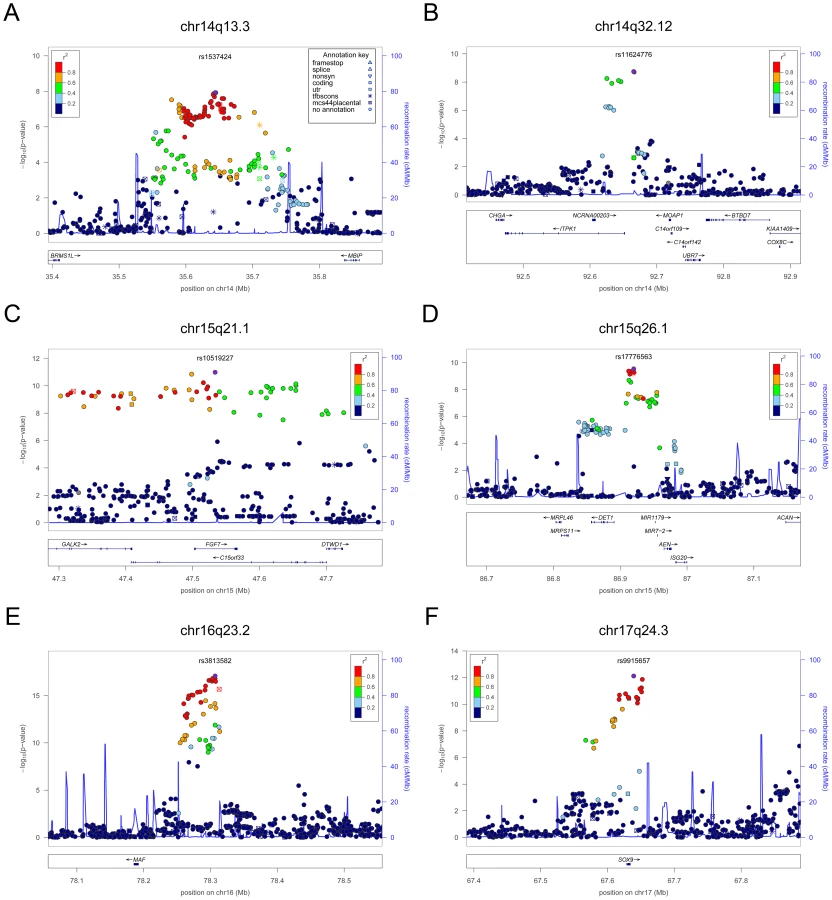


For TSH, 4 signals confirmed previously described loci with proxy SNPs at PDE8B (P = 1.95×10−56, r2 = 0.94 with the reported rs4704397), CAPZB (P = 3.60×10⁻²¹, r2 = 1 with the reported rs10917469) and NR3C2 (P = 9.28×10⁻¹⁶, r2 = 0.90 with the reported rs10028213), whereas the signal was coincident at MAF/LOC440389 (P = 8.45×10⁻¹⁸) [13]–[15]. The remaining signals were in or near 15 novel loci: PDE10A (phosphodiesterase type 10A, P = 1.21×10⁻²⁴), VEGFA (Vascular endothelial growth factor, P = 6.72×10⁻¹⁶), IGFBP5 (insulin-like growth factor binding protein 5, P = 3.24×10⁻¹⁵), SOX9 (sex determining region Y-box 9, P = 7.53×10⁻¹³), NFIA (nuclear factor I/A, P = 5.40×10⁻¹²), FGF7 (fibroblast growth factor 7, P = 1.02×10⁻¹¹), PRDM11 (PR domain containing 11, P = 8.83×10⁻¹¹), MIR1179 (microRNA 1179, P = 2.89×10⁻¹⁰), INSR (insulin receptor, P = 3.16×10⁻¹⁰), ABO (ABO glycosyltransferase, P = 4.11×10⁻¹⁰), ITPK1 (inositol-tetrakisphosphate 1-kinase, P = 1.79×10⁻⁹), NRG1 (neuregulin 1, P = 2.94×10⁻⁹), MBIP (MAP3K12 binding inhibitory protein 1, P = 1.17×10⁻⁸), SASH1 (SAM and SH3 domain containing 1, P = 2.25×10⁻⁸), GLIS3 (GLIS family zinc finger 3, P = 2.55×10⁻⁸), (Figure 1, Figure 2, Figure 3, Figure 4).
For FT4, we confirmed the DIO1 locus (P = 7.87×10⁻³²), with the same marker previously reported in candidate gene studies [17], [18], and identified 3 additional novel loci, LHX3 (LIM homeobox 3, P = 2.30×10⁻¹⁴), FOXE1 (forkhead box E1, P = 1.50×10⁻¹¹) and AADAT (aminoadipate aminotransferase, P = 5.20×10⁻⁹) (Figure 5). The most associated SNP at the FOXE1 locus, rs7045138, is a surrogate for rs1443434(r2 = 0.97), previously only suggestively associated with FT4 levels [18], and is also correlated with SNPs recently reported to be associated with both low serum TSH and FT4 levels (r2 = 0.59 with rs965513) [19], as well as with hypothyroidism (r2 = 0.59 with rs7850258) [20].
At each locus, a single variant was sufficient to explain entirely the observed association, except for the VEGFA locus, which contained an independent signal located 150 kb downstream of the gene, detected by conditional analyses (Figure 1F and Table 2).
Of all 24 independent markers, significant evidence for heterogeneity (P<0.002, corresponding to a Bonferroni threshold of 0.5/24) was only observed at ABO (P = 1.22×10⁻⁴). Iodine nutrition, which may profoundly affect thyroid function, is quite different in some of the cohorts under study (i.e., Europe vs North America). To test whether the observed heterogeneity could be attributable to different iodine intake, we combined cohorts from South Europe (an iodine-deficient region) and compared effect sizes with those observed in a meta-analysis of North American samples (an iodine-replete region). Interestingly, the effect size of the top marker at ABO was three times larger in Europeans vs North American, and this difference remained significant after Bonferroni correction (P = 7.0.9×10−4) (Table S3). However, the relation of the ABO SNP, a tag for the blood group O, to iodine intake remains to be determined.
Gender-specific analyses
Given the reported clinical differences in thyroid function in males and females [21]–[23], we searched for gender-specific loci by whole-genome sex-specific meta-analysis, analyzing males and females separately in each cohort. Some of the loci detected in the main meta-analysis were seen at genome-wide significance level only in females (NR3C2, VEGFA, NRG1 and SASH1) or in males (MAF/LOC440389, FGF7, SOX9, IGFBP5) with either the same top SNP or one surrogate, but effect sizes at their variants were significantly gender-specific only at PDE8B, PDE10A and MAF/LOC440389, considering a false discovery rate of 5% [24]. In addition, effects at MAF/LOC440389 were significantly different also at the more stringent Bonferroni threshold of 1.9×10⁻³ ( = 0.05/26), and close to significance at PDE8B and PDE10A (Table 3). At these latter loci, the TSH-elevating alleles showed a stronger impact on trait variability in males compared to females (Figure 6). In addition, the gender specific meta-analysis for FT4, revealed a novel female-specific locus on chromosome 18q22, and a novel male-specific locus on chromosome 16q12.2, that had not been detected in the main meta-analysis (Table 3, Figure 6 and Figure S2). The female-specific signal (rs7240777, P = 3.49×10⁻⁸) maps in a “gene desert” region, with the nearest genes NETO1 (neuropilin (NRP) and tolloid (TLL)-like 1), located, about 550 kb upstream and FBXO15 (F-box only protein 15) 500 kb downstream (Figure 5D). The male-specific association is located in intron 11 of the LPCAT2 (lysophosphatidylcholine acyltransferase 2) gene, and near CAPNS2 (calpain, small subunit 2) (rs6499766, P = 4.63×10⁻⁸), a gene which may play a role in spermatogenesis [25]. The FT4-elevating alleles in the NETO1/FBXO15 and LPCAT2/CAPNS2 were fully gender-specific, i.e. there was no effect in males and in females, respectively (P>0.01).


Overall, the 20 TSH and the 6 FT4 associations account, respectively, for 5.64% and 2.30% of total trait variance.
Common loci regulating TSH and FT4 levels
To explore overlap between TSH - and FT4-associated loci and their involvement in the HPT-negative feedback loop, we assessed the associations of the top TSH-associated SNPs on FT4 levels, and vice versa. For the SNPs in or near PDE8B, MAF/LOC440389, VEGFA, IGFBP5, NFIA, MIR1179, MBIP and GLIS3 the TSH-elevating allele appeared to be associated with decreasing FT4 levels (P<0.05, Table S4). However, after application of Bonferroni correction (threshold for FT4 association of TSH SNPs, P = 2.5×10⁻³), none of these reciprocal associations remained significant.
By contrast, a positive relationship was seen for one of the FT4 associated loci, since the variant at the LHX3 locus was significantly associated with higher levels of both FT4 and TSH (P = 5.25×10⁻³, with Bonferroni threshold 0.05/6 = 0.008).
As the presence of reciprocal associations between TSH and FT4 regulating SNPs would be expected from physiology, we tested the power of our study to detect such a relationship. Power calculation for the top SNP at PDE8B, which has the largest effect on TSH levels, revealed that our meta-analysis only has 9% power to detect an association of FT4 at a Bonferroni P = 2.5×10⁻³. We also carried out a bivariate analysis in the SardiNIA study using poly software to estimate specific contributions [26]. This analysis showed that most of the observed negative feedback correlation is due to environmental factors (environmental correlation = −0.130, genetic correlation = −0.065).
Association of loci with hypothyroidism and hyperthyroidism
To assess possible clinical implications, we investigated whether the variants identified in individuals without overt thyroid pathologies (i.e., with TSH levels within the normal range and not taking thyroid medication) were also associated in individuals with abnormal TSH values (i.e., outside the reference range), who were not included in the initial meta-analysis as potentially affected by thyroid pathology. Towards this, we first assessed the global impact of TSH - and FT4-associated SNPs on the risk of increased or decreased TSH levels by comparing weighted genotype risk score (GRS) quartiles in the individuals with abnormal TSH values that were discarded for the GWAS analyses. For the TSH-associated SNPs, the odds of increased TSH levels were 6.65 times greater in individuals with a GRS in the top quartile compared to individuals in the bottom quartile (P = 3.43×10⁻²⁰) (Table 4, top panel, lower vs upper tail). When we compared subjects with high TSH values with subjects within the normal TSH reference range, subjects with a GRS in the top quartile had odds of an elevated TSH 2.37 times greater than for subjects in the bottom quartile (P = 1.06×10⁻¹⁷) (Table 4). With regard to low TSH values versus the normal range, the odds ratio was 0.26 (P = 5.43×10⁻¹³) (Table 4, top panel, lower vs normal tail). By contrast, with the FT4-associated SNPs we found no significant associations for any of the tested comparisons (data not shown).

We also assessed the 20 independent TSH SNPs individually in relation to the risk of abnormal TSH levels by case-control meta-analysis in subjects with high (cases) versus low (controls) TSH values. This analysis showed that variants at PDE8B, CAPZB, FGF7, PDE10A, NFIA and ITPK1 loci are significantly associated (Bonferroni threshold P = 2.5×10⁻³) with abnormal TSH levels (Table 4, bottom panel). PDE8B, CAPZB and FGF7 were also strongly associated with the risk of decreased TSH levels in an analysis of individuals with low (cases) versus normal range TSH (controls). In addition, variants at VEGFA were also significantly associated in this comparison. Finally, when individuals with high TSH values were analyzed versus controls, the NR3C2 locus appeared significantly associated in addition to PDE8B and CAPZB.
Association of TSH lead SNPs in pregnant women
Normal thyroid function is particularly important during pregnancy and elevated TSH levels are implicated in a number of adverse outcomes for both mother and offspring. We therefore assessed whether the TSH lead SNPs were also associated with elevated TSH during pregnancy, when increased TH production is necessary. We tested 9 of the 20 lead TSH variants (or their proxies, see Text S1) in a cohort of 974 healthy pregnant women at 28 weeks gestation [27] and found, as expected, that mean TSH levels were correlated with the number of TSH-elevating alleles (P = 3.0×10⁻¹², Table S5). Effect size estimates in pregnant women were not significantly different when compared to those of women in the main gender-specific meta-analysis (heterogeneity P value>0.05), suggesting that the effects of the TSH-elevating alleles are no greater during pregnancy (data not shown). However, there was evidence of association between the number of TSH-raising alleles and subclinical hypothyroidism in pregnancy, both in the whole sample (OR per weighted allele: 1.18 [95%CI: 1.01, 1.37], P = 0.04) and in TPO antibody-negative women (1.29 [95%CI: 1.08, 1.55], P = 0.006) (Table S6).
Discussion
We report 26 independent SNPs associated with thyroid function tests in euthyroid subjects, 21 of which represent novel signals (16 for TSH and 5 for FT4). Overall they explain 5.64% and 2.30% of the variation in TSH and FT4 levels, respectively.
We observed that carriers of multiple TSH-elevating alleles have increased risk of abnormal TSH levels, and also found association between the number of TSH-elevating alleles and subclinical hypothyroidism in pregnancy. These results are potentially clinically relevant, because abnormal TSH values are the most sensitive diagnostic markers for both overt and subclinical thyroid disease [4]. The variants identified in the current study, or those in LD with them, may thus contribute to the pathogenesis of thyroid disease. Of note, we found eight loci significantly associated with abnormal TSH levels (PDE8B, PDE10, CAPZB, VEGFA, NR3C2, FGF7, NFIA and ITPK1), of which two were specifically associated with either abnormally low (VEGFA) or elevated (NR3C2) TSH values, suggesting differential mechanisms for the contribution of these variants to hyper - and hypothyroidism, respectively. Interestingly, the mineralocorticoid receptor NR3C2 gene has recently been found to be up-regulated in adult-onset hypothyroidism [28], and PDE8B and CAPZB have been suggestively associated with hypothyroidism by GWAS [29]. Alternatively, it may be that carriers of these alleles are healthy individuals who may be misdiagnosed as having thyroid disease because their genetically determined TSH concentrations fall outside the population-based reference range. More research is required to determine which of these interpretations is correct, and the relevance of these variants as markers for thyroid dysfunction or thyroid-related clinical endpoints.
The evidence for gender-specific differences at several TSH and FT4 regulatory loci is intriguing. They included variants at PDE8B, PDE10A, and MAF/LOC440389, which showed significantly stronger genetic effects with pituitary-thyroid function in males, and variants at NETO1/FBX015 and LPCAT2/CAPNS2 which seems to have an effect only in females and males, respectively. Sex differences in the regulation of thyroid function have generally been linked to the influence of sex hormones and autoimmune thyroid disease, resulting in a higher prevalence of thyroid dysfunction in women, without clear understanding of underlying molecular mechanisms [21]–[23]. Our study suggests that differential genes and mechanisms are potentially implicated in the regulation of thyroid function in men and women. Given the impact of thyroid function on several disease outcomes as well as male and female fertility and reproduction, clarifying the underlying associations may provide additional insight for future interventions.
Although it is well known that TSH and FT4 levels are tightly regulated through a negative feedback loop involving the HPT axis, we detected significant overlap between TSH and FT4 signals only at the LHX3 locus, which was primarily associated in our study with FT4. The LHX3 allele is associated with an increase of both TSH and FT4, which is consistent with the essential role of this transcription factor in pituitary development. Inactivating mutations in LHX3 cause the combined pituitary hormone deficiency-3 syndrome [CPHD3 (MIM#221750)] [30], [31], characterized by low TSH and FT4 levels. The positive association of the LHX3 variant with both TSH and FT4 suggests an effect of this allele at the level of the HPT-axis, resulting in an increased exposure to thyroid hormone throughout life. In contrast, although several of the TSH-elevating alleles appeared to be associated with decreasing FT4 levels, none of these reciprocal associations remained significant after Bonferroni correction. Lack of loci associated in a reciprocal manner with both TSH and FT4 is somewhat puzzling, as their presence would be expected from physiology. However, these findings are consistent with initial reports by Shields et al. [27] and more recent findings by Gudmundsson et al. [32]. A power analysis showed that our study – in spite of being one of the larger conducted so far on these traits – is underpowered to detect an inverse relationship between TSH and FT4 variants, considering a Spearman rank correlation of −0.130 between these traits [12]. As a consequence, contrasting studies on smaller sample sizes may also lack power and cannot be considered robust when testing this relationship [33]. In addition, we estimated that most of the observed negative feedback correlation is due to environmental factors; so it is unlikely that negative feedback is controlled by a genetic locus with large effect. This observation can rationalize the lack of reciprocal, significant associations detected for both TSH and FT4 in this and other studies, and further supports the crucial role of the HPT-axis in maintaining normal levels of thyroid hormone.
At present the relationship between the associated variants and specific mechanisms involved in regulating TSH and FT4 levels has not been established, but we have identified strong candidates at the majority of the loci by literature-mining approaches, as detailed below and in Table 5.

Most of the 16 novel loci implicated in the regulation of TSH are highly represented in the thyroid with the exception of PRDM11, expressed in brain, ABO, in blood, and MIR1179. PDE10A encodes a cAMP-stimulated phosphodiesterase, which was previously only suggestively associated with TSH levels and hypothyroidism [13], [34], although the tested variants were weakly correlated with our top signal (r2 = 0.55 with rs2983521 and r2 = 0.15 with rs9347083). The presence of linkage at this gene in families reaching accepted clinical criteria of thyroid dysfunction reinforces the observation that variants in this gene may contribute to clinical thyroid disorders [34]. PDE10A, together with PDE8B and CAPZB, emerged in our study as the strongest currently known genetic determinants of this trait. Both PDE8B and PDE10A are implicated in cAMP degradation in response to TSH stimulation of thyrocytes. In addition, the activity of both PDE10A and CAPZB appear modulated by cAMP [35], [36]. These three genes most likely act in a pathway that leads to cAMP-dependent thyroid hormone synthesis and release, thus highlighting a critical role of cAMP levels in thyroid function. For the other TSH-associated loci (VEGFA, IGFBP5, SOX9, NFIA, FGF7, PRDM11, MIR1179, INSR, ABO, ITPK1, NRG1, MBIP, SASH1 and GLIS3), hypotheses can be formulated based on the published literature (see Table 5), but further studies will be necessary to clarify the exact biological mechanisms and the specific genes involved at each locus. The association of TSH levels with IGFBP5, INSR and NR3C2 is, however, an indication of a specific role of the growth hormone/insulin-like growth factor (GH/IGF) pathway in thyroid function. Remarkably, expression of IGFBP5 is tightly regulated by cAMP, again underlying the pivotal role of this second messenger in determining net TSH levels [37].
For FT4, the DIO1, FOXE1 and LHX3 identified loci have strong biological support as potential effectors. While both DIO1 and FOXE1 were previously associated with FT4 levels and hypothyroidism by candidate gene analysis and functional studies [17]–[19], [38]–[41], association at LHX3 is novel and is consistent with the essential role of this transcription factor in pituitary development (see above) [30], [31], [42], [43]. Consistent with the role of pituitary in growth, this locus has also recently been associated with height in Japanese [44]. The associations of AADAT, NETO1/FXBO15 and LPCT2/CAPNS2 with FT4 levels are currently less clear. It may be relevant that AADAT catalyzes the synthesis of kynurenic acid (KYNA) from kynurenine (KYN), a pathway that has been associated with the induction in brain of proinflammatory cytokines that are known to activate the hypothalamo-pituitary-adrenal (HPA) axis, in turn affecting the HPT axis and thyroid function, including FT4 levels [45]–[49].
Additional pathway analyses by MAGENTA [50], GRAIL [51], and IPA (Ingenuity Systems, www.ingenuity.com) to look for functional enrichment of the genes mapping to the regions associated with TSH, FT4 or both, yielded no novel interactions. However, IPA highlighted an over-representation of genes implicated in developmental processes (11/26, P = 6.27×10⁻⁶–8.85×10⁻³) and cancer (16/26 loci, P = 2.44×10⁻⁶–9.30×10⁻³). This is consistent with the notion that a normally developed thyroid gland is essential for both proper function and thyroid hormone synthesis, and that defects in any of the essential steps in thyroid development or thyroid hormone synthesis may result in morphologic abnormalities, impaired hormonogenesis and growth dysregulation. It is also interesting to note that 11 of the 20 TSH signals and 3 of the 6 FT4 signals are connected in a single protein network, underlying the biological interrelationship between genes regulating these traits (Figure S3).
While our manuscript was in preparation, a GWAS of comparable sample size was published on levels of TSH in the general Icelandic population, which confirmed 15 of our reported loci (E. Porcu et al., 2011, ESHG, abstract), and inferred a role for three TSH-lowering variants in thyroid cancer [32]. Four additional TSH loci identified by Gudmundsson and colleagues were also associated in our sample-set of euthyroid individuals with p<0.05 and consistent direction of effects (VAV3, NKX2–3, TPO and FOXA2). Finally, 2 loci (SIVA1, ELK3) could not be tested because the corresponding SNPs or any surrogate (r2>0.5) were not available in our data set (Table S7). Our study shows that most of the loci described in Icelanders are reproducible in other populations of European origin; differences in sample size, phenotype definition (i.e., selection of euthyroid subjects vs general population) and in the genetic map used to detect associations most likely explain non-overlapping genome-wide significant signals. Among them, the reported signals at SOX9, ABO, SASH1, GLIS3 and MIR1179 will need to be confirmed in other studies; but one of them - GLIS3 - is a prime candidate, because it is involved in congenital hypothyroidism [52]. Interestingly, despite the use of variants detected through whole-genome sequencing in Icelanders, the top signals at seven overlapping loci (PDE8B, PDE10A, CAPZB, MAF/LOC440389, VEGFA, NR3C2, IGFBP5) were either coincident or in high LD (r2>0.9) with those detected in our HapMap-based meta-analysis. Thus, such variants are likely to be the causative ones.
In conclusion, our study reports the first GWAS meta-analysis ever carried out on FT4 levels, adds to the existing knowledge novel TSH - and FT4-associated loci and reveals genetic factors that differentially affect thyroid function in males and females. Several detected loci have potential clinical relevance and have been previously implicated both in Mendelian endocrine disorders (LHX3 [MIMM#221750], FOXE1 [MIMM#241850], PDE8B [MIMM#614190], NR3C2 [MIMM#177735], INSR [MIMM#609968], GLIS3 [MIMM#610199]) and thyroid cancer (FOXE1 [19], VEGFA [53], IGFBP5 [54], INSR [55], NGR1 [32], MBIP [32], FGF7 [56]). Furthermore, the TSH-associated variants were found to contribute to TSH levels outside the reference range. Overall, our findings add to the developing landscape of the regulation of hypothalamic-pituitary-thyroid axis function and the consequences of genetic variation for hypo - or hyperthyroidism.
Methods
Ethics statement
All human research was approved by the relevant institutional review boards, and conducted according to the Declaration of Helsinki.
Cohort details
Cohort description, genotyping and statistical methods for individual study cohorts are reported in Text S1 and Table S1.
Statistical analyses
We carried out a meta-analysis including up to 26,523, individuals from 18 cohorts for TSH and up to 17,520 individuals from 15 cohorts for FT4 (see Table 1). FT4 measures were not available for all 21,955 individuals with TSH levels of the 15 participating cohorts. We combined evidence of associations from single GWAS using an inverse variance meta-analysis, where weights are proportional to the squared standard error of the beta estimates, as implemented in METAL [57]. Prior to GWAS, each study excluded individuals with known thyroid pathologies, taking thyroid medication, who underwent thyroid surgery, and with out-of-range TSH values (<0.4 mIU/L and >4 mIU/L), and an inverse normal transformation was applied to each trait (Table S1). Age, age-squared, and gender were fitted as covariates, as well as principal components axes or additional variables, as required (Table S1). Family-based correction was applied if necessary (see Table S1). Uniform quality control filters were applied before meta-analysis, including MAF <0.01, call rate <0.9, HWE P<1×10⁻⁶ for genotyped SNPs and low imputation quality (defined as r2<0.3 or info <0.4 if MACH [58] or IMPUTE [59], [60] were used, respectively) for imputed SNPs.
Genomic control was applied to individual studies if lambda was >1.0. The overall meta-analysis showed no significant evidence for inflated statistics (lambda for TSH, FT4 and were 1.05 and 1.03 respectively). To evaluate for heterogeneity in effect sizes across populations, we used a chi-square test for heterogeneity, implemented in METAL [57]. The same test was used to evalute heterogeneity related to iodine intake, by comparing effect sizes obtained in a meta-analysis of studies assessing individuals from South Europe (InChianti, MICROS, Val Borbera, SardiNIA, totaling up to 7,488 subjects) with those estimated in a meta-analysis of studies assessing individuals from North America (BLSA, CHS, FHS, OOA, totaling up to 5,407 subjects). Finally, the main meta-analysis was carried out independently by two analysts who obtained identical results.
Conditional analysis
To identify independent signals, each study performed GWA analyses for both TSH and FT4 by adding the lead SNPs found in the primary analysis (19 for TSH, and 4 for FT4, see Table 2) as additional covariates to the basic model, and removing those from the test data set. When lead SNPs were not available, the best proxies (r2>0.8) were included. We then performed a meta-analysis on the conditional GWAS results, using the same method and filters as described above. We used the standard genome-wide significance cutoff (P<5×10⁻⁸) to declare a significant secondary association.
Gender-specific analysis
To identify sex-specific effects, each study performed GWA analyses for each gender separately, using the same covariates and transformation as in the basic model (with the exception of gender covariate). We then performed a meta-analysis on association results using the same method and filters described for the primary analysis. To evaluate sex-specific differences we tested heterogeneity between effect sizes as described above. False-discovery rates (FDRs) on the 26 associated SNPs were calculated with R's p.adjust() procedure via the method of Benjamini and Hochberg [24].
Variance explained
The variance explained by the strongest associated SNPs was calculated, for each trait and in each cohort, as the difference of R2 adjusted observed in the full and the basic models, where the full model contains all the independent SNPs in addition to the covariates. The estimates from each cohort were combined using a weighted average, with weights proportional to the cohort sample size.
Extreme phenotype analysis
To evaluate the impact of the detected variants with clinically relevant TSH levels, we compared the allele frequencies observed in different categories of individuals in a case-control approach. Specifically, we compared individuals in the upper and lower TSH tails (individuals with TSH >4 mIU/L and TSH <0.4 mIU/L, respectively, whom were excluded for the GWAS analyses), as well as individuals in each tail with those in the normal TSH range. In the first case, individuals in the lower tail were considered controls and those in the upper tail cases. In the other two cases, we defined individuals in the normal range as controls and individuals on the two tails cases. To avoid sources of bias, individuals taking thyroid medication and/or with thyroid surgery were excluded. Only unrelated individuals were selected from the family-based cohort SardiNIA, while GEE correction was applied to the TwinsUK dataset. Results from single cohorts were then meta-analyzed. We first assessed the global impact of the 20 TSH - and 6 FT4-associated variants by defining a genotype-risk score (GRS) for each individual as the weighted sum of TSH - and FT4-elevating alleles, with weights proportional to the effect estimated in the meta-analysis. For each comparison, we then calculated quartiles from the global distribution (cases+controls) of the genotype score and used quartile 1 as the baseline reference to compare the number of cases and controls in the other quartiles. In addition, for TSH-associated variants we conducted single SNP comparisons. GRS quartile and single SNP analyses were performed by each study separately. Cohort specific results were then meta-analyzed for both the GRS score and single SNP results only if they had at least 50 cases and 50 controls. Specifically, cohorts included were: CHS, Lifelines, PROSPER, RS, SardiNIA and TwinsUK.
Bivariate analysis
Bivariate analysis was carried out with the software poly [26] in the SardiNIA cohort using the same individuals included in the GWAS and considering the same covariates and transformation for TSH and FT4 levels.
Web resources
The URLs for data presented herein are as follows:
METAL, http://www.sph.umich.edu/cgs/abecasis/metal
MACH, http://www.sph.umich.edu/csg/abecasis/MACH/
IMPUTE, https://mathgen.stats.ox.ac.uk/impute/impute.html
LocusZoom, http://csg.sph.umich.edu/locuszoom/
HapMap, http://www.hapmap.org
Online Mendelian Inheritance in Man (OMIM), http://www.omim.org/
Supporting Information
Zdroje
1. ToftAD (2001) Clinical practice. Subclinical hyperthyroidism. N Engl J Med 345 : 512–516.
2. CooperDS (2001) Clinical practice. Subclinical hypothyroidism. N Engl J Med 345 : 260–265.
3. Fernandez-RealJM, Lopez-BermejoA, CastroA, CasamitjanaR, RicartW (2006) Thyroid function is intrinsically linked to insulin sensitivity and endothelium-dependent vasodilation in healthy euthyroid subjects. J Clin Endocrinol Metab 91 : 3337–3343.
4. BiondiB, CooperDS (2008) The clinical significance of subclinical thyroid dysfunction. Endocr Rev 29 : 76–131.
5. ChiamoleraMI, WondisfordFE (2009) Minireview: Thyrotropin-releasing hormone and the thyroid hormone feedback mechanism. Endocrinology 150 : 1091–1096.
6. AndersenS, PedersenKM, BruunNH, LaurbergP (2002) Narrow individual variations in serum T(4) and T(3) in normal subjects: a clue to the understanding of subclinical thyroid disease. J Clin Endocrinol Metab 87 : 1068–1072.
7. Bulow PedersenI, KnudsenN, JorgensenT, PerrildH, OvesenL, et al. (2002) Large differences in incidences of overt hyper - and hypothyroidism associated with a small difference in iodine intake: a prospective comparative register-based population survey. J Clin Endocrinol Metab 87 : 4462–4469.
8. FranklynJA, RamsdenDB, SheppardMC (1985) The influence of age and sex on tests of thyroid function. Ann Clin Biochem 22 (Pt 5) 502–505.
9. BartalenaL, BogazziF, BrogioniS, BurelliA, ScarcelloG, et al. (1996) Measurement of serum free thyroid hormone concentrations: an essential tool for the diagnosis of thyroid dysfunction. Horm Res 45 : 142–147.
10. HansenPS, BrixTH, SorensenTI, KyvikKO, HegedusL (2004) Major genetic influence on the regulation of the pituitary-thyroid axis: a study of healthy Danish twins. J Clin Endocrinol Metab 89 : 1181–1187.
11. SamollowPB, PerezG, KammererCM, FinegoldD, ZwartjesPW, et al. (2004) Genetic and environmental influences on thyroid hormone variation in Mexican Americans. J Clin Endocrinol Metab 89 : 3276–3284.
12. PanickerV, WilsonSG, SpectorTD, BrownSJ, FalchiM, et al. (2008) Heritability of serum TSH, free T4 and free T3 concentrations: a study of a large UK twin cohort. Clin Endocrinol (Oxf) 68 : 652–659.
13. Arnaud-LopezL, UsalaG, CeresiniG, MitchellBD, PiliaMG, et al. (2008) Phosphodiesterase 8B gene variants are associated with serum TSH levels and thyroid function. Am J Hum Genet 82 : 1270–1280.
14. PanickerV, WilsonSG, WalshJP, RichardsJB, BrownSJ, et al. (2010) A locus on chromosome 1p36 is associated with thyrotropin and thyroid function as identified by genome-wide association study. Am J Hum Genet 87 : 430–435.
15. RawalR, TeumerA, VolzkeH, WallaschofskiH, IttermannT, et al. (2012) Meta-analysis of two genome-wide association studies identifies four genetic loci associated with thyroid function. Hum Mol Genet
16. PeetersRP, van ToorH, KlootwijkW, de RijkeYB, KuiperGG, et al. (2003) Polymorphisms in thyroid hormone pathway genes are associated with plasma TSH and iodothyronine levels in healthy subjects. J Clin Endocrinol Metab 88 : 2880–2888.
17. PanickerV, CluettC, ShieldsB, MurrayA, ParnellKS, et al. (2008) A common variation in deiodinase 1 gene DIO1 is associated with the relative levels of free thyroxine and triiodothyronine. J Clin Endocrinol Metab 93 : 3075–3081.
18. MediciM, van der DeureWM, VerbiestM, VermeulenSH, HansenPS, et al. (2011) A large-scale association analysis of 68 thyroid hormone pathway genes with serum TSH and FT4 levels. Eur J Endocrinol 164 : 781–788.
19. GudmundssonJ, SulemP, GudbjartssonDF, JonassonJG, SigurdssonA, et al. (2009) Common variants on 9q22.33 and 14q13.3 predispose to thyroid cancer in European populations. Nat Genet 41 : 460–464.
20. DennyJC, CrawfordDC, RitchieMD, BielinskiSJ, BasfordMA, et al. (2011) Variants near FOXE1 are associated with hypothyroidism and other thyroid conditions: using electronic medical records for genome - and phenome-wide studies. Am J Hum Genet 89 : 529–542.
21. BoucaiL, HollowellJG, SurksMI (2011) An approach for development of age-, gender-, and ethnicity-specific thyrotropin reference limits. Thyroid 21 : 5–11.
22. McGroganA, SeamanHE, WrightJW, de VriesCS (2008) The incidence of autoimmune thyroid disease: a systematic review of the literature. Clin Endocrinol (Oxf) 69 : 687–696.
23. HollowellJG, StaehlingNW, FlandersWD, HannonWH, GunterEW, et al. (2002) Serum TSH, T(4), and thyroid antibodies in the United States population (1988 to 1994): National Health and Nutrition Examination Survey (NHANES III). J Clin Endocrinol Metab 87 : 489–499.
24. BenjaminiY, HochbergY (1995) Controlling the false discovery rate: a practical and powerful approach to multiple testing. Journal of the Royal Statistical Society Series B 57 : 289–300.
25. Ben-AharonI, BrownPR, EtkovitzN, EddyEM, ShalgiR (2005) The expression of calpain 1 and calpain 2 in spermatogenic cells and spermatozoa of the mouse. Reproduction 129 : 435–442.
26. PiliaG, ChenWM, ScuteriA, OrruM, AlbaiG, et al. (2006) Heritability of cardiovascular and personality traits in 6,148 Sardinians. PLoS Genet 2: e132 doi:10.1371/journal.pgen.0020132.
27. ShieldsBM, FreathyRM, KnightBA, HillA, WeedonMN, et al. (2009) Phosphodiesterase 8B gene polymorphism is associated with subclinical hypothyroidism in pregnancy. J Clin Endocrinol Metab 94 : 4608–4612.
28. Montero-PedrazuelaA, Fernandez-LamoI, AlievaM, Pereda-PerezI, VeneroC, et al. (2011) Adult-onset hypothyroidism enhances fear memory and upregulates mineralocorticoid and glucocorticoid receptors in the amygdala. PLoS ONE 6: e26582 doi:10.1371/journal.pone.0026582.
29. ErikssonN, TungJY, KieferAK, HindsDA, FranckeU, et al. (2012) Novel Associations for Hypothyroidism Include Known Autoimmune Risk Loci. PLoS ONE 7: e34442 doi:10.1371/journal.pone.0034442.
30. ShengHZ, ZhadanovAB, MosingerBJr, FujiiT, BertuzziS, et al. (1996) Specification of pituitary cell lineages by the LIM homeobox gene Lhx3. Science 272 : 1004–1007.
31. NetchineI, SobrierML, KrudeH, SchnabelD, MaghnieM, et al. (2000) Mutations in LHX3 result in a new syndrome revealed by combined pituitary hormone deficiency. Nat Genet 25 : 182–186.
32. GudmundssonJ, SulemP, GudbjartssonDF, JonassonJG, MassonG, et al. (2012) Discovery of common variants associated with low TSH levels and thyroid cancer risk. Nat Genet 44 : 319–322.
33. TaylorPN, PanickerV, SayersA, ShieldsB, IqbalA, et al. (2011) A meta-analysis of the associations between common variation in the PDE8B gene and thyroid hormone parameters, including assessment of longitudinal stability of associations over time and effect of thyroid hormone replacement. Eur J Endocrinol 164 : 773–780.
34. VolpatoCB, De GrandiA, GogeleM, TaliunD, FuchsbergerC, et al. (2011) Linkage and association analysis of hyperthyrotropinaemia in an Alpine population reveal two novel loci on chromosomes 3q28–29 and 6q26–27. J Med Genet 48 : 549–556.
35. KitazawaM, YamakuniT, SongSY, KatoC, TsuchiyaR, et al. (2005) Intracellular cAMP controls a physical association of V-1 with CapZ in cultured mammalian endocrine cells. Biochem Biophys Res Commun 331 : 181–186.
36. TeumerA, RawalR, HomuthG, ErnstF, HeierM, et al. (2011) Genome-wide association study identifies four genetic loci associated with thyroid volume and goiter risk. Am J Hum Genet 88 : 664–673.
37. DuanC, ClemmonsDR (1995) Transcription factor AP-2 regulates human insulin-like growth factor binding protein-5 gene expression. J Biol Chem 270 : 24844–24851.
38. de JongFJ, PeetersRP, den HeijerT, van der DeureWM, HofmanA, et al. (2007) The association of polymorphisms in the type 1 and 2 deiodinase genes with circulating thyroid hormone parameters and atrophy of the medial temporal lobe. J Clin Endocrinol Metab 92 : 636–640.
39. GerebenB, ZavackiAM, RibichS, KimBW, HuangSA, et al. (2008) Cellular and molecular basis of deiodinase-regulated thyroid hormone signaling. Endocr Rev 29 : 898–938.
40. De FeliceM, OvittC, BiffaliE, Rodriguez-MallonA, ArraC, et al. (1998) A mouse model for hereditary thyroid dysgenesis and cleft palate. Nat Genet 19 : 395–398.
41. Clifton-BlighRJ, WentworthJM, HeinzP, CrispMS, JohnR, et al. (1998) Mutation of the gene encoding human TTF-2 associated with thyroid agenesis, cleft palate and choanal atresia. Nat Genet 19 : 399–401.
42. PfaeffleRW, SavageJJ, HunterCS, PalmeC, AhlmannM, et al. (2007) Four novel mutations of the LHX3 gene cause combined pituitary hormone deficiencies with or without limited neck rotation. J Clin Endocrinol Metab 92 : 1909–1919.
43. RajabA, KelbermanD, de CastroSC, BiebermannH, ShaikhH, et al. (2008) Novel mutations in LHX3 are associated with hypopituitarism and sensorineural hearing loss. Hum Mol Genet 17 : 2150–2159.
44. OkadaY, KamataniY, TakahashiA, MatsudaK, HosonoN, et al. (2010) A genome-wide association study in 19 633 Japanese subjects identified LHX3-QSOX2 and IGF1 as adult height loci. Hum Mol Genet 19 : 2303–2312.
45. HelmreichDL, ParfittDB, LuXY, AkilH, WatsonSJ (2005) Relation between the hypothalamic-pituitary-thyroid (HPT) axis and the hypothalamic-pituitary-adrenal (HPA) axis during repeated stress. Neuroendocrinology 81 : 183–192.
46. VamosE, PardutzA, KlivenyiP, ToldiJ, VecseiL (2009) The role of kynurenines in disorders of the central nervous system: possibilities for neuroprotection. J Neurol Sci 283 : 21–27.
47. GohDL, PatelA, ThomasGH, SalomonsGS, SchorDS, et al. (2002) Characterization of the human gene encoding alpha-aminoadipate aminotransferase (AADAT). Mol Genet Metab 76 : 172–180.
48. de SouzaFR, FontesFL, da SilvaTA, CoutinhoLG, LeibSL, et al. (2010) Association of kynurenine aminotransferase II gene C401T polymorphism with immune response in patients with meningitis. BMC Med Genet 12 : 51.
49. HanQ, CaiT, TagleDA, LiJ (2009) Structure, expression, and function of kynurenine aminotransferases in human and rodent brains. Cell Mol Life Sci 67 : 353–368.
50. SegrèAV, GroopL, MoothaVK, DalyMJ, AltshulerD (2010) Common inherited variation in mitochondrial genes is not enriched for associations with type 2 diabetes or related glycemic traits. PLoS Genet 6: e1001058 doi:10.1371/journal.pgen.1001058.
51. RaychaudhuriS, PlengeRM, RossinEJ, NgAC, PurcellSM, et al. (2009) Identifying relationships among genomic disease regions: predicting genes at pathogenic SNP associations and rare deletions. PLoS Genet 5: e1000534 doi:10.1371/journal.pgen.1000534.
52. SeneeV, ChelalaC, DuchateletS, FengD, BlancH, et al. (2006) Mutations in GLIS3 are responsible for a rare syndrome with neonatal diabetes mellitus and congenital hypothyroidism. Nat Genet 38 : 682–687.
53. SalajeghehA, SmithRA, KasemK, GopalanV, NassiriMR, et al. (2011) Single nucleotide polymorphisms and mRNA expression of VEGF-A in papillary thyroid carcinoma: potential markers for aggressive phenotypes. Eur J Surg Oncol 37 : 93–99.
54. StolfBS, CarvalhoAF, MartinsWK, RunzaFB, BrunM, et al. (2003) Differential expression of IGFBP-5 and two human ESTs in thyroid glands with goiter, adenoma and papillary or follicular carcinomas. Cancer Lett 191 : 193–202.
55. VellaV, PandiniG, SciaccaL, MineoR, VigneriR, et al. (2002) A novel autocrine loop involving IGF-II and the insulin receptor isoform-A stimulates growth of thyroid cancer. J Clin Endocrinol Metab 87 : 245–254.
56. BraunschweigT, KasererK, ChungJY, BilkeS, KrizmanD, et al. (2007) Proteomic expression profiling of thyroid neoplasms. Proteomics Clin Appl 1 : 264–271.
57. WillerCJ, LiY, AbecasisGR (2010) METAL: fast and efficient meta-analysis of genomewide association scans. Bioinformatics 26 : 2190–2191.
58. LiY, WillerCJ, DingJ, ScheetP, AbecasisGR (2010) MaCH: using sequence and genotype data to estimate haplotypes and unobserved genotypes. Genet Epidemiol 34 : 816–834.
59. MarchiniJ, HowieB, MyersS, McVeanG, DonnellyP (2007) A new multipoint method for genome-wide association studies by imputation of genotypes. Nat Genet 39 : 906–913.
60. HowieBN, DonnellyP, MarchiniJ (2009) A flexible and accurate genotype imputation method for the next generation of genome-wide association studies. PLoS Genet 5: e1000529 doi:10.1371/journal.pgen.1000529.
61. PruimRJ, WelchRP, SannaS, TeslovichTM, ChinesPS, et al. (2010) LocusZoom: regional visualization of genome-wide association scan results. Bioinformatics 26 : 2336–2337.
62. KleinM, CatargiB (2007) VEGF in physiological process and thyroid disease. Ann Endocrinol (Paris) 68 : 438–448.
63. GerardAC, PoncinS, CaetanoB, SonveauxP, AudinotJN, et al. (2008) Iodine deficiency induces a thyroid stimulating hormone-independent early phase of microvascular reshaping in the thyroid. Am J Pathol 172 : 748–760.
64. YamadaE, YamazakiK, TakanoK, ObaraT, SatoK (2006) Iodide inhibits vascular endothelial growth factor-A expression in cultured human thyroid follicles: a microarray search for effects of thyrotropin and iodide on angiogenesis factors. Thyroid 16 : 545–554.
65. ZhangL, Cooper-KuhnCM, NannmarkU, BlomgrenK, KuhnHG (2010) Stimulatory effects of thyroid hormone on brain angiogenesis in vivo and in vitro. J Cereb Blood Flow Metab 30 : 323–335.
66. YuH, RohanT (2000) Role of the insulin-like growth factor family in cancer development and progression. J Natl Cancer Inst 92 : 1472–1489.
67. EggoMC, KingWJ, BlackEG, SheppardMC (1996) Functional human thyroid cells and their insulin-like growth factor-binding proteins: regulation by thyrotropin, cyclic 3′,5′ adenosine monophosphate, and growth factors. J Clin Endocrinol Metab 81 : 3056–3062.
68. BackeljauwPF, DaiZ, ClemmonsDR, D'ErcoleAJ (1993) Synthesis and regulation of insulin-like growth factor binding protein-5 in FRTL-5 cells. Endocrinology 132 : 1677–1681.
69. PepeneCE, KasperkCH, PfeilschifterJ, BorcsokI, GozariuL, et al. (2001) Effects of triiodothyronine on the insulin-like growth factor system in primary human osteoblastic cells in vitro. Bone 29 : 540–546.
70. ZhouR, BonneaudN, YuanCX, de Santa BarbaraP, BoizetB, et al. (2002) SOX9 interacts with a component of the human thyroid hormone receptor-associated protein complex. Nucleic Acids Res 30 : 3245–3252.
71. das NevesL, DuchalaCS, Tolentino-SilvaF, HaxhiuMA, ColmenaresC, et al. (1999) Disruption of the murine nuclear factor I-A gene (Nfia) results in perinatal lethality, hydrocephalus, and agenesis of the corpus callosum. Proc Natl Acad Sci U S A 96 : 11946–11951.
72. NakazatoM, ChungHK, UlianichL, GrassadoniaA, SuzukiK, et al. (2000) Thyroglobulin repression of thyroid transcription factor 1 (TTF-1) gene expression is mediated by decreased DNA binding of nuclear factor I proteins which control constitutive TTF-1 expression. Mol Cell Biol 20 : 8499–8512.
73. MoellerLC, KimuraS, KusakabeT, LiaoXH, Van SandeJ, et al. (2003) Hypothyroidism in thyroid transcription factor 1 haploinsufficiency is caused by reduced expression of the thyroid-stimulating hormone receptor. Mol Endocrinol 17 : 2295–2302.
74. RevestJM, Spencer-DeneB, KerrK, De MoerloozeL, RosewellI, et al. (2001) Fibroblast growth factor receptor 2-IIIb acts upstream of Shh and Fgf4 and is required for limb bud maintenance but not for the induction of Fgf8, Fgf10, Msx1, or Bmp4. Dev Biol 231 : 47–62.
75. JiangGL, HuangS (2000) The yin-yang of PR-domain family genes in tumorigenesis. Histol Histopathol 15 : 109–117.
76. NaitzaS, PorcuE, SteriM, TaubDD, MulasA, et al. (2012) A genome-wide association scan on the levels of markers of inflammation in Sardinians reveals associations that underpin its complex regulation. PLoS Genet 8: e1002480 doi:10.1371/journal.pgen.1002480.
77. CarmelR, SpencerCA (1982) Clinical and subclinical thyroid disorders associated with pernicious anemia. Observations on abnormal thyroid-stimulating hormone levels and on a possible association of blood group O with hyperthyroidism. Arch Intern Med 142 : 1465–1469.
78. MajerusPW, WilsonDB, ZhangC, NicholasPJ, WilsonMP (2010) Expression of inositol 1,3,4-trisphosphate 5/6-kinase (ITPK1) and its role in neural tube defects. Adv Enzyme Regul 50 : 365–372.
79. GrasbergerH, Van SandeJ, Hag-Dahood MahameedA, Tenenbaum-RakoverY, RefetoffS (2007) A familial thyrotropin (TSH) receptor mutation provides in vivo evidence that the inositol phosphates/Ca2+ cascade mediates TSH action on thyroid hormone synthesis. J Clin Endocrinol Metab 92 : 2816–2820.
80. FukuyamaK, YoshidaM, YamashitaA, DeyamaT, BabaM, et al. (2000) MAPK upstream kinase (MUK)-binding inhibitory protein, a negative regulator of MUK/dual leucine zipper-bearing kinase/leucine zipper protein kinase. J Biol Chem 275 : 21247–21254.
81. JendrzejewskiJ, HeH, RadomskaHS, LiW, TomsicJ, et al. (2012) The polymorphism rs944289 predisposes to papillary thyroid carcinoma through a large intergenic noncoding RNA gene of tumor suppressor type. Proc Natl Acad Sci U S A 109 : 8646–8651.
82. DuboisF, VandermoereF, GernezA, MurphyJ, TothR, et al. (2009) Differential 14-3-3 affinity capture reveals new downstream targets of phosphatidylinositol 3-kinase signaling. Mol Cell Proteomics 8 : 2487–2499.
83. TakahashiM, SaenkoVA, RogounovitchTI, KawaguchiT, DrozdVM, et al. The FOXE1 locus is a major genetic determinant for radiation-related thyroid carcinoma in Chernobyl. Hum Mol Genet 19 : 2516–2523.
84. LandaI, Ruiz-LlorenteS, Montero-CondeC, Inglada-PerezL, SchiaviF, et al. (2009) The variant rs1867277 in FOXE1 gene confers thyroid cancer susceptibility through the recruitment of USF1/USF2 transcription factors. PLoS Genet 5: e1000637 doi:10.1371/journal.pgen.1000637.
85. TakahashiM, SaenkoVA, RogounovitchTI, KawaguchiT, DrozdVM, et al. (2010) The FOXE1 locus is a major genetic determinant for radiation-related thyroid carcinoma in Chernobyl. Hum Mol Genet 19 : 2516–2523.
Štítky
Genetika Reprodukční medicínaČlánek vyšel v časopise
PLOS Genetics
2013 Číslo 2
- Kazuistika – Perspektivy využití precizované medicíny v rámci personalizované specifické terapie onkologických pacientů
- Nobelova cena za chemii pro genetické nůžky: Objev, který změní naši budoucnost?
- Technologie na bázi RNA v klinické praxi: od přebarvených petúnií k terapii vzácných a dosud jen obtížně léčitelných chorob u lidí
- „Nepředstavovali jsme si, že náš výzkum povede přímo ke vzniku nových léků, dokonce ještě za našeho života“
- Bezplatné služby pro diagnostiku ATTRv amyloidózy pro kardiology
Nejčtenější v tomto čísle
- Complex Inheritance of Melanoma and Pigmentation of Coat and Skin in Grey Horses
- Coordination of Chromatid Separation and Spindle Elongation by Antagonistic Activities of Mitotic and S-Phase CDKs
- Autophagy Induction Is a Tor- and Tp53-Independent Cell Survival Response in a Zebrafish Model of Disrupted Ribosome Biogenesis
- Assembly of the Auditory Circuitry by a Genetic Network in the Mouse Brainstem
Zvyšte si kvalifikaci online z pohodlí domova
Mazová zátka a její řešení
nový kurzVšechny kurzy