
The Yeast SR-Like Protein Npl3 Links Chromatin Modification to mRNA Processing
Eukaryotic gene expression involves tight coordination between transcription and pre–mRNA splicing; however, factors responsible for this coordination remain incompletely defined. Here, we explored the genetic, functional, and biochemical interactions of a likely coordinator, Npl3, an SR-like protein in Saccharomyces cerevisiae that we recently showed is required for efficient co-transcriptional recruitment of the splicing machinery. We surveyed the NPL3 genetic interaction space and observed a significant enrichment for genes involved in histone modification and chromatin remodeling. Specifically, we found that Npl3 genetically interacts with both Bre1, which mono-ubiquitinates histone H2B as part of the RAD6 Complex, and Ubp8, the de-ubiquitinase of the SAGA Complex. In support of these genetic data, we show that Bre1 physically interacts with Npl3 in an RNA–independent manner. Furthermore, using a genome-wide splicing microarray, we found that the known splicing defect of a strain lacking Npl3 is exacerbated by deletion of BRE1 or UBP8, a phenomenon phenocopied by a point mutation in H2B that abrogates ubiquitination. Intriguingly, even in the presence of wild-type NPL3, deletion of BRE1 exhibits a mild splicing defect and elicits a growth defect in combination with deletions of early and late splicing factors. Taken together, our data reveal a connection between Npl3 and an extensive array of chromatin factors and describe an unanticipated functional link between histone H2B ubiquitination and pre–mRNA splicing.
Published in the journal:
. PLoS Genet 8(11): e32767. doi:10.1371/journal.pgen.1003101
Category:
Research Article
doi:
https://doi.org/10.1371/journal.pgen.1003101
Summary
Eukaryotic gene expression involves tight coordination between transcription and pre–mRNA splicing; however, factors responsible for this coordination remain incompletely defined. Here, we explored the genetic, functional, and biochemical interactions of a likely coordinator, Npl3, an SR-like protein in Saccharomyces cerevisiae that we recently showed is required for efficient co-transcriptional recruitment of the splicing machinery. We surveyed the NPL3 genetic interaction space and observed a significant enrichment for genes involved in histone modification and chromatin remodeling. Specifically, we found that Npl3 genetically interacts with both Bre1, which mono-ubiquitinates histone H2B as part of the RAD6 Complex, and Ubp8, the de-ubiquitinase of the SAGA Complex. In support of these genetic data, we show that Bre1 physically interacts with Npl3 in an RNA–independent manner. Furthermore, using a genome-wide splicing microarray, we found that the known splicing defect of a strain lacking Npl3 is exacerbated by deletion of BRE1 or UBP8, a phenomenon phenocopied by a point mutation in H2B that abrogates ubiquitination. Intriguingly, even in the presence of wild-type NPL3, deletion of BRE1 exhibits a mild splicing defect and elicits a growth defect in combination with deletions of early and late splicing factors. Taken together, our data reveal a connection between Npl3 and an extensive array of chromatin factors and describe an unanticipated functional link between histone H2B ubiquitination and pre–mRNA splicing.
Introduction
Pre-mRNA splicing is a critical step in gene expression in which non-coding introns are removed from pre-mRNA and protein-coding exons are ligated together. This process is performed by the spliceosome, a dynamic ribonucleoprotein particle that, in yeast, consists of 5 snRNAs and over 80 proteins that cooperate to recognize and splice target mRNAs [1]. Recent evidence reveals that mRNA splicing in vivo is largely co-transcriptional, and occurs while elongating RNA polymerase II (PolII) is still associated with chromatin [2]–[4]. The basic unit of chromatin is 146 base pairs of DNA wound around a histone octamer to form a nucleosome, arrays of which can be further compacted to form higher-order chromatin structure. A plethora of chromatin remodeling and histone modifying machines are now known to be integral parts of the gene expression process [5]. While much has been learned about the molecular mechanisms of pre-mRNA splicing from in vitro systems [6], a full understanding of the regulation of spliceosome assembly and catalysis will require an appreciation of the complex landscape of the chromatinized template, along which splicing occurs.
To approach this question, we built upon our recent observation that the SR-like protein Npl3 promotes efficient splicing of a large subset of genes via co-transcriptional recruitment of U1 and U2 snRNPs [7]. SR and hnRNP proteins in metazoa are best understood for their role in alternative and constitutive splicing, although they have also been implicated in additional steps in gene expression, including mRNA export, translation, and even transcription itself [8]–[10]. Despite the fact that there are few examples of alternative splicing in S. cerevisiae, this yeast contains three genes with a canonical SR protein domain structure: one or more RNA recognition motifs and a domain enriched in arginine-serine dipeptides [9], [11]. We recently demonstrated that deletion of NPL3 specifically, but not the others, impacts splicing; interestingly, the affected genes are almost exclusively those encoding ribosomal proteins, and make up the largest class of intron-containing genes in budding yeast [7]. Npl3 appears to be appropriately poised to coordinate events in gene expression: it is recruited to chromatin early during transcription [12] stimulates transcription elongation [13]–[16] co-purifies with elongating PolII [12], [14] via its interaction with the C-terminal domain [14], and remains associated with mRNA after processing is completed [17], [18].
Here, in order to understand how Npl3 might choreograph gene expression events in S. cerevisiae, we systematically analyzed genetic interactions of a strain lacking Npl3. We uncovered genetic interactions between the npl3Δ allele and genes involved in transcription and chromatin modification, including factors involved in histone H2B ubiquitination: the E3 ubiquitin ligase, Bre1 [19], [20], and corresponding ubiquitin protease, Ubp8 [21]–[23]. In addition, we show that Npl3 physically interacts with Bre1. Splicing-sensitive microarray experiments reveal that disabling the H2B ubiquitination pathway by deletion of BRE1 or UBP8, or point mutation of H2B, exacerbates the known splicing defect of an npl3Δ strain. Furthermore, we observed an Npl3-independent connection between Bre1 and splicing, as deletion of BRE1 impairs the splicing of a subset of pre-mRNAs and, in combination with deletions of individual splicing factors, causes severe synthetic growth defects. Thus, our data functionally link H2B ubiquitination by Bre1 to pre-mRNA splicing and more broadly suggest that the coordination of transcription and splicing may be aided by crosstalk between Npl3 and chromatin metabolism.
Results
A genetic link between NPL3 and chromatin modification
The SR-like protein Npl3 has multiple roles in the regulation of gene expression, including in pre-mRNA splicing, 3′ end processing, and mRNA export. To further interrogate this multifunctional factor, we used synthetic genetic array (SGA) technology [24], [25] to screen ∼4,800 non-essential yeast genes for those whose deletion conferred synthetic lethality (SL) or very synthetic sick (SS) growth phenotypes in an npl3Δ strain. Since an npl3Δ strain grows more slowly than wild-type at 30°C, and this defect is exacerbated at 37°C (e.g., see Figure 1C, top panels), we performed the screen at both temperatures to maximize coverage. The analysis revealed strong negative interactions between NPL3 and 83 (1.7% of total) and 333 (6.9% of total) genes after growth at 30°C and 37°C, respectively (see Table S1).

To validate a subset of genetic interactions identified by this high-throughput approach, we generated the cognate double mutant strains using tetrad dissection. In order to refine our list of genetically interacting factors, we included additional subunits from complexes represented in the results of the screen. A list of the most stringent synthetic interaction partners (identified in the 30°C SGA and directed genetics) was integrated with those from a previously published quantitative RNA processing Epistatic Mini Array Profile (E-MAP) [26] to generate a more comprehensive set of NPL3 SS/SL genetic interactions (Figure 1A and Materials and Methods). These negative genetic interactions were highly enriched for genes that function in RNA metabolism (Table S2), consistent with what was previously known about Npl3 function in mRNA processing [7], [12], [13], [16]–[18], [27]–[31]. In addition, there was an enrichment of genetic interactions with genes implicated in “chromosome organization” and “transcription,” including components of the chromatin remodeling SWR Complex [32]–[34], the transcriptional elongation PAF Complex [35]–[38], and multiple histone modification complexes, including COMPASS [39], SAGA [40], and the SET3 Complex [41] (Figure 1B, 1C and 1D and Table S3). We note that of these, the SWR1 and SAGA Complexes have previously been implicated in pre-mRNA splicing [42], [43], highlighting the ability of the Npl3 screen to identify factors involved in chromatin-splicing crosstalk.
The screens also showed that deletion of either RAD6 (Figure 1E cf. closed triangles) or BRE1 (Figure 1E cf. open triangles) led to synthetic sickness/lethality in an NPL3 deletion strain. These factors catalyze the mono-ubiquitination of lysine 123 on histone H2B; specifically, Bre1 is the E3 ubiquitin ligase and Rad6 is its corresponding E2 ubiquitin-conjugating enzyme [19], [20], [44], [45]. We found that inactivating Bre1 ubiquitin ligase activity via a point mutation in its RING domain (bre1H665A) [19] exacerbated the growth defect of an npl3Δ strain to the same extent as a full deletion of BRE1 (Figure 1E, cf. orange triangles), suggesting that the genetic interaction is connected to the ligase activity of Bre1. Many nuclear enzymes act not only on histones but on other substrates as well, and, in fact, histone H2B is not the only ubiquitination target of Bre1 [46]. To ask whether the Npl3-Bre1 genetic interaction is due to the loss of H2B ubiquitination specifically, we tested whether a mutation of the target residue in H2B would phenocopy a deletion of BRE1. Indeed, the htb1K123R point mutant also profoundly exacerbated the growth defect of npl3Δ (Figure 1E cf. purple triangles). Taken together, these data provide strong evidence that H2B ubiquitination can account for the genetic interaction of the RAD6 Complex with NPL3.
The PAF Complex and COMPASS have previously been shown to function in the same histone modification pathway as the Bre1 [47]–[50]. The PAF Complex is required for H2B ubiquitination [49], [50]; thus, the synthetic lethality we observed between NPL3 and components of the PAF Complex (Figure 1C and 1D) was consistent with the genetic interactions we observed with the Bre1. H2B ubiquitination is, in turn, required for trimethylation of histone H3 lysine 4 (H3K4) by COMPASS [39], [51]–[53] and lysine 79 (H3K79) by Dot1 [54]–[57]. However, we found no genetic interaction between NPL3 and point mutations of H3K4 or H3K79 (data not shown), suggesting that loss of these chromatin marks is unlikely to underlie the synthetic sickness in the npl3Δbre1Δ double mutant.
Given that maintaining H2B ubiquitination is critical in the absence of NPL3, it follows that mutations in genes required for the removal of this chromatin mark might suppress the npl3Δ growth defect. To investigate this in an unbiased fashion, we made use of the fact that NPL3 deletion causes lethality when yeast are grown at 16°C (e.g., see Figure 2B, top panel); this allowed us to screen for mutants that restore growth to an npl3Δ strain at 16°C. This screen identified 105 (2.1% of total) and 699 (14.4% of total) suppressors after 4 and 8 days of growth, respectively (Table S4), and a number of these suppressors have previously been implicated in transcription and chromatin modification (Figure 2A). We then generated a number of the double mutants using tetrad dissection and validated the suppressive genetic interactions using serial dilution (Figure 2B). In agreement with our expectation, the data from this screen showed that deletion of UBP8, which encodes an H2B de-ubiquitinase [21]–[23], restored viability to a strain lacking Npl3 (Figure 2B cf. closed triangles). In further support of these observations, the SGA also identified SGF11 and SGF73 as genes whose deletion suppresses npl3Δ; these factors are part of a module of the SAGA Complex with Upb8, and are also implicated in gene activation by H2B de-ubiquitination [21], [58]–[61]. Taken together, this dataset shows that the npl3Δ strain is particularly sensitive to deletion of genes affecting the H2B ubiquitination pathway (Figure 1 and Figure 2) and opens the possibility that H2B ubiquitination is important for an Npl3-dependent process.

Interestingly, deletions of genes in other modules of SAGA required for either histone acetylation (Ada2 and Gcn5) or for association of the SAGA complex with promoters (i.e., the TBP regulatory module, Spt3 and Spt8; reviewed in [62]) exacerbated, rather than suppressed, the npl3Δ growth defect (Figure 1C and Table S1). The divergent genetic interactions confirm the functionally separable nature of the SAGA sub-modules [58] and highlight that a connection exists between Npl3 and H2B mono-ubiquitination that is functionally distinct from other chromatin marks.
Npl3 physically interacts with Bre1
Given the robust genetic interactions we observed between NPL3 and genes involved in H2B ubiquitination, we performed co-immunoprecipitation assays of the corresponding proteins to test if they physically interact. We had previously shown that Npl3 co-immunoprecipitated components of the U1 snRNP [7]. Here, we immunoprecipitated endogenous Npl3 from whole-cell extract using a polyclonal antibody directed against Npl3 [63] and then probed the precipitate for endogenously tagged forms of Bre1, Ubp8, and Sgf11 as well as positive and negative controls (a U1 protein, Luc7, and Nup188, respectively). Although there is precedent for some interaction specificity with the E3 Bre1 over the E2 Rad6 [46], we also tested for an interaction with Rad6. As shown in Figure 3, only Bre1 and Luc7 but not Nup188, Rad6, Ubp8 or Sgf11, co-immunoprecipitated with Npl3.

It is known that Npl3 is an RNA-binding protein, and its interaction with some components of the splicing machinery is RNA-dependent [7]. To test whether the observed interaction with Bre1 is mediated by RNA, we treated the extracts with RNaseA prior to the immunoprecipitation. We consistently found that a population of Bre1 interacts with Npl3 in an RNase-independent manner (Figure 3 cf. lanes 3 and 4, top panel). These data indicate that Npl3 can physically interact with Bre1, consistent with previous data from high-throughput proteomic analyses [64].
Deletion of BRE1 or UBP8 exacerbates the npl3Δ splicing defect
The genetic data connecting NPL3 and the H2B ubiquitination machinery lend support for two possible models. One model predicts that Npl3 will affect H2B ubiquitination; we therefore measured the global percentage of ubiquitinated H2B but found the npl3Δ strain indistinguishable from wild-type (Figure S1). An alternative interpretation of the genetic data is that the H2B ubiquitination cycle is important for an Npl3-dependent process. We previously reported [7] that a strain lacking Npl3 accumulates a subset of pre-mRNAs, consisting primarily of the ribosomal protein genes (RPGs), whose splicing efficiency might be expected to affect growth rate. Given that deletion of BRE1 exacerbates the npl3Δ growth defect, we tested whether deleting BRE1 exacerbates the npl3Δ splicing defect.
We used our splicing-sensitive microarray platform [65], which contains oligos that hybridize to the terminal exon, the intron, and the exon-exon junction of each intron-containing gene, in order to detect total mRNA, pre-mRNA, and mature mRNA, respectively (Figure 4A). For each genotype, the heat map (Figure 4B) reports fold changes in signal intensity of these three RNA species for each intron-containing gene as compared to a wild-type strain. As expected, our experiments showed that a strain lacking Npl3 accumulated RPG pre-mRNAs (Figure 4B npl3Δ, see yellow in Intron feature; RPGs highlighted in purple on right). Notably, the pre-mRNA accumulation in the npl3Δ strain was increased at many RPGs when BRE1 was also deleted (Figure 4B cf. npl3Δ and npl3Δbre1Δ, Intron feature), suggesting that Bre1 is important for the splicing of many Npl3-dependent genes. We note that this effect is complex, and is accompanied by changes in total mRNA (Figure 4B cf. npl3Δ and npl3Δbre1Δ, Exon feature). Because both Npl3 and Bre1 have been shown to have effects on transcription itself [13]–[16], [66]–[68], we normalized for changes in exon level by calculating an Intron Accumulation Index [69] (see Materials and Methods) for each intron-containing gene (Figure S2 and Table S5). The histogram of genes with an Intron Accumulation Index of greater than 0.3 (Figure 4C), shows that even when normalized for changes in transcript levels, the total number of genes with a splicing defect, as well as the severity of the defect, is increased in the npl3Δbre1Δ strain as compared to npl3Δ alone.
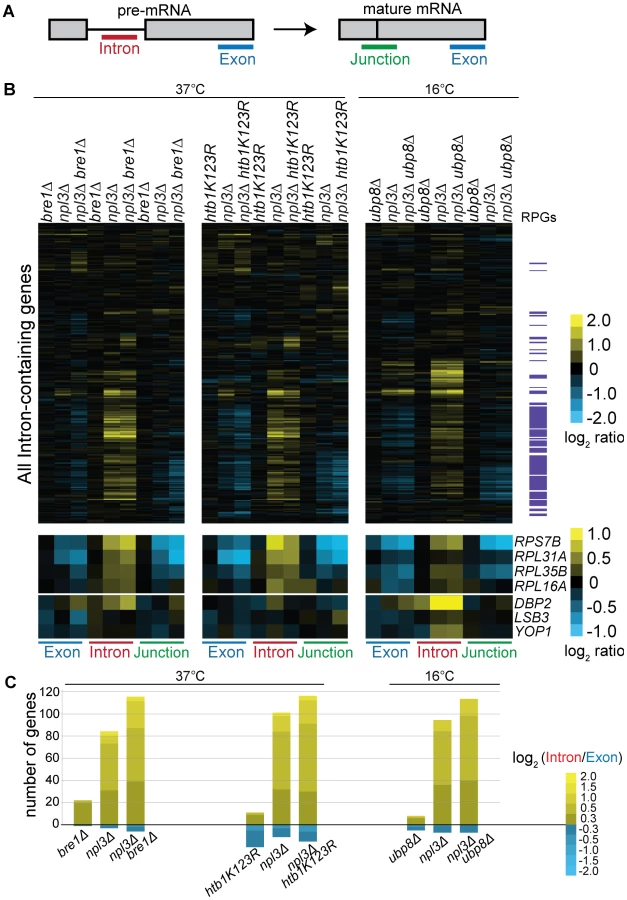
We also found that in the presence of wild-type Npl3, a strain lacking BRE1 has a mild but reproducible splicing defect (Figure 4B, bre1Δ –shown is an average of 5 biological replicates). While the majority of pre-mRNAs are not affected by the deletion of BRE1, a small subset of pre-mRNAs accumulates in bre1Δ at 37°C (Figure 4B, e.g., DBP2, LSB3, YOP1). This suggests that Bre1 has a role in pre-mRNA splicing, independent of the sensitivity caused when NPL3 is deleted. This finding was confirmed when we calculated Intron Accumulation Indices for a strain lacking BRE1: a small number of genes exhibit defective splicing in the bre1Δ strain (Figure 4C and Figure S2). We validated these splicing defects for several genes using a qPCR assay (Figure S3). The lack of a significant growth defect in the bre1Δ strain (Figure 1E) is consistent with the idea that yeast can tolerate a modest splicing defect at a small number of non-RPGs.
If the splicing defect exacerbation we observed with npl3Δbre1Δ was due to loss of H2B ubiquitination, we would then expect this exacerbation to be phenocopied by a strain with the H2B lysine to arginine point mutant used earlier (Figure 1E). We did, in fact, find that the htb1K123R point mutation exacerbated the splicing defect observed in the npl3Δ mutant at many genes (Figure 4B), further implicating the ubiquitination of H2B in splicing. This is also evident when normalizing for the changes in exon levels in the npl3Δhtb1K123R strain (Figure 4C). In plotting the Intron Accumulation Index values of this strain, we find that the subset of affected genes overlaps extensively with the subset of genes affected in the npl3Δbre1Δ double mutant (Figure S2).
We have shown that deletion of UBP8 partially suppresses the npl3Δ growth defect, and this is most pronounced at 16°C (Figure 2B). We therefore tested whether deleting UBP8 would suppress the splicing defect of a strain lacking Npl3, as predicted by the genetic interaction. Surprisingly, deletion of UBP8 instead exacerbated the splicing defect observed in the npl3Δ strain (Figure 4B cf. npl3Δ and npl3Δubp8Δ), implying that the growth suppression is related to some other function of Npl3. Notably, however, these microarray results indicate that in the absence of Npl3, the complete cycle of H2B ubiquitination and de-ubiquitination is required for efficient splicing.
To begin to investigate how Bre1 affects splicing, we used chromatin immunoprecipitation (ChIP) to test the prediction that Bre1 is required for association of the splicing machinery. However, we did not observe a significant Bre1-dependent decrease in U1 (Prp42), Mud2, or U2 (Lea1) association with genes whose splicing was inhibited in bre1Δ or npl3Δbre1Δ strains (data not shown), suggesting an alternative mechanism by which Bre1 modulates splicing (see discussion).
Synthetic sickness between BRE1 and early and late splicing factors
In light of our data showing that a bre1Δ strain exhibited a mild splicing defect, we carried out directed genetic analyses to test for interactions between BRE1 and genes encoding other splicing factors, particularly those that genetically interact with Npl3 [7]. Just like a deletion of NPL3, deleting BRE1 caused synthetic sickness when combined with deletion of NAM8 (U1 snRNP), MUD2, LEA1 (U2), or SNU66 (U5), further connecting Bre1 functionally with splicing (Figure 5A). Interestingly, the growth of the bre1Δ strain was also compromised by deletion of the U2 snRNP component CUS2, which does not genetically interact with npl3Δ [7]. Thus, although we approached these experiments through the lens of Npl3, these genetic observations provide further support that Bre1 has independent interactions with the splicing machinery. Consistent with a lack of splicing defect upon UPB8 deletion, we and others generally did not observe genetic interactions between UBP8 and early or late splicing factors (Figure 5B and [70]). There is one notable exception however; deletion of UBP8 suppressed the snu66Δ cold-sensitive growth defect (Figure 5B). Taken together, these data highlight the fact that the H2B ubiquitination pathway is linked to splicing, even in the presence of wild-type Npl3.

Discussion
While the textbook view of gene expression presents transcription, pre-mRNA processing, export, and translation as independent events, they appear to be closely coordinated in the cell. Discerning the mechanism of this coordination within the broader program of gene expression presents a daunting experimental challenge. In multicellular eukaryotes, SR and hnRNP proteins are thought to regulate gene expression, in part, by integrating mRNA biogenesis steps [9], [10], [71]–[73]. In budding yeast, Npl3 has numerous roles, but is the only such protein that affects splicing [7]. Our lab and others have shown that Npl3 facilitates the co-transcriptional recruitment of early splicing factors to nascent transcripts [7] and itself associates with elongating polymerase [12], [14]. Therefore, we approached this complex problem by conducting a systematic screen of non-essential genes to define the interacting partners of this potential coupling factor.
We found that Npl3 genetically interacts with a number of genes implicated in chromatin metabolism and transcription. We further characterized one set of interacting factors, namely those involved in histone H2B ubiquitination, in what is, to our knowledge, the first set of genome-wide splicing experiments on histone modifier mutants in S. cerevisiae. Using splicing-sensitive microarrays, we showed that Npl3 links the H2B ubiquitination cycle to the splicing efficiency of many transcripts. The connection between H2B ubiquitination and splicing also exists independently of Npl3, as a strain lacking BRE1 exhibits both a mild splicing defect and genetic interactions with deletions of genes encoding early and late splicing factors. Finally, the full complement of genetic interactions we describe (Figure 6) provides multiple entry points for future investigation into the coupling of chromatin modification and mRNA processing.

An Npl3-dependent role for the histone H2B ubiquitination cycle in pre–mRNA splicing
Our genetic screens revealed that a number of Npl3 genetic interactions center on the histone H2B ubiquitination cycle. Specifically, mutant strains that lack wild-type levels of ubiquitinated H2B (rad6Δ, bre1Δ, lge1Δ, htb1K123R, paf1Δ, cdc73Δ, and leo1Δ) exacerbate the growth defect of an npl3Δ strain at all temperatures tested (Figure 1). We also observed a physical interaction between Npl3 and Bre1 by co-immunoprecipitation (Figure 3) and showed that the splicing defect caused by deletion of NPL3 is exacerbated by the additional deletion of BRE1 or mutation of H2B (htb1K123R), thus implicating H2B lysine 123 mono-ubiquitination in splicing (Figure 4). We previously demonstrated that Npl3 primarily affects the splicing of RPGs [7]; here, we see that in the sensitized background of a strain in which RPG splicing is made limiting (npl3Δ), the histone H2B ubiquitination cycle is an important contributor to RPG splicing.
Recent studies have shown that deletion of components of the cap-binding complex (CBC) or commitment complex causes defective splicing of the SUS1 pre-mRNA [70], [74]. Sus1 is a recently discovered component of the histone de-ubiquitination module of SAGA [75] and if the SUS1 transcript is not properly spliced, it leads to elevated levels of ubiquitinated H2B. Given the physical [29], [76] and genetic (Table S1 and [76]) connections between Npl3 and the CBC, we sought to determine whether Npl3 also affects SUS1 splicing and, therefore, H2B ubiquitination. However, Hossain, et al. have recently shown that deletion of NPL3 has no effect on SUS1 splicing [74], a result we independently confirmed in our npl3Δ strain (Figure S4). Furthermore, we extended this analysis and determined that, unlike in cbcΔ strains, global levels of ubiquitinated histone H2B are not discernibly altered in the npl3Δ strain (Figure S1). While we cannot rule out a change in the dynamics of the ubiquitination cycle or gene-specific effects, our microarray results support a model in which the full histone ubiquitination cycle promotes RPG splicing, a process that becomes critical in the absence of NPL3. Along these lines, it is noteworthy that data from Schulze et al. and Shieh et al. have revealed that chromatin over these genes is enriched for ubiquitinated H2B [77], [78].
We also identified suppressive genetic interactions between NPL3 and genes responsible for removal of ubiquitin from H2B (ubp8Δ, sgf11Δ, and sgf73Δ), suggesting that H2B de-ubiquitination is also linked to Npl3 function. Surprisingly, however, deletion of UBP8 did not suppress the splicing defect in npl3Δ, but rather exacerbated it (Figure 4). Thus, it seems the positive genetic interaction may be due to Ubp8 involvement in a splicing-independent function of Npl3.
The exacerbation seen in the microarray experiments shows that both halves of the cycle of H2B ubiquitination and de-ubiquitination are required for optimal splicing, as is the case for transcriptional activation [23]. Likewise, both halves of the H3 acetylation and deacetylation cycle, performed by Gcn5 and Hos2/3, respectively, promote spliceosome assembly at the ECM33 gene [43], [79]. Thus, these two examples point to a general function of dynamic histone modification cycles in maintaining fine control over co-transcriptional splicing, and may explain the synthetic lethality we observed between NPL3 and the acetylation module of the SAGA Complex (Figure 1C and Table S1).
An Npl3-independent role for Bre1 in pre–mRNA splicing
We found that even in the presence of wild-type NPL3, Bre1 has genetic connections to the splicing machinery as a whole. Specifically, we found that deletion of BRE1 causes growth defects in early and late splicing factor deletion backgrounds (particularly at extreme temperatures; Figure 5, 16°C and 37°C), which alone show little to no growth defect. These negative genetic interactions can indicate two alternative but not mutually exclusive models for a functional relationship between the H2B ubiquitination and splicing machineries. One model is based on the fact that deletion of specific splicing factors is known to increase the levels of ubiquitinated H2B [74], a phenotype that should be relieved by deletion of BRE1, the sole H2B ubiquitin ligase [19], [20]. Because this model predicts an epistatic or positive genetic interaction between BRE1 and the genes that encode splicing factors, the negative genetic interactions that we actually observe (Figure 5 and [70]) require an alternative model, perhaps one in which the growth defects are due to poorer overall splicing efficiency in these strains. Indeed, deletion of BRE1 alone caused a modest but reproducible splicing defect, seen in the microarray in Figure 4. A large fraction of Bre1-dependent splicing events involve non-RPGs, and thus define a distinct role for Bre1 in splicing, apart from Npl3. Shieh et al. [78] recently found that the pattern of this modified histone at non-RPGs shows a remarkable demarcation of intron/exon structure: low levels in the intron, followed by a marked increase at the intron – exon boundary. While the functional significance of this pattern of H2B ubiquitination is unknown, we propose that it may be relevant for the splicing of non-RPGs, as gauged by the splicing defect in a strain that no longer has this mark.
We note that the single mutant htb1K123R has a milder splicing defect than the bre1Δ strain (Figure 4C and Figure S2), opening the possibility of an additional role of Bre1 in splicing that is independent of H2B ubiquitination. Indeed, Bre1-dependent ubiquitination of Swd2, a protein in both COMPASS and the Cleavage and Polyadenylation Stimulatory Factor complex [46], has been shown to regulate mRNA export from the nucleus [80]. Npl3 has previously been implicated in mRNA export [17], [18], [27], [28] in a strain background where Npl3 is an essential protein. However, our data argue against the possibility that the genetic interactions we observed here are due to an adverse effect on mRNA export. In the present strain background (S288C), in which Npl3 is non-essential, the npl3Δ strain does not exhibit the nuclear localization of bulk poly-adenylated mRNA characteristic of an export defect (Figure S5); nor does further deletion of BRE1 in an npl3Δ strain cause an export defect (Figure S5). Furthermore, we found that the npl3S411A phosphorylation mutation, which blocks 3′ end formation [13], [14] and mRNA export [17], does not cause a block in pre-mRNA splicing (Figure S6). This argues against the reported splicing defects being the indirect result of feedback from these downstream defects in mRNA processing.
We tested the prediction that Bre1, like Npl3, promotes spliceosome recruitment, but found that deletion of BRE1 did not affect the association of U1 (Prp42), Mud2, or U2 (Lea1) with chromatin at genes whose splicing is dependent on Bre1 (data not shown). It may be that H2B ubiquitination is required for the recruitment of a later splicing factor or, as the H2B ubiquitination cycle regulates PolII passage through a gene [66], [81], it is possible that disruption of this cycle causes a subtle alteration of spliceosome dynamics that is not observable by ChIP. Furthermore, we cannot rule out the possibility that Bre1 has a ubiquitination target within the spliceosome or even ubiquitinates Npl3 itself.
Both splicing and mRNA processing are largely co-transcriptional processes in eukaryotes, from yeast [2] to human [82]–[84]. Our survey of NPL3 genetic interactions has revealed a multitude of chromatin-connected factors with potential links to splicing and mRNA processing; overall, these results are thus consistent with an “integrator” role for Npl3 in gene expression (Figure 6). Our data provide a basis for the further study of the coupling of SR/hnRNP-dependent mRNA processing and transcription within a chromatin context, and have led to the discovery of Npl3-dependent and independent roles for Bre1 and histone H2B ubiquitination in splicing.
Materials and Methods
A list of strains used and further strain construction details are available in Table S6.
Synthetic genetic array
Unless otherwise indicated, yeast were grown as described in [85]. The npl3Δ::NatNT2 “magic marker” query strain used in the SGA was YTK232D, and was previously used in [26]. YTK232D was generated using techniques outlined in [86]. Briefly, the NPL3 open reading frame was replaced with NatNT2 via integration of a PCR product generated with primers (5′ - TACTTTTGAAGGAATCAAAATTAAGCAATTACGCTAAAACCATAAGGATAACATGGAGGCCCAGAATACCC-3′) and (5′-GTTTTAAAACAATTCATATCTTTTGTTAATTTCTCCTTTTTTTTTCTCAACCAGTATAGCGACCAGCATTC-3′) into the SGA diploid strain [87]. The diploid was sporulated and the MATα npl3Δ::NatNT2 query strain was isolated by tetrad dissection, followed by re-selection of magic markers on SD medium lacking leucine and arginine but containing canavanine, s-AEC, and clonNAT [SD - LEU/ARG+100 µg/mL canavanine+100 µg/mL S-(2-Aminoethyl)-L-cysteine hydrochloride+100 µg/mL clonNAT]. The NPL3 deletion was confirmed by PCR, and by Western blot for the absence of Npl3 using an α-Npl3 antibody [63].
The Synthetic Genetic Array was performed as described in [24] with the following exceptions: Here the npl3Δ query strain (YTK232D) was mated to the MATa KanMX-marked deletion collection (OpenBiosystems: www.openbiosystems.com; formerly Research Genetics, Huntsville, AL). The collection was arrayed in duplicate in 384-well colony format using automated pinning (Colony Arrayer) and grown at 30°C for 2 days. Mating was carried out at 30°C for 2 days. Sporulation was carried out at 30°C for 7 days. MATa double mutants were selected on SD medium lacking histidine and arginine but containing canavanine, S-AEC, G418, and clonNAT [SD - HIS/ARG+100 µg/mL canavanine+100 µg/mL S-(2-Aminoethyl)-L-cysteine hydrochloride+150 µg/mL G418 and 100 µg/mL clonNAT]. Double mutant arrays were re-pinned in replicate and photographed after the following incubations: 30°C for 5 days, 37°C for 5 days, or at 16°C for 4 and again after 8 days. Photographs were visually inspected for growth at 16°C (to identify suppressive interactions) or lack of colony growth at 30°C or 37°C (to identify synthetic lethal interactions).
Directed genetics
The npl3Δ::NatNT2 strain used for directed genetics (YTK234D) was previously used in [7]. Unless otherwise indicated, YTK234D was crossed to a series of MATa KanMX4-marked deletion strains; diploids were selected by plating on YPD plates+100 µg/mL clonNAT+150 µg/mL G418. Double mutants were isolated by tetrad dissection or random sporulation, as indicated in Table S6. All single mutants were validated by PCR for the knockout chromosome prior to crossing to YTK234D. The HTB1-WT (WHY334) and htb1-K123R (WHY326) strains contain htb2Δ::HygX4l and the indicated htb1 allele as the sole copy of H2B (gifts from W. Hwang and H. Madhani). They were mated as above, except the diploid strains were selected on YPD+100 µg/mL hygromycin+100 µg/mL clonNAT. Because the htb1 allele is unmarked, the final npl3ΔHTB1 and npl3Δhtb1K123R strains were confirmed by sequencing the HTB1 gene and Western blot for the Npl3 protein. Genetic interactions with the bre1H665A allele were analyzed using a set of plasmids provided by the Shilatifard lab [19], designed to complement a bre1Δ allele. Complementation was achieved by plasmid transformation into YM1740 (bre1Δ) or YTK391B (npl3Δbre1Δ), which were maintained on SD -LEU plates.
The bre1Δ::NatNT2 (EMy32) and ubp8Δ::NatNT2 (EMy442) strains were created by replacement of the endogenous ORF with NatNT2, as described in [86]. These strains were subsequently mated to nam8Δ, mud1Δ, mud2Δ, syf2Δ, and snu66Δ (for bre1Δ), and lea1Δ (for bre1Δ and ubp8Δ) from the deletion collection and double mutants were isolated via tetrad dissection. For the rest of the ubp8Δ genetics, the ubp8Δ::KanMX4 strain from the deletion collection was mated to MATα NAT-marked “magic marked” splicing factor deletion strains. These splicing factor deletion strains were made by replacing the KanMX-marked ORFs with NatNT2, followed by crossing to a “magic marked” wild-type (YTK609) to isolate “magic marked” NAT-marked MATα spores. The ubp8Δ::KanMX4 strain was mated to each NAT-marked splicing factor deletion strain and MATa double mutants were isolated by tetrad dissection followed by selection on SD medium lacking histidine and arginine but containing canavanine, S-AEC, G418, and clonNAT [SD - HIS/ARG+100 µg/mL canavanine+100 µg/mL S-(2-Aminoethyl)-L-cysteine hydrochloride+150 µg/mL G418 and 100 µg/mL clonNAT].
For individual growth assays, log-phase yeast were diluted to OD600 = 0.1, spotted onto YPD plates (unless specifically mentioned) in a 5-fold dilution series and grown at the indicated temperatures. For each cross, growth of the double mutant was confirmed for ≥2 double mutant isolates, and a representative isolate is shown. The single mutants and wild-type strains shown are either parental strains, or were re-isolated from tetra-type tetrads. The bre1H665A and BRE1 strains were serially diluted onto SD –LEU plates.
Process and complex analyses
We sought to integrate the diverse sources of genetic interaction information available to us in order to create a comprehensive dataset for statistical analyses. Because the stronger synthetic interactions were identified in the 30°C SGA, we began with this list of genes whose deletion caused lethality in combination with npl3Δ (see Table S1 – 30°C) and added genes identified as causing markedly decreased growth, as gauged by serial dilution, or lethality, as gauged by loss of double mutant spore after tetrad dissection (Figure 1C, 1D, 1E and Table S1). We further added to this list genes identified as synthetic sick or lethal in the E-MAP [26] i.e., having a genetic interaction score of ≤−2.5.
Biological process definitions were obtained from the Gene Ontology annotations maintained at SGD [88] on April 15th 2012. Forty-five high-level (GO Slim) terms were used and are included in Table S7. Protein complex definitions were obtained from a manually curated list, CYC2008 [89], and augmented with the RAD6 Complex (RAD6, BRE1, LGE1), which was not annotated when the list was created. A hypergeometric test was used to identify complexes and processes that were significantly enriched with genetic interactions. Complex enrichment p-values were corrected for multiple testing using the empirical re-sampling method of Berriz et al. [90] (as 409 complexes were assessed for enrichment), while process enrichment p-values were corrected for using the simpler Bonferoni correction. The results of the these analyses are included in Table S2 (by process) and Table S3 (by complex). The network diagram in Figure 1B was drawn using Cytoscape [91]. For Figure 1B, complexes were referred to by their more common names. The Figure 2A diagram was created to highlight a subset of suppressive interactions identified in the 16°C SGA and the full list of suppressors is available in Table S4.
Co-immunoprecipitation
Co-immunoprecipitation assays were performed as in [7] with extracts from the indicated GFP-tagged or HA-tagged strains. The Nup188-HA strain contains a plasmid encoding Nup188-3XHA. The other strains were tagged endogenously. Briefly, samples were separated by 10% SDS-PAGE and probed by Western blot with either monoclonal α-GFP (Roche 1814460), α-HA (12CA5; Roche 11583816001), or polyclonal α-Npl3 antibodies [63]. Total samples equivalent to 1/60th of the input were analyzed in parallel.
Microarrays
Cultures were grown according to standard techniques [85] in rich medium supplemented with 2% glucose. Strains were cultured overnight to saturation and diluted to OD600 = 0.1 in the morning. The strains were allowed to grow at 30°C until reaching mid-log phase (OD600 = 0.5–0.7), at which point they were collected (for Figure S6), or rapidly shifted to either 37°C for 30 minutes or 16°C for 2.5 hours, as indicated. Cultures were collected by centrifugation and snap frozen in liquid nitrogen. Total cellular RNA was isolated using hot acid phenol followed by isopropanol precipitation, as outlined in [92] but with modifications detailed in [93]. cDNA from each strain was synthesized, and labeled with Cy3 or Cy5 according to the low-throughput sample preparation method described in [65].
The optimized oligos listed in [65] were robotically arrayed onto poly-L-lysine coated glass slides (slides from ThermoScientific C40-5257-M20) and slides were processed using the protocols detailed in [65], [94] Each biological replicate contains 6 technical replicates for each feature as well as dye-flipped replicates. Microarrays were scanned using Axon Instruments GenePix 4000B at 635 nm and 532 nm wavelengths and image analysis was done using Axon Instruments GenePix Pro version 5.1. Spots were manually removed from analysis if they contained obvious defects or uncharacteristically high background; the ratio of the median intensities for 535 nm and 625 nm was calculated for each remaining spot. Technical replicate spots and dye flipped replicates were combined and normalized as in [65]. The resulting log2-transformed values for each feature were averaged over 2–5 biological replicates. Averaged data were subjected to hierarchical clustering using average linkage, and uncentered Pearson correlation as the similarity metric using Cluster 3.0 [95]. Resulting heat maps in Figure 4, Figure S2, and Figure S6 were created using Java Treeview [96]. To normalize for changes in total expression evident in the microarrays, Intron Accumulation Indices (IAI) were calculated for each intron containing gene as in [69]; specifically, we calculated log2(Intronmutant/IntronWT)-log2(Exonmutant/ExonWT) for each gene. The IAI heat map is shown in Figure S2. These values were converted into a histogram for Figure 4 using the following cutoffs: −0.3≥IAI≥0.3.
Dt50 Fluorescent In Situ Hybridization
The dT50 assay was performed based on the protocol outlined in [97] with the following modifications. Specifically, 2 mL cultures were fixed in 5% formaldehyde for 1.5 hours after having reached OD600 = 0.2–0.3. Cells were washed 4 times in wash buffer (100 mM Potassium Phosphate, 1.2 M Sorbitol) before a 40-minute treatment with 27 µg zymolyase at 37°C. An additional fixation was performed in 8% paraformaldehyde in PBS+10 mM MgCl2 and spheroplasted cells were applied to poly-lysine-treated chamber slides (LabTek 178599). Attached cells were treated with ice-cold methanol (−20°C) and allowed to dry. Hybridization to digoxin-conjugated dT50 oligo in blocking buffer was performed at 37°C overnight. Chambers were washed with 2× (20 minutes), 1× (20 minutes) and 0.5× SSC (10 minutes at 37°C) before a 30-minute incubation with FITC - conjugated anti-Digoxin Fab fragments (Roche 1207741) in blocking buffer (1∶25 dilution, 37°C). Antibody was aspirated and three 5-minute washes of PBS +10 mM MgCl2 were performed. Chambers were treated with 0.5 mg/mL DAPI for 2 minutes and slides were mounted using ProLong Gold Antifade Reagent (Invitrogen P36934) according to manufacturer instructions. Slides were visualized using an Olympus BX60 microscope equipped with FITC HiQ and DAPI HiQ Filters (Chroma Technology Corporation). The assay was performed on two biological replicates and representative images are shown. Specificity of the probe and FITC labeling was determined by incubation with hybridization mix lacking probe (data not shown).
Sus1 Splicing Assay
SUS1 splicing efficiency was measured essentially according to the non-radioactive protocol described in [74]. Specifically, 10 µg RNA from cultures grown at 30°C was treated with DNaseI (Promega) and RNA was converted to cDNA using 1 µg SUS1 Reverse primer [70]. cDNAs were diluted 1∶200 and 10 µL was used in a 25 µL PCR (BioRad iProof) with SUS1-specific primers [70]. 25 cycles of PCR were performed and the resulting products were separated on an 8% polyacrylamide gel. Gels were stained using SybrGold and bands were quantified using an AlphaImager HP camera and software. 2–3 technical replicates of 2 biological samples were performed. Shown are a representative gel and the average and standard deviations of all technical replicates. A no-Reverse Transcriptase control was performed for each sample and none showed amplification (data not shown).
H2b Ubiquitination Western Blot
A TCA precipitation was performed on strains grown at 30°C [98] and samples were run on a 15% SDS polyacrylamide gel and transferred to PVDF membrane. Membrane was blocked using Li-Cor blocking buffer, followed by incubation of a 1∶1000 dilution of α-H2B antibody (Active Motif 39237) overnight at 4°C. Visualization of bands was achieved with a secondary antibody conjugated to infrared dye (LI-COR 926-32211). The membrane was scanned using the LI-COR Odyssey scanner and software. Shown is a representative Western blot. The assay was performed with 3 biological replicates and shown are the average and standard deviation of the three replicates.
Qpcr Assay
RNA was extracted as described above from strains grown under the same conditions as for the microarray experiment. Five µg RNA were treated with DNaseI (Promega) before being primed with random 9-mers and reverse transcribed. Samples were diluted as necessary and 10 µL were used in each qPCR. qPCRs were run on a C1000 ThermoCycler (BioRad) with an annealing temperature of 55°C. Each qPCR run was finished with a melt curve to determine the homogeneity of the amplified product. Starting quantity was calculated using a standard curve for each primer set. 2–4 technical replicates were performed for 1–5 biological replicates. Error bars represent standard deviation for biological replicates. For samples with 1 biological replicate, standard deviation of technical replicates is shown with uncapped error bars (Figure S3). A no-Reverse Transcriptase control was also generated for each RNA sample and these samples yielded negligible amplification (data not shown). Primers used in the qPCR are listed in Table S8. Each gene was measured using intron - and exon - specific primer sets. The Intron/Exon ratio for each mutant was normalized to its corresponding wild-type before averaging.
Supporting Information
Zdroje
1. JuricaMS, MooreMJ (2003) Pre-mRNA splicing: awash in a sea of proteins. Mol Cell 12 : 5–14.
2. OesterreichFC, PreibischS, NeugebauerKM (2010) Global Analysis of Nascent RNA Reveals Transcriptional Pausing in Terminal Exons. Mol Cell 40 : 571–581.
3. ChurchmanLS, WeissmanJS (2011) Nascent transcript sequencing visualizes transcription at nucleotide resolution. Nature 469 : 368–373.
4. AlexanderRD, InnocenteSA, BarrassJD, BeggsJD (2010) Splicing-Dependent RNA Polymerase Pausing in Yeast. Mol Cell 1–12.
5. LiB, CareyM, WorkmanJL (2007) The Role of Chromatin during Transcription. Cell 128 : 707–719.
6. WahlMC, WillCL, LührmannR (2009) The Spliceosome: Design Principles of a Dynamic RNP Machine. Cell 136 : 701–718.
7. KressTL, KroganNJ, GuthrieC (2008) A single SR-like protein, Npl3, promotes pre-mRNA splicing in budding yeast. Mol Cell 32 : 727–734.
8. SinghR, ValcarcelJ (2005) Building specificity with nonspecific RNA-binding proteins. Nat Struct Mol Biol 12 : 645–653.
9. LongJC, CaceresJF (2009) The SR protein family of splicing factors: master regulators of gene expression. Biochem J 417 : 15.
10. DreyfussG, KimVN, KataokaN (2002) Messenger-RNA-binding proteins and the messages they carry. Nat Rev Mol Cell Biol 3 : 195–205.
11. ManleyJL, KrainerAR (2010) A rational nomenclature for serine/arginine-rich protein splicing factors (SR proteins). Genes Dev 24 : 1073–1074.
12. LeiEP, KrebberH, SilverPA (2001) Messenger RNAs are recruited for nuclear export during transcription. Genes Dev 15 : 1771–1782.
13. BucheliME, BuratowskiS (2005) Npl3 is an antagonist of mRNA 3′ end formation by RNA polymerase II. EMBO J 24 : 2150–2160.
14. DermodyJL, DreyfussJM, VillénJ, OgundipeB, GygiSP, et al. (2008) Unphosphorylated SR-like protein Npl3 stimulates RNA polymerase II elongation. PLoS ONE 3: e3273 doi:10.1371/journal.pone.0003273.
15. LundMK, KressTL, GuthrieC (2008) Autoregulation of Npl3, a yeast SR protein, requires a novel downstream region and serine phosphorylation. Mol Cell Biol 28 : 3873–3881.
16. WongCM, QiuH, HuC, DongJ, HinnebuschAG (2007) Yeast Cap Binding Complex Impedes Recruitment of Cleavage Factor IA to Weak Termination Sites. Mol Cell Biol 27 : 6520–6531.
17. GilbertW, SiebelCW, GuthrieC (2001) Phosphorylation by Sky1p promotes Npl3p shuttling and mRNA dissociation. RNA 7 : 302–313.
18. GilbertW, GuthrieC (2004) The Glc7p nuclear phosphatase promotes mRNA export by facilitating association of Mex67p with mRNA. Mol Cell 13 : 201–212.
19. WoodA, KroganNJ, DoverJ, SchneiderJ, HeidtJ, et al. (2003) Bre1, an E3 ubiquitin ligase required for recruitment and substrate selection of Rad6 at a promoter. Mol Cell 11 : 267–274.
20. HwangWW, VenkatasubrahmanyamS, IanculescuAG, TongA, BooneC, et al. (2003) A conserved RING finger protein required for histone H2B monoubiquitination and cell size control. Mol Cell 11 : 261–266.
21. DanielJA, TorokMS, SunZ-W, SchieltzD, AllisCD, et al. (2004) Deubiquitination of histone H2B by a yeast acetyltransferase complex regulates transcription. J Biol Chem 279 : 1867–1871.
22. SandersSL, JenningsJ, CanutescuA, LinkAJ, WeilPA (2002) Proteomics of the eukaryotic transcription machinery: identification of proteins associated with components of yeast TFIID by multidimensional mass spectrometry. Mol Cell Biol 22 : 4723–4738.
23. HenryKW, WyceA, LoW-S, DugganLJ, EmreNCT, et al. (2003) Transcriptional activation via sequential histone H2B ubiquitylation and deubiquitylation, mediated by SAGA-associated Ubp8. Genes Dev 17 : 2648–2663.
24. TongAH, EvangelistaM, ParsonsAB, XuH, BaderGD, et al. (2001) Systematic genetic analysis with ordered arrays of yeast deletion mutants. Science 294 : 2364–2368.
25. TongAHY, LesageG, BaderGD, DingH, XuH, et al. (2004) Global mapping of the yeast genetic interaction network. Science 303 : 808–813.
26. WilmesGM, BergkesselM, BandyopadhyayS, ShalesM, BrabergH, et al. (2008) A genetic interaction map of RNA-processing factors reveals links between Sem1/Dss1-containing complexes and mRNA export and splicing. Mol Cell 32 : 735–746.
27. LeeMS, HenryM, SilverPA (1996) A protein that shuttles between the nucleus and the cytoplasm is an important mediator of RNA export. Genes Dev 10 : 1233–1246.
28. SingletonDR, ChenS, HitomiM, KumagaiC, TartakoffAM (1995) A yeast protein that bidirectionally affects nucleocytoplasmic transport. J Cell Sci 108 : 265–272.
29. FortesP, Bilbao-CortésD, FornerodM, RigautG, RaymondW, et al. (1999) Luc7p, a novel yeast U1 snRNP protein with a role in 5′ splice site recognition. Genes Dev 13 : 2425–2438.
30. KrebberH, TauraT, LeeMS, SilverPA (1999) Uncoupling of the hnRNP Npl3p from mRNAs during the stress-induced block in mRNA export. Genes Dev 13 : 1994–2004.
31. Kim GuisbertK, DuncanK, LiH, GuthrieC (2005) Functional specificity of shuttling hnRNPs revealed by genome-wide analysis of their RNA binding profiles. RNA 11 : 383–393.
32. KoborMS, VenkatasubrahmanyamS, MeneghiniMD, GinJW, JenningsJL, et al. (2004) A Protein Complex Containing the Conserved Swi2/Snf2-Related ATPase Swr1p Deposits Histone Variant H2A.Z into Euchromatin. PLoS Biol 2: e131 doi:10.1371/journal.pbio.0020131.
33. KroganNJ, KeoghM-C, DattaN, SawaC, RyanOW, et al. (2003) A Snf2 family ATPase complex required for recruitment of the histone H2A variant Htz1. Mol Cell 12 : 1565–1576.
34. MizuguchiG, ShenX, LandryJ, WuW-H, SenS, et al. (2004) ATP-driven exchange of histone H2AZ variant catalyzed by SWR1 chromatin remodeling complex. Science 303 : 343–348.
35. ShiX, FinkelsteinA, WolfAJ, WadePA, BurtonZF, et al. (1996) Paf1p, an RNA polymerase II-associated factor in Saccharomyces cerevisiae, may have both positive and negative roles in transcription. Mol Cell Biol 16 : 669–676.
36. MuellerCL, JaehningJA (2002) Ctr9, Rtf1, and Leo1 Are Components of the Paf1/RNA Polymerase II Complex. Mol Cell Biol 22 : 1971–1980.
37. SquazzoSL, CostaPJ, LindstromDL, KumerKE, SimicR, et al. (2002) The Paf1 complex physically and functionally associates with transcription elongation factors in vivo. EMBO J 21 : 1764–1774.
38. KroganNJ, KimM, AhnSH, ZhongG, KoborMS, et al. (2002) RNA polymerase II elongation factors of Saccharomyces cerevisiae: a targeted proteomics approach. Mol Cell Biol 22 : 6979–6992.
39. MillerT, KroganNJ, DoverJ, Erdjument-BromageH, TempstP, et al. (2001) COMPASS: a complex of proteins associated with a trithorax-related SET domain protein. Proc Natl Acad Sci USA 98 : 12902–12907.
40. GrantPA, DugganLJ, CôteJ, RobertsSM, BrownellJE, et al. (1997) Yeast Gcn5 functions in two multisubunit complexes to acetylate nucleosomal histones: characterization of an Ada complex and the SAGA (Spt/Ada) complex. Genes Dev 11 : 1640–1650.
41. PijnappelWW, SchaftD, RoguevA, ShevchenkoA, TekotteH, et al. (2001) The S. cerevisiae SET3 complex includes two histone deacetylases, Hos2 and Hst1, and is a meiotic-specific repressor of the sporulation gene program. Genes Dev 15 : 2991–3004.
42. AlbulescuL-O, SabetN, GudipatiM, StepankiwN, BergmanZJ, et al. (2012) A Quantitative, High-Throughput Reverse Genetic Screen Reveals Novel Connections between Pre–mRNA Splicing and 5′ and 3′ End Transcript Determinants. PLoS Genet 8: e1002530 doi:10.1371/journal.pgen.1002530.
43. GundersonFQ, JohnsonTL (2009) Acetylation by the Transcriptional Coactivator Gcn5 Plays a Novel Role in Co-Transcriptional Spliceosome Assembly. PLoS Genet 5: e1000682 doi:10.1371/journal.pgen.1000682.
44. RobzykK, RechtJ, OsleyMA (2000) Rad6-dependent ubiquitination of histone H2B in yeast. Science 287 : 501–504.
45. KimJ, RoederRG (2009) Direct Bre1-Paf1 complex interactions and RING finger-independent Bre1-Rad6 interactions mediate histone H2B ubiquitylation in yeast. J Biol Chem 284 : 20582–20592.
46. Vitaliano-PrunierA, MenantA, HobeikaM, GéliV, GwizdekC, et al. (2008) Ubiquitylation of the COMPASS component Swd2 links H2B ubiquitylation to H3K4 trimethylation. Nat Cell Biol 10 : 1365–1371.
47. KroganNJ, DoverJ, WoodA, SchneiderJ, HeidtJ, et al. (2003) The Paf1 complex is required for histone H3 methylation by COMPASS and Dot1p: linking transcriptional elongation to histone methylation. Mol Cell 11 : 721–729.
48. NgHH, RobertF, YoungRA, StruhlK (2003) Targeted recruitment of Set1 histone methylase by elongating Pol II provides a localized mark and memory of recent transcriptional activity. Mol Cell 11 : 709–719.
49. WoodA, SchneiderJ, DoverJ, JohnstonM, ShilatifardA (2003) The Paf1 complex is essential for histone monoubiquitination by the Rad6-Bre1 complex, which signals for histone methylation by COMPASS and Dot1p. J Biol Chem 278 : 34739–34742.
50. NgHH, DoleS, StruhlK (2003) The Rtf1 component of the Paf1 transcriptional elongation complex is required for ubiquitination of histone H2B. J Biol Chem 278 : 33625–33628.
51. RoguevA, SchaftD, ShevchenkoA, PijnappelWW, WilmM, et al. (2001) The Saccharomyces cerevisiae Set1 complex includes an Ash2 homologue and methylates histone 3 lysine 4. EMBO J 20 : 7137–7148.
52. SunZ-W, AllisCD (2002) Ubiquitination of histone H2B regulates H3 methylation and gene silencing in yeast. Nature 418 : 104–108.
53. DoverJ, SchneiderJ, Tawiah-BoatengMA, WoodA, DeanK, et al. (2002) Methylation of histone H3 by COMPASS requires ubiquitination of histone H2B by Rad6. J Biol Chem 277 : 28368–28371.
54. van LeeuwenF, GafkenPR, GottschlingDE (2002) Dot1p modulates silencing in yeast by methylation of the nucleosome core. Cell 109 : 745–756.
55. LacosteN, UtleyRT, HunterJM, PoirierGG, CôteJ (2002) Disruptor of telomeric silencing-1 is a chromatin-specific histone H3 methyltransferase. J Biol Chem 277 : 30421–30424.
56. BriggsSD, XiaoT, SunZ-W, CaldwellJA, ShabanowitzJ, et al. (2002) Gene silencing: trans-histone regulatory pathway in chromatin. Nature 418 : 498.
57. NgHH, XuR-M, ZhangY, StruhlK (2002) Ubiquitination of histone H2B by Rad6 is required for efficient Dot1-mediated methylation of histone H3 lysine 79. J Biol Chem 277 : 34655–34657.
58. IngvarsdottirK, KroganNJ, EmreNCT, WyceA, ThompsonNJ, et al. (2005) H2B ubiquitin protease Ubp8 and Sgf11 constitute a discrete functional module within the Saccharomyces cerevisiae SAGA complex. Mol Cell Biol 25 : 1162–1172.
59. ShuklaA, StanojevicN, DuanZ, SenP, BhaumikSR (2006) Ubp8p, a histone deubiquitinase whose association with SAGA is mediated by Sgf11p, differentially regulates lysine 4 methylation of histone H3 in vivo. Mol Cell Biol 26 : 3339–3352.
60. LeeKK, FlorensL, SwansonSK, WashburnMP, WorkmanJL (2005) The deubiquitylation activity of Ubp8 is dependent upon Sgf11 and its association with the SAGA complex. Mol Cell Biol 25 : 1173–1182.
61. LeeKK, SwansonSK, FlorensL, WashburnMP, WorkmanJL (2009) Yeast Sgf73/Ataxin-7 serves to anchor the deubiquitination module into both SAGA and Slik(SALSA) HAT complexes. Epigenetics Chromatin 2 : 2.
62. DanielJA, GrantPA (2007) Multi-tasking on chromatin with the SAGA coactivator complexes. Mutat Res 618 : 135–148.
63. SiebelCW, GuthrieC (1996) The essential yeast RNA binding protein Npl3p is methylated. Proc Natl Acad Sci USA 93 : 13641.
64. CollinsSR, KemmerenP, ZhaoX-C, GreenblattJF, SpencerF, et al. (2007) Toward a comprehensive atlas of the physical interactome of Saccharomyces cerevisiae. Mol Cell Proteomics 6 : 439–450.
65. PleissJA, WhitworthGB, BergkesselM, GuthrieC (2007) Transcript specificity in yeast pre-mRNA splicing revealed by mutations in core spliceosomal components. PLoS Biol 5: e90 doi:10.1371/journal.pbio.0050090.
66. XiaoT, KaoC-F, KroganNJ, SunZ-W, GreenblattJF, et al. (2005) Histone H2B ubiquitylation is associated with elongating RNA polymerase II. Mol Cell Biol 25 : 637–651.
67. NickelBE, AllisCD, DavieJR (1989) Ubiquitinated histone H2B is preferentially located in transcriptionally active chromatin. Biochemistry 28 : 958–963.
68. BattaK, ZhangZ, YenK, GoffmanDB, PughBF (2011) Genome-wide function of H2B ubiquitylation in promoter and genic regions. Genes Dev 25 : 2254–2265.
69. ClarkTA, SugnetCW, AresM (2002) Genomewide analysis of mRNA processing in yeast using splicing-specific microarrays. Science 296 : 907–910.
70. HossainMA, ClaggettJM, NguyenT, JohnsonTL (2009) The cap binding complex influences H2B ubiquitination by facilitating splicing of the SUS1 pre-mRNA. RNA 15 : 1515–1527.
71. LoomisRJ, NaoeY, ParkerJB, SavicV, BozovskyMR, et al. (2009) Chromatin Binding of SRp20 and ASF/SF2 and Dissociation from Mitotic Chromosomes Is Modulated by Histone H3 Serine 10 Phosphorylation. Mol Cell 33 : 450–461.
72. HuangY, LiW, YaoX, LinQ-J, YinJ-W, et al. (2012) Mediator Complex Regulates Alternative mRNA Processing via the MED23 Subunit. Mol Cell 1–11.
73. LucoRF, PanQ, TominagaK, BlencoweBJ, Pereira-SmithOM, et al. (2010) Regulation of Alternative Splicing by Histone Modifications. Science 327 : 996–1000.
74. HossainMA, RodriguezCM, JohnsonTL (2011) Key features of the two-intron Saccharomyces cerevisiae gene SUS1 contribute to its alternative splicing. Nucleic Acids Res 39 : 8612–8627.
75. Rodriguez-NavarroS, FischerT, LuoM-J, AntúnezO, BrettschneiderS, et al. (2004) Sus1, a functional component of the SAGA histone acetylase complex and the nuclear pore-associated mRNA export machinery. Cell 116 : 75–86.
76. ShenEC, Stage-ZimmermannT, ChuiP, SilverPA (2000) The yeast mRNA-binding protein Npl3p interacts with the cap-binding complex. J Biol Chem 275 : 23718–23724.
77. SchulzeJM, JacksonJ, NakanishiS, GardnerJM, HentrichT, et al. (2009) Linking Cell Cycle to Histone Modifications: SBF and H2B Monoubiquitination Machinery and Cell-Cycle Regulation of H3K79 Dimethylation. Mol Cell 35 : 626–641.
78. ShiehGS, PanC-H, WuJ-H, SunY-J, WangC-C, et al. (2011) H2B ubiquitylation is part of chromatin architecture that marks exon-intron structure in budding yeast. BMC Genomics 12 : 627.
79. GundersonFQ, MerkhoferEC, JohnsonTL (2011) Dynamic histone acetylation is critical for cotranscriptional spliceosome assembly and spliceosomal rearrangements. Proc Natl Acad Sci USA 108 : 2004–2009.
80. Vitaliano-PrunierA, BabourA, HérissantL, ApponiL, MargaritisT, et al. (2012) H2B ubiquitylation controls the formation of export-competent mRNP. Mol Cell 45 : 132–139.
81. FlemingAB, KaoC-F, HillyerC, PikaartM, OsleyMA (2008) H2B Ubiquitylation Plays a Role in Nucleosome Dynamics during Transcription Elongation. Mol Cell 31 : 57–66.
82. BhattDM, Pandya-JonesA, TongA-J, BarozziI, LissnerMM, et al. (2012) Transcript Dynamics of Proinflammatory Genes Revealed by Sequence Analysis of Subcellular RNA Fractions. Cell 150 : 279–290.
83. TilgnerH, KnowlesDG, JohnsonR, DavisCA, ChakraborttyS, et al. (2012) Deep sequencing of subcellular RNA fractions shows splicing to be predominantly co-transcriptional in the human genome but inefficient for lncRNAs. Genome Res 22 : 1616–1625.
84. AmeurA, ZaghloolA, HalvardsonJ, WetterbomA, GyllenstenU, et al. (2011) Total RNA sequencing reveals nascent transcription and widespread co-transcriptional splicing in the human brain. Nat Struct Mol Biol 18 : 1435–1440.
85. Guthrie C, Fink GR (2002) Guide to Yeast Genetics and Molecular and Cell Biology, Part B. London: Academic Press: Methods in Enzymology. 623 p.
86. JankeC, MagieraMM, RathfelderN, TaxisC, ReberS, et al. (2004) A versatile toolbox for PCR-based tagging of yeast genes: new fluorescent proteins, more markers and promoter substitution cassettes. Yeast 21 : 947–962.
87. TongAHY, BooneC (2006) Synthetic genetic array analysis in Saccharomyces cerevisiae. Methods Mol Biol 313 : 171–192.
88. CherryJM, HongEL, AmundsenC, BalakrishnanR, BinkleyG, et al. (2012) Saccharomyces Genome Database: the genomics resource of budding yeast. Nucleic Acids Res 40: D700–D705.
89. PuS, WongJ, TurnerB, ChoE, WodakSJ (2009) Up-to-date catalogues of yeast protein complexes. Nucleic Acids Res 37 : 825–831.
90. BerrizGF, KingOD, BryantB, SanderC, RothFP (2003) Characterizing gene sets with FuncAssociate. Bioinformatics 19 : 2502–2504.
91. SmootME, OnoK, RuscheinskiJ, WangP-L, IdekerT (2011) Cytoscape 2.8: new features for data integration and network visualization. Bioinformatics 27 : 431–432.
92. SchmittME, BrownTA, TrumpowerBL (1990) A rapid and simple method for preparation of RNA from Saccharomyces cerevisiae. Nucleic Acids Res 18 : 3091–3092.
93. BergkesselM, WhitworthGB, GuthrieC (2011) Diverse environmental stresses elicit distinct responses at the level of pre-mRNA processing in yeast. RNA 17 : 1461–1478.
94. DeRisiJL, IyerVR, BrownPO (1997) Exploring the metabolic and genetic control of gene expression on a genomic scale. Science 278 : 680–686.
95. de HoonMJL, ImotoS, NolanJ, MiyanoS (2004) Open source clustering software. Bioinformatics 20 : 1453–1454.
96. SaldanhaAJ (2004) Java Treeview–extensible visualization of microarray data. Bioinformatics 20 : 3246–3248.
97. AmbergDC, GoldsteinAL, ColeCN (1992) Isolation and characterization of RAT1: an essential gene of Saccharomyces cerevisiae required for the efficient nucleocytoplasmic trafficking of mRNA. Genes Dev 6 : 1173–1189.
98. KnopM, SiegersK, PereiraG, ZachariaeW, WinsorB, et al. (1999) Epitope tagging of yeast genes using a PCR-based strategy: more tags and improved practical routines. Yeast 15 : 963–972.
Štítky
Genetika Reprodukční medicínaČlánek vyšel v časopise
PLOS Genetics
2012 Číslo 11
- Kazuistika – Perspektivy využití precizované medicíny v rámci personalizované specifické terapie onkologických pacientů
- Nobelova cena za chemii pro genetické nůžky: Objev, který změní naši budoucnost?
- Technologie na bázi RNA v klinické praxi: od přebarvených petúnií k terapii vzácných a dosud jen obtížně léčitelných chorob u lidí
- „Nepředstavovali jsme si, že náš výzkum povede přímo ke vzniku nových léků, dokonce ještě za našeho života“
- Bezplatné služby pro diagnostiku ATTRv amyloidózy pro kardiology
Nejčtenější v tomto čísle
- Mechanisms Employed by to Prevent Ribonucleotide Incorporation into Genomic DNA by Pol V
- Inference of Population Splits and Mixtures from Genome-Wide Allele Frequency Data
- Zcchc11 Uridylates Mature miRNAs to Enhance Neonatal IGF-1 Expression, Growth, and Survival
- Histone Methyltransferases MES-4 and MET-1 Promote Meiotic Checkpoint Activation in
Zvyšte si kvalifikaci online z pohodlí domova
Mazová zátka a její řešení
nový kurzVšechny kurzy