
A Phenomics-Based Strategy Identifies Loci on , , and Associated with Metabolic Syndrome Phenotype Domains
Despite evidence of the clustering of metabolic syndrome components, current approaches for identifying unifying genetic mechanisms typically evaluate clinical categories that do not provide adequate etiological information. Here, we used data from 19,486 European American and 6,287 African American Candidate Gene Association Resource Consortium participants to identify loci associated with the clustering of metabolic phenotypes. Six phenotype domains (atherogenic dyslipidemia, vascular dysfunction, vascular inflammation, pro-thrombotic state, central obesity, and elevated plasma glucose) encompassing 19 quantitative traits were examined. Principal components analysis was used to reduce the dimension of each domain such that >55% of the trait variance was represented within each domain. We then applied a statistically efficient and computational feasible multivariate approach that related eight principal components from the six domains to 250,000 imputed SNPs using an additive genetic model and including demographic covariates. In European Americans, we identified 606 genome-wide significant SNPs representing 19 loci. Many of these loci were associated with only one trait domain, were consistent with results in African Americans, and overlapped with published findings, for instance central obesity and FTO. However, our approach, which is applicable to any set of interval scale traits that is heritable and exhibits evidence of phenotypic clustering, identified three new loci in or near APOC1, BRAP, and PLCG1, which were associated with multiple phenotype domains. These pleiotropic loci may help characterize metabolic dysregulation and identify targets for intervention.
Published in the journal:
. PLoS Genet 7(10): e32767. doi:10.1371/journal.pgen.1002322
Category:
Research Article
doi:
https://doi.org/10.1371/journal.pgen.1002322
Summary
Despite evidence of the clustering of metabolic syndrome components, current approaches for identifying unifying genetic mechanisms typically evaluate clinical categories that do not provide adequate etiological information. Here, we used data from 19,486 European American and 6,287 African American Candidate Gene Association Resource Consortium participants to identify loci associated with the clustering of metabolic phenotypes. Six phenotype domains (atherogenic dyslipidemia, vascular dysfunction, vascular inflammation, pro-thrombotic state, central obesity, and elevated plasma glucose) encompassing 19 quantitative traits were examined. Principal components analysis was used to reduce the dimension of each domain such that >55% of the trait variance was represented within each domain. We then applied a statistically efficient and computational feasible multivariate approach that related eight principal components from the six domains to 250,000 imputed SNPs using an additive genetic model and including demographic covariates. In European Americans, we identified 606 genome-wide significant SNPs representing 19 loci. Many of these loci were associated with only one trait domain, were consistent with results in African Americans, and overlapped with published findings, for instance central obesity and FTO. However, our approach, which is applicable to any set of interval scale traits that is heritable and exhibits evidence of phenotypic clustering, identified three new loci in or near APOC1, BRAP, and PLCG1, which were associated with multiple phenotype domains. These pleiotropic loci may help characterize metabolic dysregulation and identify targets for intervention.
Introduction
The metabolic syndrome represents metabolic dysregulation expressed as the clustering of several physiologic risk factors and is associated with an increased risk of atherosclerosis and type 2 diabetes [1]. The core metabolic syndrome domains are abdominal obesity, atherogenic dyslipidemia, elevated blood pressure, elevated plasma glucose, a pro-thrombotic state, and a pro-inflammatory state [2], which are represented to varying degrees in commonly used metabolic syndrome scoring systems [3]–[7].
Several lines of evidence support a genetic basis underlying the core metabolic syndrome domains. Measures of metabolic domains cluster in families [8] and heritability estimates range from 16% for systolic blood pressure to 60% for high-density lipoprotein (HDL) cholesterol [9]. Genome-wide association (GWA) studies have also identified common variants in CETP, LPL, APOA5, and GCKR that influence the co-occurrence of metabolic domain phenotypes [10], [11].
Despite evidence of the clustering of metabolic domain phenotypes, current approaches for identifying unifying genetic mechanisms (i.e. pleiotropy) remain largely focused on clinical categories that do not provide adequate etiological information [12]. As an alternative, a phenomics approach that assembles coherent sets of phenotypic features that extend across individual measurements and diagnostic boundaries creates the opportunity for novel genetic investigations of established biological pathways and complements the traditional GWA study or candidate gene-based strategy focused on individual phenotypes [13]–[15]. In addition to making use of existing knowledge on process-related information or pathways, a multi-phenotype phenomics approach also may provide greater statistical power than analyses of individual phenotypes [16] and improve the ability to detect effects of small magnitude [17]. Although several authors have advocated the use of such strategies [15], [18], [19], the approach is implemented infrequently.
This study evaluated evidence of pleiotropy in clustered metabolic domains using data from five well characterized population-based studies composed of approximately 20,000 European American and 6,200 African American participants: the Atherosclerosis Risk in Communities (ARIC) study, the Coronary Artery Risk Development in Young Adults (CARDIA) study, the Cardiovascular Health Study (CHS), the Framingham Heart Study (FHS), and the Multi-Ethnic Study of Atherosclerosis (MESA). Six phenotype domains (atherogenic dyslipidemia, vascular dysfunction, vascular inflammation, pro-thrombotic state, central obesity and elevated plasma glucose) encompassing 19 quantitative traits were examined. After dimension reduction, we applied a statistically efficient and computationally feasible multivariate approach that related the phenotype domains to 250,000 imputed SNPs. Our approach, which is applicable to studies of heritable, clustered interval scale outcomes, identified several genome-wide significant loci associated with multiple phenotype domains, which may help characterize metabolic dysregulation and identify targets for intervention.
Results
After excluding duplicate samples (N = 56), first - and second-degree relatives (N = 1,152) in all studies except the family-based Framingham Heart Study, and individuals identified as genetic outliers (N = 20), there were 19,468 European American and 6,287 African American Candidate Gene Association Resource Consortium (CARe) participants available for analysis. As expected, CARDIA participants (mean age: 25 years) had better cardiovascular health profiles, including lower low density lipoprotein concentrations, markers of vascular inflammation, and blood pressure levels when compared to the older cohorts (Tables S1, S2, S3, S4, S5).
Eight principle components were used to characterize the six metabolic syndrome trait domains (Figure 1): one principal component each for vascular dysfunction, elevated plasma glucose, pro-thrombotic state and central obesity and two principal components for atherogenic dyslipidemia and vascular inflammation. Correlation between the principal components, which served as the eight phenotypes of interest, was modest and consistent across studies and racial groups. As an example, race - specific results from the ARIC Study are presented in Tables S6, S7.

ARIC and CARDIA were the only studies with full phenotype data for all 19 of the variables used to define the metabolic trait domains. Although apolipoprotein A1 and B measurements were unavailable in three cohorts, the high correlations with high-density and low-density lipoprotein concentrations (r>0.70 in ARIC data, Tables S8, S9) suggested that all five cohorts provided similar atherogenic dyslipidemia phenotypes. A similarly high correlation was observed between von Willebrand factor and factor VIII in the ARIC data, implying a common pro-thrombotic phenotype in studies missing either measurement. The modest correlation between systemic markers of inflammation in the MESA study, which did not measure white blood cell count and uric acid concentration, suggests that this study may contribute a slightly different vascular inflammation phenotype. The MESA study also did not assay factor VII, suggesting that this study also contributed a somewhat different pro-thrombotic phenotype. However, a sensitivity analysis excluding pro-thrombotic and inflammation principal components estimated in the MESA study yielded comparable results.
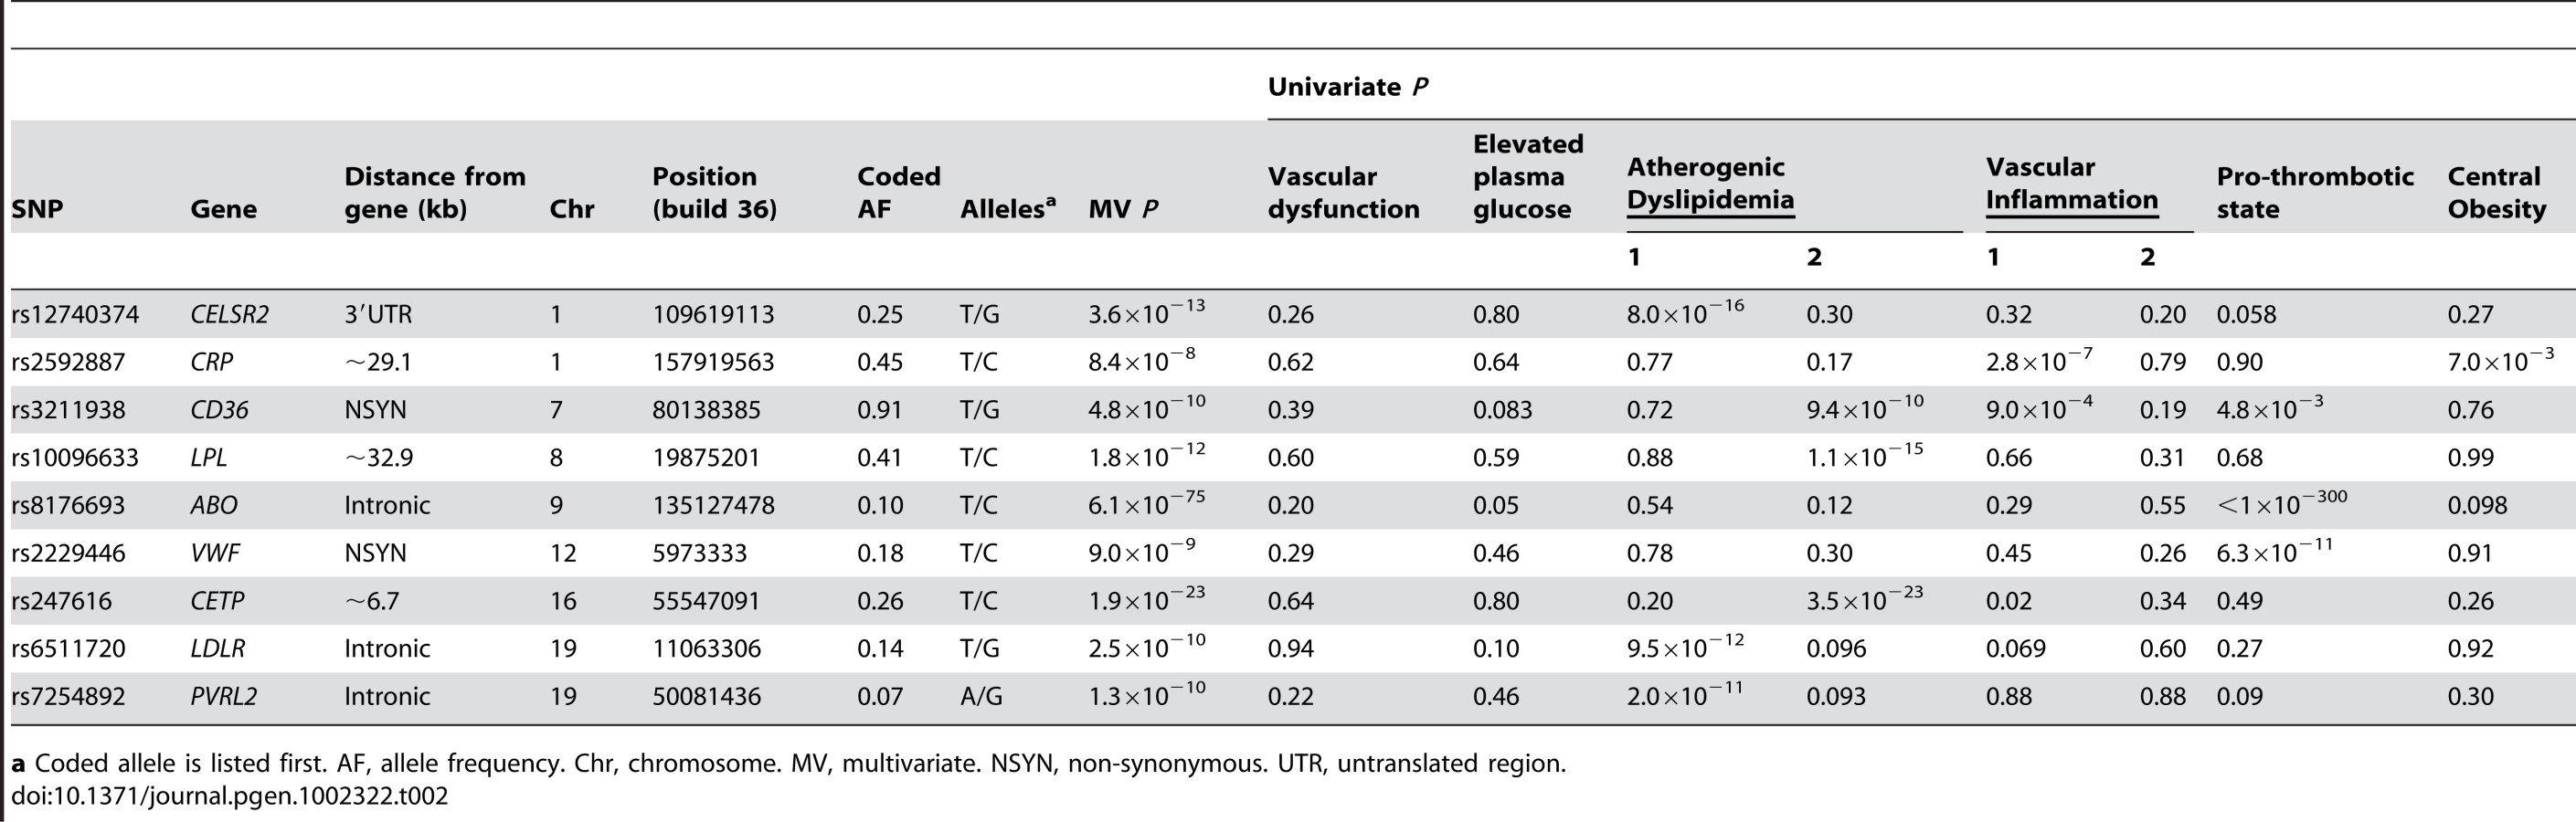
In European Americans, we identified 606 SNPs representing 19 loci that were associated with at least one metabolic trait domain (Table 1, Figure 2) at the genome-wide significance level (P<2.13×10⁻⁷; the SNP with the lowest P – value chosen if multiple significant SNPs were identified for a given locus) and these results were consistent across the multiple large cohorts (Table S10 and Figure S1). Several of these loci overlapped results in African Americans (Table 2, Figure 3), including associations with LPL, ABO, VWF, CTEP, and LDLR. In addition to these 19 loci, we also identified 15 additional secondary signals in European Americans, defined as genome-wide significant SNPs (the SNP with the lowest P – value chosen if multiple significant SNPs were identified for a given locus) in very low linkage disequilibrium (LD) (r2<0.05) with the most significant SNP and within the same 1,000-kb region (Table S11). To verify the independent contributions of these additional loci, we performed a conditional analysis using the most significant SNP at each significant locus as a covariate. Thirteen of these signals remained significant, including one APOC1 variant, after adjusting for the primary signals.


Previously identified loci associated with single metabolic trait domains
The strongest signal for both European American and African American participants was located on chromosome 9 in the ABO gene (P<1.0×10−300 and P = 6.1×10−75, respectively). These signals overlap earlier findings between factor VIII and von Willebrand factor with ABO [20]. Nine additional loci in European Americans and eight loci in African Americans demonstrated effects limited to one metabolic syndrome trait domain that have already been reported in the GWA literature and are therefore not considered further: ABCA1, APOB, CD36, CELSR2, CETP, CRP, F7, LDLR, LIPC, PVRL2, TRIB1, VWF, and ZNF259.
Previously identified loci associated multiple trait domains
Six loci were associated with at least two trait domains in European Americans: GCKR, ABCB11, LPL, HNF1A, FTO, and SUGP1, results which overlap published associations identified through GWA studies for individual trait components. For example, several GWA studies have identified associations between GCKR and elevated plasma glucose [21], atherogenic dyslipidemia [22], and vascular inflammation [23]–[25]. GCKR is a plausible unifying mechanism for the clustering of metabolic domains, as the protein inhibits glucokinase, the predominant glucose phosphorylating enzyme [26]. HNF1A, which encodes the transcription factor hepatocyte nuclear factor (HNF)-1a, also suggests a common pathogenic background, as previous GWA studies have identified associations with atherogenic dyslipidemia [27], vascular inflammation [28], and type 2 diabetes [29]. Of note, FTO was the only previously identified and consistently replicated obesity locus we identified.
Candidate genes at new loci
The strongest new pleiotropic signal in European Americans was for rs4420638 (P 1.7×10−57), located approximately 0.32 kilobases (kb) downstream of APOC1 and associated with elevated plasma glucose (P = 8.7×10⁻⁴), atherogenic dyslipidemia (1×10⁻³¹), vascular inflammation (P = 5×10⁻¹²), and central obesity (P = 1.2×10⁻⁶). Although associations between APOC1 with atherogenic dyslipidemia [22], [30], [31] and vascular inflammation [32], [33] have been reported and replicated in the GWA study literature, we consider it a novel locus due to the strong and previously unreported associations with elevated plasma glucose and central obesity. Localizing this signal is challenging, as the region contains a 48-kb gene cluster that also includes the APOE and pseudo-APOC’ genes [34]. However, the modest levels of linkage disequilibrium (Figure 4), the presence of a second signal (Table S11), studies which demonstrate that mice overexpressing human APOC1 show a marked reduction in the update of fatty acids into adipocytes [35], and the fact the physiological role of APOC1 is less well established than APOE, APOB, and APOA1 [36] all support further evaluation and fine mapping of APOC1.

The second new locus was rs11065987 (P = 2.9×10⁻¹⁰), located approximately 9.9 kb upstream of BRAP and associated with atherogenic dyslipidemia (3.1×10⁻³), vascular dysfunction (2.2×10⁻⁴), and central obesity (9.7×10⁻³). Initial reports suggested that the BRAP protein binds the breast cancer suppressor protein BRCA1 [37]. BRAP is also known to modulate mitogen activated protein kinase signaling [38], an established cell survival, growth, differentiation, transformation, and proinflammatory pathway [39].
The GWA study literature provides few clues that link BRAP with metabolic trait domains, as associations have only been identified for alanine aminotransferase [24] and esophageal cancer [40], both in populations of Japanese descent. However, the recombination rate (cM/Mb) is low from approximately 110.3 Mb to 111.5 Mb (Figure 4) and this extended region includes loci associated with type 1 diabetes [41], [42], vascular dysfunction [43], and waist-hip ratio [44]. The ATXN2 gene, located 27 kb from the index SNP, is an intriguing candidate gene. Expansion of a CAG repeat in the ataxin-2 protein causes the neurodegenerative disease spinocerebellar ataxia type 2. However, instead of a neurodegenerative phenotype, ATXN2-deficient rodents exhibited phenotypes characterized by abdominal obesity, insulin resistance, and marked hepatosteatosis (i.e. lipid accumulation in the liver) [45]. Linkage studies of obesity in humans have also associated this region with BMI and total fat percentage [46].
A third genome-wide significant signal was identified for rs753381 (P = 4.3×10⁻⁸), a missense mutation in PLCG1 that results in a change from an isoleucine to a threonine. PLCG1 encodes a protein that catalyzes the formation of inositol 1,4,5-trisphosphate and diacylglycerol from phosphatidylinositol 4,5-bisphosphate and plays an important role in the intracellular transduction of receptor-mediated tyrosine kinase activators [47]. Few epidemiologic studies of PLCG1 or neighboring genes have been published. However, mice nullizygous for PLCG1 stop growing mid-gestation and show no evidence of vasculogenesis [48]. Vasculogenesis has been associated with insulin resistance [49], plasminogen activator inhibitor-1(PAI-1) concentration [50], hyperglycemia, and adiponectin levels [51]. This suggests that PLCG1 may contribute to the clustering of metabolic domains in a more subtle manner, such as through small alterations in the structure of the PLCG1 protein. Thus, the missense mutation we identified would serve as a highly intriguing candidate SNP for further study.
Discussion
In this study composed of approximately 20,000 European American and 6,200 African American participants, we identified three new loci associated with multiple metabolic trait domains: APOC1, BRAP, and PLCG1. These loci were in or near genes previously associated with atherogenic dyslipidemia, vascular inflammation, type I diabetes, vascular dysfunction, and central adiposity. No previous genome-wide or gene-centric studies examining evidence for pleiotropy in metabolic domains has detected these loci at genome-wide significant levels.
The pathogenesis of the clustering of metabolic phenotypes remains poorly understood, although it is likely that a sedentary lifestyle, combined with dietary patterns and genetic susceptibility factors, contribute. Candidate genes associated with metabolic syndrome phenotypes largely reflect current knowledge of established pathways regulating obesity, free fatty acid metabolism, insulin sensitivity, lipid metabolism, and inflammation. Although candidate gene and GWA studies have successfully identified loci influencing variation in these pathways, studies examining genetic factors influencing the co-occurrence of metabolic phenotypes are limited. Additionally, those that examine the clustering of syndromic components using the pre-defined clinical cutpoints are largely inconsistent or inconclusive. This general lack of success may reflect ongoing controversy over metabolic syndrome definitions, leading to phenotypic heterogeneity and inconsistent genetic findings across studies [52]. The utility of studying the syndrome as a binary entity as opposed to a series of component traits is also debated [12], especially since the dichotomization of interval scale traits will discard information.
Methods for examining evidence of pleiotropy remain uncommon in the GWA literature and most likely reflect the lack of methodologies and software that are scalable to GWA studies. In this paper, we present a statistically efficient and computational feasible approach to testing for pleiotropy on a genome-wide scale. Our method is applicable to population-based and family studies and identified several associations that would not have been identified through typical univariate analyses. The approach presented herein is also not limited to metabolic phenotypes. Instead, our method could be applied to any set of interval scale traits that are heritable and exhibit evidence of phenotypic clustering.
Although alternative analytic approaches were available, for example estimating principal components for all traits simultaneously, we focused on the phenotype clusters presented in Figure 1. First, evaluating the nineteen phenotypes of interest as six domains of interest is biologically plausible given evidence of phenotypic clustering. It was also easier to interpret principal components that were derived in separate phenotype domains rather than components estimated simultaneously. Additionally, estimating principal components within each phenotype domains ensured that each domain was sufficiently represented in the analysis.
Challenges to the approach presented herein include careful phenotype curation, made more difficult by the inclusion of 19 traits across multiple cohorts that were not measured with a common protocol. Only the ARIC and CARDIA studies had full phenotype information on all 19 traits and CHS was the only study with all traits measured during a single visit. The use of a multivariate phenotype comprised of 19 variables also limited the number of contributing cohorts and the identification of replication cohorts, as few studies have such comprehensive phenotypic data. Nonetheless, we were able to identify approximately 25,000 participants from studies that used standardized, comparable protocols and many of the associations were consistent across cohorts.
Further challenges that are not unique to large scale genetic studies incorporating a phenomics approach include the consistency of results across populations defined by age, race, sex, or other demographic characteristics. For example, the three new loci identified in the European American population were not detected in the African American population. Given a modest sample size of 6,287 participants it is difficult to determine whether an inability to generalize results to the African American population reflects different patterns of LD, varying environmental contexts, or limited statistical power. Variation in mean age between contributing cohorts, which ranged from 25 years in the CARDIA study to 72 years in the CHS, could introduce additional heterogeneity, as associations between metabolic phenotypes have been shown to diminish with age [53]. Finally, marked variation in the prevalence of the metabolic syndrome by gender, regardless of clinical definition, suggest the possibility of sex-specific metabolic syndrome effects [54]. Analyses that examine modification by sex, age, and other important clinical covariates are therefore warranted.
Our use of the IBC array, which is composed of variants implicated in cardiovascular, inflammatory, hemostasis/coagulation, and metabolic pathways, was beneficial in that it allowed us to leverage the wealth of information on pathways implicated in metabolic disturbances while reducing multiple testing penalties. Admittedly this approach was limited in that it potentially excludes novel pathways not captured by the IBC chip. Although imputation allowed us to increase the number of variants, genome-wide approaches might identify additional pleiotropic loci.
In summary, our results support phenomics as a complementary approach that leverages phenotypic variation for the evaluation of pleiotropy, a clear limitation of existing studies examining the metabolic syndrome using clinical definitions. Our approach, which is applicable to studies of heritable, clustered interval scale outcomes, also takes advantage of the wealth of phenotype data available in longitudinal cohort studies as well as emerging analytical and bioinformatics approaches. Ultimately, these results support the presence of genetic variants with pleiotropic effects on adiposity, inflammation, glucose regulation, dyslipidemia, vascular dysfunction and thrombosis. Such loci may help characterize metabolic dysregulation and identify targets for intervention.
Materials and Methods
Study population
This study arose from a collaboration between investigators from two National Institute of Health funded consortia examining the genetic basis of common complex diseases: the Population Architecture using Genomics and Epidemiology (PAGE) study, a National Human Genome Research Institute funded effort examining the epidemiologic architecture of common genetic variation that have been reproducibly associated with human diseases and traits [55] and the CARe Consortium [56], a National Heart, Lung, and Blood Institute-supported resource for genetic analyses examining cardiovascular phenotypes. Briefly, PAGE investigators participating in the phenomics working group wanted to extend existing efforts examining evidence for pleiotropy in approximately 300 replicated genetic variants [57] to include a more comprehensive evaluation of common SNPs. A collaboration between PAGE and CARe investigators was therefore initiated, and used data from five CARe studies of European American and African American with adequate phenotype data: ARIC, CARDIA, CHS, FHS, and MESA. All participating institutions and CARe sites obtained Institutional Review Board approval for this study. Additional information on the participating CARe studies is provided in Text S1.
Genotyping
The Institute for the Translational Medicine and Therapeutics (ITMAT)-Broad-CARe (IBC) genotyping array [58] was used to evaluate approximately 2,100 genes related to cardiovascular, inflammatory, hemostasis/coagulation, and metabolic phenotypes and pathways. The IBC array tagging approach was designed to capture maximal genetic information for both common and lower frequency SNPs (<5% minor allele frequency (MAF)) in HapMap as well as European American and African American populations. The array included 49,320 SNPs, 15,000 of which were gene variants not present in HapMap. Additional details of the SNP selection and tagging approach are given in Text S1.
Imputation of untyped and missing SNP genotypes was performed using MACH 1.0.16. [59] For the European samples, phased haplotypes from the CEU founders of HapMap 2 were used as reference. For African American populations, a combined CEU+YRI reference panel was created that includes SNPs segregating in both CEU and YRI, as well as SNPs segregating in one panel and monomorphic and non-missing in the other. Imputation for the IBC array was performed in two steps. First, individuals with pedigree relatedness or cryptic relatedness were filtered. A subset of individuals was randomly extracted from each panel and used to generate recombination and error rate estimates for the corresponding sample. Second, these rates were used to impute all sample individuals across the entire reference panel. Before cleaning, there were an average of 246,740 (range: 245,816, 247,505) and 227,224 (range: 225,111, 229,061) imputed SNPs in the European American and African American study populations, respectively. Imputation results were then filtered at an imputation quality limit of 0.30 and a MAF threshold of 0.01, yielding 235,077 (95.3% of total) and 227,222 (96.2% of total) SNPs for analysis in European American and African American participants, respectively.
Phenotypes
The clustered risk factors of interest were characterized as a six-domain phenotype: atherogenic dyslipidemia, vascular dysfunction, vascular inflammation, pro-thrombotic state, elevated plasma glucose, and central obesity (Figure 1). These domains were constructed a priori based on a review of literature examining clustering in metabolic phenotypes, placing specific emphasis on the National Cholesterol Education Program’s Adult Treatment Panel III report [4], [60]. Nineteen variables were then selected to represent one of the six domains with preference for variables measured in at least four of the contributing cohort studies or variables that were highly correlated with available measures. Measurement protocols for each variable by study are provided in Table S21. We assessed normality, and transformations were used when variables exhibited excessive skewness or kurtosis as determined by numerical summary information and visual inspection of histograms and normal probability plots. Dimension reduction using principal components analysis was then performed for each phenotype domain separately in each race/ethnic and study population. For example, principal components for the vascular inflammation domain were calculated using the following traits: albumin, C reactive protein, fibrinogen, uric acid, and white blood cell count. Principal components were chosen so that>55% of the variance for each domain was explained (Tables S12, S13, S14, S15, S16, S17, S18, S19, S20). This threshold was chosen because all of the first (waist circumference, pro-thrombotic state, elevated plasma glucose, and vascular dysfunction) and the sum of first and second (vascular inflammation and atherogenic dyslipidemia) principal components exceeded 55% across all studies and racial/ethnic groups.
Statistical methods
For each phenotype, we fit a linear regression model relating the phenotype to the SNP genotype under the additive mode of inheritance; the model includes environmental variables (i.e., age, sex and study center) as well as the first ten principal components from EIGENSTRAT to adjust for population substructure [61]. Ten population substructure components were included because each component was associated with at least one of the eight phenotypes of interest in at least one study. If the SNP genotype is not associated with any phenotype domain, then the regression coefficients for the SNP genotype are zero in all eight linear models. We tested this global null hypothesis by constructing a multivariate test statistic based on the joint distribution of the score statistics from the eight linear models, which accounted for the correlation between the eight phenotypes. We chose the score statistic because it is computationally efficient and numerically stable. The test statistic is referred to the chi-squared distribution with eight degrees of freedom. The genome-wide significance level was set as P<2.13×10⁻⁷ (i.e. 0.05/235,077). Q-Q plots by race are not presented, as our use of a gene-centric array highly enriched for metabolic loci complicated the identification of markers with low prior probabilities of association (i.e. “null markers”) for all phenotypes of interest. The data from each cohort were analyzed separately and the results were combined via meta-analysis as described in Text S2. All analyses were stratified by race and were performed in SAS 9.1 and C++. Further details are given in the Text S2.
Supporting Information
Zdroje
1. IsomaaBAlmgrenPTuomiTForsenBLahtiK 2001 Cardiovascular morbidity and mortality associated with the metabolic syndrome. Diabetes Care 24 683 689
2. GrundySM 2006 Drug therapy of the metabolic syndrome: minimizing the emerging crisis in polypharmacy. Nat Rev Drug Discov 5 295 309
3. AlbertiKGZimmetPShawJ 2006 Metabolic syndrome–a new world-wide definition. A Consensus Statement from the International Diabetes Federation. Diabet Med 23 469 480
4. TreatmentPanelATPIII 2002 Third Report of the National Cholesterol Education Program (NCEP) Expert Panel on Detection, Evaluation, and Treatment of High Blood Cholesterol in Adults (Adult Treatment Panel III) final report. Circulation 106 3143 3421
5. BalkauBCharlesMA 1999 Comment on the provisional report from the WHO consultation. European Group for the Study of Insulin Resistance (EGIR). Diabet Med 16 442 443
6. EinhornDReavenGMCobinRHFordEGandaOP 2003 American College of Endocrinology position statement on the insulin resistance syndrome. Endocr Pract 9 237 252
7. GrundySMCleemanJIDanielsSRDonatoKAEckelRH 2005 Diagnosis and management of the metabolic syndrome: an American Heart Association/National Heart, Lung, and Blood Institute Scientific Statement. Circulation 112 2735 2752
8. Bosy-WestphalAOnurSGeislerCWolfAKorthO 2007 Common familial influences on clustering of metabolic syndrome traits with central obesity and insulin resistance: the Kiel obesity prevention study. Int J Obes (Lond) 31 784 790
9. LinHFBoden-AlbalaBJuoSHParkNRundekT 2005 Heritabilities of the metabolic syndrome and its components in the Northern Manhattan Family Study. Diabetologia 48 2006 2012
10. ZabanehDBaldingDJ 2010 A genome-wide association study of the metabolic syndrome in Indian Asian men. PLoS ONE 5 e11961 doi:10.1371/journal.pone.0011961
11. KrajaATVaidyaDPankowJSGoodarziMOAssimesTL 2011 A Bivariate Genome-Wide Approach to Metabolic Syndrome: STAMPEED Consortium. Diabetes 60 1329 1339
12. MullerMJBosy-WestphalAKrawczakM 2010 Genetic studies of common types of obesity: a critique of the current use of phenotypes. Obes Rev 11 612 618
13. HouleDGovindarajuDROmholtS 2010 Phenomics: the next challenge. Nat Rev Genet 11 855 866
14. HegeleRA 2004 Phenomics, lipodystrophy, and the metabolic syndrome. Trends Cardiovasc Med 14 133 137
15. BilderRMSabbFWCannonTDLondonEDJentschJD 2009 Phenomics: The systematic study of phenotypes on a genome-wide scale. Neuroscience 164 30 42
16. AmosCILaingAE 1993 A comparison of univariate and multivariate tests for genetic linkage. Genet Epidemiol 10 671 676
17. JiangCZengZB 1995 Multiple trait analysis of genetic mapping for quantitative trait loci. Genetics 140 1111 1127
18. BilderRM 2008 Phenomics: building scaffolds for biological hypotheses in the post-genomic era. Biol Psychiatry 63 439 440
19. FreimerNSabattiC 2003 The human phenome project. Nat Genet 34 15 21
20. SmithNLChenMHDehghanAStrachanDPBasuS 2010 Novel associations of multiple genetic loci with plasma levels of factor VII, factor VIII, and von Willebrand factor: The CHARGE (Cohorts for Heart and Aging Research in Genome Epidemiology) Consortium. Circulation 121 1382 1392
21. DupuisJLangenbergCProkopenkoISaxenaRSoranzoN 2010 New genetic loci implicated in fasting glucose homeostasis and their impact on type 2 diabetes risk. Nat Genet 42 105 116
22. WaterworthDMRickettsSLSongKChenLZhaoJH 2010 Genetic variants influencing circulating lipid levels and risk of coronary artery disease. Arterioscler Thromb Vasc Biol 30 2264 2276
23. RidkerPMPareGParkerAZeeRYDanikJS 2008 Loci related to metabolic-syndrome pathways including LEPR,HNF1A, IL6R, and GCKR associate with plasma C-reactive protein: the Women's Genome Health Study. Am J Hum Genet 82 1185 1192
24. KamataniYMatsudaKOkadaYKuboMHosonoN 2010 Genome-wide association study of hematological and biochemical traits in a Japanese population. Nat Genet 42 210 215
25. KolzMJohnsonTSannaSTeumerAVitartV 2009 Meta-analysis of 28,141 individuals identifies common variants within five new loci that influence uric acid concentrations. PLoS Genet 5 e1000504 doi:10.1371/journal.pgen.1000504
26. MatschinskyFMGlaserBMagnusonMA 1998 Pancreatic beta-cell glucokinase: closing the gap between theoretical concepts and experimental realities. Diabetes 47 307 315
27. KathiresanSWillerCJPelosoGMDemissieSMusunuruK 2009 Common variants at 30 loci contribute to polygenic dyslipidemia. Nat Genet 41 56 65
28. OkadaYTakahashiAOhmiyaHKumasakaNKamataniY 2011 Genome-wide association study for C-reactive protein levels identified pleiotropic associations in the IL6 locus. Hum Mol Genet 20 1224 1231
29. VoightBFScottLJSteinthorsdottirVMorrisAPDinaC 2010 Twelve type 2 diabetes susceptibility loci identified through large-scale association analysis. Nat Genet 42 579 589
30. WillerCJSannaSJacksonAUScuteriABonnycastleLL 2008 Newly identified loci that influence lipid concentrations and risk of coronary artery disease. Nat Genet 40 161 169
31. KathiresanSMelanderOGuiducciCSurtiABurttNP 2008 Six new loci associated with blood low-density lipoprotein cholesterol, high-density lipoprotein cholesterol or triglycerides in humans. Nat Genet 40 189 197
32. ElliottPChambersJCZhangWClarkeRHopewellJC 2009 Genetic Loci associated with C-reactive protein levels and risk of coronary heart disease. JAMA 302 37 48
33. DehghanADupuisJBarbalicMBisJCEiriksdottirG 2011 Meta-analysis of genome-wide association studies in >80 000 subjects identifies multiple loci for C-reactive protein levels. Circulation 123 731 738
34. LiWHTanimuraMLuoCCDattaSChanL 1988 The apolipoprotein multigene family: biosynthesis, structure, structure-function relationships, and evolution. J Lipid Res 29 245 271
35. JongMCVosholPJMuurlingMDahlmansVERomijnJA 2001 Protection from obesity and insulin resistance in mice overexpressing human apolipoprotein C1. Diabetes 50 2779 2785
36. SoutarAKGarnerCWBakerHNSparrowJTJacksonRL 1975 Effect of the human plasma apolipoproteins and phosphatidylcholine acyl donor on the activity of lecithin: cholesterol acyltransferase. Biochemistry 14 3057 3064
37. LiSKuCYFarmerAACongYSChenCF 1998 Identification of a novel cytoplasmic protein that specifically binds to nuclear localization signal motifs. J Biol Chem 273 6183 6189
38. MathenySAChenCKortumRLRazidloGLLewisRE 2004 Ras regulates assembly of mitogenic signalling complexes through the effector protein IMP. Nature 427 256 260
39. OrySMorrisonDK 2004 Signal transduction: implications for Ras-dependent ERK signaling. Curr Biol 14 R277 278
40. CuiRKamataniYTakahashiAUsamiMHosonoN 2009 Functional variants in ADH1B and ALDH2 coupled with alcohol and smoking synergistically enhance esophageal cancer risk. Gastroenterology 137 1768 1775
41. BarrettJCClaytonDGConcannonPAkolkarBCooperJD 2009 Genome-wide association study and meta-analysis find that over 40 loci affect risk of type 1 diabetes. Nat Genet 41 703 707
42. CooperJDSmythDJSmilesAMPlagnolVWalkerNM 2008 Meta-analysis of genome-wide association study data identifies additional type 1 diabetes risk loci. Nat Genet 40 1399 1401
43. LevyDEhretGBRiceKVerwoertGCLaunerLJ 2009 Genome-wide association study of blood pressure and hypertension. Nat Genet 41 677 687
44. ChoYSGoMJKimYJHeoJYOhJH 2009 A large-scale genome-wide association study of Asian populations uncovers genetic factors influencing eight quantitative traits. Nat Genet 41 527 534
45. Lastres-BeckerIBrodesserSLutjohannDAzizovMBuchmannJ 2008 Insulin receptor and lipid metabolism pathology in ataxin-2 knock-out mice. Hum Mol Genet 17 1465 1481
46. LiWDDongCLiDZhaoHPriceRA 2004 An obesity-related locus in chromosome region 12q23-24. Diabetes 53 812 820
47. BerridgeMJIrvineRF 1984 Inositol trisphosphate, a novel second messenger in cellular signal transduction. Nature 312 315 321
48. LiaoHJKumeTMcKayCXuMJIhleJN 2002 Absence of erythrogenesis and vasculogenesis in Plcg1-deficient mice. J Biol Chem 277 9335 9341
49. HeZOplandDMWayKJUekiKBodyakN 2006 Regulation of vascular endothelial growth factor expression and vascularization in the myocardium by insulin receptor and PI3K/Akt pathways in insulin resistance and ischemia. Arterioscler Thromb Vasc Biol 26 787 793
50. XiangGSchusterMDSekiTKocherAAEshghiS 2004 Down-regulation of plasminogen activator inhibitor 1 expression promotes myocardial neovascularization by bone marrow progenitors. J Exp Med 200 1657 1666
51. MouquetFCuilleretFSusenSSautiereKMarboeufP 2009 Metabolic syndrome and collateral vessel formation in patients with documented occluded coronary arteries: association with hyperglycaemia, insulin-resistance, adiponectin and plasminogen activator inhibitor-1. Eur Heart J 30 840 849
52. PollexRLHegeleRA 2006 Genetic determinants of the metabolic syndrome. Nat Clin Pract Cardiovasc Med 3 482 489
53. MeigsJB 2000 Invited commentary: insulin resistance syndrome? Syndrome X? Multiple metabolic syndrome? A syndrome at all? Factor analysis reveals patterns in the fabric of correlated metabolic risk factors. Am J Epidemiol 152 : 908-911; discussion 912
54. MeigsJBWilsonPWNathanDMD'AgostinoRBSrWilliamsK 2003 Prevalence and characteristics of the metabolic syndrome in the San Antonio Heart and Framingham Offspring Studies. Diabetes 52 2160 2167
55. MatiseTCAmbiteJLBuyskeSColeSACrawfordDC 2010 The next PAGE in understanding complex traits: study design for analysis of Population Architecture using Genetics and Epidemiology. Am J Epidemiol. In press
56. MusunuruKLettreGYoungTFarlowDNPirruccelloJP 2010 Candidate gene association resource (CARe): design, methods, and proof of concept. Circ Cardiovasc Genet 3 267 275
57. PendergrassSABrown-GentryKDDudekSAmbiteJLAveryCL 2010 Phenotype-wide association study (PheWAS) for exploration of novel SNP and phenotype relationships within PAGE. Genet Epidemiol 35 410 422
58. KeatingBJTischfieldSMurraySSBhangaleTPriceTS 2008 Concept, design and implementation of a cardiovascular gene-centric 50 k SNP array for large-scale genomic association studies. PLoS ONE 3 e3583 doi:10.1371/journal.pone.0003583
59. LiYWillerCJDingJScheetPAbecasisGR 2010 MaCH: using sequence and genotype data to estimate haplotypes and unobserved genotypes. Genet Epidemiol 34 816 834
60. GrundySMBrewerHBJrCleemanJISmithSCJrLenfantC 2004 Definition of metabolic syndrome: Report of the National Heart, Lung, and Blood Institute/American Heart Association conference on scientific issues related to definition. Circulation 109 433 438
61. PriceALPattersonNJPlengeRMWeinblattMEShadickNA 2006 Principal components analysis corrects for stratification in genome-wide association studies. Nat Genet 38 904 909
Štítky
Genetika Reprodukční medicínaČlánek vyšel v časopise
PLOS Genetics
2011 Číslo 10
- Kazuistika – Perspektivy využití precizované medicíny v rámci personalizované specifické terapie onkologických pacientů
- Nobelova cena za chemii pro genetické nůžky: Objev, který změní naši budoucnost?
- Technologie na bázi RNA v klinické praxi: od přebarvených petúnií k terapii vzácných a dosud jen obtížně léčitelných chorob u lidí
- „Nepředstavovali jsme si, že náš výzkum povede přímo ke vzniku nových léků, dokonce ještě za našeho života“
- Bezplatné služby pro diagnostiku ATTRv amyloidózy pro kardiology
Nejčtenější v tomto čísle
- The Glycobiome Reveals Mechanisms of Pentose and Hexose Co-Utilization in Bacteria
- Global Mapping of Cell Type–Specific Open Chromatin by FAIRE-seq Reveals the Regulatory Role of the NFI Family in Adipocyte Differentiation
- Genetic Determinants of Serum Testosterone Concentrations in Men
- MicroRNA Expression and Regulation in Human, Chimpanzee, and Macaque Brains
Zvyšte si kvalifikaci online z pohodlí domova
Mazová zátka a její řešení
nový kurzVšechny kurzy