
Identification of Genomic Regions Associated with Phenotypic Variation between Dog Breeds using Selection Mapping
The extraordinary phenotypic diversity of dog breeds has been sculpted by a unique population history accompanied by selection for novel and desirable traits. Here we perform a comprehensive analysis using multiple test statistics to identify regions under selection in 509 dogs from 46 diverse breeds using a newly developed high-density genotyping array consisting of >170,000 evenly spaced SNPs. We first identify 44 genomic regions exhibiting extreme differentiation across multiple breeds. Genetic variation in these regions correlates with variation in several phenotypic traits that vary between breeds, and we identify novel associations with both morphological and behavioral traits. We next scan the genome for signatures of selective sweeps in single breeds, characterized by long regions of reduced heterozygosity and fixation of extended haplotypes. These scans identify hundreds of regions, including 22 blocks of homozygosity longer than one megabase in certain breeds. Candidate selection loci are strongly enriched for developmental genes. We chose one highly differentiated region, associated with body size and ear morphology, and characterized it using high-throughput sequencing to provide a list of variants that may directly affect these traits. This study provides a catalogue of genomic regions showing extreme reduction in genetic variation or population differentiation in dogs, including many linked to phenotypic variation. The many blocks of reduced haplotype diversity observed across the genome in dog breeds are the result of both selection and genetic drift, but extended blocks of homozygosity on a megabase scale appear to be best explained by selection. Further elucidation of the variants under selection will help to uncover the genetic basis of complex traits and disease.
Published in the journal:
. PLoS Genet 7(10): e32767. doi:10.1371/journal.pgen.1002316
Category:
Research Article
doi:
https://doi.org/10.1371/journal.pgen.1002316
Summary
The extraordinary phenotypic diversity of dog breeds has been sculpted by a unique population history accompanied by selection for novel and desirable traits. Here we perform a comprehensive analysis using multiple test statistics to identify regions under selection in 509 dogs from 46 diverse breeds using a newly developed high-density genotyping array consisting of >170,000 evenly spaced SNPs. We first identify 44 genomic regions exhibiting extreme differentiation across multiple breeds. Genetic variation in these regions correlates with variation in several phenotypic traits that vary between breeds, and we identify novel associations with both morphological and behavioral traits. We next scan the genome for signatures of selective sweeps in single breeds, characterized by long regions of reduced heterozygosity and fixation of extended haplotypes. These scans identify hundreds of regions, including 22 blocks of homozygosity longer than one megabase in certain breeds. Candidate selection loci are strongly enriched for developmental genes. We chose one highly differentiated region, associated with body size and ear morphology, and characterized it using high-throughput sequencing to provide a list of variants that may directly affect these traits. This study provides a catalogue of genomic regions showing extreme reduction in genetic variation or population differentiation in dogs, including many linked to phenotypic variation. The many blocks of reduced haplotype diversity observed across the genome in dog breeds are the result of both selection and genetic drift, but extended blocks of homozygosity on a megabase scale appear to be best explained by selection. Further elucidation of the variants under selection will help to uncover the genetic basis of complex traits and disease.
Introduction
There are more than 400 breeds of domestic dog, which exhibit characteristic variation in morphology, physiology and behavior. This astonishing phenotypic diversity has been molded by two main phases of evolution: 1) the initial domestication from wolves more than 15,000 years ago, where dogs became adapted to life in closer proximity to humans and 2) the formation of distinct breeds in the last few hundred years, where humans chose small groups of dogs from the gene pool and strongly selected for novel and desirable traits [1], [2]. A by-product of these processes has been that many dog breeds suffer from a high incidence of inherited disorders [3], [4].
Its unique population history makes the dog an ideal model organism for mapping the genetic basis of phenotypic traits due to extensive linkage disequilibrium (LD) and a reduction in haplotype diversity due to genetic drift in isolated populations [3]-[5]. Another major advantage of the canine model is that much of the variation in morphological characteristics in dogs appears to be governed by a relatively small number of genetic variants with large effect [6]. This is likely because novel variants with large effects are preserved by artificial selection. This is in strong contrast to humans where morphological variation in traits such as height appears to be controlled by hundreds of loci with small effects, which have proven extremely difficult to catalogue [7]. Identifying the targets of artificial selection in dog breeds is therefore an extremely promising approach for identifying genetic variants involved in phenotypic variation, which could greatly facilitate the identification of similar variants and novel molecular pathways in humans.
Several loci have now been identified that control variation in morphological traits between dog breeds. In some cases, variation in a trait occurs within a breed, and long blocks of LD can be used to identify the locus responsible using genome wide association studies (GWAS). Using this approach loci involved in traits including size (IGF1) [8], coat type (RSPO2, FGF5, KRT71) [9] and coat color (MITF, CBD103) [10], [11] were identified in single breeds, and it was shown that variation in these loci is also correlated with phenotypic variation between breeds. An alternative approach, when a particular trait is shared by several breeds, is to perform across-breed GWAS. In general, levels of LD decay much faster between breeds, and this reduces the power to detect association [11]. However, selection acts to fix long haplotypes bearing the causative variant, thus increasing levels of LD between breeds in regions under selection. Jones et al. [12] used a sparse marker set and across-breed GWAS to identify correlations with a number of morphological traits, such as size, height, and shape of ears, snout and limbs, which was further refined by Boyko et al. [6] using 80 dog breeds and ∼61,000 SNPs. Across-breed GWAS have also been used to identify an FGF4 retrogene associated with chondrodysplasic breeds [13] and the THBS2 locus associated with brachycephalic breeds [14].
Genomic regions with a high degree of genetic differentiation between breeds are also indicative of selection. A large proportion of SNPs with high FST between dog breeds are found in loci associated with phenotypic traits such as size, ear morphology and coat color [6]. Akey et al. [15] scanned patterns of variation in 10 dog breeds and ∼21,000 SNPs using a 1 Mb sliding windows to identify larger regions with elevated FST in particular breeds. This scan identified many regions likely to be under selection in one or more of the breeds in their dataset. Notably, a highly differentiated interval in Shar-Pei on chromosome 13 contains the HAS2 gene and is likely associated with the wrinkled skin phenotype of this breed [15], [16].
Although a large number of loci under selection have now been identified, the genetic basis of much of the phenotypic variation in dog breeds and particularly behavioral traits remains unexplained. One drawback of previous studies is the use of SNP arrays with relatively low coverage of the genome. With the development of a new high-density array it is now possible to examine the dog genome at much higher resolution, allowing a comprehensive characterization of regions under selection. Genetic variants under selection in dogs can be loosely divided into two categories: 1) those that control variation in common traits such as size and ear carriage, which segregate across many breeds [6], [8] and 2) those that encode rare traits that present in one or a few breeds, such as brachycephaly, chondrodysplasia and skin wrinkling [13], [14], [16].
Here we implement a variety of approaches to identify both these types of loci. In cases where a common trait has been identified, it is possible to search for genotype-phenotype correlations. We attempt to identify both behavioral and morphological traits that vary between breeds using across-breed GWAS. We also use FST statistics to identify additional SNPs that have high variability in frequency between breeds. These methods identify known loci and indicate new regions that may be involved in common trait variation.
The action of selection can potentially be identified by examining patterns of variation in individual breeds in order to detect the characteristic signature of selective sweeps. This signature is characterized by the presence of long haplotypes, a skew in allele frequency, reduced heterozygosity, and elevated population differentiation. A large number of statistical methods have been developed to detect sweeps based on these different patterns [17]-[22]. The formation of dog breeds occurred during an extremely brief evolutionary time, and likely involved rapid fixation of haplotypes under strong artificial selection. Under this scenario, simulations suggest that statistics based on FST and differences in heterozygosity are likely to be most powerful. [23]. Furthermore, dog breeds are known to be characterized by extensive LD and limited haplotype diversity, including long blocks of homozygosity, which reflect the action of population bottlenecks and selective breeding. This suggests that tests based on allele frequency spectrum and haplotype length will be of limited applicability, as many genomic regions are essentially devoid of genetic variation. We therefore base our approach to identify selective sweeps on pairwise comparisons of both FST and heterozygosity between breeds.
The presence of long blocks of homozygosity in the dog genome [1], [11] is likely to reflect the action of both selection and genetic drift. We therefore conduct extensive coalescent simulations in order to distinguish between these processes. These simulations incorporate a realistic model of dog population history under neutrality to provide null distributions to compare with the real data. We also conduct a comprehensive characterization of SNP variation in a 3 Mb region encompassing several loci with extreme population differentiation that are associated with at least two morphological traits.
Results
High-density canine array design and evaluation
Our first goal was to develop a high-density, high-accuracy mapping array with uniform SNP coverage across the whole genome. Since the SNP map from the canine genome project, although containing >2.8 million SNPs at fairly even coverage, still contained gaps, we first performed targeted resequencing within 1,555 regions that lie within intervals >40 kb containing no known SNPs in unique sequence. We performed Roche NimbleGen array capture to enrich these regions followed by sequencing using the Illumina Genome Analyzer on 4 pools containing multiple samples of a single dog breed (Irish Wolfhounds, West Highland White Terrier, Belgian Shepherds and Shar-Pei) and one pool of wolf samples. In total, we discovered 4,353 additional high-quality SNPs using this method. We selected SNPs from this improved map to form the “CanineHD” array panel. We generated an initial panel of 174,943 SNPs that were included on the array of which 173,622 (99.2%) give reliable data. These loci are distributed with a mean spacing of 13 kb and only 21 gaps larger than 200 kb. Loci with unreliable SNP calls, potentially due to copy number polymorphism, were not included in the analysis. In total, 172,115 are validated for SNP genotyping and 1,547 are used only for probe intensity analyses. This is a significant improvement compared with the largest previously existing array, which has 49,663 well performing SNPs, with a mean spacing of 47 kb and 1,688 gaps larger than 200 kb. Figure S1 shows the distribution of SNPs in 100 kb windows across the genome. The improvement in coverage is particularly striking on the X chromosome, where >75% of 100 kb windows contain no SNPs on the previous array, but <5% of windows do not contain SNPs on the CanineHD array.
Of all the SNPs on the array, 0.9% are novel SNPs discovered by the targeted resequencing experiment. The remaining SNPs have been previously described: 65.1% of them were present in a comparison of the boxer reference genome with a previously sequenced poodle, 21.7% were present in alignments of low coverage sequencing reads from various dog breeds to the boxer reference genome, 25.4% were present within the boxer reference and 1.2% were present in alignments of wolf and/or coyote sequencings with the reference boxer genome. There is therefore a bias in the way that SNPs were ascertained: all of them were identified in a comparison involving the boxer reference assembly. However this has not had a great impact on the number of SNPs polymorphic in different breeds (see below). The array was initially evaluated using 450 samples from 26 breeds termed the “Gentrain” dataset. Within this dataset, average call rates were 99.8% and reproducibility and Mendelian consistency were both >99.9%. A subset of 24 samples generated by whole genome amplification (WGA) of 12 blood and 12 cheek swab samples produced slightly lower call rates (blood-WGA 99.3%; buccal-WGA 98.9%). Probe intensities from the array can also be used to analyze copy number polymorphisms, although this is not evaluated here.
Dataset construction
To perform a broader analysis of canine breed relationships and selective sweeps, we constructed a larger dataset consisting of unrelated samples from the Gentrain dataset, and unrelated control dogs genotyped for disease gene mapping studies from multiple breeds as part of the LUPA consortium. This dataset, which we refer to here as the “full LUPA genotype dataset” consists of 509 dogs from 46 diverse breeds and 15 wolves, genotyped on the CanineHD array. These include 156 dogs from 13 breeds derived from LUPA control dogs and 353 dogs from 33 breeds from the Gentrain dataset (See Table S1 for full details). A subset of this dataset, referred to here as the “reduced LUPA genotype dataset” is made up of all the samples in the 30 breeds (plus wolf) with more than 10 samples in the full dataset (471 samples in total).
Table 1 shows patterns of polymorphism in the reduced LUPA genotype dataset. In total, 157,393 SNPs on the array were polymorphic (90% of SNPs on the array). A mean of 119,615 SNPs (69%) were polymorphic within a single dog breed. Hence although there is a bias in the way that SNPs were ascertained, there is a substantial amount of variation within all breeds surveyed. On average 39 SNPs were polymorphic only in one breed, although this figure shows large variation between breeds. A subset of 1,471 SNPs were variable in wolves but not within any dog breed. However, most of these SNPs were originally discovered by comparisons of sequences from different dog breeds, which suggests that they are also variable between (but not within) dog breeds.

Evolutionary relationships between dog breeds
We used the CanineHD array to investigate breed relationships by constructing a neighbor-joining tree [24] of raw genetic distances in the full LUPA genotype dataset (Figure 1). Three main features are obvious: 1) Dogs from the same breed almost invariably cluster together. This reflects the notion that modern breeds are essentially closed gene pools that originated via population bottlenecks. 2) Little structure is obvious in the internal branches that distinguish breeds. This is consistent with the suggestion that all modern dog breeds arose from a common population within a short period of time and that only a very small proportion of genetic variation divides dog breeds into subgroups. 3) The internal branches leading to boxer and wolf are longer than those leading to other breeds. The long boxer branch can be explained by the fact that a large proportion of the SNPs were assayed by comparing boxer with other breeds, which implies that the dataset is enriched for SNPs that differ between boxer and other breeds. The longer wolf branch probably reflects more distant relatedness.

Some breeds show a tendency to group together in the tree, such as breeds of retrievers, spaniels, setters, and terriers. However, the length of the internal branches leading to these clusters is only a small fraction of the average total length of branches in these clusters, which indicates that genetic variation in dogs is much more severely affected by breed creating bottlenecks than it is by historical origins of various breeds, although detailed analysis of these data has power to reveal their historical origins [25]. The most obvious clustering of breeds is exhibited by two wolf hybrids: Sarloos and Czechoslovakian wolf dog, which exhibit a closer relationship to the wolf than other breeds as predicted by their known origin [26]. The German shepherd also clusters with this group, although this is likely to be a result of its close relationship with the Czechoslovakian wolf dog, rather than with wolf. The tree is consistent with previous studies and supports the accuracy and reliability of the array. Although the long boxer branch likely reflects SNP ascertainment bias on the array, the tree reflects extensive polymorphism both within and between breeds. This suggests the SNP ascertainment scheme is not problematic and that the array is well suited for both within and across breed gene mapping.
We performed coalescent simulations modeling the ascertainment bias, sample size, and inferred recombination rate in the true dataset (see Materials and Methods) in order to predict the expected patterns of genetic diversity that we expect to observe within and between breeds in the absence of selection. The bottleneck population sizes at breed creation used in the simulations are presented in Table S2. The decay of LD in the simulated data closely matches the real decay in LD (Figure S2).
Across-breed GWAS: morphological traits
To identify genetic variation associated with common traits that vary among breeds, we performed across-breed GWAS using the full LUPA genotype dataset. A list of traits and their variation between breeds is in Table S3. Each sample was given a value corresponding to the standardized breed phenotype for the trait under study. We performed quantitative association studies for size and personality traits whereas other traits were binary coded. For each GWAS, we assayed genome-wide significance by permuting the phenotype of each breed, assigning each dog of the same breed with identical phenotype values. The true significance of genotype-phenotype correlation at each SNP was compared with the maximum permuted value of all SNPs across the array in order to estimate genome-wide significance (see Materials and Methods). This permutation procedure corrects for the extreme population substructure present in dog breeds.
Using this method we were able to replicate several known associations. We first performed a GWAS comparing 4 breeds with furnishings (a coat type with moustache and eyebrows [9]) compared to 42 without them. Genome-wide significant associations were observed at 3 SNPs distributed located between 10.42 - 11.68 Mb on chromosome 13. The most strongly associated SNP is at 11,678,731 (Pgenome<0.001), 44 kb from the causative SNP previously identified in RSPO2 [9]. We next scanned the genome for associations with size, using weight in kilograms as a proxy (data taken from [8]; see Table S3). The most strongly associated SNP was located on chromosome 15 at 44,242,609 (Pgenome = 0.004), which is within the IGF1 gene, previously implicated in size variation [8]. Genome-wide significant associations (Pgenome<0.05) were observed at 7 SNPs within an interval between 44.23 - 44.44 Mb. In addition, we observed an association within a previously defined region on chr10 (11,169,956 bp; Pgenome = 0.036). The SNP at chr10 : 11,169,956 is about 500kb upstream of HMGA2, which has been established to be associated with body size variation in other species [27]–[29].
The frequency of the SNP (chr15 : 44,242,609) most strongly associated to size shows a steady decline according to the size of the breed. However, the differences in allele frequency at the SNP chr10 : 11,169,956 are more striking, as one allele appears at very low frequencies in all breeds apart from a number of very small breeds (Yorkshire Terrier, Border Terrier, Jack Russell Terrier, Schipperke), where it is at or close to fixation (Figure S3). Hence, there appears to be relatively continuous variation in frequency in a variant affecting IGF1 between breeds, whereas a variant upstream of HMGA2 appears to have been fixed in a subset of small breeds but shows little variation in allele frequencies in other breeds.
Dog breeds show extreme variation in ear morphology ranging from pricked ears to low hanging dropped ears. We performed a GWAS using 12 breeds with pricked ears and 15 breeds with dropped ears. Within an interval between 10.27 - 11.79 Mb, 23 SNPs had genome-wide significant associations (Pgenome<0.05; Figure 2). The most strongly associated SNP was chr10 : 11,072,007 (Pgenome<0.001), which lies between the HGMA2 and MSRB3 genes. This region has been associated with ear type and body size in previous studies [6], [12]. Using the CanineHD array, we are able to type SNPs at a much higher density in the associated region. There is also large variation between dog breeds in degree of tail curl. We classified breeds in our dataset into 11 with curly tails and 7 with straight tails and performed a GWAS. Six SNPs on chromosome 1 were most significantly associated within an interval 96.26 - 96.96 Mb (Pgenome<0.05; Figure 2), which are downstream of RCL1 and upstream of JAK2 (Figure S4). This region has not been previously associated with tail curl.

Across-breed GWAS: behavioral traits
We performed GWAS to search for variants that affect breed differences in behavior. We first performed a GWAS by comparing 18 bold and 19 non-bold breeds using phenotypic definitions from ref. [12]. Highly significant associations were found at two SNPs on chromosome 10, 11,440,860 (Pgenome<0.001) and 10,804,969 (Pgenome = 0.006), in the same region associated with both drop ear and size. Variation within this region is therefore associated with at least two morphological and one behavioral trait, which may be correlated. The region contains several genes including WIF1, HMGA2, GNS, and MSRB3 (see Figure S5). However, the most significant associations for each trait appear to occur in different places. The SNPs most associated with drop ear and size occur 98 kb apart between the MSRB3 and HMGA2 genes, with the drop ear association closer to MSRB3, whereas the top boldness association occurs within an intron of HMGA2, 271 kb 3′ of the size association. There is however a strong correlation between the bold and non-bold breed classifications and the drop ear and size classifications. All prick eared and small dogs were classified as bold in the dataset, whereas all drop eared dogs were classified as non-bold, with the exception of Bernese Mountain Dog (see Table S3).
Breed averages for five personality traits measured objectively under controlled conditions were obtained from the Swedish Kennel Club. The traits are defined as sociability, curiosity, playfulness, chase-proneness and aggressiveness [30] and have been shown to be consistent among multiple tests of the same dog [31]. We performed quantitative GWAS using the breed-average trait values presented in Table S3. We observed significant associations at a number of SNPs for the trait sociability, which measures a dog's attitude toward unknown people (Figure 2). No SNPs reached genome-wide significance, but a large number of SNPs on the X chromosome also showed strong association. In order to accurately measure genome-wide significance in the sex chromosomes compared to autosomes we removed male dogs from the analysis. This analysis identified 10 SNPs with genome-wide significant associations (Pgenome<0.05) in the interval 106.03–106.61 Mb on the X chromosome (see Figure S6). This region was also identified in a previous study [6] to be highly differentiated between breeds and correlated with body size and skull shape.
Single-SNP FST statistics identify SNPs under selection in multiple breeds
Across breed GWAS is a powerful approach for identifying genotype-phenotype relationship for traits shared among breeds. The variants identified by this approach, by definition, have large variation in allele frequencies between breeds. However, there may be many more such SNPs that have been subjected to similar selective pressures for common traits between breeds where the trait is not identified. In order to find such loci, we identified SNPs that exhibit high levels of differentiation between dog breeds using the FST statistics calculated for the >173,000 SNPs in the reduced LUPA genotype dataset.
A total of 240 SNPs have a FST>0.55 and overall minor allele frequency >0.15 in the reduced dataset containing breeds with at least 10 samples. These cut offs are identical to those used by Boyko et al. [6] and are chosen for comparison. In the simulated data, no SNPs pass this cut off (p<0.0001; χ2 test). We then generated a list of highly differentiated regions, by merging all SNPs in this list within 500kb of each other into single regions, resulting in 44 regions containing between 1 and 94 SNPs with elevated FST. Regions with two or more SNPs are presented in Table 2 and the complete list is presented in Table S4. Figure 2 presents a value for each SNP (used for illustration purposes only) that we term “pairwise fixation index” to highlight differences in allele frequencies between breeds. This is defined as pq, where p is the number of breeds where allele A is fixed or close to fixation (frequency >0.95) and q is the number of breeds where allele B is fixed or close to fixation (frequency >0.95). In total 53,944 out of 154,034 variable SNPs have a pq value > 0, indicating that they are fixed for different alleles in at least 2 breeds. The regions of high FST correspond strongly to loci where trait associations have been reported. In particular, 8 of the 9 regions comprised of more than 3 high-FST SNPs overlap known trait-associated regions, and it is likely that most or all of the remaining regions with high FST show a correlation with an as yet undefined trait. Three of these regions were not previously reported in a study based on a less dense array [6] including a region on chromosome 7 (27.99 - 28.15 Mb) containing five highly differentiated SNPs that encompasses the DMD gene. The locations of all regions are marked in Figure 3, which presents a comprehensive map of regions that are likely to contain major loci influencing phenotypic variation between dog breeds.


Three regions longer than 1Mb are identified by this measure, likely signifying regions under strong selection in many breeds. These consist of a 2.6 Mb region on chromosome X that associates with body size, skull shape and sociability, a 2.0 Mb region on chromosome 10 that associates with drop ear, size and boldness and a 2.1 Mb region on chromosome X associated with limb and tail length (see also [6]). Other loci identified include three loci involved in coat type (RSPO2, FGF5, KRT71) [9]. In particular the RSPO2 gene associated with furnishings is found within an extended 0.6 Mb region. The MITF and ASIP (Agouti) genes known to be involved in coat color in dogs [11] are also identified. The region on chromosome 1 identified here as associated with curly tail and previously associated with snout ratio [6] is associated with 4 SNPs with high FST across 50 kb. Other genes of note identified are LCORL, known to associate with human height [27], [29], KITLG, associated with coat color in other species [32] and several genes with key developmental roles, such as sonic hedgehog (SHH) involved in patterning in the early embryo, msh homeobox 1 (MSX1), involved in embyrogenesis and bone morphogenic protein 1 (BMP1) involved in bone development.
Genome-wide scans for signatures of selective sweeps in single breeds
Rare selective sweeps corresponding to regions of the genome under selection in only one or a small number of breeds in our dataset cannot be detected by across-breed GWAS due to lack of power. They also have a weak effect on FST values at single SNPs across all breeds compared to regions under selection in many breeds. In order to identify such rare sweeps, we scanned patterns of variation in the reduced LUPA genotype dataset to identify extended regions where haplotypes had become fixed in one or more breeds, leading to a local reduction in genetic variation and increase in population differentiation. We analyzed 150 kb sliding windows, overlapping by 25 kb in each breed compared with other breeds using two statistics. The first statistic, Si, is calculated by summing regional deviations in levels of relative heterozygosity across the genome between two breeds compared to the genomic average and summing across all pairwise comparisons. Relative heterozygosity is defined as the number of SNPs segregating in a genomic window in one breed divided by the number of SNPs segregating in that window in two breeds under comparison. Hence, regions with low Si in a breed contain few segregating SNPs compared to other breeds. The second statistic, di, was implemented by Akey et al. [15], and is based on pairwise FST values normalized for a given breed relative to the genome-wide average, summed across all pairwise combinations involving the given breed. Regions of high di in a particular breed exhibit a large difference in allele frequencies compared with other breeds.
We first identified windows with Si or di values in an extreme 1% tail of their respective distributions (the bottom 1% for Si and top 1% for di). Overlapping windows were then collapsed into larger regions (see Materials and Methods). These regions represent a map of blocks of reduced heterozygosity or elevated population differentiation in each breed. We repeated our analysis of di and Si on the simulated data (see above). For both statistics, the average length of regions identified was similar in real versus simulated datasets. However, there was a strong excess of regions >250 kb in the real compared with simulated datasets, which likely reflects regions influenced by selection. In order to distinguish regions generated by genetic drift compared with those generated by selective sweeps we first estimated a marginal p-value for each block, equal to the proportion of simulated blocks with longer lengths in the same breed. We then adjusted these p-values using a 5% False Discovery Rate (FDR; see Materials and Methods and ref. [33]). In total 524 high confidence putative sweeps (an average of 17 per breed) were identified using the Si statistic, with a mean size of 475 kb. However, none of the regions identified by the di statistic remained significant after FDR correction. Figure S7 shows the distribution of significant Si regions in the dog genome.
Full lists of regions identified by the Si and di analyses including the marginal and FDR corrected p-values are presented in Table S5 and summary statistics of these regions are presented in Table S6. These regions are also available as a UCSC annotation dataset (see Materials and Methods for URLs). The UCSC browser offers a graphical display of Si and di regions as well as di values for all SNPs analyzed [34]. Table S7 shows the overlap between these regions and those identified in previous studies (refs. [6] and [15]).
Long regions of reduced heterozygosity are identified by the Si statistic
The Si test identifies blocks of the genome where one breed has little or no variation consistent with fixation of a long haplotype by a selective sweep. On average, only 19.9% of SNPs have segregating variants in these regions in the breed where they are identified compared with the genome average of 74.5%. Among the 524 putative sweeps are several loci already implicated in breed-defining characters. Notably, a 590 kb region of low Si overlapping the FGF4 retrogene on chromosome 18 associated with chondrodysplasia in Dachshunds. A 1.4 Mb region of low Si overlapping the HAS2 gene implicated in skin wrinkling [16] is observed in Shar-Pei. Regions in the vicinity of the RSPO2 locus implicated with furnishings are observed in 2 breeds, which both have furnishings (Yorkshire Terrier and Standard Poodle). However, many variants implicated in phenotypic variation between breeds are not strongly associated with regions of reduced Si. No putative sweeps overlapping the IGF1 locus are identified in small breeds using this statistic. This is likely to be because there appears to be continuous variation in allele frequency at this locus between breeds rather than complete fixation of certain haplotypes in several breeds (see Figure S3).
Table 3 shows the top 20 longest regions of significantly reduced Si. It should be noted that two pairs of putative sweep regions occur at contiguous locations in the same breed (no. 2 and 12 in Beagle and no. 5 and 6 in Irish Wolfhound), which could potentially represent single selective sweeps. The longest region we identified is 3.1 Mb long (chr22 : 5.3–8.4 Mb) in beagles. This region overlaps 3 other putative sweeps within the top 20 in other breeds (Gordon Setter, Rottweiler, and Newfoundland) whereas no other regions in the top 20 are overlapping. As this and other regions with strongest evidence for sweeps are long and contain many genes, it is not possible to identify the locus under selection in a single sweep. However, it is interesting to note that they contain genes associated with disease in humans and dogs including epilepsy (KCNQ5), cancer (NPM1, FGR), and autoimmune disease (IL6). A long sweep on chromosome 30 in Golden retrievers spans the RYR1 gene, involved in the skeletal muscle calcium release channel and implicated in canine malignant hyperthermia by linkage analysis [35]. We also identified a number of genes involved in spermatogenesis and fertilization (SPAG1, FNDC3A, CLGN) which is a category often enriched in genes under positive selection in other species [36].

In cases where multiple breeds are affected by selection acting on the same variant, it may be possible to narrow an interval containing the causative mutation by identifying a core region of identity by state (IBS) between all breeds where haplotypes are shared, most likely reflecting common ancestry. We searched our dataset for regions with significant drops in Si that overlapped between different breeds. We then identified the maximal region where the same haplotype was fixed in all breeds identified. For many significant long regions we were able to identify shorter regions of IBS. The regions shared by 3 or more breeds are shown in Table 4 and a full list is in Table S5. As a validation of this method, we identified a 187 kb region where an identical haplotype is fixed among the 3 breeds with furnishings where we identified a sweep spanning the previously defined causative indel (region 14). Hence this method is able to identify interval containing the causative mutation in shared region of identity by descent.
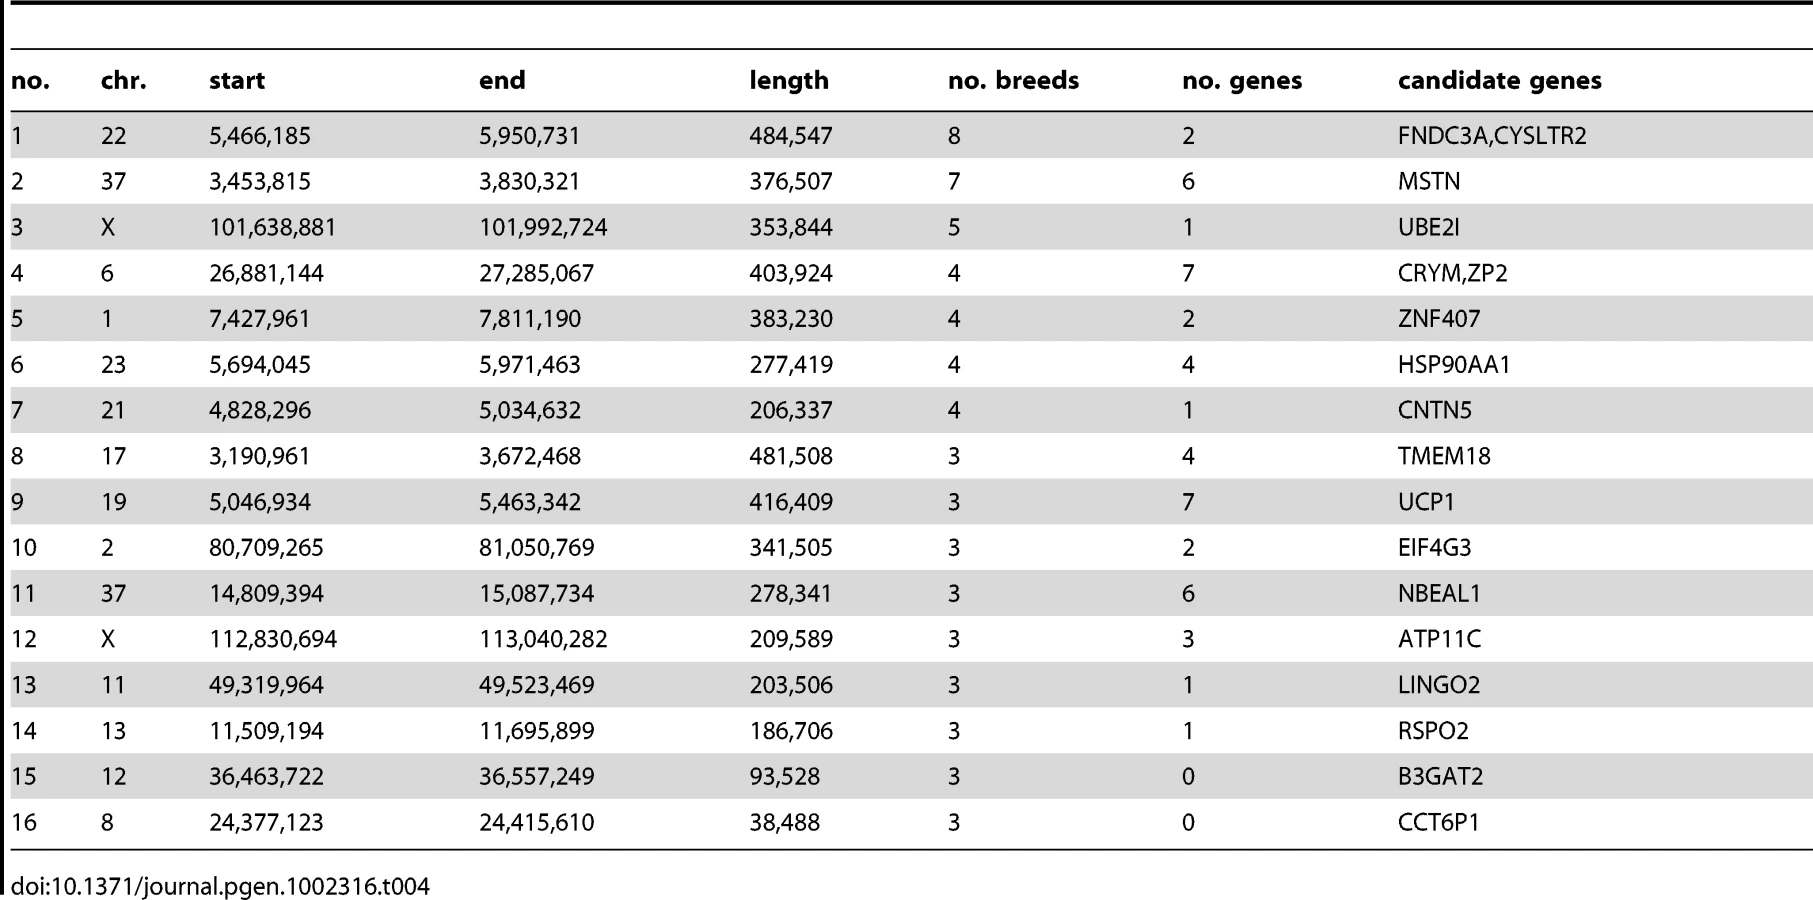
The inferred selective sweep shared by the most breeds in this analysis was a 485 kb haplotype on chromosome 22 (5.4–5.9 Mb) shared by 8 breeds (Beagle, Border Terrier, English Bulldog, Gordon Setter, Irish Wolfhound, Newfoundland, Rottweiler, Weimaraner). This region contains 2 genes: FNDC3A, fibronectin type III domain containing 3A [37], which is involved in spermatogenesis and also expressed in odontoblasts indicating a role in odontogenesis, and CYSLTR2 cysteinyl leukotriene receptor 2, a member of the superfamily of G protein-coupled receptors. A 402 kb haplotype on chromosome 37 (3.5–3.8 Mb) is shared among 7 breeds (Bernese Mountain Dog, Beagle, Border Terrier, Doberman, Elkhound, Finnish Spitz, Golden Retriever). This haplotype contains 7 genes including the MSTN (myostatin) gene. This gene is associated with double muscling in cattle [38] and in a similar phenotype observed in whippets [39]. It is therefore plausible that this region has been a target of selection in multiple dog breeds in order to modify muscle mass. A 354 kb haplotype on chromosome X is fixed in 5 breeds (101.6–102.0 Mb) and contains only one gene: UBE2I, an ubiquitin-conjugating enzyme. This enzyme has been shown to interact with MITF, involved in coat color, and is suggested to be a key regulator of melanocyte differentiation [40] although it also has a number of other features.
Regions of elevated population differentiation are identified by the di statistic
There are many extremely differentiated regions although none of them passed the 5% FDR correction for length (see Table S5 for full list). Variation in Si and di statistics in the 10 longest regions identified by the Si test is presented in Figure S8. This comparison of the di and Si tests reveals that the increases in di often occur within a more restricted region of a large block of fixed haplotype from the Si tests, indicating that they represent regions where an otherwise rare ancestral sub-haplotype has been fixed in a certain breed. It therefore appears that many regions detected by di and Si tests are complementary. Among the top 20 longest putative sweeps identified by the di statistic (Table 5) are 3 overlapping sweeps that also overlap the common sweep containing FNDC3A and CYSLTR2 identified by the Si test. We also identify putative sweeps in 4 breeds overlapping the region associated with drop ear, size and boldness among the top 20 di sweeps. Two putative sweeps in this list overlap a region on chromosome 13 (3.3–5.2 Mb), which is also identified by the Si test. One gene of note in this region is VPS13B, which may have an important role in development and is associated with Cohen syndrome, which has an effect on development of many parts of the body [41]. The second longest putative sweep identified by Si on chromosome 26 is also identified in two of the top 20 longest di regions.

XP-EHH
We performed an additional validation of our results using a third statistic, XP-EHH, which identifies regions where a long haplotype has reached fixation, or is close to fixation in one breed compared with other breeds [18]. We calculated the mean XP-EHH for all of the regions identified by the Si and di tests. For the regions constructed from the top 1% of di (6404 regions) and Si (7618 regions) statistics, mean XP-EHH was -0.94 and -1.13 respectively across all breeds compared with a genome average of zero. This difference is consistent across all 30 breeds and is highly significant (binomial test: P<10−9). This confirms that regions identified by the Si and di tests are associated with unusually long haplotypes at or near fixation in the breeds under selection compared with other breeds.
Functional categories
We analyzed genes closest to all singleton SNPs with high FST for enrichment in gene ontology (GO) categories. The six most significantly overrepresented GO categories were all involved in development. 11 of the 22 genes were found in the “developmental processes category” (P = 0.00036) and tissue, system, organ, anatomical structure and multicellular organismal development were all significantly overrepresented (P<0.0007). These highly differentiated SNPs therefore highlight a number of regions involved in development that are likely to have been modified by artificial selection and contribute to the high diversity of dog breeds.
We next analyzed gene content of all of the regions constructed from the top 1% of di and Si distributions that pass the marginal p-value <0.05 for each breed. We only considered regions containing a single gene, in order to enrich the analysis for true targets of selection, although this list is still expected to contain false positives. There were 119 di regions and 272 Si regions containing one gene only (29 genes shared). We performed GO analysis using human genes with 1∶1 human-dog orthologous relationship. As longer genes are over-represented within long genomic segments containing only one gene, we compared these candidate selection genes to a background dataset with similar length (see Materials and Methods). A total of 40 GO categories were significantly enriched in the Si analysis and 6 in the di analysis (Table 6). Developmental processes, central nervous system, organ development and pigmentation pathways are significantly enriched in Si regions whereas cell communication and signal transduction are the most represented in di regions. These differences in enriched GO categories could potentially reflect differences in the form of selection detected by the two statistics.

A large number of genes detected by the Si analysis are significantly over-represented in several GO categories, which may reflect pleiotropic effects. A total of 23 of the genes belong to at least 10 enriched GO categories. As an example, one candidate selection gene the thyroid stimulating hormone receptor (TSHR) is involved in 25 enriched GO categories, including central nervous system and regulation of nucleotide biosynthetic process. This gene is suggested to have an essential role in photoperiod control of reproduction in vertebrates, in organ development and in metabolic regulation and has been recently been implicated as an important domestication gene in chicken [42].
The two larger biological processes over-represented by di regions are ‘cell communication’ and ‘signal transduction’, which are represented by 16 and 15 genes, respectively. A region on chromosome 3 with strong statistical support contains the gene for insulin-like growth factor receptor1 (IGF1R), also detected by Si statistics. This is a strong candidate gene in relation to selection for growth, a phenotype that has been strongly selected in dog. Another example is ANGPT1, which plays roles in vascular development and angiogenesis and contributes to blood vessel maturation and stability. This gene has been identified in a set of positively-selected genes in human Tibetan populations for which selection may have occurred to allow for more efficient oxygen utilization [43]. The presence of TSHR and ANGPT1 in enriched GO categories may suggest that these pathways are commonly involved in recent adaptation.
Fine-scale analysis of a region associated with multiple traits
The region containing the most highly differentiated SNPs identified by the single-SNP FST analysis is 9.8 – 11.8 Mb on chromosome 10. Variation in this region was also found to correlate with multiple traits: drop ear, size and boldness. As boldness shows a strong correlation with the other traits, we focused on analyzing the contribution of variants in this region to drop ear and size. We first analyzed the variation in allele frequencies of the SNPs most associated with size and drop ear across breeds scored for these traits. Size was measured as the breed average in kg, and drop ear was scored on a scale of 1-5 (Figure 4A). The SNP most associated with ear type (chr10 : 11,072,007) showed correlation with this trait, but little association with size. Allele frequencies display continuous variation between breeds. In contrast, the minor allele at the SNP most associated with size (chr10 : 11,169,956) was not present in most breeds, but close to fixation in a subset of small breeds (Chihuahua, Yorkshire Terrier, Border Terrier, Schipperke, Jack Russell Terrier). All of these breeds were also fixed for the prick ear allele at the ear type SNP. Based on this analysis, we hypothesize that combinations of two alleles at these two SNP loci result in three main haplotypes affecting ear type and body size segregate among dogs (Figure 4B). The small size-pricked ear combination is present in the small (non-chondrodysplasic) breeds mentioned. All other breeds genotyped possess the large-prick or large size-drop ear haplotype, and the small size-drop ear combination is not observed in our dataset.

In order to identify variants potentially responsible for these traits, we comprehensively characterized variation in a genomic segment encompassing this region (chr10 : 9.5 Mb – 12.5 Mb) using Roche NimbleGen hybrid capture and sequencing using an Illumina Genome Analyzer. We choose 3 breeds with the dropped ear phenotype (Lagotto Romagnolo, Leonberger, and Bernese Mountain Dog) and 3 with the pricked ear phenotype (Chinese Crested, Schipperke, and Finnish Spitz). Two of the pricked ear breeds are small, with breed average <6 kg: Chinese Crested and Schipperke. We sequenced each breed independently, using a pool of 5 dogs from each breed. On average 8 million reads per pool were produced, of which 48% mapped to the 3 Mb region on chr10. In total, 61% of this region was mapped by at least one read. In the 68% of the region defined as non-repetitive, reads mapped to 98% of bases, at an average coverage depth of 114x. By comparison with the reference sequence, we identified fixed differences and polymorphic sites within each breed. Differences in the pattern of polymorphism between dropped and pricked eared dogs are clearly apparent, and drop eared breeds exhibit a lower level of variation on average compared with prick eared dogs, which is mainly restricted to a ∼2 Mb region between 9.5 Mb and 11.5 Mb (Figure 5).

We next identified SNPs in this region that were completely fixed for different alleles in dropped and pricked eared breeds. These SNPs are distributed unevenly across the region, and a peak in the number of such fixed SNPs occurs around 11.3-11.5 Mb. In total 287 SNPs or small indels were completely fixed for different alleles in the drop ear compared with pricked ear breeds. Twenty-five of these SNPs reside in regions that show evidence for sequence conservation and are therefore candidates for being the causative mutation (Table S8). Of the 6 breeds, only Chinese Crested was completely fixed for the small size allele at chr10 : 11,169,956 in our dataset. We therefore identified SNPs fixed for different alleles in Chinese Crested compared with all other breeds except Schipperke (this breed was excluded because it is small but was not completely fixed for the size-associated SNP from the GWAS). In total 297 SNPs or small indels were completely fixed for different alleles in these two groups. Of these, 17 were in conserved regions and are therefore candidates for affecting size (Table S9).
Discussion
Here we present a comprehensive catalogue of genomic regions that are candidates for being affected by artificial selection in dogs using the densest panel of SNPs to date. We focus on two main types of variant: 1) common variants that affect variation in a trait in many breeds and 2) rare variants that have undergone selective sweeps in one or a few breeds. For the first category, we identify loci where variation correlates with morphological traits such as body size and tail curl, and behavioral traits such as sociability and boldness. We also identify several loci with evidence for a high degree of population differentiation between breeds, for which the connection with phenotypic traits in dogs is not known, but that are known to associate with traits such as pigmentation and body size. To identify loci in the second category, we searched for regions with reduced heterozygosity and high population differentiation, characteristic of selective sweeps. This analysis identified loci known to be associated with breed-defining characteristics such as chondrodysplasia, skin wrinkling, and furnishings. In addition, we identify several extended regions with reduced heterozygosity > 1 Mb consistent with recent selective sweeps in one or more breeds, including striking examples such as a region containing the FNDC3A and CYSLTR2 genes, and a region containing the MSTN (myostatin) gene that both bear the signal of selection in multiple breeds.
The candidate selection loci we identified are strongly enriched for genes involved in developmental and metabolic processes. In general, the GO terms we find to be significantly enriched are different from analyses of selection in natural populations, in which genes commonly targeted by positive selection include those involved in immunity and defense, olfaction and responses to external stimuli [36]. These results are consistent with the idea that artificial selection in domestic animals target different functional categories than natural selection. This result contrasts with that of Akey et al. [15] who found genes involved in immunity and defense to be overrepresented among their candidate selection regions.
Artificial selection on dog breeds coincided with breed creation bottlenecks leading to genetically distinct breeds fixed for novel traits [1], [3], [4]. Hence a large proportion of phenotypic and genetic variation is apportioned between but not within breeds. It is notable that 35% of polymorphic SNPs we analyzed are fixed or almost fixed for alternative alleles in two or more breeds. This is in sharp contrast to the differences between human populations, where only 78 near-fixed differences, that are all strong candidates for being under selection, were observed between four populations among 15 million SNPs identified using whole-genome resequencing [44]. The strong influence of genetic drift on genetic variation in dog breeds has also led to random fixation of long haplotypes and it is estimated that on average ∼25% of the genome lies within a homozygous block >100kb in an average breed. This suggests that functional genetic variation has also been affected by genetic drift. This background of fixation of haplotypes by drift makes it extremely difficult to distinguish the signal of a selective sweep from background variation, and they may often be indistinguishable.
We performed coalescent modeling using realistic estimates of recombination and demographic parameters in order to compare the length distributions of genomic segments identified by our analyses with those expected under neutrality. These simulations are by necessity an approximation of the actual evolutionary and demographic forces that shaped patterns of genetic variation in dog breeds. In particular, we do not model selection, which may reduce effective population size. Secondly, we assume a simplified demographic model, involving a single domestication bottleneck, and simultaneous breed creation. The true history of dog evolution is likely to be more complex than this, with some breeds showing closer relatedness than others. Nevertheless, long segments identified by the Si and di that pass the 5% FDR cut off are strong candidates for selective sweeps, and contain a number of regions already associated with phenotypic traits.
Simulations indicate that large segments of reduced heterozygosity and elevated FST are expected under neutrality but longer segments of reduced heterozygosity, particularly those longer than 1 Mb, are not expected to occur due to drift alone and hence are more likely to reflect selection. In general we expect segments of reduced heterozygosity to contain causative variants under selection, however, in some cases we observe large blocks of reduced heterozygosity that appear to be broken up into adjacent regions separated by more variable regions. This pattern may reflect heterogeneity in ancestral haplotypes, which makes it difficult to pinpoint the focus of selection. Smaller blocks of elevated di often occur within extended regions of reduced heterozygosity. These probably reflect the fixation of variants that are otherwise rare in the dog population due to hitchhiking on the selected haplotype. However, most variants that are fixed by hitchhiking during a selective sweep are likely to be already common in the population, and therefore will not have a big effect on the di value of a region. This leads to stochasticity in the di statistic, which may explain the fact that even the longest di segments still do not pass a 5% FDR. When even denser surveys of SNP variation (e.g. from whole genome sequencing) are available, a more promising approach could be to identify selective sweeps using reductions in heterozygosity, and identify potential causative variants within these sweeps by their elevated FST (see e.g. [45]).
In addition to aiding in the dissection of the genetic components of phenotypic variation in dog breeds, we anticipate that our fine-scale map of genomic regions of extreme population differentiation and fixation of extended haplotypes will find utility for identification of disease causing variants. Firstly, regardless of whether they are caused by selection or drift, regions with reduced heterozygosity in a particular breed are problematic to interrogate with GWAS and may harbor disease-causing variants that are not tagged on a SNP array. Secondly, genetic variants responsible for breed characteristics may have pleiotropic effects that increase incidence of disease in that breed. Thirdly, disease-causing mutations may have risen in frequency in regions under selection by genetic hitchhiking on haplotypes bearing variants under artificial selection. These considerations suggest that our candidate selection regions warrant additional scrutiny in disease mapping studies. An example of the second effect has recently been highlighted in the Shar Pei breed, where strong artificial selection for genetic variants that likely affect expression of the HAS2 gene is responsible for both the characteristic wrinkled skin of the breed and an increased predisposition to periodic fever syndrome [16].
Our analysis of single-SNP FST across breeds identified a number of extended genomic regions of extreme population differentiation between dog breeds, which harbor variants responsible for commonly varying traits between dog breeds. Genetic variation in some of these regions correlates with multiple traits that vary between dog breeds, in some cases including both morphological and behavioral differences. There are several possible reasons for these multiple associations. One possibility is that these regions harbor multiple variants that each has an effect on different traits. Alternatively the associations could be the result of single mutations with pleiotropic effects that affect multiple traits. It is also possible that traits may correlate with each other for other reasons. For example, there may have been coordinated selection for more than one trait in a subset of breeds, or a subset of breeds may share a trait simply by chance. We have comprehensively surveyed genetic variation in a region of extreme population differentiation on chromosome 10, where genetic variation correlates with body size, drop ears and boldness. As boldness shows strong correspondence with drop ears it is unclear whether this trait is affected by an independent variant in this region. A more detailed analyses of the allele frequencies of SNPs associated with body size and drop ears is consistent with a hypothesis that these traits are controlled by two linked SNPs, which in combination produce three observed haplotypes associated with distinct phenotypes. It is therefore possible that additional regions of extreme population differentiation also harbor multiple variants affecting different traits. Careful genetic dissection of each region is necessary to identify all functional variants and the traits they affect. As extensive LD is found in these regions, it is difficult to determine how many functional variants are present and their precise location. Such analysis would therefore be aided by the use of multiple breeds or populations with less extensive LD in order to narrow down the associated intervals.
In its most extreme form, a selective sweep is characterized by the rapid fixation of a new mutation under selection along with linked genetic variants (a hard sweep). However, less extreme selective episodes (soft sweeps), such as incomplete selective sweeps or selection on standing variation may also be common [46], [47]. It has been argued that polygenic adaptation, where subtle changes in allele frequencies occur at many loci, is the dominant form of phenotypic evolution in natural populations [48]. This type of evolution is likely when variation in a trait of interest is controlled by a large number of loci with small effect, which is now known to be the case with a number of highly heritable quantitative metabolic and morphological traits in humans. A long-term selection experiment in Drosophila melanogaster also uncovers evidence for this kind of adaptation [49]. Artificial selection in dogs appears to have caused genetic variants with much larger phenotypic effects to segregate at high frequencies, resulting in the simplification of the genetic architecture of phenotypic variation. In some cases, breed-defining characteristics such as chondrodysplasia, skin wrinkling and brachycephaly are likely to result from hard sweeps at breed creation. However, many variants with large phenotypic effects appear to show continuous variation between breeds that correlates with particular traits, including genetic variants that associate with body size in the IGF1 locus on chromosome 15 and with drop ear on chromosome 10, suggesting that selection by attenuation of allele frequencies is also common. Hence, although hard sweeps are likely to be a more common form of selection in domestic compared with wild species, it is likely that more minor changes in allele frequencies across many loci also contribute to phenotypic evolution.
The huge phenotypic diversity present in dogs raises the question as to whether levels of functional genetic variation in the ancestral dog population were elevated, adding to the raw material that artificial selection could act on. Relatively higher levels of replacement amino acid changes are found in dogs compared with wolves, possibly indicating a relaxation of selective constraint [50], [51]. There are also a large number of loci in the dog genome polymorphic for the active SINEC_Cf elements [52], which may also contribute to functional genetic variation, although it is not known whether functional variation due to these elements is increased in dogs compared with wolves. It has also been suggested (and disputed) that the dog genome has a high intrinsic mutation rate [53], [54]. There is also great interest in looking for “domestication genes” by identifying loci under selection in domestic species compared to wild ancestors. Investigation of these processes that occurred in the ancestral dog population requires detailed comparisons of patterns of genetic variation in dogs and wolves. As the majority (>98%) of SNPs on the CanineHD array were discovered by comparisons of dog breeds, they are biased against fixed differences between dogs and wolves and wolf-specific SNPs. Additional SNP discovery in wolves is therefore necessary to unravel the evolutionary processes involved in early dog domestication. Whole genome resequencing of both dogs and wolves will be important for a more detailed understanding of these processes.
It is likely that artificial selection in dogs (and other domestic animals) has led to the proliferation of mutations with large effects. This has contributed to the success of the dog as a model for genetic dissection of phenotypic traits. Such variants are likely to be maladaptive in the wild, and may also increase susceptibility to disease. Hence examining regions under selection in breeds may aid in identification of genetic risk factors affecting susceptibility to disease. Studying the extreme variation in forms produced by artificial selection also gives us a window into studying the effects of selection in natural populations, as first realized by Darwin [55]. Understanding the effects of selection on the genomes of domestic animals should give us insight into understanding its effects on nondomestic species, including our own.
Materials and Methods
Ethics statement
Blood samples were taken from dogs by trained veterinarians according to relevant national and international guidelines.
SNP discovery
We scanned the existing list of 2.8 million high quality SNPs and identified 1,555 regions >40 kb (gaps) with no known SNPs in non-repetitive DNA (588 of these are on chromosome X). Gaps >100 kb were divided into a series of shorter ones resulting in a set of 2,375 genomic segments with no known SNPs of average length 50kb. We designed a Roche NimbleGen sequence capture array containing probes matching on average 2.1 kb within each segment, giving a total of 5 Mb. This array was used to enrich pools of DNA from Belgian Shepherds, Irish Wolfhounds, West Highland White Terrier, Shar-Pei and wolves. The samples were then sequenced using an Illumina Genome Analyzer and aligned to the CanFam2 dog reference sequence using MAQ. We identified 4,353 novel SNPs (973 on chromosome X). After updating the canine SNP map with these variants the number of gaps >40 kb was reduced to 714 (392 on chrX).
Design of CanineHD array
We selected SNPs from initial list of 2.8 million augmented by the resequencing to be included in the Illumina CanineHD array. We selected SNPs by scanning the genome using non-overlapping windows of length 11,500 bp (this length was calculated to return the desired number of SNPs). Every SNP in each window was scored and ranked according to a number of different criteria in order to maximize quality, coverage of the genome and a number of other factors according to a scoring criteria (Table S10). The main criteria considered for each SNP were Illumina design score, presence on a list of SNPs known to be informative for studies of canid phylogeny and presence on lists of previous dog SNP arrays (Affymetrix and Illumina). SNPs in repetitive DNA or those that required two bead types on the Illumina array were disfavored. We also included 13 Y chromosome specific SNPs presented in ref [56]. The resultant list was analyzed to identify possible duplicates or incompatibilities between primers. The problematic SNPs were removed, and the final SNP list was edited manually to produce a list of 200k bead types by removing SNPs with the smallest distance to other SNPs.
Genotyping
Genotyping was performed by Illumina Inc., USA (Gentrain dataset) and Centre National de Genotypage, France (LUPA dataset). All data is available at: http://dogs.genouest.org/SWEEP.dir/Supplemental.html.
GWAS
For each trait we performed a GWAS with plink (http://pngu.mgh.harvard.edu/~purcell/plink/), using a breed permutation procedure to determine genome-wide significance implemented using a perl script. Each sample within a breed was first assigned a phenotype corresponding to the breed-specific value of a trait. Traits were either coded as dichotomous or quantitative depending on how they were measured (see below). An association study was performed for each trait followed by a permutation procedure, where the phenotypes of each breed were randomized, always assigning an identical phenotype value to each sample within the same breed. For each GWAS, 1000 permutations were performed, and the real significance values at each SNP were compared to the maximum permuted values across all SNPs in order to calculate genomewide significance.
We used the full LUPA dataset of 46 breeds to perform breed GWAS. The phenotypic values used are shown in Table S2. Personality traits and size were considered as quantitative traits. Other traits were considered dichotomous, and breeds were divided as follows (breed abbreviations in Table 1):
Furnishing association
4 breeds with furnishings (BoT, IrW, StP, TYo) compared with all other breeds. Drop ear association: drop ear breeds (Bgl, BMD, BrS, CKC, CoS, Dac, Dal, ECS, ESS, ESt, GoS, LMu, NFd, ShP, Wei) compared with pricked ear breeds (BeT, Chi, CWD, Elk, Eur, FSp, Gsh, GSl, Hus, Sam, Sar, Sci). Curly tail association: straight tail breed (BoT, DaC, Dal, EBT, EBD, Gry, LRe) compared with curly tail breeds (Elk, Eur, FSp, GSD, Mop, Sar, Sci, Scn, ShP, Hus, Sam, TYo). Boldness association: bold breeds (ASh, BeT, BMD, BoC, BoT, Box, Dal, Dob, Elk, GSh, Hus, JRT, Rtw, Sam, Sci, Scn, ShP, TYo) compared with non-bold breeds (Bgl, BrS, Chi, CKC, Dac, EBD, ECS, ESS, ESt, FcR, GoS, Gry, GRe, IrW, LRe, NFd, NSD, StP, Wei).
The rs numbers corresponding to SNPs mentioned in the text are listed in Table S11.
Phasing and imputation
We phased the genotypes in the reduced dataset containing 471 dogs from breeds with 10 or more samples using fastPHASE [57] version 1 with the default parameters. We analyzed each breed and chromosome separately, dividing the X chromosome into the pseudo-autosomal region (PAR) and nonrecombining portion. Missing genotypes were imputed by the software, and we subsequently removed all SNPs that were not polymorphic or had less than a 100% call rate in all dog samples. In total, 19,176 invariant SNPs were removed: 14,309 on the autosomes and PAR, and 1027 on the nonrecombining X chromosome. An additional 3,840 SNPs were removed due to poor call rate. This dataset was used for subsequent selection scans and coalescent modeling analyses.
Scans for selective sweeps using Si and di statistics
The Si statistic is a measure of the proportion of SNPs that are variable in a region in a particular breed relative to all other breeds. We first divided the genome into 150 kb sliding windows, overlapping by 25 kb. Each window contained on average 10 SNPs; windows with less than 5 SNPs were not retained in the analysis. The same sliding window coordinates were used for the Si and di analyses. Given a pair of breeds i and j and a given genomic window, we define relative heterozygosity as:where hi is the number of polymorphic SNPs in breed i and hj is the number of polymorphic SNPs in breed j in a given genomic window.
Si for a given genomic window in breed i is then calculated as:where E[θij] is the expected value of θij, calculated by comparing all of the SNPs between breed i and j, and sd[θij] is the standard deviation of all sliding windows. The Si statistic was calculated in this manner for all predefined 150 kb sliding windows across the genome, for all 30 breeds in the dataset. The Si statistic was calculated separately for the autosomal regions (including PAR) and the nonrecombining portion of the X chromosome, and was calculated in exactly the same way outlined above for the coalescent simulated data.
Using the same dataset, we calculated FST for each pairwise breed combination. To identify regions with elevated FST calculated the di statistic for each SNP (Akey et al), which is a standardized measure of pairwise FST values involving breed i and all other breeds:where E[FSTij] and sd[FSTij] represent respectively, the expected value and the standard deviation of FST between breed i and j computed from all SNPs. For each breed, di values were calculated for the 150 kb windows used for the Si analysis. We retained, for each breed, windows with an average di within the top 1% of all di values.
For each breed, we retained the top 1% of windows in each breed based on both Si and di statistics. Overlapping windows were then combined to create a set of larger regions for each statistic. We applied this method to both the real and simulated data (see below) after which we compared the distribution of lengths. We then computed a marginal p-value for each region as the proportion of regions defined from the simulated dataset of the same breed that were longer. Finally we corrected the p-values using the Benjamini-Hochberg FDR method [33].
The UCSC graphical display of regions identified by the Si and di statistics as well as di values for all SNPs from the CanineHD array are available at the following URL:
http://dogs.genouest.org/SWEEP.dir/Supplemental.html
Shared haplotype analysis
The aim of this analysis was to identify putative regions of Identity By Descent (IBD) within haplotypes inferred to be involved in selective sweeps in multiple breeds in order to narrow down the boundaries of putative sweep regions. This is based on the assumption that the selected variant was present on an ancestral haplotype prior to breed creation and is shared by multiple breeds. We first identified core regions that overlapped Si sweeps (at the 5% FDR) and were completely homozygous in each breed. Once these fixed regions were defined they were then grouped into clusters of overlapping physical locations between breeds. Where possible, we then identified the region of maximal overlap between all homozygous regions in all of the breeds in a cluster that had been fixed for identical haplotypes.
Cross-population extended haplotype homozygosity (XP-EHH)
In order to calculate XP-EHH for SNPs in our dataset, we first removed SNPs with a minor allele frequency < 5% in the entire dataset. We calculated the EHH statistic between all SNP pairs across all breeds in the whole dataset. We retained SNP pairs with EHH between 0.03 and 0.05 for the XP-EHH analysis. We calculated normalized log XP-EHH scores between these SNP pairs from iHS scores as described by [18]. However, instead of comparing iHS score between pairs of populations, we compared iHS scores in a given breed and SNP pair to the average of iHS scores in all other breeds. The normalization step was performed for each chromosome in each breed separately. In order to confirm the presence of extended haplotypes in putative sweep regions, we averaged XP-EHH scores across these regions in each breed compared to the genomewide average.
Coalescent simulations
We performed whole genome simulations under a realistic demographic model, using variable regional recombination rates as inferred from the original data. The simulation process consisted of three main steps: (1) recombination rate inference, (2) breed bottleneck modeling and (3) main simulations.
Recombination rate inference
We used interval in the LDhat package [58] to estimate the total population scaled recombination rate (ρ = 4Ner) of each dog chromosome, as well as regional recombination rate variation across all chromosomes. For each chromosome, we randomly chose 100 haplotypes from the original data as input for interval. We split the input data into consecutive blocks of 2000 SNPs, each overlapping the previous block by 200 SNPs. Recombination rate estimates from individual blocks were then concatenated to get chromosome wide rate estimates. Interval was provided a look up table downloaded from http://www.stats.ox.ac.uk/~mcvean/LDhat/instructions.html,which assumes a population mutation rate of 0.01. The PAR was analyzed separately from rest of the X-chromosome. To assess the general performance of interval on dog data, we averaged the regional rate estimates obtained here across 5 Mb windows to make it compatible with a previously published, coarse, linkage map [59]. The concordance between the population genetic map and the linkage map is good (Axelsson et al, unpublished). To convert the population scaled recombination rate estimated for the domesticated dog into breed specific rates we first estimated the effective population size of the domesticated dog (Nedog Autosomes = 7752) by comparing the autosomal part of the population genetic map generated here, with that of the linkage map [59]. Then to take a potential bias in reproductive success between males and females into account we used the same approach to estimate the effective population size using only the X-chromosome (Nedog X = 9134).
Modeling breed bottlenecks
We built on previous dog demographic modeling efforts in setting up a simple simulation scheme to estimate the strength of bottlenecks at breed formation for each breed in our dataset. Our model thus assumed an effective population size of the ancient wolf population (Newolf) of 22600 [60]. It furthermore assumed that dog domestication occurred 5000 generations ago, accompanied by an instantaneous decrease in population size to 5560Nedog and that breed formation took place 100 generations ago [60]. The mutation rate was set to 10−8 [1] and the generation time was assumed to be 3 years. We then used MaCS [61] to simulate genome wide replicas of our dataset according to the model described above, for 59 breed bottle neck sizes, ranging from 0.001Newolf - 0.03Newolf (this corresponds to an increment in bottle neck size of 0.0005Newolf for every new simulation). We repeated these simulations for each of the sample sizes represented in the original data (ranging from 10 to 52 haplotypes), in total rendering 767 simulated datasets. All simulations were run using regional recombination rates as inferred in the real data. We also corrected simulated data for ascertainment bias in the original data by providing MaCS with allele frequency distributions from the original data. Next, we estimated LD decay, measured as r2, for markers separated up to a maximum of 500 kb, in the original, as well as all simulated datasets. We subsequently used least squares to fit LD decay curves of real and simulated datasets. The best fitting simulation provided an estimation of bottleneck size for each breed individually.
Main simulation
By implementing the estimated breed bottleneck sizes in the model described above we were then able to simulate a single complete dataset including all breeds in the original dataset. As before, regional recombination rates were inferred from the original data, and ascertainment bias in the original data was corrected for in the simulated data. Finally, we thinned the simulated dataset to match the marker density of the real dataset (one marker every 13,046 bp). The PAR and X-specific parts of the X-chromosome were simulated separately. For the X-specific simulations we adjusted all population sizes according to the difference between Nedog Autosomes and Nedog X.
Functional analysis of gene categories
We selected human orthologs with a 1∶1 human-dog orthologous relationship to perform GO analyses. Biomart version 0.8 (Ensembl v.62) was used to collect orthologous human protein-coding genes. WebGestalt [62], a web-based gene set analysis toolkit, was used to retrieve GO terms associated with human ensembl gene stable IDs. A hypergeometric test computed the statistical significance of over-representations of GO terms that were compared to a background list of genes selected to control for possible gene length bias as observed in the selected gene set. The background set was composed of human genes selected using biomart with 1∶1 human-dog orthologous relationship, longer than 100 kb and with a mean size of 230 kb, similar to the tested set. GO biological processes that were significantly over-represented (p<0.05) were considered.
Resequencing of a candidate selection region on chromosome 10
We selected a 3 Mb region on chromosome 10 (9.5-12-5 Mb) for resequencing in 6 breeds. We first prepared pools of DNA containing 5 samples from each of the breeds (Chinese Crested, Lagotto, Schipperke, Finnish Spitz, Leonberger and Bernese Mountain Dog). We next performed sequence capture using a Roche NimbleGen array containing probes designed to hybridize to this region. This was followed by sequencing using the Illumina Genome Analyzer. Reads were mapped to the dog genome reference sequence using bwa (http://bio-bwa.sourceforge.net/) followed by SNP calling using samtools (http://samtools.sourceforge.net/). Mapping and SNP calling was done independently for each breed and custom scripts were used to identify SNPs with certain patterns of segregation. SNPs in conserved elements were identified relative to those defined by the dog genome analysis based on human-dog-mouse-rat alignments, and on identification of phastcons elements within mammals based on alignments of 44 vertebrates, converted from human to dog coordinates by LiftOver (http://genome.ucsc.edu/).
Supporting Information
Zdroje
1. Lindblad-TohKWadeCMMikkelsenTSKarlssonEKJaffeDB 2005 Genome sequence, comparative analysis and haplotype structure of the domestic dog. Nature 438 803
2. VilàCSavolainenPMaldonadoJEAmorimIRRiceJE 1997 Multiple and Ancient Origins of the Domestic Dog. Science 276 1687 1689
3. KarlssonEKLindblad-TohK 2008 Leader of the pack: gene mapping in dogs and other model organisms. Nat Rev Genet 9 713 725
4. WayneRKOstranderEA 2007 Lessons learned from the dog genome. Trends Genet 23 557 567
5. SutterNBEberleMAParkerHGPullarBJKirknessEF 2004 Extensive and breed-specific linkage disequilibrium in Canis familiaris. Genome Research 14 2388 2396
6. BoykoARQuignonPLiLSchoenebeckJJDegenhardtJD 2010 A simple genetic architecture underlies morphological variation in dogs. PLoS Biol 8 e1000451 doi:10.1371/journal.pbio.1000451
7. ManolioTACollinsFSCoxNJGoldsteinDBHindorffLA 2009 Finding the missing heritability of complex diseases. Nature 461 747 753
8. SutterNBBustamanteCDChaseKGrayMMZhaoK 2007 A Single IGF1 Allele Is a Major Determinant of Small Size in Dogs. Science 316 112 115
9. CadieuENeffMWQuignonPWalshKChaseK 2009 Coat Variation in the Domestic Dog Is Governed by Variants in Three Genes. Science 326 150 153
10. CandilleSIKaelinCBCattanachBMYuBThompsonDA 2007 A -defensin mutation causes black coat color in domestic dogs. Science 318 1418 1423
11. KarlssonEKBaranowskaIWadeCMSalmon HillbertzNHZodyMC 2007 Efficient mapping of mendelian traits in dogs through genome-wide association. Nat Genet 39 1321 1328
12. JonesPChaseKMartinADavernPOstranderEA 2008 Single-nucleotide-polymorphism-based association mapping of dog stereotypes. Genetics 179 1033 1044
13. ParkerHGVonHoldtBMQuignonPMarguliesEHShaoS 2009 An Expressed Fgf4 Retrogene Is Associated with Breed-Defining Chondrodysplasia in Domestic Dogs. Science 325 995 998
14. BannaschDYoungAMyersJTruveKDickinsonP 2010 Localization of canine brachycephaly using an across breed mapping approach. PLoS ONE 5 e9632 doi:10.1371/journal.pone.0009632
15. AkeyJMRuheALAkeyDTWongAKConnellyCF 2010 Tracking footprints of artificial selection in the dog genome. Proc Natl Acad Sci U S A 107 1160 1165
16. OlssonMMeadowsJRTruveKRosengren PielbergGPuppoF 2011 A novel unstable duplication upstream of HAS2 predisposes toa breed-defining skin phenotype and a periodic fever syndrome in Chinese Shar-Pei dogs. PLoS Genet 7 e1001332 doi:10.1371/journal.pgen.1001332
17. SabetiPCReichDEHigginsJMLevineHZRichterDJ 2002 Detecting recent positive selection in the human genome from haplotype structure. Nature 419 832 837
18. SabetiPCVarillyPFryBLohmuellerJHostetterE 2007 Genome-wide detection and characterization of positive selection in human populations. Nature 449 913 918
19. VoightBFKudaravalliSWenXPritchardJK 2006 A map of recent positive selection in the human genome. PLoS Biol 4 e72 doi:10.1371/journal.pbio.0040072
20. TajimaF 1989 Statistical method for testing the neutral mutation hypothesis by DNA polymorphism. Genetics 123 585 595
21. NielsenRHubiszMJHellmannITorgersonDAndresAM 2009 Darwinian and demographic forces affecting human protein coding genes. Genome Res 19 838 849
22. CoopGPickrellJKNovembreJKudaravalliSLiJ 2009 The role of geography in human adaptation. PLoS Genet 5 e1000500 doi:10.1371/journal.pgen.1000500
23. InnanHKimY 2008 Detecting local adaptation using the joint sampling of polymorphism data in the parental and derived populations. Genetics 179 1713 1720
24. SaitouNNeiM 1987 The neighbor-joining method: a new method for reconstructing phylogenetic trees. Mol Biol Evol 4 406 425
25. vonHoldtBMPollingerJPLohmuellerKEHanEParkerHG 2010 Genome-wide SNP and haplotype analyses reveal a rich history underlying dog domestication. Nature 464 898 902
26. FogleB 2000 The new encyclopedia of the dog. London Dorling Kindersley
27. GudbjartssonDFWaltersGBThorleifssonGStefanssonHHalldorssonBV 2008 Many sequence variants affecting diversity of adult human height. Nat Genet 40 609 615
28. LettreGJacksonAUGiegerCSchumacherFRBerndtSI 2008 Identification of ten loci associated with height highlights new biological pathways in human growth. Nat Genet 40 584 591
29. WeedonMNLangoHLindgrenCMWallaceCEvansDM 2008 Genome-wide association analysis identifies 20 loci that influence adult height. Nat Genet 40 575 583
30. SvartbergKForkmanB 2002 Personality traits in the domestic dog (Canis familiaris). Applied Animal Behaviour Science 79 133 155
31. SvartbergKTapperITemrinHRadesaterTThormanS 2005 Consistency of personality traits in dogs. Animal Behaviour 69 283 291
32. JacksonIJ 1994 Molecular and developmental genetics of mouse coat color. Annu Rev Genet 28 189 217
33. BenjaminiYHochbergY 1995 Controlling the false discovery rate: A practical and powerful approach to multiple testing. J R Stat Soc [Ser B] 57 289 300
34. KentWJSugnetCWFureyTSRoskinKMPringleTH 2002 The human genome browser at UCSC. Genome Res 12 996 1006
35. RobertsMCMickelsonJRPattersonEENelsonTEArmstrongPJ 2001 Autosomal dominant canine malignant hyperthermia is caused by a mutation in the gene encoding the skeletal muscle calcium release channel (RYR1). Anesthesiology 95 716 725
36. KosiolCVinarTda FonsecaRRHubiszMJBustamanteCD 2008 Patterns of positive selection in six Mammalian genomes. PLoS Genet 4 e1000144 doi:10.1371/journal.pgen.1000144
37. ObholzKLAkopyanAWaymireKGMacGregorGR 2006 FNDC3A is required for adhesion between spermatids and Sertoli cells. Developmental Biology 298 498 513
38. McPherronACLeeSJ 1997 Double muscling in cattle due to mutations in the myostatin gene. Proc Natl Acad Sci U S A 94 12457 12461
39. MosherDSQuignonPBustamanteCDSutterNBMellershCS 2007 A mutation in the myostatin gene increases muscle mass and enhances racing performance in heterozygote dogs. PLoS Genet 3 e79 doi:10.1371/journal.pgen.0030079
40. XuWGongLHaddadMMBischofOCampisiJ 2000 Regulation of microphthalmia-associated transcription factor MITF protein levels by association with the ubiquitin-conjugating enzyme hUBC9. Exp Cell Res 255 135 143
41. BalikovaILehesjokiAEde RavelTJThienpontBChandlerKE 2009 Deletions in the VPS13B (COH1) gene as a cause of Cohen syndrome. Hum Mutat 30 E845 854
42. RubinCJZodyMCErikssonJMeadowsJRSherwoodE 2010 Whole-genome resequencing reveals loci under selection during chicken domestication. Nature 464 587 591
43. WangBZhangYBZhangFLinHWangX 2011 On the origin of Tibetans and their genetic basis in adapting high-altitude environments. PLoS ONE 6 e17002 doi:10.1371/journal.pone.0017002
44. DurbinRMAbecasisGRAltshulerDLAutonABrooksLD 2010 A map of human genome variation from population-scale sequencing. Nature 467 1061 1073
45. GrossmanSRShylakhterIKarlssonEKByrneEHMoralesS 2010 A composite of multiple signals distinguishes causal variants in regions of positive selection. Science 327 883 886
46. PritchardJKPickrellJKCoopG 2010 The Genetics of Human Adaptation: Hard Sweeps, Soft Sweeps, and Polygenic Adaptation. Current Biology 20 R208 R215
47. HernandezRDKelleyJLElyashivEMeltonSCAutonA 2011 Classic selective sweeps were rare in recent human evolution. Science 331 920 924
48. PritchardJKDi RienzoA 2010 Adaptation - not by sweeps alone. Nat Rev Genet 11 665 667
49. BurkeMKDunhamJPShahrestaniPThorntonKRRoseMR 2010 Genome-wide analysis of a long-term evolution experiment with Drosophila. Nature 467 587 590
50. BjornerfeldtSWebsterMTVilaC 2006 Relaxation of selective constraint on dog mitochondrial DNA following domestication. Genome Res 16 990 994
51. CruzFVilaCWebsterMT 2008 The legacy of domestication: accumulation of deleterious mutations in the dog genome. Mol Biol Evol 25 2331 2336
52. WangWKirknessEF 2005 Short interspersed elements (SINEs) are a major source of canine genomic diversity. Genome Res 15 1798 1808
53. ShearinALOstranderEA 2010 Canine morphology: hunting for genes and tracking mutations. PLoS Biol 8 e1000310 doi:10.1371/journal.pbio.1000310
54. HedrickPWAnderssonL 2011 Are dogs genetically special? Heredity 106 712 713
55. DarwinCR 1859 On the Origin of Species. London John Murray
56. NatanaelssonCOskarssonMCAnglebyHLundebergJKirknessE 2006 Dog Y chromosomal DNA sequence: identification, sequencing and SNP discovery. BMC Genet 7 45
57. ScheetPStephensM 2006 A fast and flexible statistical model for large-scale population genotype data: applications to inferring missing genotypes and haplotypic phase. Am J Hum Genet 78 629 644
58. AutonAMcVeanG 2007 Recombination rate estimation in the presence of hotspots. Genome Res 17 1219 1227
59. WongAKRuheALDumontBLRobertsonKRGuerreroG 2010 A comprehensive linkage map of the dog genome. Genetics 184 595 605
60. GrayMMGrankaJMBustamanteCDSutterNBBoykoAR 2009 Linkage disequilibrium and demographic history of wild and domestic canids. Genetics 181 1493 1505
61. ChenGKMarjoramPWallJD 2009 Fast and flexible simulation of DNA sequence data. Genome Res 19 136 142
62. ZhangBKirovSSnoddyJ 2005 WebGestalt: an integrated system for exploring gene sets in various biological contexts. Nucleic Acids Res 33 W741 748
Štítky
Genetika Reprodukční medicínaČlánek vyšel v časopise
PLOS Genetics
2011 Číslo 10
- Kazuistika – Perspektivy využití precizované medicíny v rámci personalizované specifické terapie onkologických pacientů
- Nobelova cena za chemii pro genetické nůžky: Objev, který změní naši budoucnost?
- Technologie na bázi RNA v klinické praxi: od přebarvených petúnií k terapii vzácných a dosud jen obtížně léčitelných chorob u lidí
- „Nepředstavovali jsme si, že náš výzkum povede přímo ke vzniku nových léků, dokonce ještě za našeho života“
- Bezplatné služby pro diagnostiku ATTRv amyloidózy pro kardiology
Nejčtenější v tomto čísle
- The Glycobiome Reveals Mechanisms of Pentose and Hexose Co-Utilization in Bacteria
- Global Mapping of Cell Type–Specific Open Chromatin by FAIRE-seq Reveals the Regulatory Role of the NFI Family in Adipocyte Differentiation
- Genetic Determinants of Serum Testosterone Concentrations in Men
- MicroRNA Expression and Regulation in Human, Chimpanzee, and Macaque Brains
Zvyšte si kvalifikaci online z pohodlí domova
Mazová zátka a její řešení
nový kurzVšechny kurzy