
Developmental Stability: A Major Role for in
Morphological consistency in metazoans is remarkable given the pervasive occurrence of genetic variation, environmental effects, and developmental noise. Developmental stability, the ability to reduce developmental noise, is a fundamental property of multicellular organisms, yet its genetic bases remains elusive. Imperfect bilateral symmetry, or fluctuating asymmetry, is commonly used to estimate developmental stability. We observed that Drosophila melanogaster overexpressing Cyclin G (CycG) exhibit wing asymmetry clearly detectable by sight. Quantification of wing size and shape using geometric morphometrics reveals that this asymmetry is a genuine—but extreme—fluctuating asymmetry. Overexpression of CycG indeed leads to a 40-fold increase of wing fluctuating asymmetry, which is an unprecedented effect, for any organ and in any animal model, either in wild populations or mutants. This asymmetry effect is not restricted to wings, since femur length is affected as well. Inactivating CycG by RNAi also induces fluctuating asymmetry but to a lesser extent. Investigating the cellular bases of the phenotypic effects of CycG deregulation, we found that misregulation of cell size is predominant in asymmetric flies. In particular, the tight negative correlation between cell size and cell number observed in wild-type flies is impaired when CycG is upregulated. Our results highlight the role of CycG in the control of developmental stability in D. melanogaster. Furthermore, they show that wing developmental stability is normally ensured via compensatory processes between cell growth and cell proliferation. We discuss the possible role of CycG as a hub in a genetic network that controls developmental stability.
Published in the journal:
. PLoS Genet 7(10): e32767. doi:10.1371/journal.pgen.1002314
Category:
Research Article
doi:
https://doi.org/10.1371/journal.pgen.1002314
Summary
Morphological consistency in metazoans is remarkable given the pervasive occurrence of genetic variation, environmental effects, and developmental noise. Developmental stability, the ability to reduce developmental noise, is a fundamental property of multicellular organisms, yet its genetic bases remains elusive. Imperfect bilateral symmetry, or fluctuating asymmetry, is commonly used to estimate developmental stability. We observed that Drosophila melanogaster overexpressing Cyclin G (CycG) exhibit wing asymmetry clearly detectable by sight. Quantification of wing size and shape using geometric morphometrics reveals that this asymmetry is a genuine—but extreme—fluctuating asymmetry. Overexpression of CycG indeed leads to a 40-fold increase of wing fluctuating asymmetry, which is an unprecedented effect, for any organ and in any animal model, either in wild populations or mutants. This asymmetry effect is not restricted to wings, since femur length is affected as well. Inactivating CycG by RNAi also induces fluctuating asymmetry but to a lesser extent. Investigating the cellular bases of the phenotypic effects of CycG deregulation, we found that misregulation of cell size is predominant in asymmetric flies. In particular, the tight negative correlation between cell size and cell number observed in wild-type flies is impaired when CycG is upregulated. Our results highlight the role of CycG in the control of developmental stability in D. melanogaster. Furthermore, they show that wing developmental stability is normally ensured via compensatory processes between cell growth and cell proliferation. We discuss the possible role of CycG as a hub in a genetic network that controls developmental stability.
Introduction
Precision of developmental processes is of great evolutionary importance since it conditions the accurate replication of the selected phenotype. Stabilizing selection is thus thought to favor robust developmental systems [1]. Waddington was the first to suggest that the ability to buffer variation – referred to as developmental homeostasis – is a fundamental property of organisms [2]. He divided developmental homeostasis into two subcomponents: canalization that buffers genetic and environmental effects, and developmental stability that buffers developmental noise [3]. Despite numerous speculations about the evolutionary role of such buffering processes, their study has remained marginal to the mainstream of evolutionary biology until precise molecular processes were identified that might account for these properties. On the one hand, studies on the role of Hsp90 [4], [5] and more recently of other Hsp genes [6] and microRNAs [7], [8], in the buffering of genetic variation, contributed to the idea that robustness is ensured by specific genes and genetic processes. On the other hand, complex genetic networks can be intrinsically robust to perturbations [9], questioning the existence of specific robustness genes. To accommodate these contradictory results, it was suggested that some genes of particular importance for robustness might exist as hubs in complex networks [10]. Whether these results apply to developmental stability is not known [11]–[13].
Developmental stability is commonly estimated by fluctuating asymmetry (FA). The two sides of bilaterally symmetrical traits are influenced by the same genes and environmental conditions and thus only differ by developmental noise. Genetics of developmental stability and FA has been controversial [14]. The vast majority of studies report that the additive genetic variation for FA is extremely low or non significant. These low values have been interpreted either as a low signal to noise ratio, FA values being typically very small, or suggesting a non-additive genetic basis [14]. In line with the latter hypothesis, a few QTL interacting epistatically for FA have been detected in mouse (reviewed in [14]). The best documented case of an individual gene affecting FA is the homologue of the Drosophila Notch gene in the sheep blowfly (Lucilia cuprina) [15]. Its effects on FA are however limited to bristles [16], a trait known to be controlled by Notch. Hence, no evidence for the existence of genes controlling developmental stability in a general way has been reported so far.
Cyclins are a family of proteins primarily characterized as cell cycle regulators (for review see [17]). Nevertheless, of the 14 cyclins currently characterized, only a few (Cyclins A, B, D, and E) appear to be major actors of the cell cycle [18]. Other cyclins, such as Cyclins C, K, H or T, are involved in transcriptional processes (for review see [19]). We have recently shown that Drosophila Cyclin G is an unconventional cyclin involved, on the one hand, in transcriptional regulation via the Trithorax and Polycomb co-factor Corto [20], [21] and, on the other hand, in regulation of cell growth and cell cycle [22]. CycG is thus suspected to play a major role in Drosophila development. Ubiquitous overexpression of the Drosophila Cyclin G (CycG) gene during development induces high lethality. Escaper flies exhibit various mild phenotypes: they are smaller, have a longer developmental time, reduced eyes and rotated genitalia [22]. Most remarkably, although wings are normally structured, they exhibit a striking pattern of size asymmetry that fluctuates in the population (Figure 1A). This last effect suggested that CycG might be a good candidate gene for the control of developmental stability in Drosophila. Below, we detail the effects of overexpressing or RNAi-inactivating CycG on FA, integrating the analyses at the macroscopic and cellular levels.

Results
The UAS/Gal4 system was used to overexpress or RNAi-inactivate CycG during development [21], [22]. In order to minimize genetic and environmental sources of phenotypic variation, we used nearly isogenic backgrounds and conducted the experiments in a carefully standardized environment (see Material and Methods). The progeny was analyzed for wing size and shape using geometric morphometrics [23], [24]. Sample sizes are shown in Table 1.

Overexpressing CycG alters wing size, wing shape, and increases fluctuating asymmetry
We ubiquitously overexpressed CycG using the daughterless (da) driver. da::Gal4/+ females were crossed with UAS::mRFP-CycG (RCG76)/+ males as indicated in Material and Methods. da>RCG76 flies, hereafter referred to as GOF for Gain of Function, were smaller and had smaller wings than control +/+, da:Gal4/+ and RCG76/+ siblings (wings around 15% smaller in both sexes; Table S1). Although wing venation pattern remained normal, wing shape was clearly affected by CycG overexpression, with a distally rounder shape and a parallel distal shift of both cross-veins (Figure 2, Table S1: significant genotype effect in the MANOVAs). Similar patterns of shape change were found in both sexes.

Wings of GOF flies exhibited a striking pattern of asymmetry detectable by sight as compared to wings of control siblings (Figure 1A). This asymmetry was not related to mRFP, as no such phenotype was observed in flies overexpressing mRFP using the same driver (da>UAS::mRFP) (data not shown). Reciprocally, flies overexpressing CycG without mRFP (i.e. CG transgenic lines) presented strong asymmetry (Figure S1C). To further check whether the asymmetry was specific to CycG overexpression, we used da::Gal4 to overexpress other genes involved in cell growth or cell cycle regulation. None of the tested genes (dS6K, Myc, CycD Cdk4) produced any particular asymmetric pattern (data not shown). This also demonstrated that the asymmetry was not due to an asymmetric expression of the da::Gal4 driver that would affect tissue growth differently in the left and right sides of individuals. Taken together, these results thus suggest that the observed asymmetry is an effect of CycG overexpression per se.
We therefore conducted a detailed analysis of wing size and shape asymmetry of GOF vs. control flies using replicated sets of landmark data [25], [26] (Figure 3A). Conspicuous biological asymmetries are generally either directional (i.e. one side, always the same, is larger in all individuals), or antisymmetric (i.e. all individuals are strongly asymmetric but equally frequently rightwards or leftwards). These asymmetries do not reflect developmental noise and thus cannot be used to assess developmental stability [26]. In contrast, developmental noise will randomly affect right and left sides generating the bilateral differences of random amplitude and directionality, known as fluctuating asymmetry (FA). The strong asymmetry observed in GOF flies turned out to be genuine FA of extreme amplitude (often reaching individual values of more than 10% of the trait value). The comparison of these GOF flies to control +/+ flies showed a 36.8-fold increase in wing size FA in females and a 38.9-fold increase in males (Figure 1B, Table S2). Wing shape asymmetry was also affected (7.6-fold increase in females and 10.2-fold increase in males as compared to +/+ controls; Figure 1B, Table S3).

Replication of the CycG-induced FA effect in another genetic background
In order to investigate the potential effect of the genetic background, all transgenes, originally in a background marked by w1118, were introgressed into a new background marked by yw67c23. Microsatellite genotyping showed that the w1118 background presented a low level of heterozygosity and that the yw67c23 background was isogenic as far as can be detected (see Material and Methods). In the new background, wings of GOF flies were again smaller than the ones of +/+ controls (18% in both sexes; Table S1), and their shape was also altered (Table S1), shape changes being remarkably close to those found in the w1118 background (compare Figure S1A, S1B to Figure 2A, 2B). The GOF flies exhibited extreme wing FA (26.9-fold increase in females and 48.2-fold increase in males for wing size, 9.2-fold increase in females and 11.1-fold increase in males for wing shape as compared to +/+ controls; Figure S2C; Tables S2, S3), clearly rejecting the hypothesis that FA increase was primarily an effect of the genetic background.
CycG deregulation using different drivers increases FA
CycG-induced FA was further investigated using other drivers in the same isogenic yw67c23 background. Actin5C (Act) served as an alternative ubiquitous driver. Wings of Act>RCG76 flies were again smaller than the ones of control +/+ siblings (15% smaller for females and 20% for males, Table S1) and wing shape was altered as well (Table S1). Size FA doubled in both sexes (2.3-fold increase in females, 2.4-fold increase in males as compared to +/+ controls), and shape FA increased 9.8-fold in females and 2.8-fold in males (Tables S2, S3). A scalloped (sd) driver, sd29.1, hereafter called sd::Gal4, was further used to induce a more localized overexpression of CycG in wing imaginal discs. This driver is an insertion of a P-Gal4 transgene that maps in the scalloped gene in the first large intron after the translational start site. It has been described as a weak hypomorph allele of scalloped [27]. Whereas wings of sd::Gal4/+ flies have a wild type phenotype, wing margin of sd>RCG76 flies was partially altered by notches (Figure S1E), suggesting that CycG interacted synergistically with sd. Wing centroid size and wing shape could thus not be analyzed, hence only wing length was measured (Figure 3A). Again, FA of sd>RCG76 wings increased dramatically (6.8-fold for females and up to 47.9-fold for males) as compared to control +/+ siblings (Table S2). These results demonstrate that any CycG overexpression has a very strong effect on wing FA, although the driver can affect the intensity of the asymmetry response. qRT-PCRs showed that CycG overexpression driven by Act was weaker than the one driven by da (Figure S3), suggesting that the strength of the FA effect depends on the level of CycG expression.
Reducing CycG expression by RNAi increases shape FA
We next examined the effects of a reduction in CycG expression on FA. Since no CycG mutant has been reported so far, the UAS::dsCycG2 transgenic line was used to silence CycG by RNAi in the yw67c23 background [21]. CycG was ubiquitously inactivated using the da::Gal4 driver. In da>dsCycG2 flies, hereafter referred to as LOF for Loss of Function, overall body size (including wing size) was not altered, in contrast to GOF flies (Table S1). Interestingly, wing shape was affected (Figure S2D, S2E; Table S1). Shape changes were similar in both sexes and were clearly different from those induced by CycG overexpression (compare Figure S2A, S2B to S2D, S2E).
Wing size FA increased significantly only in males (1.5-fold) as compared to +/+ siblings (Figure S2F, Table S2). However, wing shape FA increased by a factor of 3.7 in females and 2.3 in males (Figure S2F; Table S3), indicating that reducing CycG expression also impairs developmental stability.
Patterns of CycG-induced wing shape asymmetry
FA occurs at low levels in any bilateral quantitative trait. Whether an increase in asymmetry is merely an amplification of the "normal" asymmetry or rather involves different processes is unknown. Simple traits, like size, vary in one dimension only and are therefore not amenable to address this question. Investigating wing shape asymmetry enables us to tackle this issue. If only amplification of normal asymmetry is involved, then the patterns of shape asymmetry should be unchanged. We computed the principal components of the shape asymmetry matrices for control and experimental flies, i.e. GOF flies in both w1118 and yw67c23 backgrounds and LOF flies in the yw67c23 background (Figure 4). In contrast to +/+ siblings, shape FA matrices of GOF flies were clearly dominated by the first principal component (PC), indicating a strong structure of the FA effect along one dominant direction of shape change. This structure was less pronounced but also detected in LOF flies. Remarkably, while the wings of GOF and LOF flies differed in their mean shape, their patterns of shape FA were almost identical (Figure 4A, 4C, 4E; Table S4), as shown by the similarity of the FA PC1s (see Material and Methods). These patterns of shape FA were also significantly correlated with those of their +/+ siblings (Figure 4B, 4D; Table S4) despite some differences. In the w1118 background, the patterns of shape FA between +/+ and GOF female flies did not even differ more than expected from sampling error only (i.e. the angle between their respective FA PC1s was smaller than between pairs of vectors derived from a distribution obtained by resampling within a single genotype; see Material and Methods; Table S4). This therefore suggests that the CycG-induced shape asymmetry mainly consists in an amplification of the dominant pattern of "normal" asymmetry.

Effects of CycG overexpression on an other trait
We next asked whether the observed FA in flies deregulating CycG was restricted to wings or affected other body parts. To avoid a bias due to developmental correlation, we focused on a structure located on a different thoracic segment i.e. the first leg. First leg femurs of GOF flies previously analyzed for wing asymmetry (da>RCG76 in the yw67c23 background) or their +/+ siblings, were scored for length (Figure 3B). As expected from the reduced size of GOF flies, their femurs were shorter than those of control siblings (-14% in females and -16% in males). Consistently with wing analyses, CycG overexpression induced an increase in FA in both sexes (4.2-fold for females and 2.6-fold for males as compared to +/+ siblings; Table S5). Hence, the increase of asymmetry generated by deregulating CycG was not limited to wings but also affected other body parts. Noteworthy, we observed no individual correlation between wing FA and femur FA, i.e. the most asymmetric individuals for wings were not necessarily the most asymmetric for femurs, and vice-versa.
Effects of CycG deregulation on cell size and cell number
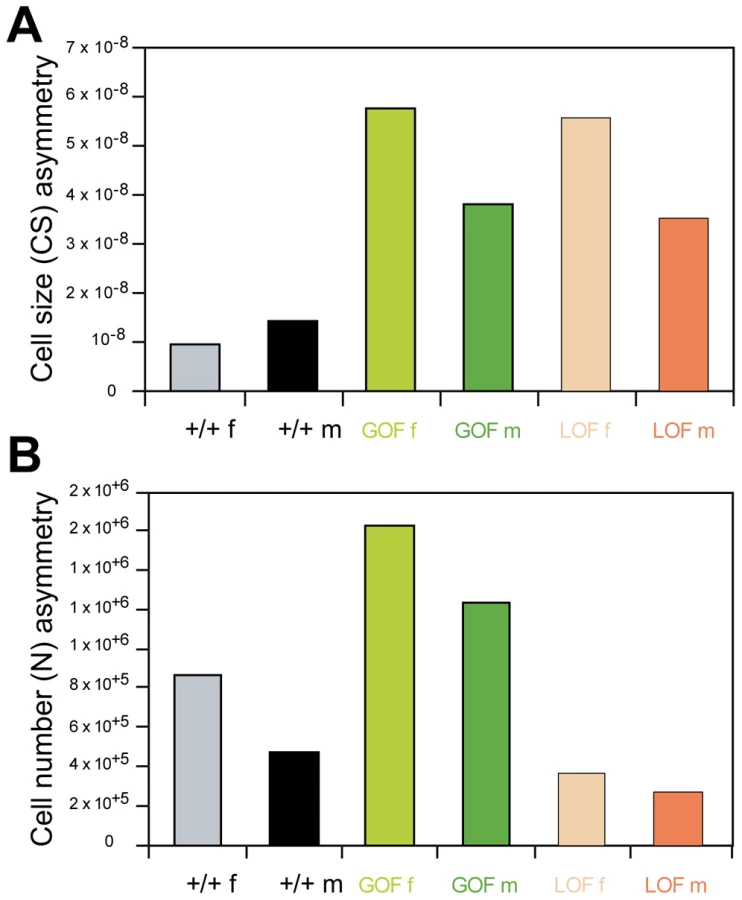
To identify the cellular processes mediating the observed phenotypes, cell number and cell size were estimated on wings previously measured and scored for asymmetry (GOF and LOF flies, as well as their +/+ siblings, in the yw67c23 background; Figure 3C, 3C″, 3C″). The overall effects of deregulating CycG are shown in Figure 5 and Table S6. For cell size, overexpression and inactivation of CycG had opposite effects: in both sexes, overexpression reduced cell size while inactivation increased it (Figure 5A; Table S6, top). For cell number, the effects were sex-specific: while CycG overexpression and inactivation both decreased cell number in females, no significant effect was detected in males (Figure 5B; Table S6, bottom).

Although wing size sexual dimorphism was stable across genotypes, females being typically larger than males (between 15 and 17% larger; Table S1), differences were found in the cellular basis of this dimorphism (Figure 5A, 5B; Table S6). In control flies, cell size was similar in males and females: sexual dimorphism was mainly due to cell number, the larger female wings bearing more cells that the smaller male ones. In GOF flies, both cell size and cell number differed between sexes, males having less cells of smaller size than females. In LOF flies, sexual dimorphism was mainly due to cell size, males having as many but smaller cells as females.
The smaller wing size of GOF flies was mainly explained by a decrease in cell size in both sexes as compared to +/+ siblings; cell number also decreased in females, while almost no difference was found in males (Figure 5A, 5B). Interestingly, in LOF flies, although wing size was not altered, both cell size and cell number were affected. Cells were bigger than those of controls in both sexes, although the difference was stronger in females. This effect was compensated by a reduction of cell number leading to a stable wing size (Figure 5A, 5B).
Remarkably, the relationship between cell size and cell number observed in wild type and LOF wings was strongly affected by CycG deregulation (Figure 5C, Table S6). Cell size and cell number were indeed tightly negatively correlated in control +/+ wings (+/+ females: r = -0.78***; +/+ males: r = -0.84***, see Table S6 for statistical comparisons). This correlation sharply decreased when CycG was overexpressed (GOF females: r = -0.52*; GOF males: r = -0.04, non significant, see Table S6 for statistical comparisons). This apparent uncoupling between the two cellular parameters was further evidenced when analyzing residuals of the regressions of cell size on cell number (Table S6). Their variance was indeed found significantly higher in GOF flies compared to controls. Interestingly, while the negative correlation still held for LOF flies (LOF females: r = -0.91***; LOF males: r = -0.77***; Table S7), the variance of the regression residuals also significantly increased relative to the controls, suggesting that the size/number relationship was altered as well when reducing CycG expression.
FA of cell size and cell number was measured to try to account for the extreme wing size asymmetries (Figure 6; Table S8). In both GOF and LOF flies, FA of cell size significantly increased relative to +/+ controls whereas FA of cell number did not vary. Furthermore, only cell size FA was found positively correlated with wing size FA across individuals (Table S8, bottom): flies strongly asymmetrical for wing size tended to be strongly asymmetrical for cell size (GOF females: r = 0.65**; GOF males: r = 0.54**) but not for cell number (GOF females: r = 0.11, non significant; GOF males: r = 0.27, non significant). Wing size asymmetry induced by CycG deregulation thus appeared to be predominantly generated by cell size asymmetry.
Discussion
The CycG gene of Drosophila melanogaster encodes a cyclin involved in transcriptional regulation, cell growth and cell cycle [21], [22]. We report here that upregulation of CycG in a context where genetic and environmental variations were minimal induces extremely high levels of fluctuating asymmetry (FA) in several traits, suggesting that Cyclin G is a major factor of developmental stability.
Deregulating CycG alters cell growth and the compensation between cell proliferation and cell growth
Cell growth is markedly downregulated by CycG as CycG inactivation increases adult wing cell size while CycG overexpression reduces it. In wing imaginal discs, however, although cell size is also reduced by CycG overexpression, inactivation of CycG only induces a slight increase in cell size [22]. This suggests that in flies where CycG is inactivated, extra cell growth occurs during post-larval stages. Furthermore, CycG impairs not only cell growth but also cell proliferation. Indeed, both inactivation and overexpression lead to a reduction in cell number in females. The fact that wings of flies where CycG was inactivated reach a size comparable to that of wild type flies suggests that cell growth compensates for lack of cell proliferation.
A tight negative correlation between cell size and cell number is observed in control flies suggesting that wing size stability is ensured by compensation between cell proliferation and cell growth. This has also been observed in natural populations, where cell size and cell number tend to show negative covariance [28], [29]. In addition, genetic manipulation of cell size using cdc2 mutants [30], dMyc mutants [31] or deregulation of cell cycle regulators [32] confirms that cell growth and proliferation can compensate each other to reach normal organ size. Hence, the final size of the wing seems to be determined by a compensatory mechanism between cell size and cell number. This mechanism is deeply impaired in CycG overexpressing flies. Remarkably, although the negative correlation is significant in LOF flies, the variance of the regression residuals presents a sharp increase relative to the controls, indicating a loosening in the relationship. Altogether these results suggest that deregulating CycG alters the link between cell growth and proliferation. This in turn suggests that compensation between cell growth and division is one key factor in maintaining wing size – and thus wing developmental stability – and that CycG is critical for ensuring this compensation.
Deregulating CycG alters the cellular basis of wing sexual size dimorphism
In natural populations, differences in wing size between sexes have been suggested to involve both cell size and cell number [29], [33]. In our control isogenic lines though, wing sexual size dimorphism was only due to cell number, cell size being strikingly similar in both sexes. This suggests that adaptation to laboratory conditions or genetic drift might affect the cellular basis of sexual size dimorphism.
Cell size is affected similarly in both sexes when manipulating CycG expression. In contrast, the effects on cell number are different between sexes: while no effect is detectable in males, both GOF and LOF females have fewer cells than the controls. During the pupal stage, wing cells undergo two rounds of division [34]. As G-type cyclins are known to be important in terminally differentiated cells [35], it is tempting to speculate that these last divisions are differentially regulated in males and females and are controlled by Cyclin G. The last divisions in the pupal wing might be a crucial determinant of the sexual dimorphism of wing size.
Deregulating CycG alters wing shape
The altered wing shape in both GOF and LOF flies suggests that the ubiquitous da deregulation of CycG across the wing blade induced heterogeneous effects on cell size and cell number, possibly reflecting an interference with morphogens driving wing growth. Nevertheless, the changes in mean wing shape found in GOF flies are clearly different from those in LOF flies. As the patterns of shape change remained different in LOF and GOF flies after correcting for size – only the GOF flies were smaller than the controls, we could rule out the hypothesis of a simple allometric effect (Figure S4). A detailed mapping of the cellular effects on the wing would be needed to relate the shape changes to morphogenetic processes. These results are nevertheless consistent with QTL analyses showing that wing shape is regulated at least partly independently of wing size [36]. Wing veins are important determinants of wing shape [37] and wing shape has notably been shown to be tightly associated with the Egf receptor locus that controls the amount of vein material [36], [38], [39]. Interestingly, torpedo, a mutant of the EGF Receptor, shows similar abdomen cuticle defects [40] than those observed in CycG LOF flies [20]. Thus, CycG might also interact with the Egf receptor in the wing imaginal disc to control vein specification and wing shape.
Upregulating CycG increases size FA
The amplitude of the asymmetry effect observed when overexpressing CycG is particularly dramatic, and such an amplitude is usually associated with directional asymmetry or antisymmetry, the two forms of conspicuous asymmetry. Similar levels of FA have – to our knowledge – never been reported. Comparatively, a study using deletions covering most of the Drosophila genome detected a maximum increase of 7-fold in size FA [13] (Breuker, personal communication).
The very low level of genetic variation and the carefully controlled environmental conditions ensured that this effect was due to developmental noise and was not confounded with genetic or environmental variation for directional asymmetry ([41], [42]; see Material and Methods).
That wing size and shape as well as femurs of the first leg are affected demonstrates that, although the strength of the effect on FA may vary across body parts, this effect is not restricted to a single trait (i.e. the wing) or a specific segment. This result is particularly important since the only previously known cases of individual genes altering FA were trait-specific [16]. Although wings and legs are both thoracic appendages with partly similar developmental networks, such a common FA effect suggests that the cellular processes altered by deregulation of CycG are likely common to many traits. It also provides some support to the hypothesis of an organism-wide source of developmental noise, and indirectly it suggests the existence of organism-wide stabilizing processes, a very contentious issue [43].
Some preliminary tests on bristle traits nevertheless suggest that bristle number FA is not affected by CycG deregulation. This is in agreement with previous studies suggesting that meristic and metric trait variation could be controlled via different processes [10], [44].
Deregulating CycG increases shape FA
Whereas mean wing shape is affected differently in LOF and GOF flies, the patterns of shape variation around these different means, and specifically those of shape FA, are strikingly similar. This similarity can be interpreted in different ways. First, it might indicate that stochastic variation is constrained along a limited set of directions of shape change, consistent with the view of a wing as an integrated system [45]. Alternatively, such similarity of patterns might reflect a similarity of processes. Although mean wing shape is affected differently when increasing or reducing CycG expression, it is conceivable that shifting CycG expression level away from its normal value might destabilize development in similar ways, generating these similar patterns of shape FA. Comparable - although not identical - patterns of wing shape FA were found in control flies, suggesting that similar processes are involved in generating FA in wild type and CycG deregulated flies. This again supports the view that CycG plays an important role in developmental stability.
Genetics and regulation of developmental stability
CycG thus appears as a serious candidate for the genetic control of developmental stability, and further studies should examine its role in FA amplitude differences across natural populations or samples submitted to various environmental treatments. Can we reconcile the reported lack of additive genetic variation for FA [14] with the putative existence of (a) major gene(s) altering FA? It is likely that CycG is involved in a genetic network regulating cell growth, and possibly cell proliferation [22], where it might act as a hub, as the high FA induced by overexpression suggests. Such a function, likely involving various pleiotropic effects and epistatic interactions, might be under strong selection, possibly leading to the elimination of any variation.
It is also conceivable that subtle variation in CycG may occur with only small effects on FA. In particular, CycG overexpression triggered by transgenic constructs is likely of larger magnitude compared to the effects of natural variation. Investigation of natural variation in CycG sequence and expression across populations differing in their degree of FA would provide some insight on this question. Investigating genes interacting with CycG would also improve our understanding of its link with organ size stochastic variation.
It was recently suggested that the ability of organs to reach a stereotypical size would depend on the competition among populations of growing cells [46]. In given developmental conditions (e.g. during the last cell divisions in the pupal wing blade), Cyclin G intracellular concentration might somehow trigger cell division. Pushing this concentration away from its usual value might interfere with the process by which cells identify the appropriate stage of growth for division, potentially generating stochasticity in cell size and decoupling cell growth and division. This might in turn compromise the normal pattern of cellular competition, causing random variation in organ size.
The extreme FA reported in this paper was generated by deregulating expression of a single gene. Consequently, the above hypothetical scenario focuses on the role of a single protein on the generation of random variation at the cellular level, but it does not preclude the existence of diverse processes working at various biological scales [47].
Our results do not necessarily mean that CycG is a gene for developmental stability, but they clearly show, by the strength of its effect on cell size variation, that CycG normal expression is required for the formation of symmetrical flies.
Materials and Methods
Fly strains
UAS::mRFP-CycG and UAS::CycG lines (respectively referred to as RCG and CG), containing the full-length CycG cDNA, were established by standard transformation [22]. The previously described UAS::dsCycG2 line was used to downregulate CycG by RNAi [21]. CycG overexpression and downregulation were carried out using either ubiquitous Gal4 drivers daughterless (da::Gal4) or Actin5C (Act::Gal4) (NP3121, DGRC Kyoto), or the tissue-specific Gal4 driver scalloped sd29.1 (called sd::Gal4) (BL-8609). All these transgenic lines display promoter-independent mini-white expression.
Here, we present the results for one of the RCG lines only (RCG76), but similar effects were found with other RCG lines and CG lines (Figure S1). UAS::mRFP (BL-7118), UAS::dS6K [48], UAS::Myc (BL-9674), UAS::CycD [49] and UAS::Cdk4 [50] were used as control lines.
Strains were maintained and crossed on standard medium at 25°C. For all crosses, 5 females heterozygous for a Gal4 driver were mated with 5 males heterozygous for an UAS transgene; they were transferred in a new vial every 24 h.
Genetic background
The first analyses were performed using a genetic background marked by w1118 i.e. the original background of all the transgenes. Trangenes were then introgressed into a new background marked by yw67c23 and followed by eye-color. The yw67c23 line was submitted to 10 rounds of isogenization prior to transgene introgression. Males w1118/Y; da::Gal4 were crossed with yw67c23 isogenic females. The resulting yw67c23/Y; da::Gal4/+ males were individually crossed with isogenized yw67c23 females. A first round of isogenization was then performed by individually crossing yw67c23; da::Gal4/+ females with isogenic yw67c23/Y males. Females yw67c23; da::Gal4/+ were recovered and individually crossed with isogenic yw67c23/Y males for a second round of isogenization. yw67c23Act::Gal4 females were crossed with isogenized yw67c23 males. yw67c23Act::Gal4/yw67c23 females were then individually crossed with isogenized yw67c23 males for a first round of isogenization. The same scheme was adopted for yw67c23sd::Gal4 females. After ten rounds of isogenization, one single isogenic line was kept for each transgene.
Isogenicity of the da::Gal4 and RCG76 lines was assessed by analyzing 19 microsatellite markers distributed over the 4 chromosomes in 5 individual females. It revealed a single polymorphic locus for w1118 females. However, the w1118; da::Gal4 and w1118; RCG76 females presented polymorphism at 7 and 2 additional loci, respectively. The yw67c23 line was checked for the same 19 loci, revealing no polymorphism whereas yw67c23; da::Gal4 and yw67c23; RCG76 females each presented polymorphism at only 3 loci.
Morphometrics
Acquisition
Right and left wings of the progeny from all crosses were mounted on slides, dorsal side up, and photographed using an Imasys uEye digital camera mounted on a Leica DMRB microscope. Legs of the progeny from the cross between da::Gal4/+ and RCG76/+ in the yw67c23 genetic background were mounted on slides and photographed using a microscope equipped with a Nikon DXM 1200 camera. 15 landmarks per wing were digitized (Figure 3A). All measures were performed using Image J.
Size
Log of the centroid size was used as a size variable for the wing (i.e. the square root of the sum of the squared distances from each landmark to the corresponding configuration's centroid [23], [24]). In sd>RCG76 flies, wing length was measured as the distance between landmark 3 and landmark 13 (Figure 3A). Length of the first leg femur was measured in arbitrary units as the distance between two landmarks as shown in Figure 3B.
Shape
Generalized least squares Procrustes superimposition was used to extract shape variation from the landmark data [23], [24]. In order to avoid problems related to loss of dimensions due to superimposition, a principal component analysis (PCA) was applied to the Procrustes coordinates (i.e. the coordinates after superimposition) and the non-zero PC scores were used as shape variables in all subsequent shape analyses.
Allometry
Allometry was investigated applying a multivariate regression of the PC scores on centroid size and using the residuals as allometry-free shape variables (e.g. [51]). Discriminant analyses ran before and after the regression were compared to assess the impact of allometry on wing shape changes among genotypes (Figure S4).
Cell number and cell size
A 256×256 pixel area, corforesponding to a 0.07 mm2 square, was displayed in the intervein region between vein 4 and vein 5 just behind the posterior cross-vein (Figure 3C). Thresholding was performed to keep epidermal hairs of the dorsal cell layer only using Image J software (Figure 3C′). Cells were automatically counted considering that each cell carries one epidermal hair. To account for potential heterogeneity in cell density in the wing, the area was then shifted twice along the proximo-distal axis and cells were counted again. As no significant difference among the three sampled regions was found, the number of cells counted over these three regions for each wing was averaged. Cell size was computed as one divided by the number of cells in the sampled area. The total number of cells in the dorsal cell layer of the wing was obtained applying the same thresholding to the whole wing. This thresholding mostly excluded cells located on the veins and the wing margin (Figure 3C″). We therefore underestimated the real cell numbers, but this bias was likely stable across individuals and genotypes.
The relationship between cell size and cell number was analyzed as follows.
We first computed the Pearson correlation coefficient (r) for each genotype. These correlations were then compared among genotypes using Fisher r to Z transformation. To investigate more accurately the strength of the relationship between the two cellular parameters, we ran a regression model (cell size over cell number) on each genotype and computed the variance of the residuals: the stronger the association, the lower the variance. This variance was then compared across genotypes using a Levene test followed by pairwise F tests.
FA analysis
Antisymmetry
We did not detect antisymmetry in any trait investigated: no evidence for bimodality was found in right minus left distributions of size-related traits (not shown); for wing shape data, visual inspection of right-left shape vectors did not suggest occurrence of any clustering, as would be expected for antisymmetric traits.
Measurement error
Measurement error (ME) is of critical importance when analyzing fluctuating asymmetry [26]. To quantify ME, both sides were measured several times. All flies used in the overexpression experiments using da were digitized twice for wing size and shape, and three times for femurs. As measurement error was shown to be negligible relative to true FA (interaction MS relative to error MS in Tables S2, S3, S4), a single measurement session was used in subsequent experiments (i.e. the ones involving Act and sd). Conventional two-way mixed model ANOVAs were applied to size data (centroid size, wing length and femur length) and Procrustes ANOVAs to wing shape data, using Individual (random), Side (fixed) and their interaction as effects. The details of this procedure can be found in [25], [26]. In addition to the estimation of ME, this ANOVA allows testing for the occurrence of directional asymmetry. For size, the side effect was never statistically significant in GOF and LOF flies (see "side" effect P-values on Table S2) demonstrating that true FA rather than directional asymmetry is responsible for the observed asymmetry pattern. Wing shape directional asymmetry was detected in some cases (see "side" effect P-values on Table S3). Estimators of FA corrected for ME and directional asymmetry (FA10) were then derived from these ANOVAs (FA10 following the standard terminology by Palmer and Strobeck [26]). When only one measurement was available, variance of (R-L) was used as an FA index (FA4, [26]). The relationship between size and asymmetry was examined to test the occurrence of allometric effect on FA. Such an effect was detected among genotypes but is mostly attributable to the fact that flies overexpressing CycG are smaller than the controls. No significant allometric effect was detected within genotypes.
Comparisons of FA values among genotypes were done using standard F-tests. P-values were adjusted using the Holm procedure [52] each time the analyses involved multiple comparisons.
Individual variation for directional asymmetry
Even when the average asymmetry is zero, genetic or environmental variation for directional asymmetry can occur and inflate the apparent level of fluctuating asymmetry, thereby impeding its use as an estimator of developmental stability (e.g. [42]). Genetic variation for directional asymmetry has been reported to be very low in most cases and artificial selection experiments in Drosophila have failed to generate a significant increase in asymmetry (reviewed in [41]). Some studies have nevertheless reported significant genetic variation for directional asymmetry (see [53] for a very strong effect in Drosophila interspecific hybrids). We could rule out the hypothesis of such an individual variation for directional asymmetry as the genetic variation was reduced to a minimum by the inbreeding procedure and by raising the flies in a carefully controlled environment.
Patterns of wing shape FA
Patterns of shape asymmetry were investigated following Klingenberg and McIntyre [25]. For each genotype and sex, we first computed the matrix of shape FA as the covariance matrix of the individual*side effect corrected for measurement error. We then ran a Principal Component Analysis (PCA) on this matrix. We examined the distribution of the eigenvalues [decreasing amount of variation accounted for by the successive principal components (PCs)]. Note that since the PCAs were ran independently, there is no one-to-one correspondence between PCs. Comparing individual eigenvalues across genotypes is thus non informative. In contrast, the shape of the whole distribution indicates whether shape FA is concentrated along one specific direction or rather is distributed over many directions. Using multivariate regression, we then displayed graphically the dominant pattern of shape FA as the shape change associated with the first FA PC. This allowed a direct visual comparison of the patterns of shape FA among genotypes.
The significance of the correlation of shape FA patterns among genotypes was then tested as follows. As the angles formed by pairs of FA PCs estimate their similarity, we first compared them to a null distribution of angles formed by pairs of 26-dimensional random vectors. This allowed testing whether the recorded patterns of FA were more similar than expected from random variation. We then examined the alternative null hypothesis of identical FA vectors. To test whether the vectors differed more than expected from sampling error alone, we compared them to a null distribution of angles obtained from a bootstrap procedure resampling individual observations within genotype.
FA of cell size and cell number
Fluctuating asymmetry of cell size and cell number was computed for each genotype as the variance of (R-L) values (FA4).
Morphometric and statistical analyses were conducted using R version 2.6.2 [54] and the MorphoJ package [55].
Supporting Information
Zdroje
1. LandryCR 2009 Systems biology spins off a new model for the study of canalization. Trends Ecol Evol 24 63 66
2. WaddingtonCH 1942 Canalization of development and the inheritance of acquired characters. Nature 150 563 565
3. DebatV 2001 Mapping phenotypes: canalization, plasticity and developmental stability. Trends in Ecology & Evolution 16 555 561
4. SangsterTASalathiaNLeeHNWatanabeESchellenbergK 2008 HSP90-buffered genetic variation is common in Arabidopsis thaliana. Proc Natl Acad Sci U S A 105 2969 2974
5. RutherfordSLLindquistS 1998 Hsp90 as a capacitor for morphological evolution. Nature 396 336 342
6. TakahashiKHRakoLTakano-ShimizuTHoffmannAALeeSF 2010 Effects of small Hsp genes on developmental stability and microenvironmental canalization. BMC Evol Biol 10 284
7. ShomronN 2010 MicroRNAs and developmental robustness: a new layer is revealed. PLoS Biol 8 e1000397 doi:10.1371/journal.pbio.1000397
8. HornsteinEShomronN 2006 Canalization of development by microRNAs. Nat Genet 38 Suppl S20 S24
9. BergmanASiegalML 2003 Evolutionary capacitance as a general feature of complex gene networks. Nature 424 549 552
10. RutherfordSKnappJRCsermelyP 2007 Hsp90 and developmental networks. Adv Exp Med Biol 594 190 197
11. MiltonCCHuynhBBatterhamPRutherfordSLHoffmannAA 2003 Quantitative trait symmetry independent of Hsp90 buffering: distinct modes of genetic canalization and developmental stability. Proc Natl Acad Sci U S A 100 13396 13401
12. DebatVMiltonCCRutherfordSKlingenbergCPHoffmannAA 2006 Hsp90 and the quantitative variation of wing shape in Drosophila melanogaster. Evolution 60 2529 2538
13. BreukerCJPattersonJSKlingenbergCP 2006 A single basis for developmental buffering of Drosophila wing shape. PLoS ONE 1 e7 doi:10.1371/journal.pone.0000007
14. LeamyLJLKlingenbergCPK 2005 The genetics and evolution of fluctuating asymmetry. Annu. Rev. Ecol. Evol. Syst 36 1 21
15. McKenzieJA 2003 The analysis of the asymmetry phenotype - single genes and the environment. Developmental Instability : Causes and Consequences New-York Oxford University Press 135 141 M.Polak
16. ClarkeGMYenJLMcKenzieJA 2000 Wings and bristles: character specificity of the asymmetry phenotype in insecticide-resistant strains of Lucilia cuprina. Proc Biol Sci 267 1815 1818
17. ErricoADeshmukhKTanakaYPozniakovskyAHuntT 2010 Identification of substrates for cyclin dependent kinases. Adv Enzyme Regul 50 375 399
18. SatyanarayanaAKaldisP 2009 Mammalian cell-cycle regulation: several Cdks, numerous cyclins and diverse compensatory mechanisms. Oncogene 28 2925 2939
19. CoqueretO 2002 Linking cyclins to transcriptional control. Gene 299 35 55
20. SalvaingJMouchel-VielhEBloyerSPreissAPeronnetF 2008 Regulation of Abd-B expression by Cyclin G and Corto in the abdominal epithelium of Drosophila. Hereditas 145 138 146
21. SalvaingJNagelACMouchel-VielhEBloyerSMaierD 2008 The Enhancer of Trithorax and Polycomb Corto interacts with Cyclin G in Drosophila. PLoS ONE 3 e1658 doi:10.1371/journal.pone.0001658
22. FaradjiFBloyerSDardalhon-CuménalDRandsholtNBPeronnetF 2011 Drosophila melanogaster Cyclin G coordinates cell growth and cell proliferation. Cell Cycle 10 1 14
23. KlingenbergCP 2010 Evolution and development of shape: integrating quantitative approaches. Nat Rev Genet 11 623 635
24. AdamsDCRohlfFJSliceDE 2004 Geometric morphometrics: ten years of progress following the 'revolution'. Ital. J. Zoolog 5 16
25. KlingenbergCPMcIntyreGS 1998 Geometric morphometrics of developmental instability : analyzing patterns of fluctuating asymmetry with procrustes methods. Evolution 52 1363 1375
26. PalmerARStrobeckC 1986 Fluctuating asymmetry - Measurement, Analysis, Patterns. Annual Review of Ecol. Syst 17 391 421
27. ShyamalaBVChopraA 1999 Drosophila melanogaster chemosensory and muscle development: identification and properties of a novel allele of scalloped and of a new locus, SG18.1, in a Gal4 enhancer trap screen. J Genet 78 87 97
28. SternDLEmlenDJ 1999 The developmental basis for allometry in insects. Development 126 1091 1101
29. McCabeJFrenchVPartridgeL 1997 Joint regulation of cell size and cell number in the wing blade of Drosophila melanogaster. Genet Res 69 61 68
30. WeigmannKCohenSMLehnerCF 1997 Cell cycle progression, growth and patterning in imaginal discs despite inhibition of cell division after inactivation of Drosophila Cdc2 kinase. Development 124 3555 3563
31. JohnstonLAProberDAEdgarBAEisenmanRNGallantP 1999 Drosophila myc regulates cellular growth during development. Cell 98 779 790
32. NeufeldTPde la CruzAFJohnstonLAEdgarBA 1998 Coordination of growth and cell division in the Drosophila wing. Cell 93 1183 1193
33. TrottaVCalboliFCZiosiMCavicchiS 2007 Fitness variation in response to artificial selection for reduced cell area, cell number and wing area in natural populations of Drosophila melanogaster. BMC Evol Biol 7 Suppl 2 S10
34. SchubigerMPalkaJ 1987 Changing spatial patterns of DNA replication in the developing wing of Drosophila. Dev Biol 123 145 153
35. BenninDADonASBrakeTMcKenzieJLRosenbaumH 2002 Cyclin G2 associates with protein phosphatase 2A catalytic and regulatory B′ subunits in active complexes and induces nuclear aberrations and a G1/S phase cell cycle arrest. J Biol Chem 277 27449 27467
36. ZimmermanEPalssonAGibsonG 2000 Quantitative trait loci affecting components of wing shape in Drosophila melanogaster. Genetics 155 671 683
37. BirdsallKZimmermanETeeterKGibsonG 2000 Genetic variation for the positioning of wing veins in Drosophila melanogaster. Evol Dev 2 16 24
38. DworkinIPalssonAGibsonG 2005 Replication of an Egfr-wing shape association in a wild-caught cohort of Drosophila melanogaster. Genetics 169 2115 2125
39. PalssonAGibsonG 2000 Quantitative developmental genetic analysis reveals that the ancestral dipteran wing vein prepattern is conserved in Drosophila melanogaster. Dev Genes Evol 210 617 622
40. MadhavanKMadhavanMM 1995 Defects in the adult abdominal integument of Drosophila caused by mutations in torpedo, a DER homolog. Roux's Arch Dev Biol 204 330 335
41. PélabonCHansenTF 2008 On the adaptive accuracy of directional asymmetry in insect wing size. Evolution 62 2855 2867
42. StigeLCDavidBAlibertP 2006 On hidden heterogeneity in directional asymmetry--can systematic bias be avoided? J Evol Biol 19 492 499
43. PolakGangestadSKroegerDEManningJThornhillR 2003 Does an individual asymmetry parameter exist? A meta-analysis. Developmental Instability : Causes and Consequences New-York Oxford University Press 81 98 M.Polak
44. KellermannVMHoffmannAASgroCM 2007 Hsp90 inhibition and the expression of phenotypic variability in the rainforest species Drosophila birchii. Biol J Linnean Soc 92 457 465
45. KlingenbergCPZaklanSD 2000 Morphological integration between development compartments in the Drosophila wing. Evolution 54 1273 1285
46. Neto-SilvaRMWellsBSJohnstonLA 2009 Mechanisms of growth and homeostasis in the Drosophila wing. Annu Rev Cell Dev Biol 25 197 220
47. HallgrimssonBJamniczkyHYoungNMRolianCParsonsTE 2009 Deciphering the Palimpset: Studying the relationship between morphological integration and phenotypic covariation. Evolutionary Biology 36 355 376
48. MontagneJStewartMJStockerHHafenEKozmaSCThomasG 1999 Drosophila S6 kinase: a regulator of cell size. Science 285 2126 2129
49. DatarSAJacobsHWde la CruzAFLehnerCFEdgarBA 2000 The Drosophila cyclin D-Cdk4 complex promotes cellular growth. EMBO J 19 4543 4554
50. MeyerCAJacobsHWDatarSADuWEdgarBALehnerCF 2000 Drosophila Cdk4 is required for normal growth and is dispensable for cell cycle progression. EMBO J 19 4533 4542
51. MonteiroLR 1999 Multivariate regression models and geometric morphometrics: the search for causal factors in the analysis of shape. Syst Biol 48 192 199
52. BenjaminiYekutieli 2001 The control of the false discovery rate in multiple testing under dependency. Ann Stat 29 1165 1188
53. RegoCMatosMSantosM 2006 Symmetry breaking in interspecific Drosophila hybrids is not due to developmental noise. Evolution 60 746 761
54. R Development Core Team 2008 Vienna, Austria
55. KlingenbergCP 2011 MorphoJ: an integrated software package for geometric morphometrics. Molecular Ecology Resources 11 353 357
Štítky
Genetika Reprodukční medicínaČlánek vyšel v časopise
PLOS Genetics
2011 Číslo 10
- Kazuistika – Perspektivy využití precizované medicíny v rámci personalizované specifické terapie onkologických pacientů
- Nobelova cena za chemii pro genetické nůžky: Objev, který změní naši budoucnost?
- Technologie na bázi RNA v klinické praxi: od přebarvených petúnií k terapii vzácných a dosud jen obtížně léčitelných chorob u lidí
- „Nepředstavovali jsme si, že náš výzkum povede přímo ke vzniku nových léků, dokonce ještě za našeho života“
- Bezplatné služby pro diagnostiku ATTRv amyloidózy pro kardiology
Nejčtenější v tomto čísle
- The Glycobiome Reveals Mechanisms of Pentose and Hexose Co-Utilization in Bacteria
- Global Mapping of Cell Type–Specific Open Chromatin by FAIRE-seq Reveals the Regulatory Role of the NFI Family in Adipocyte Differentiation
- Genetic Determinants of Serum Testosterone Concentrations in Men
- MicroRNA Expression and Regulation in Human, Chimpanzee, and Macaque Brains
Zvyšte si kvalifikaci online z pohodlí domova
Mazová zátka a její řešení
nový kurzVšechny kurzy