
Genetic Interaction between MTMR2 and FIG4 Phospholipid Phosphatases Involved in Charcot-Marie-Tooth Neuropathies
We previously reported that autosomal recessive demyelinating Charcot-Marie-Tooth (CMT) type 4B1 neuropathy with myelin outfoldings is caused by loss of MTMR2 (Myotubularin-related 2) in humans, and we created a faithful mouse model of the disease. MTMR2 dephosphorylates both PtdIns3P and PtdIns(3,5)P2, thereby regulating membrane trafficking. However, the function of MTMR2 and the role of the MTMR2 phospholipid phosphatase activity in vivo in the nerve still remain to be assessed. Mutations in FIG4 are associated with CMT4J neuropathy characterized by both axonal and myelin damage in peripheral nerve. Loss of Fig4 function in the plt (pale tremor) mouse produces spongiform degeneration of the brain and peripheral neuropathy. Since FIG4 has a role in generation of PtdIns(3,5)P2 and MTMR2 catalyzes its dephosphorylation, these two phosphatases might be expected to have opposite effects in the control of PtdIns(3,5)P2 homeostasis and their mutations might have compensatory effects in vivo. To explore the role of the MTMR2 phospholipid phosphatase activity in vivo, we generated and characterized the Mtmr2/Fig4 double null mutant mice. Here we provide strong evidence that Mtmr2 and Fig4 functionally interact in both Schwann cells and neurons, and we reveal for the first time a role of Mtmr2 in neurons in vivo. Our results also suggest that imbalance of PtdIns(3,5)P2 is at the basis of altered longitudinal myelin growth and of myelin outfolding formation. Reduction of Fig4 by null heterozygosity and downregulation of PIKfyve both rescue Mtmr2-null myelin outfoldings in vivo and in vitro.
Published in the journal:
. PLoS Genet 7(10): e32767. doi:10.1371/journal.pgen.1002319
Category:
Research Article
doi:
https://doi.org/10.1371/journal.pgen.1002319
Summary
We previously reported that autosomal recessive demyelinating Charcot-Marie-Tooth (CMT) type 4B1 neuropathy with myelin outfoldings is caused by loss of MTMR2 (Myotubularin-related 2) in humans, and we created a faithful mouse model of the disease. MTMR2 dephosphorylates both PtdIns3P and PtdIns(3,5)P2, thereby regulating membrane trafficking. However, the function of MTMR2 and the role of the MTMR2 phospholipid phosphatase activity in vivo in the nerve still remain to be assessed. Mutations in FIG4 are associated with CMT4J neuropathy characterized by both axonal and myelin damage in peripheral nerve. Loss of Fig4 function in the plt (pale tremor) mouse produces spongiform degeneration of the brain and peripheral neuropathy. Since FIG4 has a role in generation of PtdIns(3,5)P2 and MTMR2 catalyzes its dephosphorylation, these two phosphatases might be expected to have opposite effects in the control of PtdIns(3,5)P2 homeostasis and their mutations might have compensatory effects in vivo. To explore the role of the MTMR2 phospholipid phosphatase activity in vivo, we generated and characterized the Mtmr2/Fig4 double null mutant mice. Here we provide strong evidence that Mtmr2 and Fig4 functionally interact in both Schwann cells and neurons, and we reveal for the first time a role of Mtmr2 in neurons in vivo. Our results also suggest that imbalance of PtdIns(3,5)P2 is at the basis of altered longitudinal myelin growth and of myelin outfolding formation. Reduction of Fig4 by null heterozygosity and downregulation of PIKfyve both rescue Mtmr2-null myelin outfoldings in vivo and in vitro.
Introduction
Phosphoinositides (PIs) constitute potent signaling molecules with a specific and restricted distribution at intracellular membranes that is strictly controlled by the concerted action of kinases and phosphatases [1], [2]. PIs are key regulators of membrane trafficking as they contribute to assembly of molecular machineries that promote and control membrane dynamics and vesicle movement, tethering and fusion. In the nervous system, both neurons and glia rely on efficient membrane trafficking for many functions, such as axonal transport or myelination.
Charcot-Marie-Tooth (CMT) neuropathies are very heterogeneous disorders from both the clinical and genetic point of view [3]–[6]. Several CMT genes encode proteins that regulate or are connected with PI metabolism, including FRABIN/FGD4, FIG4, DNM2, RAB7, SIMPLE, LRSAM1, SH3TC2, MTMR2, and MTMR13, supporting the idea that regulation of intracellular trafficking is a key process in peripheral nervous system biology [7] (http://www.molgen.ua.ac.be/CMTMutations/default.cfm).
We first demonstrated that loss of function mutations in the MTMR2 (Myotubularin-related 2) gene cause autosomal recessive demyelinating Charcot-Marie-Tooth type 4B1 (CMT4B1, OMIM #601382) neuropathy with myelin outfoldings [8]. MTMR2 is a phospholipid phosphatase that dephosphorylates both PtdIns3P and PtdIns(3,5)P2 phosphoinositides at the D3 position of the inositol ring, thus generating PtdIns5P [9]–[16]. We have generated a Mtmr2-null mouse which models the CMT4B1 neuropathy and we reported that loss of Mtmr2 specifically in Schwann cells is both sufficient and necessary to provoke myelin outfoldings [17], [18]. We recently identified a potential mechanism using in vivo and in vitro models of CMT4B1 and proposed that Mtmr2 belongs to a molecular machinery that titrates membrane formation during myelination. According to this model, myelin outfoldings arise as a consequence of the loss of negative control on the amount of membrane produced during myelination [19]. Despite these findings, the function of MTMR2 and the role of the MTMR2 phospholipid phosphatase activity in the nerve still remain to be assessed.
Loss of the FIG4/SAC3 phospholipid phosphatase in human provokes another form of autosomal recessive demyelinating CMT, the CMT type 4J (OMIM #611228) neuropathy [20], [21]. FIG4 is a 5-phosphatase involved in the dephosphorylation of PtdIns(3,5)P2, a predicted substrate of MTMR2. Loss of Fig4 in the mouse causes the plt (pale tremor) phenotype, characterized by extensive neuronal vacuolization and degeneration and by a peripheral neuropathy [20], .
Yeast Fig4 is localized at the vacuolar membrane-the yeast lysosomal compartment - and is required for both the generation and turnover of PtdIns(3,5)P2 [23], [24]. In addition to the 5-phosphatase activity, yeast Fig4 appears to activate Fab1, the kinase that produces PtdIns(3,5)P2 from PtdIns3P [23], [24]. Deletion of yeast Fig4 reduces rather than increases PtdIns(3,5)P2 leading to defects in vacuole homeostasis and function. A significant decrease of PtdIns(3,5)P2 was found also in plt (Fig4-null) fibroblasts, suggesting conserved enzymatic and cellular functions of Fig4 from yeast to mouse [20]. Moreover, the most common human mutation of FIG4 acts by reducing its affinity for the PtdIns(3,5)P2 biosynthetic complex [25].
Since FIG4 has a role in generation of PtdIns(3,5)P2 and MTMR2 catalyzes its dephosphorylation, these two phosphatases might have opposite effects in the control of PtdIns(3,5)P2 homeostasis and their mutations might have compensatory effects in vivo. To explore the role of the MTMR2 phospholipid phosphatase activity in vivo, we took advantage of the Fig4 and Mtmr2-null mice and generated and characterized the Mtmr2/Fig4 double null mutant. Here we provide strong evidence that Mtmr2 and Fig4 functionally interact in both Schwann cells and neurons, and reveal for the first time a role of Mtmr2 in neurons in vivo. We also report that the imbalance of PtdIns(3,5)P2 might be at the basis of myelin outfolding in the nerve. Reduction of Fig4 by null heterozygosity and downregulation of PIKfyve both rescue Mtmr2-null myelin outfoldings in vivo and in vitro.
Results
Generation of Mtmr2/Fig4-null mice
The generation and characterization of Mtmr2-null and Fig4-null (plt) mice have been reported [17], [20]. Mtmr2/Fig4 double null mice and controls were analyzed in the F2 generation. At postnatal day three (P3) Mtmr2−/−Fig4−/− mice had reduced body size and diluted pigmentation of the coat similar to the Mtmr2+/+Fig4−/− mice in the same litter, and as reported for the plt mouse [20]. Tremor and abnormal gait developed in the second week after birth. Mtmr2+/+Fig4−/− mice show juvenile lethality and die around 1 month of age. The viability of Mtmr2−/−Fig4−/− mice was lower than for Mtmr2+/+Fig4−/− littermates. A reduced number of both Mtmr2+/−Fig4−/ − and Mtmr2−/−Fig4−/− mice were present at P8, compared to the expected Mendelian ratio (Table 1 and Table 2). The longest survival of the double mutant was 20 days. The data indicate that loss of Mtmr2 reduces viability of Mtmr2+/+Fig4−/−. We therefore hypothesized that loss of Mtmr2 might provoke a worsening of the Mtmr2+/+Fig4−/− neurodegeneration.


Mtmr2 loss exacerbates Fig4-null neurodegeneration
To explore this possibility, we performed semithin section analysis of DRG ganglia, brain and spinal cord from Mtmr2+/+Fig4−/− and Mtmr2−/−Fig4−/− mice. DRG ganglia from both Mtmr2+/+Fig4−/ − and Mtmr2−/−Fig4−/ − mice at P3 were severely affected, exhibiting neuronal loss and massive vacuolization (Figure 1A–1C). In the cerebellum of both Mtmr2+/+Fig4−/ − and Mtmr2−/−Fig4−/ − mice at P8 and at P20 we observed a thickening of the molecular layer as compared to wild-type, and cells with cytoplasmic vacuoles were present in the granular layer. At P20, a consistent loss of Purkinjie and basket cells was observed in both genotypes (Figures S1 and S2). These cerebellar findings have not been previously reported in the plt mouse.

In the cortex and brainstem of Mtmr2−/−Fig4−/ − mice at P3 we noted more cells with vacuoles and inclusions than in Mtmr2+/+Fig4−/ − mice, which were never been observed in wild-type animals (Figure 1D–1I). In particular, in the brainstem of Mtmr2−/−Fig4−/ − mice at P8 the number of neurons carrying pathological abnormalities was significantly increased as compared to Mtmr2+/+Fig4−/ − mice (Figure 1J–1L). We also analyzed the spinal cord of Mtmr2+/+Fig4−/− and Mtmr2−/−Fig4−/− mice at P3 and P8 (Figure 2A–2F). Vacuolated cells and cells with inclusions were observed, as previously described for the plt phenotype, which were not present in wild-type spinal cords [20], [26]. At P8, we observed a significant decrease in the number of motor neurons and cells in Mtmr2−/−Fig4−/ − mice as compared to Mtmr2+/+Fig4−/ − mice (Figure 2H, 2I). These findings demonstrate that loss of Mtmr2 exacerbates the Mtmr2+/+Fig4−/− neurodegeneration.

This effect could be the consequence of loss of Mtmr2 in neurons or in other cells, such as in astrocytes. For example, in the plt mouse, a block of autophagy in astrocytes has been reported. In plt mice at 1 week of age, the p62 autophagy marker was increased in GFAP-positive astrocytes from brain regions severely affected at later stages, suggesting that autophagy impairment contributes to the pathogenesis [26]. Elevated p62 co-localized with LAMP2-positive late endosomes/lysosomes (LE/LY) in astrocytes, showing that the block of autophagy occurred subsequent to the fusion of autophagosomes with LE/LY [26]. To determine whether loss of Mtmr2 in astrocytes might further impair autophagy, we evaluated p62 levels in total brain extracts from Mtmr2+/+Fig4−/ − as compared with Mtmr2−/−Fig4−/ − mice. Increased p62, LAMP1 and GFAP expression levels were confirmed in Mtmr2+/+Fig4−/ − as compared to wild-type but no differences were detected between Mtmr2+/+Fig4−/ − and Mtmr2−/−Fig4−/ − double null mice (Figure 3A). This finding indicates that loss of Mtmr2 does not further impair the block in the autophagic process in astrocytes of Fig4-null mice.
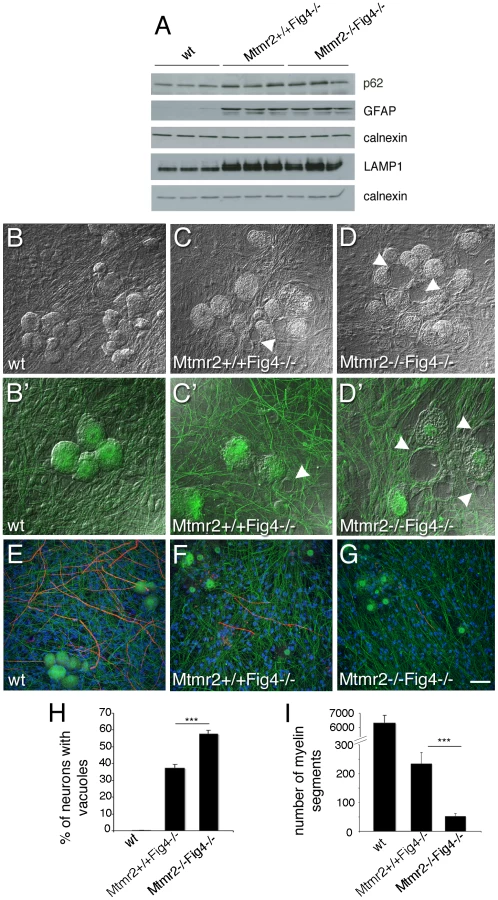
To further investigate the cell autonomy of the Mtmr2/Fig4 interaction, we established dissociated Schwann cell/DRG neuron co-cultures from Mtmr2+/+Fig4−/ − and Mtmr2−/−Fig4−/ − mice, in which mutant Schwann cells were replaced with exogenous wild-type rat Schwann cells. Mtmr2−/−Fig4−/ − DRG neurons cultured with wild-type Schwann cells were significantly more severely vacuolated (57.8%) as compared to Mtmr2+/+Fig4−/− cultures (37.4%) (Figure 3B–3D′ and 3H). This finding provides strong evidence that the loss of Mtmr2 in neurons leads to the worsening of the Fig4-null neurodegeneration.
Like neurons, mouse primary fibroblasts (MFs) from plt mutants display enlargement and vacuolization of the LAMP2-positive LE/LY compartment [20], [22]. To provide further evidence for functional interaction between MTMR2 and FIG4, we established MF cultures from Mtmr2+/+Fig4−/− and Mtmr2−/−Fig4−/ − mice. By LAMP1 staining and confocal microscopy, we observed that the number of fibroblasts carrying enlarged LE/LY was significantly increased in Mtmr2−/−Fig4−/ − double mutants as compared to Mtmr2+/+Fig4−/− (Figure 4). This finding indicates that Mtmr2 loss exacerbates Fig4-null vacuolar phenotype by further impairment of the endo/lysosomal trafficking pathway.

Mtmr2 exacerbates Fig4-null hypomyelination in sciatic nerve
The plt mouse phenotype is characterized by a peripheral neuropathy. Loss of large diameter myelinated axons, hypomyelination (reduced myelin thickness), reduced amplitude of compound motor action potential (cMAP) and slowing of the nerve conduction velocity (NCV) have been reported in plt mouse nerves at 6 weeks of age [20], [22]. The extent of the NCV reduction in plt mice and the presence of demyelinating features in CMT4J patient biopsies such as onion bulbs suggested that FIG4 has also a cell autonomous role in Schwann cells [22].
We investigated sciatic nerves from Mtmr2+/+Fig4−/ − and Mtmr2−/−Fig4−/− mice. At P3 and P8, mutant sciatic nerves showed a normal development. In both genotypes at P8, Schwann cells often contained cytoplasmic inclusions and occasionally contained vacuoles, which were never observed in wild-type nerves. At P20, the latest time point of survival of Mtmr2/Fig4 double null mice, Mtmr2+/+Fig4−/− sciatic nerves were hypomyelinated (thin myelin sheath) with an increased g-ratio (diameter of the axon divided by the diameter of the fiber) as compared to wild-type nerves (Figure 5E). At this stage, sciatic nerves from Mtmr2−/−Fig4−/ − double null mice were more severely hypomyelinated than Mtmr2+/+Fig4−/− mice with a higher g-ratio, demonstrating that Mtmr2 loss exacerbates the neuropathy of Mtmr2+/+Fig4−/− mice (Figure 5E). The total number of fibers and the axonal diameter distribution at P20 were not significantly altered in mouse nerves of either genotype (Figure 5F). These observations indicate that the hypomyelination is not a developmental defect related to delayed axonal growth. Hypomyelination may result from a defective axonal/Schwann cell interaction due to the severe neuronal degeneration and/or from the loss of FIG4 in Schwann cells. We thus cultured dissociated DRG neurons from Mtmr2−/−Fig4−/− and Mtmr2+/+Fig4−/ − mice, seeded with exogenous wild type rat Schwann cells. Following induction of myelination by ascorbic acid treatment, vacuolated DRG neurons from both Mtmr2−/−Fig4−/ − and Mtmr2+/+Fig4−/ − mouse embryos were able to produce myelinated segments, although significantly fewer than wild-type cultures. Moreover, DRG neurons from Mtmr2−/−Fig4−/ − mice cultured with wild-type Schwann cells produced significantly fewer myelinated segments than Mtmr2+/+Fig4−/ − neurons seeded with wild-type Schwann cells (Figure 3E–3G and quantification in panel I). This observation suggests that the hypomyelination of Mtmr2+/+Fig4−/− nerves represents at least in part the consequence of impaired Schwann cell-axonal interaction.

Fig4 heterozygosity rescues Mtmr2-null myelin outfoldings
To further investigate Mtmr2 and Fig4 interaction in the nerve, we evaluated whether loss of Fig4 modifies the myelin outfolding phenotype. Myelin outfoldings in Mtmr2-null mice arise around the third to fourth week after birth, and the number of fibers containing myelin outfoldings and loops progressively increases with age (up to 6 months or even later). Since Mtmr2−/−Fig4−/−double mutants die before 1 month of age, we compared sciatic and peroneal nerves at 6 months of age from Mtmr2−/−Fig4+/+ and Mtmr2−/−Fig4+/ − (Fig4 heterozygous) mice. Using semithin section analysis, we measured the number of fibers carrying myelin outfoldings in mutant sciatic and peroneal nerves normalized to the total number of fibers. In Mtmr2−/−Fig4+/ − nerves myelin outfoldings were significantly reduced as compared to Mtmr2−/−Fig4+/+ mice (Figure 6A–6D). Since loss of Mtmr2 in Schwann cells is both sufficient and necessary to provoke myelin outfoldings, loss of Fig4 in Schwann cells (rather than axons) is likely to account for the rescue of the disease phenotype.

To further evaluate this finding, we established myelin-forming Schwann cell/DRG neuron co-cultures from Mtmr2−/−Fig4+/+ and Mtmr2−/−Fig4+/ − mouse embryos at E13.5 (Figure 7A, 7B). By measuring the number of MBP positive fibers carrying myelin outfoldings in the cultures, we confirmed that Mtmr2-null myelin outfoldings were rescued by Fig4 heterozygosity (Figure 7C).

Loss of Fig4 in plt fibroblasts leads to a significant decrease in PtdIns(3,5)P2, whereas Mtmr2 loss should lead to an increase in both PtdIns3P and PtdIns(3,5)P2 in vivo in the nerve [20]. Indeed, by performing a sensitive in vitro mass assay on Mtmr2-null Schwann cell/DRG neuron co-cultures, we found that in null cells PtdIns5P is significantly reduced (up to 70%) as expected by the loss of MTMR2 3-phosphatase activity on PtdIns(3,5)P2 (Figure 8A). We hypothesized that the observed rescue by Fig4 heterozygosity might be the consequence of a restored level of PtdIns(3,5)P2 in Schwann cells. Heterozygosity of Fig4 might decrease PIKfyve activity and therefore partially restore PtdIns(3,5)P2 levels in Mtmr2-null cells.

To test this hypothesis, we downregulated either the activity or expression of PIKfyve in Mtmr2-null co-cultures to rescue myelin outfoldings. We transduced Mtmr2-null co-cultures with lentiviral vectors (LV) carrying PIKfyve shRNA and scored the number of myelinated MBP-positive fibers with myelin outfoldings. Titration of the PIKfyve shRNA LV was previously performed to determine the highest amount of virus which does not significantly affect myelination (Figure S3A, S3B). We found that myelin outfoldings were significantly rescued by downregulating PIKfyve expression (Figure 7D–7F′″ and 7I). We also treated Mtmr2-null cultures with a specific pharmacological inhibitor of PIKfyve, YM201636 [27]–[29]. Titration of the compound was performed to determine the maximum amount of YM201636 that does not inhibit myelination (Figure S3A, S3B). Seventy nM final concentration of YM201636 was freshly added to the culture media every other day together with ascorbic acid to achieve full myelination. A significant reduction of myelin outfoldings was confirmed in Mtmr2-null cultures treated with YM201636 as compared with DMSO alone (Figure 7G, 7H, 7J). The data suggest that reduction of the level of PtdIns(3,5)P2, either by heterozygosity for Fig4 or by inhibition of PIKfyve, corrects the myelin abnormality of Mtmr2-null cells This result predicts that the level of PtdIns(3,5)P2 may be elevated in Mtmr2-null cells.
Phospholipid analysis in mouse fibroblasts
To correlate MTMR2 and FIG4 functional interaction with changes in PI levels, we measured PtdIns3P and PtdIns(3,5)P2 levels from wild-type; Mtmr2−/−Fig4+/+; Mtmr2+/+Fig4−/−; Mtmr2−/−Fig4−/−, and Mtmr2−/−Fig4+/ − fibroblasts by metabolic labeling and HPLC analysis (Figure 8). PtdIns3P levels were similar in all the genotypes analyzed (data not shown). In mammalian cells, PtdIns3P generation and turnover are controlled by multiple redundant pathways, so that ablation of one particular enzyme such as myotubularins does not necessarily result in an imbalance of PtdIns3P, as already reported [9], [30], [31].
On the other hand, we found that loss of Fig4 in Fig4-null fibroblasts results in a significant decrease of PtdIns(3,5)P2 as compared to control cells, thus confirming previous findings [20] (Figure 8B). As also suggested by the in vitro mass assay performed on Mtmr2-null myelin-forming co-cultures (Figure 8A), loss of Mtmr2 in Mtmr2-null fibroblasts leads to a significant increase in PtdIns(3,5)P2 level, consistently with the 3-phosphatase activity of MTMR2 (Figure 8C). Moreover, PtdIns(3,5)P2 was equally reduced in Fig4−/ − and in Mtmr2−/−Fig4−/ − cells (Figure 8B), possibly because the PtdIns(3,5)P2 substrate is already severely affected by loss of Fig4, and Mtmr2 acts downstream of Fig4 in the control of this lipid level.
To support the hypothesis that myelin outfoldings in Mtmr2−/−Fig4+/ − co-cultures were rescued because of restored PtdIns(3,5)P2 levels, we also measured PtdIns(3,5)P2 in Mtmr2−/−Fig4+/+ and Mtmr2−/−Fig4+/ − fibroblasts. However, PtdIns(3,5)P2 did not differ in Mtmr2−/−Fig4+/+ and Mtmr2−/−Fig4+/ − fibroblasts (Figure 8C). Small changes in PtdIns(3,5)P2 levels due to loss of 50% of phosphatase expression may be below the level of detection of this method.
Overall, these findings indicate that Mtmr2 and Fig4 control PtdIns(3,5)P2 with opposite effects. If Fig4 is totally absent and PtdIns(3,5)P2 is low, the absence of Mtmr2 which dephosphorylates PtdIns(3,5)P2 has no influence. On the other hand, when PtdIns(3,5)P2 is high due to loss of Mtmr2, a partial reduction in PIKfyve activity due to heterozygosity of Fig4 might lead to PtdIns(3,5)P2 rebalance and rescue of myelin outfoldings.
Finally, we tested for interaction between phosphatases using a pull-down assay. GST-MTMR2 was not able to pull-down Fig4 from brain or isolated rat Schwann cell lysates, suggesting that the functional interaction between MTMR2 and FIG4 demonstrated here is not mediated by physical interaction between the two proteins (Figure S3C–S3E).
Mammalian MTMR2 converts PtdIns(3,5)P2 and PtdIns3P in yeast
The mutant yeast strain fig4Δ displays enlarged vacuoles caused by reduced PtdIns(3,5)P2, which in yeast controls the homeostasis of the vacuole (the lysosomal compartment). To further test Mtmr2 function, and further test functional interactions between Mtmr2 and Fig4, we transformed FLAG-MTMR2 in the mutant yeast strain fig4Δ. Overexpression of wild-type MTMR2 in fig4Δ caused a further enlargement of the vacuolar compartment and defects in vacuole fission whereas the catalytically inactive mutant FLAG-MTMR2C417S did not cause these changes (Figure 9). To determine the substrates and products of mammalian MTMR2 in yeast, we measured phosphorylated phosphoinositide lipid levels from cells expressing FLAG-MTMR2 as compared to the vector alone. To enhance the sensitivity of the assay, we subjected the yeast to hyperosmotic shock. In wild-type yeast, this results in a transient increase in PtdIns(3,5)P2 levels (green line) and concomitant decrease in PtdIns3P (blue line) (Figure 10, 5 min time point). If MTMR2 acts on PtdIns(3,5)P2, then there should be a decrease in PtdIns(3,5)P2 and a corresponding increase in PtdIns5P. Moreover, if MTMR2 acts on PtdIns3P there will be a decrease in that lipid as well. Each of these changes was observed (Figure 10, solid lines and Table S1). These findings demonstrate that MTMR2 acts on both PtdIns(3,5)P2 and PtdIns3P in yeast, and strongly suggest that MTMR2 acts on both of these substrates in mammalian cells as well. These observations support the hypothesis that MTMR2 and FIG4 coordinately regulate the PtdIns3P-PtdIns(3,5)P2 pathway in vivo.


Discussion
The MTMR2 3-phosphatase activity toward PtdIns3P and PtdIns(3,5)P2 has been demonstrated by a number of studies using recombinant MTMR2 in vitro as well as conventional cell lines overexpressing MTMR2 [10]–[16]. Overexpressed MTMR2 has been co-localized with Rab7 in A431 cells at the level of late endosome/lysosomes, where PtdIns(3,5)P2 is generated [16]. Interestingly, another phospholipid phosphatase, FIG4/SAC3, is involved in both the dephosphorylation and the production of PtdIns(3,5)P2 and is mutated in autosomal recessive demyelinating CMT4J neuropathy [20]. Loss of Fig4 in mouse provokes the plt phenotype characterized by massive neurodegeneration and peripheral neuropathy. In Fig4-null fibroblasts a decrease in PtdIns(3,5)P2 has been demonstrated, suggesting that Fig4 promotes PtdIns(3,5)P2 production by PIKfyve activation or stabilization [20]. Thus, MTMR2 and FIG4 could have opposite effects in the control of PtdIns(3,5)P2.
To explore the biological role of MTMR2 phosphatase activity in the nerve in vivo, we generated a Mtmr2/Fig4 double null mutant. Analysis of these mice provides evidence that Mtmr2 and Fig4 functionally interact in neurons, fibroblasts, and Schwann cells. Loss of Mtmr2 reduces the viability and exacerbates the neurodegeneration of Fig4-null mice.
These results also provide the first evidence for a role for MTMR2 in neurons in vivo, consistent with the marked axonal loss in CMT4B1 patients [32]. Although conditional ablation of Mtmr2 in motorneurons in mice did not reveal signs of axonal degeneration or neuronopathy, a cell autonomous role of Mtmr2 in neurons was not excluded since axonopathies are length dependent and not easily reproduced in mice [18]. Interestingly, a role for MTMR2 in neurons in vitro has been recently reported suggesting that Mtmr2 is localized to excitatory synapses of central neurons via direct interaction with the PSD-95 scaffolding protein [33]. Knockdown of Mtmr2 in cultured neurons markedly reduced excitatory synapse density and function and it was proposed that the MTMR2/PSD95 complex contributes to the maintenance of excitatory synapses by inhibiting excessive endosome formation and destructive endosomal traffic to lysosomes.
Here, we assessed MTMR2 and FIG4 interaction in yeast and found that overexpression of MTMR2 reduces both PtdIns3P and PtdIns(3,5)P2 leading to an increase in vacuole size in the fig4Δ mutant. These findings support the in vivo role of MTMR2 as a 3-phosphatase that acts on both PtdIns3P and PtdIns(3,5)P2.
Fig4 heterozygosity rescues myelin outfoldings due to Mtmr2 deficiency both in vivo and in vitro, thus providing evidence of the Fig4 and Mtmr2 interaction in Schwann cells as well as neurons. Loss of Mtmr2 specifically in Schwann cells provokes myelin outfoldings. The presence of cytoplasmic inclusions in Schwann cells and the reduced NCV in the Fig4-null mouse, and the typical demyelinating features (onion bulbs) of CMT4J patients, all strongly support a Schwann cell autonomous role for Fig4. But how does loss of Fig4 in Schwann cells rescue Mtmr2-null myelin outfoldings? We hypothesized that a 50% reduction of Fig4 might be sufficient to rebalance the PtdIns(3,5)P2 elevation in Mtmr2-null cells (Figure 11), thus reducing myelin outfoldings. MTMR2 loss should lead to an increase of both PtdIns3P and PtdIns(3,5)P2, whereas FIG4 loss reduces PtdIns(3,5)P2 levels. In agreement with this model, we observed that downregulation of PIKfyve expression or inhibition of its activity in Mtmr2-null co-cultures reduced myelin outfoldings, as also observed with Fig4 heterozygosity (Figure 11). Our results therefore suggest that imbalance of PtdIns(3,5)P2 is at the basis of altered longitudinal myelin growth and formation of myelin outfoldings. The observed rescue of myelin outfoldings is likely mediated by restored PtdIns(3,5)P2 rather than PtdIns5P. PtdIns5P may be produced via dephosphorylation of PtdIns(3,5)P2 by MTMRs, and can also be generated, at least in vitro, by PIKfyve acting on phosphatidylinositol [34]. Therefore, Fig4 heterozygosity in Mtmr2-null cells would lead to a further reduction in PtdIns5P rather than restoration, as for PtdIns(3,5)P2.

PtdIns(3,5)P2 is thought to be localized to EE and the limiting membranes of LE/LY, although it cannot be excluded that this lipid might also be generated at other membranes. The lack of specific probes to detect PtdIns(3,5)P2 prevents the definition of other membrane localization [35], [36]. Our studies raise the question of how dys-regulation of PtdIns(3,5)P2 leads to aberrant longitudinal myelin growth. Excessive longitudinal myelin growth and myelin outfoldings might arise as a consequence of reduced endocytosis/recycling and degradation or as a consequence of increased exocytosis. One can speculate that increased PtdIns(3,5)P2 due to loss of MTMR2 might favor exocytosis from the LE/LY compartment during myelin biogenesis. However, this mechanism, which has been recently suggested to occur in oligodendrocytes [37], accounts for the assembly of myelin components during the active phase of myelination. In myelin outfoldings, myelin thickness is normal, so a more subtle mechanism of regulation would be involved. Increased PtdIns(3,5)P2 might alter autophagy dynamics. However, we did not observe any change on LC3II/I ratio and/or p62 levels in Mtmr2-null nerves or in myelin-forming DRG co-cultures (unpublished results).
Alternatively, MTMR2 may favor endocytosis and counteract exocytosis during later stages of myelin biogenesis. The myelin outfoldings may thus arise as a consequence of the loss of negative control on the amount of membrane produced during myelination. Another alternative is that MTMR2 might control endocytosis of specific transmembrane proteins linking Schwann cell plasma membrane to the axonal plasma membrane, which then act as signaling molecules to control longitudinal myelin growth. Note that myelin outfoldings often contain axoplasm and axons branches at paranodal regions thus following myelin membrane outgrowth [17]. Along these lines, enhanced surface localization of putative adhesion molecules due to loss of Mtmr2-mediated endocytosis might result in the loss of control of myelin elongation and thus in myelin outfoldings. Other members of the MTMR family seem to possess similar biological functions. MTMR4 was recently demonstrated to regulate the sorting of endosomal cargos into recycling endosomes [38]. In C. elegans, MTM6 and MTM9 were found to be involved in endocytosis [39] whereas Drosophila Mtm (homologous to catalytically active MTM1, MTMR1, and MTMR2) regulates both actin-based plasma membrane morphogenesis and the endosomal influx toward the endo-lysosomal axis [40]. Whether and how MTMR2 might regulate endocytosis in Schwann cells during postnatal development remains to be assessed.
Materials and Methods
Ethics statement
All experiments involving animals were performed in accordance with Italian national regulations and covered by experimental protocols reviewed by local Institutional Animal Care and Use Committees.
Mice
Mtmr2-null mice were backcrossed for at least 5 generations to strain C57BL/6N.
Fig4+/ − heterozygous mice were maintained on the recombinant inbred line CB.plt derived predominantly from strains CAST/Ei and C57BL/6J (25%) [25].
Heterozygous Fig4+/ − males were crossed with Mtmr2-null females to obtain Mtmr2+/−Fig4+/ − double heterozygous mice. Double heterozygotes were crossed to generate Mtmr2−/−Fig4−/ − double null mice as well as Mtmr2−/−Fig4+/ − mice for analysis. Genotyping was performed as described [17], [20].
Morphological analysis
Semithin morphological analysis was performed as described previously [41]. For morphometric analysis in brainstem at P8, neuronal damage was evaluated in the facial nucleus at the level of the upper medulla oblongata (Bregma −5.88). For each experimental sample, microscopic images (130 um×90 um, nine images per slide, three slides for each brain) were taken with a digital camera and processed by Adobe Photoshop 7.0 software. To be counted, a cell (diameter >20 µm) had to be located in the facial nucleus and 100–150 cells were scored per section. Cells with abnormal cytoplasm vacuolization were scored as pathological. The average percentage of normal and damaged neurons for each sample was considered for each experimental group to represent the neuronal density. Counts were performed in double blind by 2 investigators on slides with a number-code system, and results were analyzed.
The number of motorneurons and of total cells in spinal cord was assessed by performing at least 15 sections for each spinal cord from three animals per genotype as before and by counting the number of cells per area-cell density (mm2).
The proportion of fibers carrying myelin outfoldings in Mtmr2-null nerves as compared to Mtmr2-null mice with Fig4+/ − heterozygosity was determined by measuring the number of fibers carrying myelin outfoldings normalized to the total number of axons per section (the entire nerve section was reconstructed).
Ultrathin morphological analysis was conducted as reported previously [41]. For morphological analysis, three to five animals were evaluated at each time point in most cases.
Primary mouse fibroblast (MF) culture
MFs were established at P3 from tails and legs chopped in pieces and incubated after PBS washing with RPMI medium and 1 mL Collagenase Type II (Stock = 2000 U/mL in 1×PBS, Worthington, LS004204) overnight at 37°C. The next day, cells were plated in RPMI-1640 with 15% FBS/1× L-Glutamine/1× Pen/Strep. Cells were subjected to only two-three passages to allow maximum efficiency of metabolic labelling for PI measurement.
Phospholipid analysis
Fibroblasts were labeled for 16 h in phosphate free DMEM (Invitrogen) containing 200 µCi/ml [32P]orthophosphate (Perkin Elmer). Lipids were extracted, separated on Silica gel G60 plates and analyzed by HPLC as described previously [42].
PtdIns5P was quantified by mass assay as described [43]. Briefly total lipids were extracted from duplicate or triplicate plates of DRG co-cultures from Mtmr2+/ − or Mtmr2−/ − knock-out mice and separated on Silica gel G60 plate. Monophosphorylated PIs were scraped, eluted from silica and assessed for PtdIns(4,5)P2 formation in vitro using the recombinant specific PIP4KIIalpha and [gamma-32P] ATP.
Antibodies
For western blot analysis and immunohistochemistry the following antibodies were used: rat anti-LAMP1 (Iowa Hybridoma bank), Guinea pig anti-P62 (Progen), rabbit anti-GFAP (Sigma), rabbit anti-MAG (kindly provided by Dr. J. Salzer), rat anti-MBP (kindly provided by Dr. V. Lee), mouse anti-MBP (Covance), rabbit anti-NF-L (Chemicon), mouse anti-tubulin (Sigma), and mouse anti-FIG4 (NeuroMab).
Schwann cell/DRG neuron co-cultures
Myelin-forming Schwann cell/DRG neuron co-cultures were established from E13.5 mouse embryos as previously described [19], [44]. Myelination was induced by treatment for 15 days with ascorbic acid (final concentration, 50 µg/ml) (Sigma-Aldrich). Dissociated Schwann cell/DRG neuron co-cultures were established as described but DRGs were first incubated with trypsin (0.25%) for 45 min at 37°C. Cells were also mechanically dissociated and then plated at a concentration of one to two DRGs per glass coverslip. Isolated rat Schwann cells were prepared as reported previously and cultured using DMEM with 10% of fetal calf serum, 2 ng/ml recombinant human neuregulin1-b1 (R&D Systems), and 2 mM forskolin (Calbiochem).
YM201636 was provided by Symansis. A titration of the compound starting from 800 nM until 30 nM was performed on co-cultures to select the maximum amount of coumpound which did not affect myelination. As already described [27], [28], 400 or 800 nM of compound provoked extensive cell vacuolization after overnight incubation. YM201636 was provided to co-cultures at 70 nM every other day together with ascorbic acid for 13 days to achieve full myelination.
Immunohistochemistry
Schwann cell/DRG neuron co-cultures were fixed for 15 min in 4% paraformaldehyde, permeabilized for 5 min in ice-cold methanol at −20°C, blocked for 20 min with 10% normal goat serum (Dako), 1% bovine serum albumin (BSA) (Sigma-Aldrich), and then incubated with primary antibody for 1 h. After extensive washing, the coverslips where incubated with the secondary antibody for 30 min, washed, and mounted. For double immunostaining with anti-NF-L and anti - MBP antibody, the coverslips were blocked with 1% BSA, 10% NGS for 20 min on ice, and primary antibodies were incubated overnight at 4°C.
For LAMP1 staining, fibroblasts were permeabilized using 0.1% saponin after fixation. For immunolabeling, secondary antibodies included fluorescein-conjugated (FITC) and rhodamine (tetramethylrhodamine isothiocyanate) (Jackson ImmunoResearch). Coverslips were analyzed using TCS SP5 laser-scanning confocal (Leica) or Olympus BX (Olympus Optical) fluorescent microscope, and Zeiss Axiovert S100 TV2 with Hamamatsu OrcaII-ER.
Analysis of myelination
To quantify the amount of myelination, the number of MBP positive segments in each explant/coverslip was assessed. As myelination is also a function of the amount of neurites/axons and of the Schwann cell number in the culture, the network of NF-L positive filaments and the number of Schwann cells (DAPI) were also evaluated in each explant. To quantify MBP-positive fibers displaying myelin outfoldings, at least 200 MBP-positive myelinated fibers per explant/coverslip were evaluated, in at least ten different explants/coverslip. The percentage of MBP-positive fibers showing myelin outfoldings among the total number of MBP-positive fibers was counted.
Analysis of fibroblasts with enlarged late endosome/lysosomes
Fibroblasts were stained using LAMP1 antibody and images were acquired using a confocal microscope. Images were then processed using the Image J software and those cells displaying almost all LAMP1 positive endosomes bigger than 1.67 µm (only occasionally observed in wild-type cells) were considered as carrying enlarged late endosome/lysosomes.
Imaging and statistical analysis
Micrographs were acquired using a digital camera (Leica F300), and figures were prepared using Adobe Photoshop, version 7.0 and 8.0 (Adobe Systems). Statistical analysis was performed using the Student t test; two tails, unequal variants, and alpha = 0.005 were used. Error bars in the graphs represent SEM.
Lentiviral vector (LV) preparation
To downregulate PIKfyve expression, a shRNA cloned into pLKO.1 LV (human U6 promoter) without a GFP reporter was used (clone ID TRCN0000150081). Non-concentrated LVs were used for RNA interference. The transfer constructs were transfected into 293FT cells together with packaging plasmids Δ8.9 and pCMV-VSGV using Lipofectamine 2000 (Invitrogen). As control, a vector encoding a shRNA to a nonspecific sequence (luciferase) was used. Viral supernatants were collected 48 h after transfection, centrifuged at 3000 rpm for 15 min, and frozen at −80°C.
To check for PIKfyve depletion, freshly plated rat Schwann cells (106 cells per 100-mm plate) were incubated with the LVs in DMEM, 10% FBS, and 2 mM L-glutamine plus forskolin and rhNRG-1 (EGF domain, R&D). Cells were expanded for an additional week and maintained in MEM, 10% FBS, 2 mM L-glutamine and 2 µM forskolin before use. A western blot using a anti-PIKfyve antibody (Santa Cruz) was performed. Using non-concentrated LV, transduction of Schwann cell/DRG neuron co-cultures was performed 4–5 days after dissection by incubating the cells with LVs overnight. Cells were then supplemented with C-media, and myelination was induced after 2 days.
Glutathione S-transferase–binding assays
Glutathione S-transferase (GST) fusion proteins were expressed in Escherichia coli BL21 cells and purified directly from bacterial extract on glutathione-Sepharose 4 Fast Flow beads. Rat isolated Schwann cells and mouse brains were homogenated, and protein lysates were prepared using a binding buffer with 1%NP-40, 50 mM Tris buffer, pH 7.4, 10% glycerol, 100 mM NaCl, 10 mM NaF, 1 mM Na-vanadate. Equal amounts of protein lysates were incubated for 4 h at 4°C with immobilized GST fusion proteins and GST as control. After three washes with a buffer containing 0.5% NP-40, the pellets were dissolved in SDS sample buffer and analyzed by SDSPAGE and immunoblotting. To show the relative amount of GST fusion proteins used, beads were dissolved in SDS sample buffer and analyzed by SDS-PAGE, and the gel was stained with Coomassie.
Yeast analysis and phospholipid measurement in yeast
Yeast cells were labeled with SynaptoRed C2 (Biotium, Inc., CA). 0.1 units of cells (at 600 nm) were collected and resuspended in 250 µl fresh media. 6 µl of SynaptoRed C2 (10 µg/µl dissolved in dimethyl sulfoxide) was added to the cells and incubated at 24°C for 1 hour. Cells were then washed 2 times with fresh media and chased for 2.5 hours. Fluorescence and differential interference contrast (DIC) images were generated using a DeltaVision RT Microscope System (Applied Precision, WA). Images were processed using Softworx and Adobe Photoshop.
Measurement of phosphoinositide levels were performed as described previously [45]. Cells were grown in selective media to mid-log phase, harvested, washed, and resuspended in synthetic media lacking inositol. 1–4×10⁶ cells were inoculated into 5 ml of media lacking inositol containing 5 µCi of myo-[2-3H]-inositol. Cells were labeled for 18 h at 24°C, harvested by centrifugation, washed, and resuspended in 100 µl of inositol-free media. For hyperosmotic shock, an equal volume of 1.8 M NaCl was added to cells (for a final concentration of 0.9 M NaCl) and the resulting suspension was incubated at 24°C for the times indicated. 800 µl of ice cold 4.5% perchloric acid [46] was added to the cells. Cells were lysed in the presence of 0.5-mm zirconia beads (Biospec, Bartlesville, OK) on a Beadbeater (Biospec) for three cycles of 2 min at room temperature followed by 2 min on ice. Cell extracts were centrifuged at 14,000 rpm for 10 min at 4°C. Precipitates were washed with 1 ml of 100 mM EDTA, centrifuged 14,000 rpm for 10 min at 4°C, and resuspended in 50 µl of sterile distilled deionized water.
Lipids were deacylated by treatment with methylamine [47].1 ml methylamine reagent (10.7% methylamine, 45.7% methanol, 11.4% n-butanol) was added to each sample and incubated at 55°C for 1 h. Samples were dried in a SpeedVac and the pellets were resuspended in 300 µl of sterile water, centrifuged at 14,000 rpm for 2 min and the supernatants were transferred to new Eppendorf tubes. 300 µl of butanol/ethyl ether/formic acid ethyl ester (20∶4∶1) was added to each. The samples were vortexed and centrifuged at 14,000 rpm for 2 min. The aqueous phase (bottom layer) was transferred to new tubes and the extraction was repeated. At the end of the second extraction the aqueous phase was dried in a SpeedVac. Samples were resuspended in 20 µl of sterile water and 15 µl of each was analyzed by HPLC using an anion exchange, PartisphereSAX (Whatman), column. The column was developed with a gradient of 1 M (NH4)2HPO4, pH 3.8 (pH adjusted with phosphoric acid): 0% for 5 min, 1–2% over 15 min, 2% for 80 min, 2–10% over 20 min, 10% for 65 min, 10–80% over 40 min, 80% for 20 min and finally 80-0%; flow rate, 1.0 ml/min [48]. The value of each glycerol-inositol corresponding to PtdIns3P, PtdIns4P, PtdIns5P, PtdIns(3,5)P2, and PtdIns(4,5)P2 is reported as percent of total phosphoinositol, to normalize number of cells and incorporation of [3H] inositol.
Supporting Information
Zdroje
1. VicinanzaMD'AngeloGDi CampliADe MatteisMA 2008 Function and dysfunction of the PI system in membrane trafficking. EMBO J 27 2457 2470
2. Di PaoloGDe CamilliP 2006 Phosphoinositides in cell regulation and membrane dynamics. Nature 443 651 657
3. PareysonDMarchesiC 2009 Diagnosis, natural history, and management of Charcot-Marie-Tooth disease. Lancet Neurol 8 654 667
4. ReillyMMShyME 2009 Diagnosis and new treatments in genetic neuropathies. J Neurol Neurosurg Psychiatry 80 1304 1314
5. SuterUSchererSS 2003 Disease mechanisms in inherited neuropathies. Nat Rev Neurosci 4 714 726
6. NiemannABergerPSuterU 2006 Pathomechanisms of mutant proteins in Charcot-Marie-Tooth disease. Neuromolecular Med 8 217 242
7. SuterU 2007 Phosphoinositides and Charcot-Marie-tooth disease: new keys to old questions. Cell Mol Life Sci 64 3261 3265
8. BolinoAMugliaMConfortiFLLeGuernESalihMA 2000 Charcot-Marie-Tooth type 4B is caused by mutations in the gene encoding myotubularin-related protein-2. Nat Genet 25 17 19
9. TronchereHLaporteJPendariesCChaussadeCLiaubetL 2004 Production of phosphatidylinositol 5-phosphate by the phosphoinositide 3-phosphatase myotubularin in mammalian cells. J Biol Chem 279 7304 7312
10. KimSATaylorGSTorgersenKMDixonJE 2002 Myotubularin and MTMR2, phosphatidylinositol 3-phosphatases mutated in myotubular myopathy and type 4B Charcot-Marie-Tooth disease. J Biol Chem 277 4526 4531
11. BegleyMJTaylorGSBrockMAGhoshPWoodsVL 2006 Molecular basis for substrate recognition by MTMR2, a myotubularin family phosphoinositide phosphatase. Proc Natl Acad Sci U S A 103 927 932
12. BegleyMJTaylorGSKimSAVeineDMDixonJE 2003 Crystal structure of a phosphoinositide phosphatase, MTMR2: insights into myotubular myopathy and Charcot-Marie-Tooth syndrome. Mol Cell 12 1391 1402
13. BergerPBergerISchaffitzelCTersarKVolkmerB 2006 Multi-level regulation of myotubularin-related protein-2 phosphatase activity by myotubularin-related protein-13/set-binding factor-2. Hum Mol Genet 15 569 579
14. BergerPBonneickSWilliSWymannMSuterU 2002 Loss of phosphatase activity in myotubularin-related protein 2 is associated with Charcot-Marie-Tooth disease type 4B1. Hum Mol Genet 11 1569 1579
15. LaporteJLiaubetLBlondeauFTronchereHMandelJL 2002 Functional redundancy in the myotubularin family. Biochem Biophys Res Commun 291 305 312
16. CaoCBackerJMLaporteJBedrickEJWandinger-NessA 2008 Sequential actions of myotubularin lipid phosphatases regulate endosomal PI(3)P and growth factor receptor trafficking. Mol Biol Cell 19 3334 3346
17. BolinoABolisAPrevitaliSCDinaGBussiniS 2004 Disruption of Mtmr2 produces CMT4B1-like neuropathy with myelin outfolding and impaired spermatogenesis. J Cell Biol 167 711 721
18. BolisACovielloSBussiniSDinaGPardiniC 2005 Loss of Mtmr2 phosphatase in Schwann cells but not in motor neurons causes Charcot-Marie-Tooth type 4B1 neuropathy with myelin outfoldings. J Neurosci 25 8567 8577
19. BolisACovielloSVisigalliITaveggiaCBachiA 2009 Dlg1, Sec8, and Mtmr2 regulate membrane homeostasis in Schwann cell myelination. J Neurosci 29 8858 8870
20. ChowCYZhangYDowlingJJJinNAdamskaM 2007 Mutation of FIG4 causes neurodegeneration in the pale tremor mouse and patients with CMT4J. Nature 448 68 72
21. NicholsonGLenkGMReddelSWGrantAETowneCF 2011 Distinctive genetic and clinical features of CMT4J: a severe neuropathy caused by mutations in the PI(3,5)P phosphatase FIG4. Brain 134 1959 1971
22. ZhangXChowCYSahenkZShyMEMeislerMH 2008 Mutation of FIG4 causes a rapidly progressive, asymmetric neuronal degeneration. Brain 131 1990 2001
23. DuexJENauJJKauffmanEJWeismanLS 2006 Phosphoinositide 5-phosphatase Fig 4p is required for both acute rise and subsequent fall in stress-induced phosphatidylinositol 3,5-bisphosphate levels. Eukaryot Cell 5 723 731
24. DuexJETangFWeismanLS 2006 The Vac14p-Fig4p complex acts independently of Vac7p and couples PI3,5P2 synthesis and turnover. J Cell Biol 172 693 704
25. LenkGMFergusonCJChowCYJinNJonesJM 2011 Pathogenic mechanism of the FIG4 mutation responsible for Charcot-Marie-Tooth disease CMT4J. PLoS Genet 7 e1002104 doi:10.1371/journal.pgen.1002104
26. FergusonCJLenkGMMeislerMH 2009 Defective autophagy in neurons and astrocytes from mice deficient in PI(3,5)P2. Hum Mol Genet 18 4868 4878
27. CoronasSLagarrigueFRamelDChicanneGDelsolG 2008 Elevated levels of PtdIns5P in NPM-ALK transformed cells: implication of PIKfyve. Biochem Biophys Res Commun 372 351 355
28. IkonomovOCSbrissaDShishevaA 2009 YM201636, an inhibitor of retroviral budding and PIKfyve-catalyzed PtdIns(3,5)P2 synthesis, halts glucose entry by insulin in adipocytes. Biochem Biophys Res Commun 382 566 570
29. JefferiesHBCookeFTJatPBoucheronCKoizumiT 2008 A selective PIKfyve inhibitor blocks PtdIns(3,5)P(2) production and disrupts endomembrane transport and retroviral budding. EMBO Rep 9 164 170
30. TaylorGSMaehamaTDixonJE 2000 Inaugural article: myotubularin, a protein tyrosine phosphatase mutated in myotubular myopathy, dephosphorylates the lipid second messenger, phosphatidylinositol 3-phosphate. Proc Natl Acad Sci U S A 97 8910 8915
31. ChaussadeCPirolaLBonnafousSBlondeauFBrenz-VercaS 2003 Expression of myotubularin by an adenoviral vector demonstrates its function as a phosphatidylinositol 3-phosphate [PtdIns(3)P] phosphatase in muscle cell lines: involvement of PtdIns(3)P in insulin-stimulated glucose transport. Mol Endocrinol 17 2448 2460
32. QuattroneAGambardellaABonoFAgugliaUBolinoA 1996 Autosomal recessive hereditary motor and sensory neuropathy with focally folded myelin sheaths: clinical, electrophysiologic, and genetic aspects of a large family. Neurology 46 1318 1324
33. LeeHWKimYHanKKimHKimE 2010 The phosphoinositide 3-phosphatase MTMR2 interacts with PSD-95 and maintains excitatory synapses by modulating endosomal traffic. J Neurosci 30 5508 5518
34. Gassama-DiagneAPayrastreB 2009 Phosphoinositide signaling pathways: promising role as builders of epithelial cell polarity. Int Rev Cell Mol Biol 273 313 343
35. DoveSKDongKKobayashiTWilliamsFKMichellRH 2009 Phosphatidylinositol 3,5-bisphosphate and Fab1p/PIKfyve underPPIn endo-lysosome function. Biochem J 419 1 13
36. MichellRHHeathVLLemmonMADoveSK 2006 Phosphatidylinositol 3,5-bisphosphate: metabolism and cellular functions. Trends Biochem Sci 31 52 63
37. TrajkovicKDhaunchakASGoncalvesJTWenzelDSchneiderA 2006 Neuron to glia signaling triggers myelin membrane exocytosis from endosomal storage sites. J Cell Biol 172 937 948
38. NaughtinMJSheffieldDARahmanPHughesWEGurungR 2010 The myotubularin phosphatase MTMR4 regulates sorting from early endosomes. J Cell Sci 123 3071 3083
39. DangHLiZSkolnikEYFaresH 2004 Disease-related myotubularins function in endocytic traffic in Caenorhabditis elegans. Mol Biol Cell 15 189 196
40. VelichkovaMJuanJKadandalePJeanSRibeiroI 2010 Drosophila Mtm and class II PI3K coregulate a PI(3)P pool with cortical and endolysosomal functions. J Cell Biol 190 407 425
41. WrabetzLFeltriMLQuattriniAImperialeDPrevitaliS 2000 P(0) glycoprotein overexpression causes congenital hypomyelination of peripheral nerves. J Cell Biol 148 1021 1034
42. NiebuhrKGiuriatoSPedronTPhilpottDJGaitsF 2002 Conversion of PtdIns(4,5)P(2) into PtdIns(5)P by the S.flexneri effector IpgD reorganizes host cell morphology. EMBO J 21 5069 5078
43. PendariesCTronchereHArbibeLMounierJGozaniO 2006 PtdIns5P activates the host cell PI3-kinase/Akt pathway during Shigella flexneri infection. EMBO J 25 1024 1034
44. TaveggiaCZanazziGPetrylakAYanoHRosenbluthJ 2005 Neuregulin-1 type III determines the ensheathment fate of axons. Neuron 47 681 694
45. BonangelinoCJNauJJDuexJEBrinkmanMWurmserAE 2002 Osmotic stress-induced increase of phosphatidylinositol 3,5-bisphosphate requires Vac14p, an activator of the lipid kinase Fab1p. J Cell Biol 156 1015 1028
46. WhitefordCCBestCKazlauskasAUlugET 1996 D-3 phosphoinositide metabolism in cells treated with platelet-derived growth factor. Biochem J 319 Pt 3 851 860
47. HawkinsPTStephensLDownesCP 1986 Rapid formation of inositol 1,3,4,5-tetrakisphosphate and inositol 1,3,4-trisphosphate in rat parotid glands may both result indirectly from receptor-stimulated release of inositol 1,4,5-trisphosphate from phosphatidylinositol 4,5-bisphosphate. Biochem J 238 507 516
48. ZhangYZolovSNChowCYSlutskySGRichardsonSC 2007 Loss of Vac14, a regulator of the signaling lipid phosphatidylinositol 3,5-bisphosphate, results in neurodegeneration in mice. Proc Natl Acad Sci U S A 104 17518 17523
Štítky
Genetika Reprodukční medicínaČlánek vyšel v časopise
PLOS Genetics
2011 Číslo 10
- Kazuistika – Perspektivy využití precizované medicíny v rámci personalizované specifické terapie onkologických pacientů
- Nobelova cena za chemii pro genetické nůžky: Objev, který změní naši budoucnost?
- Technologie na bázi RNA v klinické praxi: od přebarvených petúnií k terapii vzácných a dosud jen obtížně léčitelných chorob u lidí
- „Nepředstavovali jsme si, že náš výzkum povede přímo ke vzniku nových léků, dokonce ještě za našeho života“
- Bezplatné služby pro diagnostiku ATTRv amyloidózy pro kardiology
Nejčtenější v tomto čísle
- The Glycobiome Reveals Mechanisms of Pentose and Hexose Co-Utilization in Bacteria
- Global Mapping of Cell Type–Specific Open Chromatin by FAIRE-seq Reveals the Regulatory Role of the NFI Family in Adipocyte Differentiation
- Genetic Determinants of Serum Testosterone Concentrations in Men
- MicroRNA Expression and Regulation in Human, Chimpanzee, and Macaque Brains
Zvyšte si kvalifikaci online z pohodlí domova
Mazová zátka a její řešení
nový kurzVšechny kurzy