
Temporal Coordination of Gene Networks by Zelda in the Early Embryo
In past years, much attention has focused on the gene networks that regulate early developmental processes, but less attention has been paid to how multiple networks and processes are temporally coordinated. Recently the discovery of the transcriptional activator Zelda (Zld), which binds to CAGGTAG and related sequences present in the enhancers of many early-activated genes in Drosophila, hinted at a mechanism for how batteries of genes could be simultaneously activated. Here we use genome-wide binding and expression assays to identify Zld target genes in the early embryo with the goal of unraveling the gene circuitry regulated by Zld. We found that Zld binds to genes involved in early developmental processes such as cellularization, sex determination, neurogenesis, and pattern formation. In the absence of Zld, many target genes failed to be activated, while others, particularly the patterning genes, exhibited delayed transcriptional activation, some of which also showed weak and/or sporadic expression. These effects disrupted the normal sequence of patterning-gene interactions and resulted in highly altered spatial expression patterns, demonstrating the significance of a timing mechanism in early development. In addition, we observed prevalent overlap between Zld-bound regions and genomic “hotspot” regions, which are bound by many developmental transcription factors, especially the patterning factors. This, along with the finding that the most over-represented motif in hotspots, CAGGTA, is the Zld binding site, implicates Zld in promoting hotspot formation. We propose that Zld promotes timely and robust transcriptional activation of early-gene networks so that developmental events are coordinated and cell fates are established properly in the cellular blastoderm embryo.
Published in the journal:
. PLoS Genet 7(10): e32767. doi:10.1371/journal.pgen.1002339
Category:
Research Article
doi:
https://doi.org/10.1371/journal.pgen.1002339
Summary
In past years, much attention has focused on the gene networks that regulate early developmental processes, but less attention has been paid to how multiple networks and processes are temporally coordinated. Recently the discovery of the transcriptional activator Zelda (Zld), which binds to CAGGTAG and related sequences present in the enhancers of many early-activated genes in Drosophila, hinted at a mechanism for how batteries of genes could be simultaneously activated. Here we use genome-wide binding and expression assays to identify Zld target genes in the early embryo with the goal of unraveling the gene circuitry regulated by Zld. We found that Zld binds to genes involved in early developmental processes such as cellularization, sex determination, neurogenesis, and pattern formation. In the absence of Zld, many target genes failed to be activated, while others, particularly the patterning genes, exhibited delayed transcriptional activation, some of which also showed weak and/or sporadic expression. These effects disrupted the normal sequence of patterning-gene interactions and resulted in highly altered spatial expression patterns, demonstrating the significance of a timing mechanism in early development. In addition, we observed prevalent overlap between Zld-bound regions and genomic “hotspot” regions, which are bound by many developmental transcription factors, especially the patterning factors. This, along with the finding that the most over-represented motif in hotspots, CAGGTA, is the Zld binding site, implicates Zld in promoting hotspot formation. We propose that Zld promotes timely and robust transcriptional activation of early-gene networks so that developmental events are coordinated and cell fates are established properly in the cellular blastoderm embryo.
Introduction
Early development consists of a highly choreographed series of events controlled by temporally and spatially regulated batteries of genes. Although the sequence and nature of the events may vary between organisms, features such as the maternal-to-zygotic transition (MZT) where control of development is transferred from maternal to zygotic genes, and the establishment of gene networks initiated by master regulators, are common to all zygotes, pointing to their essential roles in embryogenesis.
One of the best-studied developmental systems is the Drosophila embryo where transcription factor hierarchies act to pattern and subdivide the embryo along the anteroposterior (AP) and dorsoventral (DV) body axes. Only three hours (hrs) after fertilization at the height of the MZT, most of the ∼6000 cells in the embryo have acquired their positional information and cell fates. At this time, the embryo has also completed cellularization, whereby each nucleus of the syncytial blastoderm becomes enclosed by cell membrane [1], and the processes of sex determination and dosage compensation are underway [2]. Although much attention has focused on the gene networks that regulate these processes, less is known about how they are coordinated to occur in a temporally organized manner.
The recent discovery of the transcription factor Zld raised the possibility that a single factor could coordinately activate the early zygotic genome [3]. Expression profiling studies of early embryos lacking maternal expression of zld (henceforth referred to as zld−) revealed that 70% of the genes normally activated between 1–2 hrs of development were down-regulated, including many genes required for cellularization, sex determination, and dorsal patterning [3]. However, other early genes displayed more subtle changes in the absence of zld. For example, activation of the ventral gene sna was temporally delayed, but appeared to recover by nuclear cycle (nc) 14 [3]. Thus, Zld appeared to regulate early zygotic genes in different ways - some are completely dependent on Zld for activation, while others depend on Zld for proper timing of expression.
Zld binds in vitro to CAGGTAG and related motifs referred to as TAGteam sites [3], which were first identified as conserved sequences over-represented in the regulatory regions of pre-cellular blastoderm genes [2], [4]. Indeed, the TAGteam sites are located upstream and often close to the transcription start site (TSS) of genes down-regulated in zld− [3]. However, many genes with upstream TAGteam sites were unaffected in our profiling studies. They may not be expressed at 1–2 hrs, or they could have a maternal component masking the effect of Zld on their zygotic expression, or like sna, they may have gone undetected in the profiling analysis due to more subtle effects in zld−. Therefore, Zld may play a more extensive role in regulating early developmental genes than previously suggested.
To further investigate Zld targets, and possible mechanisms of their coordinated expression, we analyzed Zld binding across the genome in pre-cellular blastoderm embryos. These results, combined with our expression profiling studies, uncovered many new Zld targets, and demonstrated that Zld is responsible for timing the activation of genes across all three patterning systems, DV, AP and terminal. Our expression assays further showed that proper transcriptional onset is critical for the cascade of cross-regulatory interactions among patterning genes, and that changes in timing can lead to profound changes in positional information throughout the blastoderm. We found a remarkable overlap between Zld-bound regions and HOT (high occupancy transcription factor binding) regions, or hotspots, reported by the modENCODE consortium [5]. The observation that Zld can be visualized in nuclei before other known transcription factors, and that the most over-represented motif in hotspots is the Zld binding site, hints at a role for Zld in marking, establishing, or maintaining hotspots.
Results
Zld binds proximal to over 2,000 transcription start sites in 1–2 hr embryos
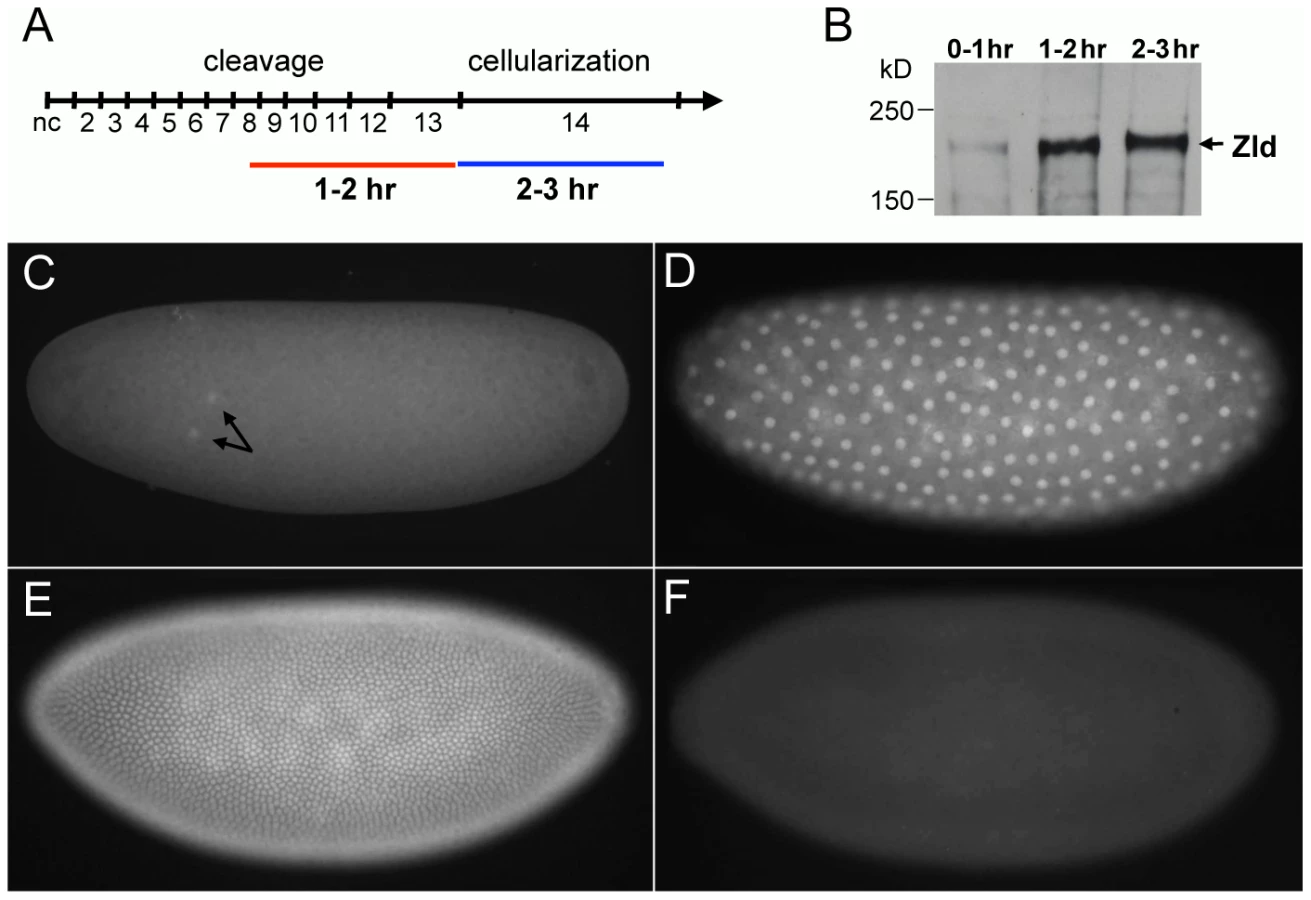
Zygotic gene activation begins with a subset of genes transcribed between 1–2 hrs after fertilization (see time line in Figure 1A) [6]. A second more dramatic wave of transcription occurs between 2–3 hrs while the embryo undergoes cellularization in nc 14 [4], [7]. To identify the genes directly bound by Zld, we performed chromatin immunoprecipitation followed by microarray analysis (ChIP-chip). We first prepared polyclonal antibodies against the C-terminal region of Zld known to bind DNA [3]. This antibody recognized a protein of ∼180 kD, the predicted size of Zld (Figure 1B), and stained whole mount wild-type embryos (Figure 1C–1E) but not zld− embryos (Figure 1F). Interestingly, Zld can be detected in nuclei as early as nc 2 (Figure 1C), in contrast to other maternal factors such as Bicoid (Bcd) and Dorsal (Dl), which do not appear in nuclei before nc 9 and 10, respectively [8]–[11]. Zld protein levels appear to increase substantially during the second hour of development (Figure 1B, 1D) [12], coincident with the activation of the zygotic genome [6].
We used the Zld antibody to immunoprecipitate chromatin from 1–2 hr embryos, and hybridized labeled DNA to high-resolution NimbleGen tiling arrays (see Materials and Methods). Our genome-wide binding data indicated that Zld behaves similarly to other transcription factors in early Drosophila embryos binding thousands of genomic regions [13], [14], but showing a stronger tendency to bind close to the TSS. Specifically, Zld binds 2626 regions (p<0.05; see Materials and Methods), and 83% of these (2180) lie within 2 kilobases (kb) of their TSS. Binding near the TSS may be a distinguishing feature of Zld, and may provide a hint regarding its function. In comparison, only 43% of the Bcd-bound regions are within 2 kb of the TSS [13].
DNA motifs associated with Zld-bound regions
We examined the enrichment and placement of TAGteam sites within Zld-bound regions (Figure 2A; see Materials and Methods). Of the five TAGteam sites defined initially by ten Bosch et al. [2], CAGGTAG was the most enriched site (9 fold enriched), followed by CAGGTAa (4.5 fold), tAGGTAG (3 fold), CAGGTAt (2 fold), and CAGGcAG (1.8 fold; Figure 2A). In addition, two derivatives (tAGGTAa and CAGGcAa), which are located upstream of the nullo gene (a likely Zld target [3]), were enriched 1.9 fold and 1.6 fold, respectively (Figure 2A). Note that the enriched sequences tend to be located in the center of the bound regions (Figure 2A), suggesting that they represent binding of Zld to TAGteam sites in vivo.

We generated a position weight matrix (PWM) using all sites in the bound regions that corresponded to the seven TAGteam sequences above (Figure 2B; see Materials and Methods). To identify additional TAGteam sites that might bind Zld, we used the PWM to scan the bound regions (p≤0.0003; see Materials and Methods). Only eight heptamers were recovered, including the seven aforementioned TAGteam sites, plus an eighth site, CAGGTAc. This site was found to be enriched 2.3 fold in the bound regions (Figure 2A). We emphasize that the PWM is derived from Zld ChIP data, and together with in vitro binding results for all eight sites (Figure 2D), these data define a Zld consensus site. In total, 1240 (47%) of the bound regions contain at least one of the eight sites. Of these, more than half (712) contain CAGGTAG or CAGGTAA, which are also highly conserved among the sequenced Drosophila genomes when located in bound regions versus non-bound regions, and also when compared to other sequences within the bound regions (Figure S1A).
To address whether Zld might bind to a secondary site, as has been found for other transcription factors [15], we searched for enriched heptamer sequences in Zld-bound regions relative to the genome (see Materials and Methods). Four types of heptamers were recovered (Figure S1B–S1D). The top-ranked enriched site recovered was CAGGTAG (Figure S1B, S1C), validating this approach. Also enriched were TATCGAT and related sequences (TAT sites; see PWM in Figure 2C). 695 (26.5%) of the bound regions contain at least one of these sites, however, these regions have on average lower binding scores than CAGGTAG-containing regions (Figure S1E). The TATCGAT site is less conserved than CAGGTAG (Figure S1A), and oligonucleotides containing a TATCGAT site do not bind Zld in vitro (Figure 2D). The remaining two enriched sequences are simple repeats, CTCTCTC and C/GTCACAC (Figure S1B–S1D), and were not further analyzed. However, we noticed that all four enriched sequence types are similar to the motifs found over-represented in hotspots [5]. To examine the relationship between Zld binding and hotspots, we first calculated the percentage of hotspots that contained a Zld-bound region. 48%–64% of hotspots were bound by Zld depending on the transcription factor complexity (8–13 factors bound), which is striking considering that hotspots were defined using the binding profiles of 41 transcription factors, some of which were from late-staged embryos [5]. We next calculated the average Zld ChIP/input ratio in hotspot windows, which were ranked according to their transcription factor complexity scores [5]. The average Zld ChIP/input ratio increased with increasing complexity of the hotspots, ranging from 4.8 in the highest complexity window to 2.7 in the lowest (Figure 2E, blue line). In contrast, the background (see Materials and Methods) was close to 1 (p<0.0001; Figure 2E, green line).
Comparison of ChIP and expression profiles reveals direct Zld targets
To evaluate the regulatory role of Zld binding, we used the genomic tiling arrays to compare expression profiles of wild-type and zld− embryos (see Materials and Methods). We reasoned that by 1) interrogating all transcripts with a greater number of probes per gene on the tiling arrays (to increase statistical power), 2) using competitive array hybridization to detect more subtle expression differences (by the ability to normalize data on the same array), and 3) extending the profiling to include a later time point (2–3 hrs) with both tiling and gene expression arrays, we would capture more Zld target genes. In addition, the tiling arrays allowed direct visual comparison between the Zld ChIP data and transcription profiles, as well as profiles from published datasets such as the hotspots [5].
Figure 3 shows browser views of the sc/sisB, zen, and sna genomic regions. RNA expression of sc/sisB and zen was greatly reduced in zld− at both time points (Figure 3, top), while sna was only slightly reduced, consistent with our previous observation that sna expression was delayed but recovered in zld− [3]. Zld-bound peaks (ChIP/input) were seen over well-defined enhancers (Figure 3, red boxes; REDfly [16]), which for sc/sisB and zen contain clusters of TAGteam sites (purple lines) known to be necessary for enhancer-driven expression [2]. At the sna locus Zld binding is associated with the primary and shadow enhancers [17], both of which are required for robust expression [17]. Note the significant overlap of Zld-bound peaks and hotspots (Figure 3 and Figure S1F).

Comparison of the tiling and gene expression array datasets indicated that the tiling arrays are more sensitive, as has been previously noted [18], yielding three times more down-regulated genes (summarized in Table S1). 77% (1–2 hrs) and 82% (2–3 hrs) of the genes in the gene-array dataset were included in the tiling dataset, and importantly, two-thirds of these genes were associated with Zld-bound regions (Table S1). Many genes that were considered unaffected in our previous analysis [3] are now observed to be down-regulated in zld−, such as the gap gene gt (see Table S2 for a comparison of the different array datasets at each time point for a subset of pre-blastoderm genes).
Comparing the two time points, many more genes (531) came to be expressed in 2–3 hr wild-type embryos, consistent with the burst in transcriptional activity known to occur at this time [4], [7]. About half of these genes (44%) were down-regulated in zld− and 19% of these were bound by Zld, indicating that Zld activates many of the newly transcribed genes, both directly and indirectly.
To further explore the relationship between the position of Zld binding relative to the TSS and effect on gene expression, for each bound region we plotted its location relative to the TSS against the fold change in expression of that gene in wild-type versus zld−. Zld-bound regions showed a tendency to be close to the TSS of genes regardless of whether they were down-regulated in zld− or not; in fact many unaffected genes were bound by Zld within 2 kb of the TSS (Figure S2A). However, we observed a correlation between the location of Zld binding and the level of wild-type expression. Genes considered expressed were more likely to be bound by Zld within 2 kb than genes considered not expressed (Figure S2B). Moreover, the higher the level of expression, the more likely Zld binds near the TSS (Figure S2B), suggesting that such binding is important for transcriptional activation by Zld (see Discussion).
Zld ensures timely and robust transcriptional activation
As a first step to gain insight into the regulatory networks established by Zld, we performed Gene Ontology (GO) analysis on the genes associated with Zld-bound regions. First, we ranked the bound regions according to binding strength from highest to lowest in ten non-overlapping windows, and then analyzed the GO terms of the genes closest to those bound regions. Several groups of early genes were enriched (Figure S3A, S3B). For example, all of the zygotic genes involved in X-chromosome counting/sex determination (sisA, sc/sisB, os/sisC, dpn, run) [2] appeared in the top 10% window (ChIP profiles shown in Figure S4; run in Figure 4), making this GO term highly enriched (Figure S3B). sc/sisB is also known to function in proneural development [19], and interestingly many genes involved in neurogenesis were enriched in highly bound regions and strongly down-regulated in zld− (Figure S4B, Table S2), defining another battery of Zld target genes. Also strongly bound were genes involved in cellularization, such as Sry-α, nullo, and slam (Figure S5, Table S2), along with cell cycle regulators such as frs that are involved in the nc 14 lengthening, which is concurrent with cellularization [20]–[25].

Many of the enriched GO terms were associated with DV, AP, and terminal patterning (Figure S3A, S3B). This was expected for the DV genes expressed in the dorsal region such as zen and dpp since they are abolished in zld− [3]. What was unexpected was strong Zld binding to genes activated by Dpp/Smads such as Ance and C15 (Figure S6), because they are downstream in the DV hierarchy and not expressed until nc 14 [26]. This suggests a feed forward loop whereby Zld directly regulates both dpp and its targets.
Also unexpected was the strong binding to the ventrally expressed DV genes, which are activated by the Dl morphogen (Figure 3 and Figure 4). sna and twi are high-level Dl targets expressed in the ventral-most region, the mesoderm, while rho, brk, and sog are lower-level targets expressed in domains of increasing width in the lateral region, the neuroectoderm [27]. However, unlike the dorsally expressed genes, these genes were not significantly affected in the 1–2 hr profiling studies (Table S2). This seeming contradiction prompted us to investigate their expression patterns by in situ hybridization, which provides higher spatial and temporal resolution. Closer inspection of twi, brk, sog, and rho revealed that their expression was delayed in zld− (Figure 4), as we noted previously for sna [3], suggesting that Zld acts in combination with Dl to ensure precise temporal activation of these genes. Like sna [3], twi expression recovered and appeared normal by nc 14 (Figure 4B), but the lateral stripes of rho, brk, and sog narrowed to about 5–6 cells wide (arrows in Figure 4D, 4F, 4H), the region of intermediate levels of Dl and where the gradient is steepest [9]–[11]. In addition, within the narrow domain, expression was weaker and/or sporadic. Further analysis quantifying the number of nuclei within the rho and sog domains that contained nascent transcripts showed on average 40% of nuclei lacked detectable signal in zld− embryos (Figure 4J, 4L, 4M). In contrast, the wild-type expression domains are more uniform with less than 10% inactive nuclei (Figure 4I, 4K, 4M). Interestingly, Zld binds to both primary and shadow enhancers of sog (Figure 4O) and brk (Figure S1F). The presence of a shadow enhancer is thought to increase the potential for reproducible and robust transcriptional activation [17].
Zld orchestrates timing within the segmentation gene network
In the GO analysis, the pair-rule gene category was associated with one of the highest enrichment scores (Figure S3A, S3B). Zld-bound peaks were distributed across several of the known “stripe elements” as well as near the TSS of the primary pair-rule genes (Figure 5I–5K and Figure S7). Since their expression levels were only mildly reduced in zld− (Table S2), we looked closely at the expression patterns. In wild-type embryos, eve, ftz, hairy, and runt were initially expressed in broad domains as early as nc 10, which refine into the respective seven-stripe patterns by the end of nc 14 (Figure 5A, 5C, 5E, 5G) [28]. In zld−, not only was activation delayed by two nuclear cycles, but the stripe patterns were dramatically altered in nc 14 (Figure 5B, 5D, 5F, 5H). Since pair-rule stripes are formed by localized gap repressors acting on stripe enhancers [29], [30], we next examined gap gene expression. In wild-type embryos, gt (Figure 6A) and tll (Figure 6G) transcripts were detected at nc 10, while kni, Kr and hb transcripts were not observed until nc 11–12 (Figure 6, data not shown for hb). This varied activation foreshadows the appearance of the gap protein gradients [31].


In zld− embryos initial transcription of all five gap genes was delayed by 1–2 nc (Figure 6, data not shown for hb). In addition, their patterns were significantly disrupted, which can be explained in part by miscued gap gene interactions. For example, in wild-type embryos, mutual repression between Gt and Kr is known to establish their complementary domains [32], [33]. The overlap of gt and Kr transcripts in the head region of early zld− mutants, which is never seen in wild-type, may be a consequence of delayed Gt repression (Figure 6B, top), but as Gt accumulates, anterior Kr expression disappears (Figure 6F, bottom). Another example involves Hb repressor function. Hb and Gt set the anterior Kr border, while Hb and Kr establish the anterior border of the posterior gt domain [32]. In zld−, the hb domain was reduced in size (Figure 6J), possibly due to lack of activation in regions of low-level Bcd, and consequently the anterior border of the Kr central domain (Figure 6F, bottom) and the gt and kni posterior domains shift anteriorly (Figure 6B, 6D, bottom). The shift in the posterior border of the Kr domain (Figure 6F, bottom) is likely due to expanded gt (Figure 6B).
Tll is a strong repressor of gap genes [34], hence the ectopic expression of kni can likewise be explained by the delay in tll expression in zld− (Figure 6H). The posterior tll domain, which expands anteriorly along the ventral surface (Figure 6H), could cause ventral repression of Kr (Figure 6F), as well as the changes observed in the posterior domains of gt, kni, hb, (Figure 6B, 6D, 6J, bottom) and the pair-rule genes (Figure 5).
In summary, although many of the observed defects in the gap and pair-rule patterns in zld− are due to delayed and mis-localized gap repressor activity, Zld binding to the gap and pair-rule enhancers (Figure 5, Figure 6, and Figure S7) points to a direct role for Zld in activating these genes.
Zld binds target genes of the key patterning factors destined to be expressed in the blastoderm embryo
The ubiquitous nature of Zld binding to patterning genes prompted us to search for overlap between Zld-bound regions and regions bound by AP [13], [14] and DV [35] transcription factors. 62% of the Bcd-bound regions, and 70% of the Dl-bound regions, which overlap extensively with Twi - and Sna-bound regions (referred to as DTS, [35]), are bound by Zld (data not shown). In contrast, only about 30% of the regions bound by Bcd are bound by DTS, and vice versa.
We next looked at the genes bound by Zld and the other factors, and whether those genes were expressed in early embryos. Zld binds to 72% of the Bcd targets, 70% of the Cad targets, and 80% of the Tll targets (Figure 7 and Figure S8). Less but considerable overlap (about 50%) was observed between Zld targets and gap gene (Hb, Gt, Kr, Kni) targets (Figure S8). We further distinguished target genes by whether they were expressed at 2–4 hrs (defined as bound by RNA polymerase II (pol II) by MacArthur et al. [14]). About half of the AP factor-bound target genes were expressed. For each factor, expressed target genes were more likely to be bound by Zld than the non-expressed targets (Figure 7A and Figure S8A). Similarly, Zld binds 59% of the DTS target genes (351 genes; Figure 7B), but this increases to 76% for the expressed targets, and decreases to 35% for non-expressed targets (Figure 7A, 7C). Thus, the AP and DV target genes that are also bound by Zld are more likely to be expressed in the blastoderm embryo, indicating that Zld binding may promote transcriptional activity.

Discussion
Our combined approach of Zld ChIP-chip profiling, expression profiling, and genetic analysis revealed a wide-ranging regulatory role for Zld, and provides new insights into how essential embryonic processes are coordinated during early development. Our results demonstrate that Zld is required for timely and robust target-gene responses. The observed increase in Zld protein levels in the second hour of development raises the possibility that a “temporal gradient” of ubiquitously distributed Zld functions together with the spatial gradients of the patterning morphogens to define spatiotemporal specificity of zygotic gene expression in the early embryo.
DNA sequences associated with Zld-bound regions are similar to motifs over-represented in hotspots
Our Zld binding analyses indicate that there are at least eight TAGteam sites. CAGGTAG and CAGGTAA were the most over-represented and the most highly conserved in the Zld-bound regions (Figure 2A and Figure S1A). About half of Zld binding is TAGteam site dependent, and all of the sex determination, cellularization, and patterning genes we studied have TAGteam sites in their enhancers and in many cases near the TSS. Curiously, within the CAGGTAG site is CAGGTA, a motif found strongly enriched in hotspots [5]. Likewise, our TATCGAT, CT-repeat, and CAC-related sites (Figure S1B–S1D) are similar to additional motifs found in hotspots: GTATCGAT, CTCTCTCTCT, and CTCACACG, respectively, which were proposed by modENCODE to be “candidate drivers” of hotspot formation [5]. TATCGAT is contained within the DRE (DNA replication related element) octamer site, TATCGATA, which is found near the TSS of genes involved in DNA replication [36]. Additionally, TATCGATA is similar to the BEAF-32 insulator site [37]. The CT-repeat site is also associated with an insulator sequence, the Trl/GAF motif [37]. It is unclear how Zld interacts with the non-TAGteam sequences since TATCGAT, for example, does not appear to bind Zld in vitro (Figure 2D). It is possible that the enrichment of these sites in Zld-bound regions is due to recruitment of Zld by components of complexes that directly interact with these sequences, or to opportunistic Zld interactions. Thus, at least for hotspots with the CAGGTA motif, which was discovered in the hotspots with highest complexity (bound by 12–14 factors) [5]), it is possible that Zld binding is involved in their establishment [5].
Zld times zygotic gene activation and promotes robust expression
The idea of an “initial step in the cascade of zygotic gene interactions that control development” was first proposed by Edgar and Schubiger [6], and the idea of a “timer” in early development that functions alongside the spatially restricted morphogens was proposed by ten Bosch et al. [2] and De Renzis et al. [4] for CAGGTAG sites. Our combined results on Zld extend both of these ideas. Zld protein accumulates to high levels by one hour of development (Figure 1B, 1D), which coincides with the onset of zygotic genome activation [6]. Within a two-hour period, the embryo cellularizes, determines X-chromosome dosage, patterns its body plan, and gets ready for gastrulation. By virtue of a single factor these processes are coordinately activated.
One can predict that increasing Zld levels in early embryos would advance timing of activation. Our initial attempts to increase Zld protein levels by adding copies of Zld rescue constructs did not yield higher Zld protein levels (data not shown), indicating that Zld levels may be tightly regulated. However, ten Bosch et al. [2] showed that doubling the number of TAGteam sites in the zen enhancer led to precocious expression, supporting the idea that Zld acts to time zygotic gene activation.
In the absence of Zld, all direct targets are either: 1) not expressed, 2) delayed but recover, or 3) delayed but do not recover fully. For example, genes involved in sex determination, cellularization, dorsal patterning, and proneural development are strongly down-regulated in zld− and never recover (Table S2; Figures S4, S5, S6). In contrast, genes involved in AP and ventral patterning were not significantly down-regulated, and how they recovered depended on how they responded to other factors. The high-level Dl targets sna and twi recovered by nc 14, but the lower-level targets sog, brk, and rho did not recover their normal patterns in zld−; instead they were expressed sporadically in a narrow domain with great variability among embryos (Figure 4). It appears that intermediate levels of Dl are no longer sufficient for robust and faithful target-gene expression, and lower levels cannot activate them at all; thus, the Dl gradient cannot be interpreted without Zld. These effects are likely due to the lack of direct Zld input, as mutation of the TAGteam sites in the sog primary enhancer caused a similar narrowing of the reporter expression domain [38]. Indirect effects of delayed twi expression may also contribute, since mutation of Twi binding sites in the rho enhancer also resulted in a narrower domain [39]. These observations suggest that Zld not only acts as a timer for Dl target-gene activation, but also potentiates Dl morphogenetic activity over a broad range in the neuroectoderm in order to establish multiple threshold responses. Along the AP axis, Zld may function in a similar way with Bcd. In zld−, the hb border shifts anteriorly (Figure 6), indicating that in regions of low-level Bcd, Zld enhances the sensitivity of target genes to morphogen concentrations. These results imply that Zld may promote transcription by acting synergistically with the patterning morphogens. It is important to note that the observed delay in expression does not necessarily mean the gene is activated later, but that without the synergy factor, there are not enough detectable transcripts at the time when assayed. Sporadic expression may reflect a similar situation.
Timing within networks
Beyond the role of Zld in timing transcriptional initiation is a more elaborate timing mechanism, exemplified by the sequential appearance of the gap genes. How does Zld achieve differential activation of target genes within a network? A simple model would suggest that the activation of Zld target genes correlates with the strength of Zld binding to their regulatory elements. We noticed that the earlier activated genes in the segmentation network had higher binding scores than those activated later. gt, tll, and all of the primary pair-rule genes, which are abundantly expressed by nc 10, had higher binding scores (Figure 5, Figure 6) than kni and Kr, which become abundant later in nc 11 and nc 12, respectively. Later-acting genes such as secondary pair-rule genes, segment polarity genes, and the homeotic genes were bound, but had lower binding scores (Figure S7 and data not shown). Such a mechanism where timing of activation is dependent on strength of binding was shown for the Pha-4 transcription factor in C. elegans pharyngeal development. Pha-4 regulates a wide array of genes expressed at different stages, and the onset of target-gene expression depends on the affinity of Pha-4 binding sites in the regulatory regions of those target genes [40], [41]. An intriguing possibility for the early Drosophila embryo is that as Zld levels rise in the first hour of development a “temporal” concentration gradient is formed such that interaction with higher affinity binding sites would occur before that with lower affinity sites, thus differentially activating target genes.
A second timing mechanism is provided by the intrinsic properties of the regulatory motifs established by Zld. Our data revealed that Zld functions in several coherent feed forward loops, for example, binding both the XSE (X-chromosome signal element) genes (such as sisA) and Sxl, dpp and its targets, and twi and rho (Figure S9). Embedded in this type of motif is a mechanism of temporal control since a delay in the activation of the third gene in the loop occurs because of its dependence on accumulation of the second gene product [42], [43]. For example, the activation of Sxl is 2–3 nc later than that of the XSE genes [2]. In addition, experiments that abolished the TAGteam sites in the SxlPe enhancer caused a 3 nc delay in reporter expression, demonstrating a direct role for these sites, and hence Zld, in timing transcriptional activation [2].
Zld also functions in an incoherent feed forward loop whereby one branch of the loop has the opposite sign [43]. Zld promotes transcription of both the pair-rule and gap genes, while gap proteins repress pair-rule genes (Figure S9). The primary pair-rule gene transcripts are easily detectable by nc 10 (Figure 5), even before some of the gap genes, giving a new perspective on the canonical segmentation gene hierarchy in which the pair-rule genes are downstream of the gaps. Early strong activation of the pair-rule genes may be essential to guarantee transcriptional activation before repressor gradients overwhelm the AP axis.
Zld increases expressivity of target genes
We can extract clues from our results about how Zld may function on a mechanistic level. First, Zld appears in zygotic nuclei very early (Figure 1C), before Bcd and Dl, possibly binding to target genes first. Second, loss of Zld results in delayed transcriptional activation and, in many cases, weak and/or sporadic expression (Figure 4, Figure 5, Figure 6). Third, Zld binding is frequently found at early enhancers (both primary and shadow), as well as close to the TSS of genes, hinting at a role in recruitment of the transcriptional machinery. Fourth, Zld binding coincides with hotspots (Figure 3 and Figure S1), which were found to correlate with regions of nucleosome depletion [5]. Together these observations suggest that Zld increases the transcriptional activity, or expressivity, of target genes. Mechanistically, Zld binding could facilitate either the access of other factors (both activators and repressors) to DNA or the interaction of these factors with the transcriptional machinery, an idea put forth by Bradley et al. [44] after observing a correlation between the evolutionary turnover of the CAGGTAG site along with the patterning factor binding sites.
An alternative mechanism to ensure robust and coordinated early embryonic expression is pol II pausing (reviewed in [45]). Many Zld target genes such as sog were shown to exhibit polymerase pausing [46]. The delayed and sporadic expression in zld− could be explained by lack of paused pol II.
It is evident from our results that Zld coordinates the onset of transcriptional activity of the early gene networks during the MZT (Figure S9). Considering that Zld is also expressed at later times in development [47], we predict that Zld will act similarly to increase expressivity of genes in networks that function, for example, in central nervous system development in mid-stage embryos and imaginal disc patterning in larval development. In these processes, similar to the MZT, a simple strategy may be used to collectively activate and temporally control batteries of genes required for establishing the proper gene circuitry.
Materials and Methods
Fly strains
The yw strain was used to obtain wild-type embryos, and the zld294 allele was used to obtain zld− germline clones as previously described [3].
Antibody production and Western blotting
Rabbit polyclonal antibodies against Zld were generated using the C-terminal part of Zld (amino acids 1240–1470) [3], containing a cluster of four zinc fingers fused to GST. For chromatin immunoprecipitation experiments, the antibodies were purified from the serum bleeds by antigen affinity chromatography [48] against purified recombinant-Zld protein coupled to an affinity column. For Western blotting, 50 appropriately staged Drosophila embryos were homogenized in SDS Laemmli loading buffer and briefly centrifuged. The protein concentration of the supernatant was determined (Bradford), and equal amounts of protein were loaded in each lane of a 6% SDS-PAGE gel (40 µg per lane). The blotting and transfer were performed according to standard procedures [48].
In situ hybridization and antibody staining
Embryos were fixed and hybridized as previously described [3] using digoxygenin-UTP (Roche Biochemicals) labeled RNA probes synthesized from subcloned cDNA sequences or genomic intronic DNA sequences (for sog and rho). Antibody staining was performed by incubating fixed embryos with rat anti-Zld antibodies (1∶200 dilution) followed by incubation with AlexaFluor 488 donkey anti-rat IgG (1∶500 dilution) secondary antibodies (Invitrogen). Embryos were visualized by fluorescence microscopy using an FX-A Nikon microscope and by Nomarski optics using a Zeiss Axiophot microscope. Flourescent in situ hybridization (FISH) was performed as previously described [17] using intronic probes for sog and rho, sheep anti-DIG antibodies (Roche Biochemicals), and AlexaFluor 555 donkey anti-sheep IgG secondary antibodies (Invitrogen). Images were acquired as previously described [17] using a Leica TCS SP5 confocal microscope (40× oil immersion objective) with 1024×1024 resolution and approximately 250 nm/pixel. More than 15 Z-sections from nc 14 embryos were taken at 0.5 µm intervals to capture as many nascent transcripts in nuclei as possible.
Confocal image processing
The Z-sections containing pixel intensities higher than the median intensity of all pixels were selected for analysis. For each position in the X–Y plane, the pixel with the strongest intensity across all Z-sections was defined as the intensity value for that X–Y position. All of the Z-sections from the DAPI channel were processed by Helicon Focus (HelicoSoft) to generate clear images of nuclei, which were identified by customized Matlab scripts. Every FISH signal was assigned to the closest nucleus, only when the distance between a FISH signal and the center of a nucleus was smaller than 1.5× the radius of the nucleus. The assigned nuclei were considered as with expression and pseudo-colored.
DNA binding assays
Electrophoretic mobility shift assays (EMSA, or gel shift assays) were performed as previously described [3]. The following oligonucleotide sequences were derived from genomic DNA sequences. Each is 21 nucleotides in length and contains a TAGteam or TATCGAT site plus surrounding sequences: zen1: CACTATTTAGGTAGACACTGT, zen2: TGGGTTTCAGGTAGGTGAATA, zen3: ATAAACACAGGCAGCTGGTGC, eve3: ACAATTGCAGGTAAGTAGAGC, nullo-1: AAAGGATCAGGTACCCGGGGT, nullo-2: GTCGGAGCAGGCAACGGGCAT, sema1: TCGTCGGTAGGTAAAAGTTGT, tat: CCAGCCGCAGGTATTTAGTTC, zen1m: CACTATTTGAATAGACACTGT, tatcgat: TCACTACTATCGATGACGATG (TAGteam or TATCGAT sites are underlined).
Tiled genomic microarray design
A Drosophila melanogaster tiled genomic microarray set was designed by J.R.M. in concert with the bioinformatics team at Roche NimbleGen using Genome Release 5. This array set, which comprises two HD2 (2.1 million feature) microarrays, utilizes 50-mer oligonucleotide probes with up to 100 close matches per sequence tolerated, and a median probe spacing of 33 bp. For our design, we chose to tolerate a large number of close matches in order to include on the array more heterochromatin and repeat regions, including transposon sequences. The Design Names of the arrays are as follows: 081229_Dm_JM_ChIP_1_HX1 and 081229_Dm_JM_ChIP_2_HX1.
Transcriptome analyses using gene arrays
Total RNA was extracted from three independent collections of 2–3 hr yw and zld− Drosophila embryos by TRIzol (Invitrogen). cDNA was prepared using the GeneChip HT One-Cycle cDNA Synthesis Kit (Manufactured by Invitrogen for Affymetrix) and labeled with the BioArray™ HighYield™ RNA Transcript Labeling Kit (Enzo). Labeled probes were hybridized to Drosophila Genome 2 Affymetrix arrays and processed by a GeneChip Fluidics Station 400. Data were acquired by the GeneChip Scanner 3000 and processed/normalized by the Affymetrix GeneChip Operating Software (GCOS). Genes were identified as present when at least two of the three replicates had present (P) assignment (p<0.05). t-test analysis was performed on the data from the three biological replicates. The fold change of each gene was determined by the ratio of yw mean/zld− mean.
Transcriptome analyses using tiling arrays
Double-stranded cDNA was generated from total RNA isolated (TRIzol, Invitrogen) from staged (1–2 hrs and 2–3 hrs at 25°C, verified by DAPI staining of a portion of the collected embryos) wild-type and zld− embryos, then amplified/labeled using either Cy3 - or Cy5-coupled random nonomers, respectively. 15 ug of each labeled cDNA were used for competitive hybridization, coupling the same staged wild-type and zld− samples in order to facilitate direct comparison (see Roche NimbleGen Gene Expression Protocol [http://www.nimblegen.com/products/lit/expression_userguide_v5p0.pdf] for specific labeling and processing details). After hybridization for 16–20 hrs, the arrays were washed, dried and then scanned on an Axon GenePix 4000B microarray scanner from Molecular Devices.
Intensity readings of probes were corrected according to their GC content using a set of random probes on the arrays, and normalized by the Lowess normalization method [49]. After normalization, a median filter was applied (using a sliding window of three probes with the center probe given the median value). The expression level of each exon was calculated by taking the median of all the probes covering the exon, and the expression level of each RNA isoform was calculated by averaging the expression levels of all the exons of the isoform without weighting. Using the “fdrtool package” in R [50], we set the background threshold as 5% FDR, which was previously shown to be an appropriate cutoff for tiling array data [51]. Genes were considered as expressed (present) if more than 50% of the probe signals were higher than the threshold, otherwise they were considered as not expressed (absent). Using this approach, we concluded that 49.5% of the genome was represented as RNA in 1–2 hr embryos, which is similar to findings from other studies [4], [52], [53]. Since, in most cases, each gene was represented by multiple probes, and thus was interrogated multiple times in one experiment, we applied the t-test to obtain p-values for each gene in the yw and zld−. samples. The fold change of each transcript was determined as the ratio of yw/zld−.
ChIP–chip
1–2 hr yw embryos were fixed in 2% formaldehyde for 20 min. Nuclei were harvested and sonicated to release and shear genomic DNA. The chromatin was immunoprecipitated by purified anti-Zld antibody and protein A beads. The chromatin immunoprecipitated (ChIPed) DNA samples were amplified by GenomePlex WGA1 (Sigma) followed by GenomePlex WGA3 (Sigma) twice.
ChIPed DNA was labeled/amplified with Cy3-coupled random nonomers and the corresponding input DNA was labeled with Cy5-coupled random nonomers; 34 µg of each labeled DNA was combined and co-hybridized to the Drosophila tiling array set (as described above) according to the Roche NimbleGen ChIP-chip Protocol (http://www.nimblegen.com/products/lit/chip_userguide_v6p1.pdf). After hybridization for 16–20 hrs, the arrays were washed, dried and then scanned on an Axon GenePix 4000B microarray scanner from Molecular Devices. For each dataset, the ratio of ChIP to input intensities was obtained, log2 transformed, and standardized to z scores. The datasets of the dye swap replicates were averaged to eliminate dye bias. ChIP enrichment scores were calculated using the R package “Ringo” [54] as the sum of probe levels minus the threshold with settings of 0.05 p-value and 10 minimum probes. A higher score indicates a higher ChIP/input ratio in the region. Data was visualized using the Integrated Genome Browser [55], and a median filter was applied to the ChIP/input ratio for the visualization. Validation was performed by qPCR to assess the enrichment of the enhancer region of sc/sisB, a known target of Zld, and the coding region of CG18125, a negative control, in ChIPed versus input DNA. The sc/sisB region showed 23.53 fold enrichment over CG18125 (data not shown).
Enrichment test for Zld binding site
The enrichment index for a specific DNA motif was calculated as the density of the motif in Zld-bound regions divided by the density of that motif in the Drosophila genome. Enrichment indices of sites were calculated in 100 bp non-overlapping windows across the 5 kb flanking regions from the center of Zld-bound regions. The background was estimated as the average of enrichment indices of 20 random heptamers.
TAGteam site PWM for Zld recognition
We took seven CAGGTAG related heptamers, including five that were previously identified by ten Bosch et al. [2]: CAGGTAG, TAGGTAG, CAGGTAA, CAGGCAG and CAGGTAT, and 2 newly discovered related heptamers from the Zld-bound region upstream of nullo: CAGGCAA and CAGGTAC, and then weighted every heptamer according to their enrichment indices to generate a primary PWM using the “Biostrings” package [56] and visualized by the “seqLogo” package [57] in R. The enrichment analysis with this PWM defined sequences with a p-value larger than 0.0005 as not enriched in Zld-bound regions. We then generated a new PWM by using the enriched sequences (p≤0.0005) with their surrounding nucleotides. We repeated the enrichment test using this new PWM (Figure 2B) and eight TAGteam motifs (p≤0.0003).
Searching for novel enriched sites in Zld-bound regions
Enrichment indices of all possible heptamers were calculated for Zld-bound regions using a 500 bp window centered around the middle of Zld-bound peaks. Using an enrichment score of 3.5 as the cutoff, 11 heptamers were recovered (Figure S1B). The highest-ranking heptamer was CAGGTAG. Heptamers could be separated into two groups with different core sequences, CAGGTA and TATCGA (heptamers containing simple repeats were not further analyzed). The CAGGTA group was reminiscent of TAGteam sites. All of the Zld-bound regions that contain at least one of the new enriched sites that have the TATCGA core were analyzed by MEME4.4.0 [58] and a PWM was generated.
Searching for genes associated with Zld-bound regions
The distance from the center of every Zld-bound region to every annotated TSS was calculated (according to Drosophila melanogaster genome release 5.29). The closest TSS (for both strands) was assigned to each Zld-bound region. Thus each bound region typically has two assigned genes.
Determination of overlap between Zld-bound regions and hotspots
Hotspot data was obtained from Roy et al. [5]. Only the regions bound by eight or more transcription factors were analyzed in this study. Hotspots were ranked by their complexity scores [5]. In the 100 non-overlapping hotspot windows, Zld binding was calculated as the average of ChIP/input ratios of all probes located in the hotspot regions. To estimate the background of Zld binding in hotspots, the ChIP/input ratio for all probes on the tiling arrays were randomly shuffled 20 times, and the average of the ChIP/input ratio from the shuffled probes corresponding to a hotspot was calculated.
Determination of binding overlap between sets of transcription factors
Target gene lists for AP factors (Bcd, Cad, Hb, Gt, Kr, Kni and Tll) were obtained from MacArthur et al. [14]. The target-gene list for Dl, Twi, and Sna (DTS) was obtained from Zeitlinger, et al. [35]. We limited the search to target genes that lie within 2 kb of the factor-bound regions. We identified the target genes bound by both Zld and each AP factor, Zld and DTS, and Zld and Mad, and distinguished whether or not they were expressed at 2–4 hrs (defined as bound by pol II, [14]). Pair-wise heat maps were generated to represent the overlapping percentages between factors.
GO term enrichment analysis
GO term analysis was performed using the Database for Annotation, Visualization and Integrated Discovery (DAVID) v6.7 [59], [60; http://david.abcc.ncifcrf.gov/] on the genes associated with Zld-bound regions. We limited this analysis to genes that are downstream of a Zld-bound region, except in cases where there was no downstream gene then we used the upstream gene.
Supporting Information
Zdroje
1. LecuitTWieschausE 2000 Polarized insertion of new membrane from a cytoplasmic reservoir during cleavage of the Drosophila embryo. J Cell Biol 150 849 860
2. ten BoschJRBenavidesJAClineTW 2006 The TAGteam DNA motif controls the timing of Drosophila pre-blastoderm transcription. Development 133 1967 1977
3. LiangHLNienCYLiuHYMetzsteinMMKirovN 2008 The zinc-finger protein Zelda is a key activator of the early zygotic genome in Drosophila. Nature 456 400 403
4. De RenzisSDElementoOTavazoieSWieschausEF 2007 Unmasking activation of the zygotic genome using chromosomal deletions in the Drosophila embryo. PLoS Biol 5 e117 doi:10.1371/journal.pbio.0050117
5. RoySErnstJKharchenkoPVKheradpourPNegreN 2010 Identification of functional elements and regulatory circuits by Drosophila modENCODE. Science 330 1787 1797
6. EdgarBASchubigerG 1986 Parameters controlling transcriptional activation during early Drosophila development. Cell 44 871 877
7. AndersonKVLengyelJA 1979 Rates of synthesis of major classes of RNA in Drosophila embryos. Dev Biol 70 217 231
8. GregorTWieschausEFMcGregorAPBialekWTankDW 2007 Stability and nuclear dynamics of the Bicoid morphogen gradient. Cell 130 141 152
9. RushlowCAHanKManleyJLLevineM 1989 The graded distribution of the dorsal morphogen is initiated by selective nuclear transport in Drosophila. Cell 59 1165 1177
10. LibermanLMReevesGTStathopoulosA 2009 Quantitative imaging of the Dorsal nuclear gradient reveals limitations to threshold-dependent patterning in Drosophila. Proc Natl Acad Sci U S A 106 22317 22322
11. KanodiaJSRikhyRKimYLundVKDeLottoR 2009 Dynamics of the Dorsal morphogen gradient. Proc Natl Acad Sci U S A 106 21707 21712
12. HarrisonMMBotchanMRClineTW 2010 Grainyhead and Zelda compete for binding to the promoters of the earliest-expressed Drosophila genes. Dev Biol 345 248 255
13. LiXYMacArthurSBourgonRNixDPollardDA 2008 Transcription factors bind thousands of active and inactive regions in the Drosophila blastoderm. PLoS Biol 6 e27 doi:10.1371/journal.pbio.0060027
14. MacArthurSLiXYLiJBrownJBChuHCZengL 2009 Developmental roles of 21 Drosophila transcription factors are determined by quantitative differences in binding to an overlapping set of thousands of genomic regions. Genome Biol 10 R80
15. BadisGBergerMFPhilippakisAATalukderSGehrkeAR 2009 Diversity and complexity in DNA recognition by transcription factors. Science 324 1720 1723
16. GalloSMLiLHuZHalfonMS 2006 REDfly: A regulatory element database for Drosophila. Bioinformatics 22 381 383
17. PerryMWBoettigerANBothmaJPLevineM 2010 Shadow enhancers foster robustness of Drosophila gastrulation. Curr Biol 20 1562 1567
18. BiemarFNixDAPielJPetersonBRonshaugenM 2006 Comprehensive identification of Drosophila dorsal-ventral patterning genes using a whole-genome tiling array. Proc Natl Acad Sci U S A 103 12763 12768
19. WrischnikLATimmerJRMegnaLAClineTW 2003 Recruitment of the proneural gene scute to the Drosophila sex-determination pathway. Genetics 165 2007 2027
20. RoseLSWieschausE 1992 The Drosophila cellularization gene nullo produces a blastoderm-specific transcript whose levels respond to the nucleocytoplasmic ratio. Genes Dev 6 1255 1268
21. PostnerMAWieschausEF 1994 The nullo protein is a component of the actin-myosin network that mediates cellularization in Drosophila melanogaster embryos. J Cell Sci 107 1863 1873
22. SchweisguthFLepesantJAVincentA 1990 The serendipity alpha gene encodes a membrane-associated protein required for the cellularization of the Drosophila embryo. Genes Dev 4 922 931
23. LecuitTSamantaRWieschausE 2002 slam encodes a developmental regulator of polarized membrane growth during cleavage of the Drosophila embryo. Dev Cell 2 425 436
24. SteinJABroihierHTMooreLALehmannR 2002 Slow as molasses is required for polarized membrane growth and germ cell migration in Drosophila. Development 129 3925 3934
25. GrosshansJMüllerHAWieschausE 2003 Control of cleavage cycles in Drosophila embryos by frühstart. Dev Cell 5 285 294
26. AsheHLMannervikMLevineM 2000 Dpp signaling thresholds in the dorsal ectoderm of the Drosophila embryo. Development 127 3305 3312
27. StathopoulosALevineM 2005 Genomic regulatory networks and animal development. Dev Cell 9 449 462
28. PritchardDKSchubigerG 1996 Activation of transcription in Drosophila embryos is a gradual process mediated by the nucleocytoplasmic ratio. Genes Dev 10 1131 1142
29. StanojevicDSmallSLevineM 1991 Regulation of a segmentation stripe by overlapping activators and repressors in the Drosophila embryo. Science 254 1385 1387
30. YuDSmallS 2008 Precise registration of gene expression boundaries by a repressive morphogen in Drosophila. Curr Biol 18 868 876
31. PisarevAPoustelnikovaESamsonovaMReinitzJ 2009 FlyEx, the quantitative atlas on segmentation gene expression at cellular resolution. Nucleic Acids Res 37 D560 D566
32. KrautRLevineM 1991 Mutually repressive interactions between the gap genes giant and Krüppel define middle body regions of the Drosophila embryo. Development 111 611 621
33. WuXVakaniRSmallS 1998 Two distinct mechanisms for differential positioning of gene expression borders involving the Drosophila gap protein giant. Development 125 3765 3774
34. MoranEJimenezG 2006 The tailless nuclear receptor acts as a dedicated repressor in the early Drosophila embryo. Mol Cell Biol 26 3446 3454
35. ZeitlingerJZinzenRPStarkAKellisMZhangH 2007 Whole-genome ChIP-chip analysis of Dorsal, Twist, and Snail suggests integration of diverse patterning processes in the Drosophila embryo. Genes Dev 21 385 390
36. HiroseFYamaguchiMHandaHInomataYMatsukageA 1993 Novel 8-base pair sequence (Drosophila DNA replication-related element) and specific binding factor involved in the expression of Drosophila genes for DNA polymerase alpha and proliferating cell nuclear antigen. J Biol Chem 268 2092 2099
37. BryneJCValenETangMHMarstrandTWintherO 2008 JASPAR, the open access database of transcription factor-binding profiles: new content and tools in the 2008 update. Nucleic Acids Res 36 D102 106
38. LibermanLMStathopoulosA 2009 Design flexibility in cis-regulatory control of gene expression: synthetic and comparative evidence. Dev Biol 327 578 589
39. IpYTParkREKosmanDBierELevineM 1992 The Dorsal gradient morphogen regulates stripes of rhomboid expression in the presumptive neuroectoderm of the Drosophila embryo. Genes Dev 6 1728 1739
40. GaudetJMangoSE 2002 Regulation of organogenesis by the Caenorhabditis elegans FoxA protein PHA-4. Science 295 821 5
41. GaudetJMuttumuSHornerMMangoSE 2004 Whole genome analysis of temporal gene expression during foregut development. PLoS Biol 2 e352 doi:10.1371/journal.pbio.0020352
42. Shen-OrrSSMiloRManganSAlonU 2002 Network motifs in the transcriptional regulation network of Escherichia coli. Nat Genet 31 64 68
43. ManganSAlonU 2003 Structure and function of the feed-forward loop network motif. Proc Natl Acad Sci U S A 100 11980 11985
44. BradleyRKLiXYTrapnellCDavidsonSPachterL 2010 Binding site turnover produces pervasive quantitative changes in transcription factor binding between closely related Drosophila species. PLoS Biol 8 e1000343 doi:10.1371/journal.pbio.1000343
45. LevineM 2011 Paused RNA Polymerase II as a developmental checkpoint. Cell 145 502 11
46. ZeitlingerJStarkAKellisMHongJWNechaevS 2007 RNA polymerase stalling at developmental control genes in the Drosophila melanogaster embryo. Nat Genet 39 1512 1516
47. StaudtNFellertSChungHRJäckleHVorbrüggenG 2006 Mutations of the Drosophila zinc finger-encoding gene vielfältig impair mitotic cell divisions and cause improper chromosome segregation. Mol Biol Cell 17 2356 2365
48. HarlowELaneD 1999 Using antibodies: A laboratory manual Cold Spring Harbor Laboratory Press, CSH, NY
49. YangYHDudoitSLuuPLinDMPengV 2002 Normalization for cDNA microarray data: a robust composite method addressing single and multiple slide systematic variation. Nucleic Acids Res 30 e15
50. StrimmerK 2008 fdrtool: a versatile R package for estimating local and tail area-based false discovery rates. Bioinformatics 24 1461 1462
51. ManakJRDikeSSementchenkoVKapranovPBiemarF 2006 Biological function of unannotated transcription during the early development of Drosophila melanogaster. Nat Genet 38 1151 1158
52. TadrosWGoldmanALBabakTMenziesFVardyL 2007 SMAUG is a major regulator of maternal mRNA destabilization in Drosophila and its translation is activated by the PAN GU kinase. Dev Cell 12 143 155
53. ThomsenSAndersSJangaSCHuberWAlonsoCR 2010 Genome-wide analysis of mRNA decay patterns during early Drosophila development. Genome Biology 11 R93
54. ToedlingJSkylarOKruegerTFischerJJSperlingS 2007 Ringo–an R/Bioconductor package for analyzing ChIP-chip readouts. Bioinformatics 8 221 224
55. NicolJWHeltGABlanchardSGRajaALoraineAE 2009 The Integrated Genome Browser: free software for distribution and exploration of genome-scale datasets. Bioinformatics 25 2730 2731
56. PagesHAboyounPGentlemanRDebRoyS 2009 String objects representing biological sequences, and matching algorithms. R package version 2.18.2
57. BembomOKelesSvan der LaanMJ 2007 Supervised detection of conserved motifs in DNA sequences with cosmo. Stat Appl Genet Mol Biol 6 Article8
58. BaileyTLElkanC 1994 Fitting a mixture model by expectation maximization to discover motifs in biopolymers. Proc Int Conf Intell Syst Mol Biol 2 28 36
59. DennisGShermanBTHosackDAYangJGaoW 2003 DAVID: Database for annotation, visualization, and integrated discovery. Genome Biol 4 P3
60. HuangDWShermanBTLempickiRA 2009 Systematic and integrative analysis of large gene lists using DAVID Bioinformatics Resources. Nature Protoc 4 44 57
61. FoeVEAlbertsBM 1983 Studies of nuclear and cytoplasmic behaviour during the five mitotic cycles that precede gastrulation in Drosophila embryogenesis. J Cell Sci 61 31 70
62. SiepelABejeranoGPedersenJSHinrichsASHouM 2005 Evolutionarily conserved elements in vertebrate, insect, worm, and yeast genomes. Genome Res 15 1034 1050
63. EstesPAKeyesLNSchedlP 1995 Multiple response elements in the Sex-lethal early promoter ensure its female-specific expression pattern. Mol Cell Biol 15 904 917
64. KuroiwaAKloterUBaumgartnerPGehringWJ 1985 Cloning of the homeotic Sex combs reduced gene in Drosophila and in situ localization of its transcripts. EMBO J 4 3757 3764
Štítky
Genetika Reprodukční medicínaČlánek vyšel v časopise
PLOS Genetics
2011 Číslo 10
- Kazuistika – Perspektivy využití precizované medicíny v rámci personalizované specifické terapie onkologických pacientů
- Nobelova cena za chemii pro genetické nůžky: Objev, který změní naši budoucnost?
- Technologie na bázi RNA v klinické praxi: od přebarvených petúnií k terapii vzácných a dosud jen obtížně léčitelných chorob u lidí
- „Nepředstavovali jsme si, že náš výzkum povede přímo ke vzniku nových léků, dokonce ještě za našeho života“
- Bezplatné služby pro diagnostiku ATTRv amyloidózy pro kardiology
Nejčtenější v tomto čísle
- The Glycobiome Reveals Mechanisms of Pentose and Hexose Co-Utilization in Bacteria
- Global Mapping of Cell Type–Specific Open Chromatin by FAIRE-seq Reveals the Regulatory Role of the NFI Family in Adipocyte Differentiation
- Genetic Determinants of Serum Testosterone Concentrations in Men
- MicroRNA Expression and Regulation in Human, Chimpanzee, and Macaque Brains
Zvyšte si kvalifikaci online z pohodlí domova
Mazová zátka a její řešení
nový kurzVšechny kurzy