
SHP2 Regulates Chondrocyte Terminal Differentiation, Growth Plate Architecture and Skeletal Cell Fates
Patients with the inherited disorder, metachondromatosis (MC), develop multiple benign cartilage tumors during childhood. MC patients carry heterozygous loss-of-function mutations in the PTPN11 gene, and their cartilage tumors likely arise when the second PTPN11 allele is lost due to a somatic mutation. PTPN11 encodes a phosphatase called SHP2 that is involved in a variety of signaling pathways. Here, we use mouse models and cell culture assays to investigate the mechanisms by which loss of SHP2 promotes cartilage tumor formation. We show that cartilage tumors that form inside bones (enchondromas) likely arise due to disorganized growth and delayed terminal differentiation of growth plate chondrocytes, while cartilage tumors that form on the bone surface (exostoses) can arise due to ectopic chondrogenesis of fibroblast-like cells that surround bones. We also suggest that paracrine signals from SHP2-deficient cells cause neighboring SHP2-sufficient cells to contribute to exostoses and enchondromas. Finally, we provide in vitro data that the ERK1/2 pathway is regulated by SHP2 and promotes chondrocyte terminal differentiation. Together, our data provide insight into the mechanisms underlying cartilage tumor formation and implicate SHP2 as a key regulator of chondrocyte specification, organization and maturation.
Published in the journal:
. PLoS Genet 10(5): e32767. doi:10.1371/journal.pgen.1004364
Category:
Research Article
doi:
https://doi.org/10.1371/journal.pgen.1004364
Summary
Patients with the inherited disorder, metachondromatosis (MC), develop multiple benign cartilage tumors during childhood. MC patients carry heterozygous loss-of-function mutations in the PTPN11 gene, and their cartilage tumors likely arise when the second PTPN11 allele is lost due to a somatic mutation. PTPN11 encodes a phosphatase called SHP2 that is involved in a variety of signaling pathways. Here, we use mouse models and cell culture assays to investigate the mechanisms by which loss of SHP2 promotes cartilage tumor formation. We show that cartilage tumors that form inside bones (enchondromas) likely arise due to disorganized growth and delayed terminal differentiation of growth plate chondrocytes, while cartilage tumors that form on the bone surface (exostoses) can arise due to ectopic chondrogenesis of fibroblast-like cells that surround bones. We also suggest that paracrine signals from SHP2-deficient cells cause neighboring SHP2-sufficient cells to contribute to exostoses and enchondromas. Finally, we provide in vitro data that the ERK1/2 pathway is regulated by SHP2 and promotes chondrocyte terminal differentiation. Together, our data provide insight into the mechanisms underlying cartilage tumor formation and implicate SHP2 as a key regulator of chondrocyte specification, organization and maturation.
Introduction
Enchondromas in bone cavities and exostoses on bone surfaces are the two most common types of benign cartilage tumors [1]. Both tumors occur in patients with the autosomal dominant heritable disorder metachondromatosis (MC) [2]. Families with MC segregate heterozygous loss-of-function mutations in PTPN11, and their cartilage tumors are thought to arise from cells that have second-hit somatic PTPN11 mutations [2],[3]. PTPN11 encodes the tyrosine phosphatase, SHP2, which has cell type-dependent and context-dependent roles in many signaling pathways [4]. MC is unique in that it is associated with both enchondromas and exostoses. Other genetic conditions cause enchondromas or exostoses, but not both. Patients with Ollier disease and Maffucci syndrome, due to somatic gain-of-function mutations in IDH1 or IDH2, develop enchondromas [5]–[7]. Patients with heterozygous loss-of-function mutations in EXT1 or EXT2 segregate multiple hereditary exostoses (MHE) [8]. The mechanism by which cartilage tumors arise in patients with MC is incompletely understood. Also unknown is whether tumor formation in patients with MC results from perturbation of the same biologic pathway(s) that are affected in patients with Ollier disease, Maffucci syndrome, and MHE.
Mice have been used to model tumor formation caused by SHP2 deficiency. Unlike humans, cartilage tumors have not been observed in mice that are heterozygous for Ptpn11 loss-of-function mutations, and complete absence of Ptpn11 in mice causes embryonic lethality [9]. However, cartilage tumors can be induced by a conditional biallelic inactivation of Ptpn11 [10]–[12], which mimics somatic second-hit PTPN11 mutations that likely give rise to cartilage tumors in human MC patients. Mosaic inactivation of Ptpn11 in chondrocytes and/or perichondrial cells produces enchondromas in the vertebrae and ribs, and exostoses in the limbs [11]–[13]. These data suggest that exostoses arise from Ptpn11-null perichondrial cells that inappropriately differentiate into chondrocytes [11],[12], and that enchondromas arise from Ptpn11-null growth plate chondrocytes that fail to be replaced by bone [12]. Thus, SHP2 appears to participate in the specification, proliferation, and maturation of chondrocytes.
One downstream signaling pathway likely altered in SHP2-deficient chondrocytes is the ERK1/2 pathway. Exostoses in Ptpn11-mutant mice have reduced levels of phospho-ERK1/2 [11],[12]. While in vivo studies have not directly demonstrated that inactivation of the ERK1/2 pathway is sufficient to produce cartilage tumors, studies have shown that inactivation of Erk1 and Erk2 in mesenchymal cells leads to ectopic cartilage clusters in the perichondrium of mouse embryos [14]. Therefore, it is possible that these ectopic clusters could develop into exostoses had the mice survived into adulthood. Furthermore, inactivation of Erk1 and Erk2 in chondrocytes disrupts the growth plate's columnar-organization, causes chondrocytes to hypertrophy prematurely, and delays the replacement of cartilage with bone [14],[15]. Thus, reduced ERK1/2 signaling following SHP2 depletion may mediate some of the phenotypic features in patients with MC.
Because the molecular consequences of SHP2 depletion or ERK1/2 inactivation in chondrocytes are incompletely understood, we investigated the transcriptional response to either SHP2 depletion or MEK1/2 inhibition in chondrocyte pellet cultures by performing massively parallel mRNA sequencing (RNA-seq). We also conditionally inactivated Ptpn11 in vivo and examined the effects of SHP2 depletion on chondrocyte maturation and specification, and we examined chondrocyte maturation in exostosis lesions from MC patients. Herein, we report that SHP2 and the ERK1/2 pathway have overlapping effects on gene expression during chondrocyte maturation in pellet culture. We suggest a mechanism by which enchondromas arise in MC patients that involves disrupted growth plate architecture and delayed terminal differentiation, and show that exostoses can arise following inappropriate chondrogenic differentiation of fibroblasts. We also propose that cartilage lesions contain a mixture of SHP2-deficient and normal cells. Lastly, the RNA-seq method and transcriptome database we developed should be useful to other scientists who are interested in growth plate biology and chondrocyte maturation.
Results
RNA-Seq Analysis Of Pellet Cultures Identifies Both Previously Known And Novel Transcriptional Changes That Occur As Chondrocytes Mature From The Proliferative Through To The Late-Hypertrophic Stage
To establish a system in which the molecular consequences of SHP2 depletion in chondrocytes could be studied, we utilized mouse primary chondrocyte pellet cultures [16],[17]. In the growth plate, chondrocytes proceed through distinct zones of maturation before their cartilage is degraded and replaced by bone (Figure 1A). The proliferative zone (PZ) contains small, rapidly dividing chondrocytes that form columns, while the hypertrophic zone (HZ) contains chondrocytes that have exited the cell cycle and dramatically increased in size (Figure 1A) [18]. In chondrocyte pellet cultures, the transition from the proliferative to hypertrophic state can be modeled (Figure 1B). We evaluated the process of chondrocyte maturation at the transcriptional level by performing RNA-seq on pellet cultures.

To verify that RNA-seq is a reproducible method for measuring transcript abundance in chondrocytes undergoing maturation in pellet cultures, we first performed RNA-seq on wild-type chondrocytes after 4 days, or 1, 2 or 3 weeks in culture. We sequenced 3 libraries per time point, and obtained, on average, 13 million 50-bp paired-end reads per library, of which >95% could be mapped to the mouse genome (Table S1). To determine the relative abundance of transcripts at each time point, we counted the number of reads mapping to each transcript, and normalized this based on the length of the transcript and the number of reads per library, to obtain an RPKM value [19] (Dataset S1). We found that the abundance of transcripts was similar across libraries from the same time-point (R2>0.99) (Figure S1), and that the most abundant transcripts corresponded to genes known to be highly expressed in chondrocytes (e.g., Col2a1, Col9a1, Sparc) [20]. Furthermore, while transcripts associated with intermediate stages of chondrocyte maturation (pre-hypertrophic and early-hypertrophic) did not consistently change in abundance over time, many transcripts known to be associated with proliferative chondrocytes decreased in abundance and transcripts associated with late-hypertrophic chondrocytes increased in abundance (Figure 1C; Table S2). This indicates that as pellet cultures mature, the proportion of proliferative chondrocytes decreases, while the proportion of terminally-differentiated chondrocytes increases. Thus, our data suggest that RNA-seq is a reliable method for detecting changes in transcript abundance that occur as chondrocytes mature from the proliferative through to the late-hypertrophic stage.
To further define transcriptional changes associated with chondrocyte maturation, we sought to identify a reproducible set of transcripts that change in abundance over time. First, we selected all transcripts that significantly increased or decreased in abundance over time in our wild-type pellet cultures. Only transcripts with an RPKM >3 that showed at least a 1.6-fold change and a p value <0.05 were selected. Second, to reduce false positives, we incorporated data from 2 additional independent RNA-seq data sets. These were from pellets that were used as vehicle controls in our experiments described in further detail below. We justified incorporating data from vehicle-treated pellets by showing that vehicle-treatment alone did not affect known chondrocyte maturation transcripts (Figure S2) and that the correlation coefficient between untreated and vehicle-treated libraries at the same time point was high (R2 > 0.98) (Figure S1). We found that 81% of all transcripts that increased or decreased in abundance over time in untreated pellets also increased or decreased in abundance by at least 1.3 fold in both sets of vehicle-treated pellets. By focusing only on the transcripts that reached statistical significance and exhibited at least a 1.6-fold change in all three experiments, we identified a high-confidence set of 176 transcripts that consistently decreased in abundance over time (“upper zones” transcript set) and a set of 479 transcripts that consistently increased in abundance (“lower zones” transcript set) (Figure 1D, Dataset S1). Known markers of proliferative or hypertrophic chondrocytes were identified in these transcript sets, respectively, thus validating our approach (Figure 1D). Conversely, many of the transcripts in these data sets have not yet been studied in the growth plate and likely represent novel factors involved in chondrocyte maturation.
Shp2 Depletion Increases The Abundance Of Transcripts Associated With Early Maturation Stages, And Decreases The Abundance Of Transcripts Associated With Terminal Differentiation
We performed RNA-seq on pellets carrying a conditional Ptpn11 allele and a tamoxifen-dependent Cre recombinase, that were treated daily with 4-hydroxytamoxifen (4-OHT), to inactivate Ptpn11 (Ptpn11 cKO), or with vehicle control (0.1% v/v EtOH). One week of 4-OHT treatment (w1) induced recombination in >90% of chondrocytes (Figure S3) and reduced SHP2 levels (Figure 2A). Two weeks of 4-OHT treatment, followed by an additional week in culture (w3), almost completely depleted SHP2 (Figure 2A). Since it was not yet known whether long-term 4-OHT treatment itself would affect gene expression, we also performed RNA-seq on similarly treated wild-type pellets (Figure 2B). Of all transcripts that changed in abundance in Ptpn11 cKO pellets, 18 (5%) at w1 and 59 (15%) at w3 also changed in wild-type pellets treated with 4-OHT. We therefore excluded these 77 transcripts from subsequent analyses (Figure 2B, Figure S4). There was significant (p<0.001) overlap between transcripts whose abundance changed in Ptpn11 cKO pellets at w1 and w3 (Figure S5). However, there were also differences between the w1 and w3 data sets. For example, transcripts encoding protein translation components were decreased in w1 but not w3 in Ptpn11 cKO pellets (Figure S6). Thus, during chondrocyte maturation the transcriptional response to short term versus sustained SHP2 depletion is similar but not identical.
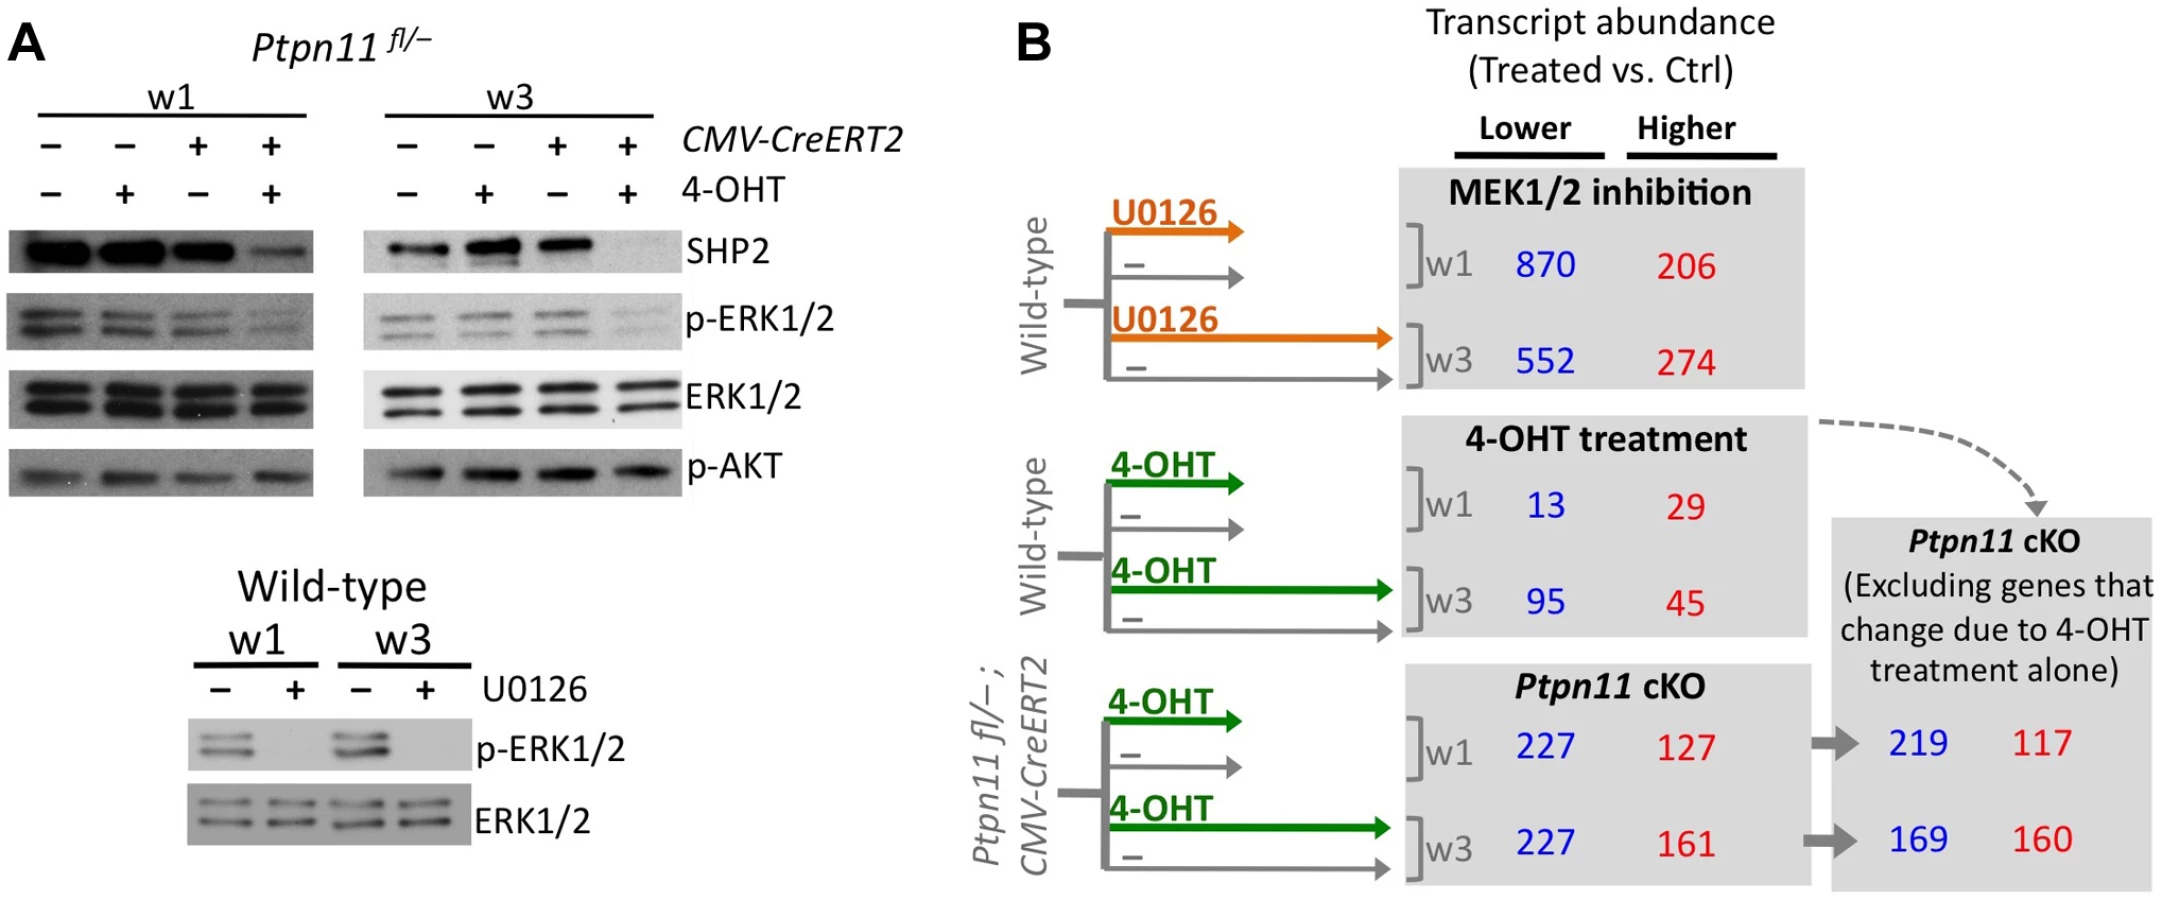
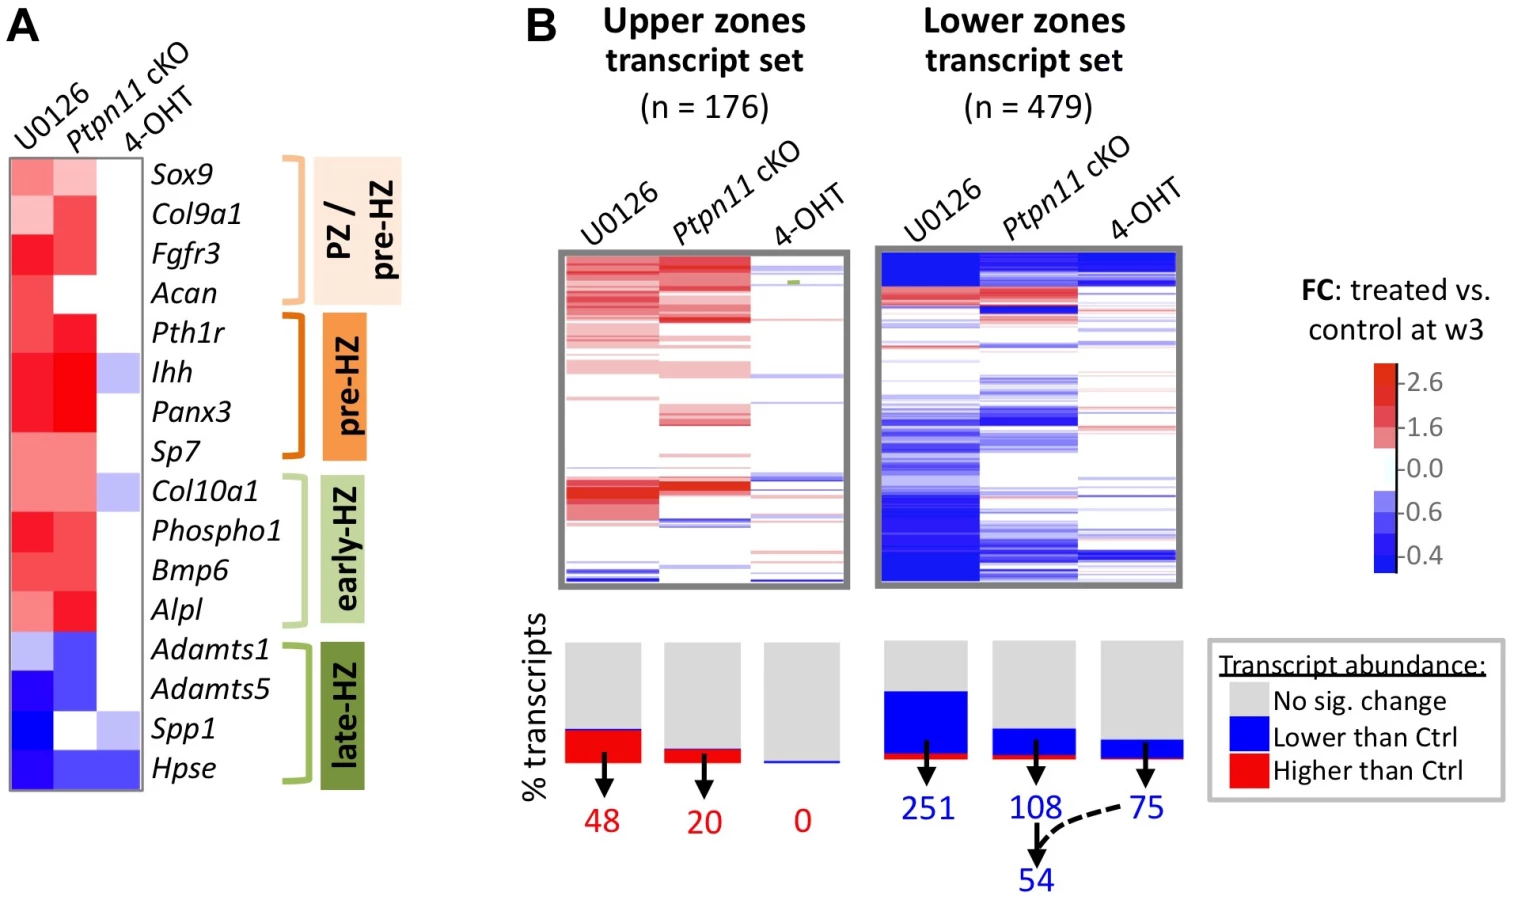
To assess the effect of SHP2 depletion on chondrocyte maturation, we compared transcript abundance in Ptpn11 cKO pellets to that of vehicle pellets at w3. Transcripts expressed by proliferative through early-hypertrophic chondrocytes were increased and transcripts expressed by late stage hypertrophic chondrocytes were decreased in Ptpn11 cKO pellets (Table S3; Figure 3A). The greatest change in transcript abundance following SHP2 depletion was in the pre-hypertrophic chondrocyte expressed transcript Ihh (6-fold increase). However, not all well-characterized stage-specific transcripts were altered by SHP2 depletion. Therefore, we took a non-biased approach by examining the effect of SHP2 depletion on the “upper zones” and “lower zones” transcript sets we had previously defined in wild-type pellet cultures (Figure 1D). Compared to control pellets at w3, Ptpn11 cKO pellets had 44% of the “upper zones” transcripts increase in abundance by > 1.3 fold, and 34% of the “lower zones” transcripts decrease in abundance by > 1.3 fold. When considering Ptpn11 cKO transcripts whose change in abundance satisfied our significance criteria (1.6-fold change, p<0.05) 20 “upper zones” transcripts were increased and 54 “lower zones” transcripts were decreased (Figure 3B; Dataset S1; Figure S7). These data are consistent with SHP2 depletion delaying terminal differentiation while maintaining chondrocytes in the proliferative, pre-hypertrophic, or early-hypertrophic stage.
Mek1/2 Inhibition Perturbs Chondrocyte Maturation In A Similar Manner To Shp2 Depletion
SHP2 has been proposed to positively regulate the ERK1/2 pathway in chondrocytes [11],[12]. Indeed, we observed reduced phospho-ERK1/2 levels after SHP2 depletion in pellet cultures (Figure 2A). To determine whether this reduction in ERK1/2 pathway activity mediates the transcriptional changes that occur following SHP2 depletion, we performed RNA-seq on pellets cultured for 1 or 3 weeks in the presence of either a vehicle control (0.1% v/v DMSO) or a MEK1/2 inhibitor (U0126) (Figure 2A, B). When considering the transcripts that changed in abundance after SHP2 depletion (excluding transcripts that changed after 4-OHT treatment alone), we found that 177 (53%) and 116 (35%) had similar changes after U0126-treatment at w1 and w3, respectively (Figure 2B, Figure S8). The observed overlap is significantly greater than expected by chance alone (p<0.001). As with SHP2 depletion, we found that U0126-treatment increased the abundance of transcripts associated with the PZ, pre-HZ and early-HZ, with the most substantial changes involving the pre-HZ transcripts, Ihh and Panx3 (> 3-fold increase) (Table S3; Figure 3A,B). Furthermore, we found that U0126-treatment decreased the abundance of late-HZ transcripts associated with matrix degradation, apoptosis, angiogenesis and osteoclastogenesis (Figure 3A,B; Figure S7). In particular, a gene ontology analysis revealed that transcripts with reduced abundance in U0126-treated pellets were significantly enriched for proteins involved in matrix degradation and remodeling (Figure S6). We used quantitative reverse transcription PCR (qRT-PCR) to confirm that 3 weeks of U0126-treatment increased the abundance of pre-HZ and early-HZ markers (Ihh, Phospho1) and decreased the abundance of a late-HZ marker (Spp1) (Figure S9). Altogether, these data indicate there is substantial overlap between the genes regulated by SHP2 and MEK1/2 in chondrocytes, and that MEK1/2 inhibition and SHP2 depletion have similar effects on chondrocyte maturation.
RNA-Seq Identifies Transcription Factors With Known Roles In Chondrocyte Maturation, And Suggests Novel Transcription Factors That May Be Involved In This Process
To identify the transcription factors that may mediate the perturbation of chondrocyte maturation observed in U0126-treated and SHP2-depleted pellets, we selected the 57 transcription factors that had increased or decreased abundance in U0126-treated or SHP2-depleted pellets at w3, and were unaffected in wild-type pellets treated with 4-OHT (Figure S10). We identified several transcription factors that may be responsible for maintaining the expression of genes associated with the pre-hypertrophic and early-hypertrophic stages, and for repressing the expression of genes associated with the late-hypertrophic stage, in U1026-treated or SHP2-depleted pellets. In particular, we observed increased expression of transcription factors known to promote hypertrophy and/or inhibit terminal differentiation (Mef2c, Tcf7, Dlx5, Msx2, Hey1, Sox9), and decreased expression of transcription factors known to inhibit hypertrophy and/or promote terminal differentiation (Foxp1, Rbpj) (Figure 4A, Table S4). In addition, we identified several transcription factors whose known target genes were also affected by MEK1/2 inhibition or SHP2 depletion, such as Egr1 and its target genes Spp1 and Hpse, which all decreased in abundance following MEK1/2 inhibition (Figure 4B, Table S5). We selected 3 transcription factors for qRT-PCR validation (Hmga2, Fols1, Egr1) and verified that they were less abundant following U0126-treatment (Figure S9). Thus, we have identified multiple transcription factors with known roles in the growth plate that may act downstream of SHP2 and ERK1/2 during the maturation and terminal differentiation of chondrocytes. This suggests that other transcription factors identified by RNA-seq (Figure S10) also have roles in chondrocyte maturation or terminal differentiation.

Mosaic Inactivation Of Ptpn11 In Vivo Alters Chondrocyte Maturation, Disrupts The Normal Organization Of Growth Plates, And Leads To Enchondroma-Like Lesions That Contain Mixtures Of Ptpn11 Mutant And Non-Mutant Chondrocytes
Since SHP2 depletion perturbed chondrocyte maturation in pellet cultures, we inactivated Ptpn11 in vivo and determined the effect on chondrocyte maturation. It has recently been reported that postnatal inactivation of Ptpn11 in chondrocytes alters the thickness and organization of vertebral growth plates [13], but it was not shown on a molecular level whether the process of chondrocyte maturation was altered. We used a tamoxifen-inducible chondrocyte Cre driver (Col2a1-CreER) to inactivate Ptpn11 postnatally. Mice were treated with tamoxifen for 5 days, starting at week 1, and analyzed at weeks 3, 7 and 10. A clear expansion of the vertebral growth plates, osteophyte-like lateral cartilaginous outgrowths, enchondroma-like cartilage islands below the growth plate, and an increase in chondrocyte cell size were observed by weeks 7 and 10 (Figure 5A-C). The severity of the phenotype was variable between mice (Figure S11). The enchondroma-like lesions likely arose from chondrocytes displaced from the growth plate due to ectopic ossification in upper regions of the growth plate (Figure 5B). By week 10, some growth plates had been completely resorbed while other growth plates remained expanded (Figure S11). Analysis of the mTmG reporter allele indicated that 5 days of tamoxifen treatment had induced recombination in ∼50% of chondrocytes (Figure 5D). Importantly, not all chondrocytes in the cartilage outgrowths and enchondroma-like lesions had evidence of Cre-mediated recombination, suggesting that the lesions contained mixtures of Ptpn11 mutant and non-mutant chondrocytes (Figure 5E-G). Thus, our histological and lineage tracing results indicate that mosaic inactivation of Ptpn11 in growth plates affects mutant and wild-type chondrocytes; the latter most likely due to altered paracrine signaling.

To determine whether mosaic Ptpn11 inactivation alters the normal organization of chondrocytes into distinct maturation zones we performed immunohistochemistry (IHC) for type 10 collagen (COLX), which is produced by early-hypertrophic chondrocytes [18]. As expected, in control mice, COLX was localized to the matrix surrounding only the lowest ∼3 cells in each chondrocyte column (Figure 6A). In contrast, the distribution of COLX was altered in Ptpn11 cKO mice. Their growth plates had regions in which the height of the COLX-positive zone was expanded to >10 cells (Figure 6B). Furthermore, the organization of the COLX-positive cells was altered, with ectopic COLX-positive clusters in upper growth plate zones, ectopic COLX-negative clusters in lower growth plate zones, and COLX-positive chondrocytes in the lateral outgrowths that were arranged into columns oriented perpendicular to the main axis of the growth plate (Figure 6B). Both COLX-positive and COLX-negative chondrocytes were detected in the enchondroma-like lesions (Figure 6C). These data indicate that the organization of chondrocytes into distinct growth plate zones is disrupted, and that the lateral outgrowths and enchondroma-like lesions contain both mature and immature chondrocytes.

To further characterize the process of chondrocyte maturation, we examined the distribution of phospho-ERK1/2, which is normally detected in the hypertrophic zone [21], and FRA1, a transcription factor encoded by Fosl1, which decreased in abundance following SHP2 depletion in pellet cultures (Figure 4B). FRA1 and p-ERK1/2 were detected in hypertrophic chondrocytes in control mice (Figure 6A), but were distributed in a scattered, disorganized fashion in the hypertrophic zone of Ptpn11 cKO mice (Figure 6B). In addition, we observed minimal staining for the terminal differentiation marker osteopontin (SPP1) (Figure 6D,E) [18], suggesting that the hypertrophic zone was expanded due to an increase in the number of chondrocytes that had not yet reached the late-hypertrophic stage. We did not detect significant differences in osteoclast recruitment or vascular invasion (Figure S12). In summary, the normal distribution pattern of stage-specific matrix components and signaling pathway components is altered in Ptpn11 cKO growth plates, and the observed delay in the terminal differentiation of hypertrophic chondrocytes is consistent with our pellet culture data. Together, our data suggest that enchondromas arise from clusters of chondrocytes that are displaced from the growth plate due to delayed terminal differentiation and disrupted growth plate architecture.
Disorganized Chondrocyte Maturation Zones Are Also Observed In Excised Human Mc Exostoses
We next determined whether chondrocyte maturation and organization is altered in cartilage lesions from MC patients who carry mutations in PTPN11. We observed a variable and disorganized distribution of COLX in MC exostoses. In particular, some lesions had intense and expanded regions of COLX immunoreactivity (Figure 7A-B), while other regions had isolated disorganized clusters of COLX immunoreactivity (Figure 7C). We compared this to MHE exostoses, which have cartilage caps that display relatively normal growth plate architecture [1]. We found that MHE exostoses have a narrow zone of COLX immunoreactivity at the base of the cartilage cap, as previously reported [22],[23] (Figure 7D). Thus, in contrast to MHE exostoses, lesions from MC patients display disorganized chondrocyte maturation zones.

Inactivation Of Ptpn11 In Fibroblasts Induces Exostosis-Like Outgrowths And Ectopic Cartilage On Bone Surfaces
Inactivation of Ptpn11 in perichondrial progenitor cells within the Groove of Ranvier induces ectopic chondrogenesis and leads to the formation of exostosis-like outgrowths [11]. To determine whether SHP2 also regulates the cell fate of other mesenchymal cell populations, we utilized Fsp1-Cre [24]–[27] to inactivate Ptpn11 in fibroblasts (Fsp1-cKO). At 3 weeks of age, Fsp1-cKO mice had no overt skeletal defects (Figure S13). At 20 weeks of age, exostosis-like outgrowths were observed on the metacarpals and phalanges of the hands of all Fsp1-cKO mice examined (n = 6) (Figure 8A), and the fibula, tibia, femur and/or calcaneus of some Fsp1-cKO mice (Figure 8B,C). Histological analysis revealed that ectopic cartilage was found at bone-ligament attachment sites at the ends of the metacarpals and phalanges (Figure 8D-H), on the cortical surfaces of femoral and tibial bone (Figure S14A), in the interosseous membrane between the radius and ulna (Figure S13B), and adjacent to ligament-attachment sites on the articular surface of the tibia (figure S14B,C). We found that Fsp1-Cre drives recombination in fibroblasts at bone-ligament attachment sites (Figure 8G, Figure S14C). Lineage tracing in Fsp1-cKO mice indicated that the ectopic cartilaginous growths contained mixtures of recombined and un-recombined chondrocytes (Figure 8H), raising the possibility that SHP2-deficient cells can signal to neighboring wild-type cells and induce them to inappropriately undergo chondrogenesis. In summary, we have identified a novel cell population that can undergo chondrogenesis following loss of SHP2.

Discussion
Here, we investigate the mechanisms by which loss of SHP2 drives enchondroma and exostosis formation. Firstly, by analyzing the transcriptome of chondrocytes undergoing maturation in vitro, we show that loss of SHP2 or inhibition of the ERK1/2 pathway delays chondrocyte terminal differentiation (Figure 9A). Secondly, we show that enchondromas in mosaic SHP2-deficient mice arise from chondrocytes displaced from the growth plate due to delayed terminal differentiation and disrupted growth plate architecture (Figure 9B). Thirdly, we create a novel mouse model of exostosis formation, by inactivating Ptpn11 in Fsp1-Cre-expressing fibroblasts (Figure 9C). Finally, we show that mouse enchondromas and exostoses can contain mixtures of wild-type and SHP2-deficient chondrocytes. Together, our results suggest that reduced ERK1/2 signaling, altered cell fate decisions, impaired chondrocyte terminal differentiation, disorganized growth, and altered paracrine signaling contribute to the pathophysiology of MC.

To investigate the mechanisms by which mosaic loss of SHP2 causes chondrocytes to be displaced from the growth plate and give rise to enchondromas, we studied the role of SHP2 in chondrocyte maturation and growth plate organization. By applying massively parallel RNA-seq technology to comprehensively evaluate the transcriptome of chondrocytes undergoing maturation in pellet cultures, we show that SHP2-depletion increases the abundance of transcripts associated with pre-hypertrophic and early-hypertrophic chondrocytes and decreases the abundance of transcripts associated with late-hypertrophic chondrocytes (Figure 3). This suggests that loss of SHP2 delays the terminal differentiation of chondrocytes from the early-hypertrophic to the late-hypertrophic stage. We provide further support for this hypothesis in vivo by showing that loss of SHP2 in mouse vertebral growth plates leads to an expanded domain of hypertrophic chondrocytes that have not yet terminally differentiated (Figure 6), and that lesions from human MC patients have expanded hypertrophic zones (Figure 7). In addition, analysis of mosaic SHP2-deficient growth plates indicates that loss of SHP2 disrupts the normal organization of chondrocyte maturation zones (Figure 6). As a consequence of this lack of organization, ectopic ossification occurs in upper regions of the growth plate (Figure 5), causing disorganized clusters of proliferative and hypertrophic chondrocytes to be displaced below the growth plate (Figure 6). Thus, our results suggest that both delayed chondrocyte terminal differentiation and disrupted growth plate organization contribute to the formation of enchondromas in mosaic SHP2-deficient mice.
In contrast to the expanded hypertrophic domain and disorganized maturation zones we observed in mosaic SHP2-deficient mice, other enchondromatosis mouse models (carrying Gli2 or mutant PTHR1 transgenes) have well organized growth plates with narrow hypertrophic zones [28],[29]. This suggests that more than one mechanism for enchondroma formation may exist. It will be of interest to determine whether mutations in IDH1 or IDH2, which cause Ollier disease and Maffucci syndrome, affect chondrocyte organization and terminal differentiation in a similar manner to SHP2 depletion [7]. Furthermore, it has been proposed that enchondromas may arise due to inappropriate chondrogenesis of mesenchymal stem cells in the marrow cavity [30]; future experiments will be needed to determine whether this could be an alternate mechanism by which SHP2-deficiency induces enchondroma formation.
To investigate which cell types can give rise to exostoses, we inactivated Ptpn11 using Fsp1-Cre, which has been shown to be expressed in fibroblasts in multiple tissue types [24]–[27]. Intriguingly, this led to ectopic cartilage formation at multiple sites along the surface of bones and at bone-ligament attachment sites (Figure 8). Prior studies have shown that loss of SHP2 in perichondrial progenitor cells induces ectopic chondrogenesis [11],[12], and that mesenchymal stem cells lacking SHP2 can undergo chondrogenesis but cannot form mature osteoblasts [31]. Together, these data suggest that SHP2 normally acts to negatively regulate the chondrogenic cell fate in multiple mesenchymal cell populations. Further research will be needed to determine whether Fsp1-Cre expressing cells on the bone surface are mature fibroblasts that trans-differentiate into chondrocytes following loss of SHP2, or are multipotent progenitor cells that proceed down the chondrogenic lineage following loss of SHP2.
We propose that exostoses in patients with MC develop via a fundamentally different mechanism than the exostoses in patients with MHE (Figure 9D). The growth of an MC exostosis is disordered (Figure 7). In contrast, MHE lesions have well defined cartilage caps and well organized, but aberrantly directed, growth plates [1]. Therefore, EXT1 and EXT2 mutations likely predispose to misdirected growth by disorienting otherwise normally functioning chondrocytes, while SHP2 mutations cause misdirected and disorganized growth by creating dysfunctional chondrocytes that signal abnormally. These differences in growth mechanism are consistent with the observation that MHE lesions do not regress but stop growing at puberty when growth plates normally close [1]. Exostoses in MC patients have been reported to regress or disappear over time [1], consistent with our observation that terminal differentiation is delayed rather than completely blocked. Therefore, when SHP2 mutant chondrocytes finally terminally differentiate they will no longer drive abnormal growth. In this regard, it will be interesting to determine whether restoration of SHP2 function will induce terminal differentiation of mutant chondrocytes and hasten regression of these lesions.
Our lineage tracing analyses suggest that SHP2-deficient and SHP2-sufficient chondrocytes can be incorporated into exostoses and enchondromas in mice (Figure 5; Figure 8). The lack of sensitive and specific anti-SHP2 antibodies for immunohistochemistry coupled with the difficulty of detecting Ptpn11 mRNA in decalcified mouse bone precludes our conclusively showing the presence of both cell types in lesions. However, the notion that cartilage tumors can arise from a mixture of mutant and non-mutant cells is supported by the observation that enchondromas in patients with IDH1 mutations contain both wild-type and IDH1-mutant chondrocytes [7], and that exostoses in Ext1-deficient mice contain both Ext1-null and wild-type chondrocytes [32]. These data suggest that altered paracrine signaling from SHP2-deficient chondrocytes can affect the specification, organization and terminal differentiation of neighboring wild-type chondrocytes.
Our data, and those of other investigators, suggest that aberrant IHH signaling contributes to cartilage tumor formation. IHH is a potent secreted regulator of chondrocyte proliferation and differentiation [33]. We observed significantly increased Ihh transcript abundance in SHP2-depleted and MEK1/2-inhibited pellet cultures (Figure 3). Similarly, it has previously been reported that knockdown of SHP2 in a chondrogenic cell line increases Ihh expression, and exostoses induced by SHP2 depletion have higher levels of Ihh expression than normal growth plates [11]. Also, an inhibitor of IHH signaling reduced the growth of cartilage tumors in mosaic SHP2 mutant mice [11]. However, we cannot preclude additional paracrine factors also contributing to tumor formation since transcripts for other secreted growth regulators (SOST, BMP7, BMP8A, WNT5B, WNT10B, and FGF21) exhibited increased abundance in SHP2-depleted pellet cultures. However, because increased transcript abundance does not always lead to increased protein abundance, these factors would need to be confirmed at the protein level in vivo. In summary, the pathogenic mechanism(s) that produce cartilage tumors in patients with MC may be complex.
In pellet cultures SHP2 depletion reduced ERK1/2 phosphorylation (Figure 2) and inhibition of ERK1/2 signaling delayed chondrocyte terminal differentiation (Figure 3). A role for ERK1/2 signaling in chondrocyte terminal differentiation is supported by prior studies showing that loss of ERK1/2 signaling in vivo leads to an expanded domain of hypertrophic chondrocytes [14],[15],[21]. Furthermore, loss of ERK1/2 signaling can also disrupt the organization of growth plate chondrocytes and can promote ectopic chondrogenesis in the perichondrium [14]. Together, these data suggest that the delayed chondrocyte terminal differentiation, disrupted growth plate organization, and ectopic cartilage formation in SHP2-deficient mice may all be a result of reduced ERK1/2 signaling. It would be of interest to determine whether restoring ERK1/2 signaling, such as via a constitutively active MEK1 transgene, could prevent cartilage tumor formation in SHP2-deficient mice.
We do not know which receptor tyrosine kinases act upstream of SHP2 and the ERK1/2 pathway during chondrocyte terminal differentiation; however, EGFR1, FGFR1 and FGFR3 are likely candidates since loss of any one of these receptors in mice leads to an expansion of the hypertrophic zone [34]–[37] and loss of FGFR3 leads to enchondroma-like lesions in the long bones [36]. Furthermore, transcripts encoding several transcription factors had altered abundance after SHP2 depletion or MEK1/2 inhibition (Figure 4). Under normal circumstances, these transcription factors likely regulate terminal differentiation in response to SHP2 and ERK1/2 signaling. Of particular interest are HEY1, MSX2, DLX5 and SOX9, which have all been shown to delay the removal of hypertrophic chondrocytes in vivo (Figure 4) [38]–[41]. Since these four transcription factors are induced by BMP signaling [42]–[44], and the BMP pathway has been shown to inhibit terminal differentiation [45], it is possible that increased BMP signaling contributes to the delay in terminal differentiation following MEK1/2 inhibition or SHP2 depletion.
The RNA-seq datasets we identified in chondrocyte pellet cultures should be useful to other investigators interested in endochondral growth and the ex vivo modeling of this process. By analyzing the transcriptional changes during the maturation of wild-type chondrocytes in pellet cultures, we confirmed previously reported changes in gene expression and we identified new transcripts that likely distinguish proliferative from late-hypertrophic chondrocytes (Figure 1). However, since it is possible that some of these transcripts may be artifacts of long culture periods, future in vivo validation will be required to confirm their association with chondrocyte maturation. For investigators that use 4-OHT to induce Cre-mediated recombination of floxed alleles, our dataset of transcripts whose abundance changed following 4-OHT administration will also be helpful. In conclusion, by coupling ex vivo RNA-seq with in vivo conditional mouse models, we have added to our understanding of how cartilage tumors arise in patients with MC, as well as the pathways that are regulated by SHP2 during chondrocyte maturation.
Methods
Mouse Husbandry
The Boston Children's Hospital Institutional Animal Care and Use Committee approved these studies. The Rosa26mTmG reporter allele [46], the Tg(Col2a1-CreER) driver [47], and the Tg(Fsp1-Cre) driver [24] were purchased from The Jackson Laboratory. The Ptpn11 floxed (Ptpn11fl/fl) and Tg(CMV-CreERT2) mice have been previously described [48],[49]. The Ptpn11 null allele was generated by germ line deletion of the Ptpn11 floxed allele following crossing to actin-Cre mice. For mosaic postnatal inactivation of Ptpn11 in chondrocytes, 1-week-old Tg(Col2a1-CreER);Rosa26mTmG/+;Ptpn11fl/fl mice were given daily intra-peritoneal injections of 50 mg/kg tamoxifen (Sigma) suspended in corn oil for 5 days. Tg(Col2a1-CreER);Rosa26mTmG/+;Ptpn11fl/+ and Rosa26mTmG/+;Ptpn11fl/fl mice that were similarly treated with tamoxifen served as controls.
Chondrocyte Pellet Culture
Chondrocytes were harvested from the rib cages of newborn mouse pups as previously described [50]. Pups were either wild-type (mixed 129/FVB background) or, for SHP2 depletion experiments, Tg(CMV-CreERT2);Ptpn11fl/– on a mixed 129/FVB background. Chondrocytes from 4 to 7 pups from the same litter and with the same genotype were pooled, which provided sufficient cells for all the experimental and control pellets of an individual experiment. Chondrocytes were re-suspended in DMEM/F12 with L-Glutamine (Invitrogen), supplemented with ascorbic acid (50 µg/ml), 1% Penicillin-Streptomycin solution (Life Technologies) and 10% Fetal Bovine Serum (Omega Scientific). Five × 105 cells were aliquoted into 0.5 mL eppendorf tubes, centrifuged at 500 g for 5 min, and then cultured in 400 µL of medium at 37°C and 5% CO2. Medium was changed every 1 to 2 days. Stock solutions of 10 mM U0126 (Sigma) dissolved in DMSO, and 1 mM 4-OHT (Sigma) dissolved in 100% EtOH were aliquoted and stored at −20°C. For MEK1/2 inhibition experiments, starting at day 2 of culture, pellets were switched to medium containing 10 µM U0126 or 0.1% DMSO (vehicle control), which was changed daily, and pellets were harvested after 1 or 3 weeks. For SHP2 depletion or 4-OHT-treatment experiments, starting at day 1 pellets were placed in medium containing 1 µM 4-OHT or 0.1% EtOH (vehicle control), and either harvested after 1 week, or treated for an additional week, switched to untreated medium for 1 week, and then harvested (after 3 weeks total in culture).
Rna Sequencing Library Construction And Data Analysis
Two pellet cultures were pooled prior to performing RNA extraction with the RNeasy mini kit (Qiagen) following the manufacturer's recommendation. RNA extracts, which contained 200 to 1,000 ng RNA were used to prepare one barcoded cDNA library, using the TruSeq RNA Library Preparation Kit (Illumina). Three different barcoded cDNA libraries were made for each genotype, treatment group, and time point. Eight to 12 separate libraries were pooled and used to obtain 50-basepair paired-end reads per single lane of an Illumina HiSeq. Reads were aligned to the mouse genome (mm9) using Tophat [51]. The number of reads mapping to the exons of each gene were calculated using the GenomicFeatures R package [52]. A trimmed mean method (excluding the 0.5% most and least abundant transcripts) was used to calculate the Pearson's Correlation Coefficient between libraries [53]. Tests for differential gene expression were performed with edgeR [54] and p values were adjusted for multiple hypothesis testing. For identification of differentially expressed gene sets, only genes with an RPKM > 3, a fold change of at least 1.6, and an adjusted p value <0.05 were included. A Chi-squared test was performed to determine whether the overlap between differentially expressed transcripts at w1 and w3, and in Ptpn11 cKO pellets and U1026 treated pellets, was significant.
Histology, Fluorescence Microscopy, And Immunohistochemistry
Chondrocyte pellet cultures were fixed in 4% paraformaldehyde (PFA) for 1 hour at room temperature. Mouse vertebrae and long bones were fixed in 4% PFA overnight at 4°C and then decalcified for 14 days in 0.5 M EDTA pH 8 (Apex BioResearch Products). All specimens were then either frozen in OCT embedding media (Tissue Tek) and stored at −80°C, or were stored in 70% EtOH at 4°C and then dehydrated in graded ethanol, cleared in xylene, and embedded in paraffin following standard methods. Paraffin-embedded exostoses were obtained from individuals with MC who were previously described (Patients A-IV-8, A-IV-5 and B-IV-7 in Bowen et al (2011)). For histological analysis, 6 µm paraffin sections were stained with 0.1% Alcian Blue in 0.1 M HCl for 30 minutes and then counterstained with Nuclear Fast Red (Sigma) for 15 minutes. For TRAP staining, sections were incubated at 37°C for 30 min in 200 ml of 50 mM Sodium Tartrate 0.1 M sodium acetate buffer pH 5, containing 30 mg Fast Red Violet LB Salt (Sigma), and 48 mg Naphtol AS-MX phosphate (Sigma) that had been dissolved in 2 ml Formamide. For fluorescence microscopy, frozen sections were mounted in DAPI-Fluoromount (SouthernBiotech). Immunohistochemistry was performed on 6 µm paraffin sections using the Vectastain Elite ABC kit (Vector Labs) following the manufacturer's instructions and using the hybridization buffers, secondary antibodies and visualization reagents provided in the kit. To unmask antigens, tissue sections were first incubated in Citrate Buffer (10 mM citric acid, 0.05% Tween 20, pH 6.0) for 20 min at 90°C. To detect the extracellular proteins Type 10 collagen (COLX), Indian Hedgehog (IHH) and Secreted phosphoprotein 1 (SPP1), sections were also treated with 1 mg/ml Hyaluronidase (Sigma) for 1 hr at 37°C and Pepsin Solution (Diagnostic Biosystems) for 15 min at 37°C. The following antibodies and dilutions were used: mouse anti-COLX (X53; Quartett) at 1∶100, rabbit anti-FRA1 (D80B4; Cell Signaling) at 1∶400; rabbit anti-IHH (N-term; Abgent) at 1∶100; rabbit anti-SPP1 (from the laboratory of Dr. Dick Heinegard, Lund University) at 1∶3,000; rabbit anti-ERK1/2 (137F5; Cell Signaling) at 1∶400; rabbit anti-CD31 (ab28364; Abcam) at 1∶40; and rabbit anti-phospho-SMAD1/5/8 (Cell Signaling Technology) at 1∶400. Primary antibodies were incubated with the tissue sections overnight at 4°C.
Quantitative Reverse-Transcriptase Pcr (qrt-Pcr)
Total RNA (500 ng) extracted from the pellet cultures was used to synthesize cDNA with the QuantiTect Reverse Transcription Kit (Qiagen) in a 20 µl reaction volume. qRT-PCR was performed using SYBR Green JumpStart Taq ReadyMix (Sigma) and 1 µl of cDNA per reaction. Reactions were performed in triplicate. Changes in transcript abundance were calculated using the ddCt method [55] with β-actin (Actb) as the reference transcript. Actb was selected as a reference transcript because our RNA-seq data indicated that its abundance was not significantly affected by SHP2 depletion, 4-OHT treatment or U0126 treatment. Gene-specific primer pairs are listed in Table S6.
Immunoblotting
Individual chondrocyte pellet cultures were homogenized in 60 µL of Pierce IP Lysis Buffer (Thermo Scientific) with freshly added Halt Protease and Phosphatase Inhibitor (Thermo Scientific). Twenty μL of lysate was added to 7.5 µL of NuPAGE LDS Sample Buffer and 3 µl NuPAGE Reducing Agent, heated to 70°C for 10 minutes, and loaded onto a 4–20% NuPAGE Bis-Tris Mini Gel (Life Technologies). Following transfer to Invitrolon PVDF membranes (Life Technologies) using standard procedures, immunodetection was performed using the Western Breeze Chemiluminescent Immunodetection kit (Life Technologies). The following primary antibodies were used: mouse anti-SHP2 (M163; Abcam), rabbit anti-phospho-ERK1/2 (Thr202/Tyr204; D13.14.4E; Cell Signaling), rabbit anti-ERK1/2 (137F5; Cell Signaling), and rabbit anti-phospho-AKT (Ser473;D9E; Cell Signaling). All primary antibodies were diluted to 1∶1000 and incubated overnight at 4°C.
Supporting Information
Zdroje
1. RomeoS, HogendoornPCW, Dei TosAP (2009) Benign cartilaginous tumors of bone: from morphology to somatic and germ-line genetics. Adv Anat Pathol 16 : 307–315 doi:10.1097/PAP.0b013e3181b506a1
2. BowenME, BoydenED, HolmIA, Campos-XavierB, BonaféL, et al. (2011) Loss-of-function mutations in PTPN11 cause metachondromatosis, but not Ollier disease or Maffucci syndrome. PLoS Genet 7: e1002050 doi:10.1371/journal.pgen.1002050
3. SobreiraNLM, CirulliET, AvramopoulosD, WohlerE, OswaldGL, et al. (2010) Whole-genome sequencing of a single proband together with linkage analysis identifies a Mendelian disease gene. PLoS Genet 6: e1000991 doi:10.1371/journal.pgen.1000991
4. GrossmannKS, RosárioM, BirchmeierC, BirchmeierW (2010) The tyrosine phosphatase Shp2 in development and cancer. Adv Cancer Res 106 : 53–89 doi:10.1016/S0065-230X(10)06002-1
5. AmaryMF, BacsiK, MaggianiF, DamatoS, HalaiD, et al. (2011) IDH1 and IDH2 mutations are frequent events in central chondrosarcoma and central and periosteal chondromas but not in other mesenchymal tumours. The Journal of Pathology 224 : 334–343 doi:10.1002/path.2913
6. AmaryMF, DamatoS, HalaiD, EskandarpourM, BerishaF, et al. (2011) Ollier disease and Maffucci syndrome are caused by somatic mosaic mutations of IDH1 and IDH2. Nature Genetics 43 : 1262–1265 doi:10.1038/ng.994
7. PansuriyaTC, van EijkR, d’ AdamoP, van RulerMAJH, KuijjerML, et al. (2011) Somatic mosaic IDH1 and IDH2 mutations are associated with enchondroma and spindle cell hemangioma in Ollier disease and Maffucci syndrome. Nature Genetics 43 : 1256–1261 doi:10.1038/ng.1004
8. JennesI, PedriniE, ZuntiniM, MordentiM, BalkassmiS, et al. (2009) Multiple osteochondromas: mutation update and description of the multiple osteochondromas mutation database (MOdb). Hum Mutat 30 : 1620–1627 doi:10.1002/humu.21123
9. YangW, KlamanLD, ChenB, ArakiT, HaradaH, et al. (2006) An Shp2/SFK/Ras/Erk Signaling Pathway Controls Trophoblast Stem Cell Survival. Developmental Cell 10 : 317–327 doi:10.1016/j.devcel.2006.01.002
10. BaulerTJ, KamiyaN, LapinskiPE, LangewischE, MishinaY, et al. (2011) Development of severe skeletal defects in induced SHP-2-deficient adult mice: a model of skeletal malformation in humans with SHP-2 mutations. Dis Model Mech 4 : 228–239 doi:10.1242/dmm.006130
11. YangW, WangJ, MooreDC, LiangH, DoonerM, et al. (2013) Ptpn11 deletion in a novel progenitor causes metachondromatosis by inducing hedgehog signalling. Nature 499 : 491–495 doi:10.1038/nature12396
12. KimHK, FengG-S, ChenD, KingPD, KamiyaN (2014) Targeted disruption of shp2 in chondrocytes leads to metachondromatosis with multiple cartilaginous protrusions. J Bone Miner Res 29 : 761–769 doi:10.1002/jbmr.2062
13. KimHKW, AruwajoyeO, SucatoD, RichardsBS, FengG-S, et al. (2013) Induction of SHP2 deficiency in chondrocytes causes severe scoliosis and kyphosis in mice. Spine 38: E1307–1312 doi:10.1097/BRS.0b013e3182a3d370
14. MatsushitaT, ChanYY, KawanamiA, BalmesG, LandrethGE, et al. (2009) Extracellular Signal-Regulated Kinase 1 (ERK1) and ERK2 Play Essential Roles in Osteoblast Differentiation and in Supporting Osteoclastogenesis. Molecular and Cellular Biology 29 : 5843–5857 doi:10.1128/MCB.01549-08
15. SebastianA, MatsushitaT, KawanamiA, MackemS, LandrethGE, et al. (2011) Genetic inactivation of ERK1 and ERK2 in chondrocytes promotes bone growth and enlarges the spinal canal. Journal of Orthopaedic Research 29 : 375–379 doi:10.1002/jor.21262
16. KatoY, IwamotoM, KoikeT, SuzukiF, TakanoY (1988) Terminal differentiation and calcification in rabbit chondrocyte cultures grown in centrifuge tubes: regulation by transforming growth factor beta and serum factors. Proc Natl Acad Sci USA 85 : 9552–9556.
17. ChenK-S, TatarczuchL, AhmedY, HuangHH, MiramsM, et al. (2010) Identification of light and dark hypertrophic chondrocytes in mouse and rat chondrocyte pellet cultures. Tissue and Cell 42 : 121–128 doi:10.1016/j.tice.2010.02.003
18. NishimuraR, HataK, OnoK, AmanoK, TakigawaY, et al. (2012) Regulation of endochondral ossification by transcription factors. Front Biosci 17 : 2657–2666.
19. OshlackA, RobinsonMD, YoungMD (2010) From RNA-seq reads to differential expression results. Genome Biol 11 : 220 doi:10.1186/gb-2010-11-12-220
20. ZhangH (2003) Profiling genes expressed in human fetal cartilage using 13,155 expressed sequence tags. Osteoarthritis and Cartilage 11 : 309–319 doi:10.1016/S1063-4584(03)00032-3
21. MiedlichSU, ZalutskayaA, ZhuED, DemayMB (2010) Phosphate-induced Apoptosis of Hypertrophic Chondrocytes Is Associated with a Decrease in Mitochondrial Membrane Potential and Is Dependent upon Erk1/2 Phosphorylation. Journal of Biological Chemistry 285 : 18270–18275 doi:10.1074/jbc.M109.098616
22. De AndreaCE, WiwegerMI, BovéeJVMG, RomeoS, HogendoornPCW (2012) Peripheral chondrosarcoma progression is associated with increased type X collagen and vascularisation. Virchows Arch 460 : 95–102 doi:10.1007/s00428-011-1168-9
23. HuchK, MordsteinV, StöveJ, NerlichAG, AmholdtH, et al. (2002) Expression of collagen type I, II, X and Ki-67 in osteochondroma compared to human growth plate cartilage. Eur J Histochem 46 : 249–258.
24. BhowmickNA, ChytilA, PliethD, GorskaAE, DumontN, et al. (2004) TGF-beta signaling in fibroblasts modulates the oncogenic potential of adjacent epithelia. Science 303 : 848–851 doi:10.1126/science.1090922
25. TsutsumiR, XieC, WeiX, ZhangM, ZhangX, et al. (2009) PGE2 signaling through the EP4 receptor on fibroblasts upregulates RANKL and stimulates osteolysis. J Bone Miner Res 24 : 1753–1762 doi:10.1359/jbmr.090412
26. TrimboliAJ, Cantemir-StoneCZ, LiF, WallaceJA, MerchantA, et al. (2009) Pten in stromal fibroblasts suppresses mammary epithelial tumours. Nature 461 : 1084–1091 doi:10.1038/nature08486
27. InoueT, TakenakaT, HayashiM, MonkawaT, YoshinoJ, et al. (2010) Fibroblast expression of an IκB dominant-negative transgene attenuates renal fibrosis. J Am Soc Nephrol 21 : 2047–2052 doi:10.1681/ASN.2010010003
28. HopyanS, GokgozN, PoonR, GensureRC, YuC, et al. (2002) A mutant PTH/PTHrP type I receptor in enchondromatosis. Nature Genetics 30 : 306–310 doi:10.1038/ng844
29. HoL, AliSA, Al-JazraweM, KandelR, WunderJS, et al. (2013) Primary cilia attenuate hedgehog signalling in neoplastic chondrocytes. Oncogene 32 : 5388–5396 doi:10.1038/onc.2012.588
30. DouisH, DaviesAM, JamesSL, KindblomLG, GrimerRJ, et al. (2012) Can MR imaging challenge the commonly accepted theory of the pathogenesis of solitary enchondroma of long bone? Skeletal Radiology 41 : 1537–1542 doi:10.1007/s00256-012-1387-4
31. LapinskiPE, MeyerMF, FengG-S, KamiyaN, KingPD (2013) Deletion of SHP-2 in mesenchymal stem cells causes growth retardation, limb and chest deformity, and calvarial defects in mice. Dis Model Mech 6 : 1448–1458 doi:10.1242/dmm.012849
32. JonesKB, PiomboV, SearbyC, KurrigerG, YangB, et al. (2010) A mouse model of osteochondromagenesis from clonal inactivation of Ext1 in chondrocytes. Proc Natl Acad Sci USA 107 : 2054–2059 doi:10.1073/pnas.0910875107
33. LaiLP, MitchellJ (2005) Indian hedgehog: Its roles and regulation in endochondral bone development. Journal of Cellular Biochemistry 96 : 1163–1173 doi:10.1002/jcb.20635
34. JacobAL, SmithC, PartanenJ, OrnitzDM (2006) Fibroblast growth factor receptor 1 signaling in the osteo-chondrogenic cell lineage regulates sequential steps of osteoblast maturation. Dev Biol 296 : 315–328 doi:10.1016/j.ydbio.2006.05.031
35. WangK, YamamotoH, ChinJR, WerbZ, VuTH (2004) Epidermal growth factor receptor-deficient mice have delayed primary endochondral ossification because of defective osteoclast recruitment. J Biol Chem 279 : 53848–53856 doi:10.1074/jbc.M403114200
36. ColvinJS, BohneBA, HardingGW, McEwenDG, OrnitzDM (1996) Skeletal overgrowth and deafness in mice lacking fibroblast growth factor receptor 3. Nat Genet 12 : 390–397 doi:10.1038/ng0496-390
37. DengC, Wynshaw-BorisA, ZhouF, KuoA, LederP (1996) Fibroblast growth factor receptor 3 is a negative regulator of bone growth. Cell 84 : 911–921.
38. HattoriT, MullerC, GebhardS, BauerE, PauschF, et al. (2010) SOX9 is a major negative regulator of cartilage vascularization, bone marrow formation and endochondral ossification. Development 137 : 901–911 doi:10.1242/dev.045203
39. SalieR, KneisselM, VukevicM, ZamurovicN, KramerI, et al. (2010) Ubiquitous overexpression of Hey1 transcription factor leads to osteopenia and chondrocyte hypertrophy in bone. Bone 46 : 680–694 doi:10.1016/j.bone.2009.10.022
40. AmanoK, IchidaF, SugitaA, HataK, WadaM, et al. (2008) Msx2 Stimulates Chondrocyte Maturation by Controlling Ihh Expression. Journal of Biological Chemistry 283 : 29513–29521 doi:10.1074/jbc.M803681200
41. FerrariD, KosherRA (2002) Dlx5 Is a Positive Regulator of Chondrocyte Differentiation during Endochondral Ossification. Developmental Biology 252 : 257–270 doi:10.1006/dbio.2002.0862
42. LiuT, GaoY, SakamotoK, MinamizatoT, FurukawaK, et al. (2007) BMP-2 promotes differentiation of osteoblasts and chondroblasts in Runx2-deficient cell lines. Journal of Cellular Physiology 211 : 728–735 doi:10.1002/jcp.20988
43. PanQ, YuY, ChenQ, LiC, WuH, et al. (2008) Sox9, a key transcription factor of bone morphogenetic protein-2-induced chondrogenesis, is activated through BMP pathway and a CCAAT box in the proximal promoter. J Cell Physiol 217 : 228–241 doi:10.1002/jcp.21496
44. HollevilleN, QuilhacA, BontouxM, Monsoro-BurqAH (2003) BMP signals regulate Dlx5 during early avian skull development. Dev Biol 257 : 177–189.
45. MininaE, WenzelHM, KreschelC, KarpS, GaffieldW, et al. (2001) BMP and Ihh/PTHrP signaling interact to coordinate chondrocyte proliferation and differentiation. Development 128 : 4523–4534.
46. MuzumdarMD, TasicB, MiyamichiK, LiL, LuoL (2007) A global double-fluorescent Cre reporter mouse. Genesis 45 : 593–605 doi:10.1002/dvg.20335
47. NakamuraE, NguyenM-T, MackemS (2006) Kinetics of tamoxifen-regulated Cre activity in mice using a cartilage-specific CreER(T) to assay temporal activity windows along the proximodistal limb skeleton. Dev Dyn 235 : 2603–2612 doi:10.1002/dvdy.20892
48. ZhangSQ, YangW, KontaridisMI, BivonaTG, WenG, et al. (2004) Shp2 Regulates Src Family Kinase Activity and Ras/Erk Activation by Controlling Csk Recruitment. Molecular Cell 13 : 341–355 doi:10.1016/S1097-2765(04)00050-4
49. HayashiS, McMahonAP (2002) Efficient recombination in diverse tissues by a tamoxifen-inducible form of Cre: a tool for temporally regulated gene activation/inactivation in the mouse. Dev Biol 244 : 305–318 doi:10.1006/dbio.2002.0597
50. GossetM, BerenbaumF, ThirionS, JacquesC (2008) Primary culture and phenotyping of murine chondrocytes. Nature Protocols 3 : 1253–1260 doi:10.1038/nprot.2008.95
51. TrapnellC, PachterL, SalzbergSL (2009) TopHat: discovering splice junctions with RNA-Seq. Bioinformatics 25 : 1105–1111 doi:10.1093/bioinformatics/btp120
52. Carlson M, Pages H, Aboyoun S, Falcon S, Morgan M, et al.. (2012) GenomicFeatures: Tools for making and manipulating transcript centric annotations. R package version 1.8.2. Available: http://www.bioconductor.org/packages/release/bioc/html/GenomicFeatures.html.
53. AyturkUM, JacobsenCM, ChristodoulouDC, GorhamJ, SeidmanJG, et al. (2013) An RNA-seq protocol to identify mRNA expression changes in mouse diaphyseal bone: applications in mice with bone property altering Lrp5 mutations. J Bone Miner Res 28 : 2081–2093 doi:10.1002/jbmr.1946
54. RobinsonMD, McCarthyDJ, SmythGK (2010) edgeR: a Bioconductor package for differential expression analysis of digital gene expression data. Bioinformatics 26 : 139–140 doi:10.1093/bioinformatics/btp616
55. LivakKJ, SchmittgenTD (2001) Analysis of relative gene expression data using real-time quantitative PCR and the 2-ΔΔCT Method. Methods 25 : 402–408 doi:10.1006/meth.2001.1262
Štítky
Genetika Reprodukční medicínaČlánek vyšel v časopise
PLOS Genetics
2014 Číslo 5
- Kazuistika – Perspektivy využití precizované medicíny v rámci personalizované specifické terapie onkologických pacientů
- Nobelova cena za chemii pro genetické nůžky: Objev, který změní naši budoucnost?
- Technologie na bázi RNA v klinické praxi: od přebarvených petúnií k terapii vzácných a dosud jen obtížně léčitelných chorob u lidí
- „Nepředstavovali jsme si, že náš výzkum povede přímo ke vzniku nových léků, dokonce ještě za našeho života“
- Bezplatné služby pro diagnostiku ATTRv amyloidózy pro kardiology
Nejčtenější v tomto čísle
- PINK1-Parkin Pathway Activity Is Regulated by Degradation of PINK1 in the Mitochondrial Matrix
- Null Mutation in PGAP1 Impairing Gpi-Anchor Maturation in Patients with Intellectual Disability and Encephalopathy
- Phosphorylation of a WRKY Transcription Factor by MAPKs Is Required for Pollen Development and Function in
- p53 Requires the Stress Sensor USF1 to Direct Appropriate Cell Fate Decision
Zvyšte si kvalifikaci online z pohodlí domova
Mazová zátka a její řešení
nový kurzVšechny kurzy