
Insights into the Genetic Structure and Diversity of 38 South Asian Indians from Deep Whole-Genome Sequencing
Indians of South Asia has long been a population of interest to a wide audience, due to its unique diversity. We have deep-sequenced 38 individuals of Indian descent residing in Singapore (SSIP) in an effort to illustrate their diversity from a whole-genome standpoint. Indeed, among Asians in our population panel, SSIP was most diverse, followed by the Malays in Singapore (SSMP). Their diversity is further observed in the population's chromosome Y haplogroup and mitochondria haplogroup profiles; individuals with European-dominant haplogroups had greater proportion of European admixture. Among variants (single nucleotide polymorphism and small insertions/deletions) discovered in SSIP, 21.69% were novel with respect to previous sequencing projects. In addition, some 14 loss-of-function variants (LOFs) were associated to cancer, Type II diabetes, and cholesterol levels. Finally, D statistic test with ancient hominids concurred that there was gene flow to East Asians compared to South Asians.
Published in the journal:
. PLoS Genet 10(5): e32767. doi:10.1371/journal.pgen.1004377
Category:
Research Article
doi:
https://doi.org/10.1371/journal.pgen.1004377
Summary
Indians of South Asia has long been a population of interest to a wide audience, due to its unique diversity. We have deep-sequenced 38 individuals of Indian descent residing in Singapore (SSIP) in an effort to illustrate their diversity from a whole-genome standpoint. Indeed, among Asians in our population panel, SSIP was most diverse, followed by the Malays in Singapore (SSMP). Their diversity is further observed in the population's chromosome Y haplogroup and mitochondria haplogroup profiles; individuals with European-dominant haplogroups had greater proportion of European admixture. Among variants (single nucleotide polymorphism and small insertions/deletions) discovered in SSIP, 21.69% were novel with respect to previous sequencing projects. In addition, some 14 loss-of-function variants (LOFs) were associated to cancer, Type II diabetes, and cholesterol levels. Finally, D statistic test with ancient hominids concurred that there was gene flow to East Asians compared to South Asians.
Introduction
Next-generation sequencing (NGS) technologies have enabled an entire genome to be sequenced in a cost-effective manner [1], and this has allowed multiple individuals from a population to be surveyed in order to catalogue genetic variants that are present in the population. By adopting an unbiased approach to survey the whole genome, NGS presents a more comprehensive catalogue of different classes of genetic variants with a single assay: from changes that affect only a single base in the genome (single nucleotide polymorphisms, SNPs), to small-size additions and omissions (insertion-deletions, indels); and to larger contiguous changes in the genome that affect either the number of copies of a stretch of genome or differences in the genomic structure (structural variants, SVs). Prior to the advent of NGS, the knowledge of these different classes of variants at the population level has been derived primarily from surveys using pre-designed microarrays, and where the majority focused on SNP variations between populations.
The 1000 Genomes Project (1 KGP) intends to survey more than 2,500 individuals from at least 20 populations around the world [2], and Phase 1 of the project has already offered valuable insights into the population genetics of 14 populations. While the 1 KGP adopted the approach of sequencing multiple individuals at a lower sequence depth of 2-6X, a recently concluded project in Southeast Asia sequenced 100 Austronesian Malays (the Singapore Sequencing Malay Project, SSMP) at a coverage of at least 30X examined the merits of deep sequencing for a more complete characterization of variants carried by the individuals [3]. The use of NGS has also been successfully extended to sequence ancient hominids such as the Neanderthals and the Denisovans [4], [5], [6], and from well-preserved human tissues from the Ötzi [7] and an aboriginal Australian [8].
South Asia comprises more than 20% of the total world population, of which the majority resides in India [8]. The contemporary demographic makeup of the Indian subcontinent is considerably heterogeneous and is the result of complex human migration and interaction since the first human dispersal out of Africa between 60,000 to 75,000 years ago. It was first proposed from the analysis of mitochondria sequences that a single rapid coastal dispersion happened from the Horn of Africa into Southeast Asia and Australasia through the Indian subcontinent [9], and which corroborated with additional analyses of mitochondria in the Andaman and Nicobar Islands [10]. Genome-wide genotyping surveys of geographically well-defined South Asians indicated the presence of complex admixture between populations in the Indian subcontinent [11], [12], which have been proposed to be attributed to the practice of the caste system which encouraged endogamous marriages and the presence of different ethno-linguistic groups – the Indo-Aryan language speaking groups that are primarily found in north India, and the Dravidian language speaking groups that are predominantly found in south India.
Singapore is home to more than 350,000 Indians, comprising 9.2% of the residing population [13]. These people with ancestry originating from the Indian subcontinent has been designated officially and uniformly as “Indian”, although this can be inadequate given the heterogeneous background of the Indian populace in Singapore, which includes Tamils, Malayalee, Sikh, Hindustani, Punjabi, Sindhi, Hindi, Gujarati, Urdu and Sinhalese [14]. The majority of the Singapore Indians were descended from immigrants from south India who settled in the country after Singapore became a major entrepot trading center in the early 19th century [15], [16].
The SSIP aims to perform whole-genome sequencing of 38 healthy Singapore Indians, to provide insights into the genetic structure and diversity of Asian Indians in Singapore. With a target sequence depth of 30X, the SSIP presents another public resource of deep whole genome sequencing of multiple samples in a well-defined population, as with the SSMP. Here, we evaluated the genetic proximity of the SSIP to the SSMP and 14 populations from Phase 1 of the 1 KGP, and measured the degree of intra-population genetic diversity in each of the 16 populations. The ancestral origins of the SSIP samples were inferred by evaluating the mitochondria and chromosome Y haplogroup memberships of the relevant samples, and we performed an analysis of the relative relatedness between SSIP and two archaic hominins (Denisovan, Neanderthal). The genetic resource for the SSIP is publicly available at http://www.statgen.nus.edu.sg/~SSIP.
Results
Sequence data assembly, alignment and quality control
South Asian Indians from the Singapore Population Health Study were sampled to be whole-genome sequenced with the Illumina HiSeq 2000 to a target 30-fold coverage, using paired-end sequencing with 100 basepairs (bp) reads and a target insert size of between 300 bp and 400 bp (Figure S1). This was performed on 38 subjects, comprising 26 females and 12 males, where ethnic membership for each sample was confirmed through verbal reconfirmation that all four grandparents were similarly of South Asian descent. A total of 56 billion paired-end reads were generated for the 38 samples, of which 42.7 billion reads were properly paired and passed quality assessment (Figure S2). Sequence reads were mapped to the NCBI build 37 reference genome with Consensus Assessment of Sequence And VAriation (CASAVA v1.9), and variant calling for SNPs and indels were performed with both the single-sample caller CASAVA and the multi-sample caller Genome Analysis Toolkit (GATK) (Figure S3). All but one of the 38 SSIP samples (SSI007) achieved median sequence depths greater than 30X (Figure S4). To assess the accuracy of the self-reported population membership, a principal component analysis (PCA) was carried out on the 38 SSIP samples and 268 samples from the Singapore Genome Variation Project (SGVP), where one sample (SSI016) clearly clustered with the Malays instead of the Indians (Figure S5). We thus excluded both SSI007 and SSI016 from further analyses, and the remaining samples consisted of 25 females and 11 males.
SNP discovery and annotation
The data release for SSIP consisted of the consensus set of SNPs and indels called by both CASAVA and GATK to minimize false discovery. As each sample was also genotyped on the Illumina Omni2.5 M microarray, we compared the concordance of the genotype calls made by CASAVA and GATK with the genotypes at the same SNPs on the Omni2.5 M. CASAVA was observed to produce genotype calls with a higher concordance with the Omni2.5 M genotypes than GATK (Figure S6), we subsequently retained the CASAVA genotypes release in the SSIP VCFs and downstream analyses.
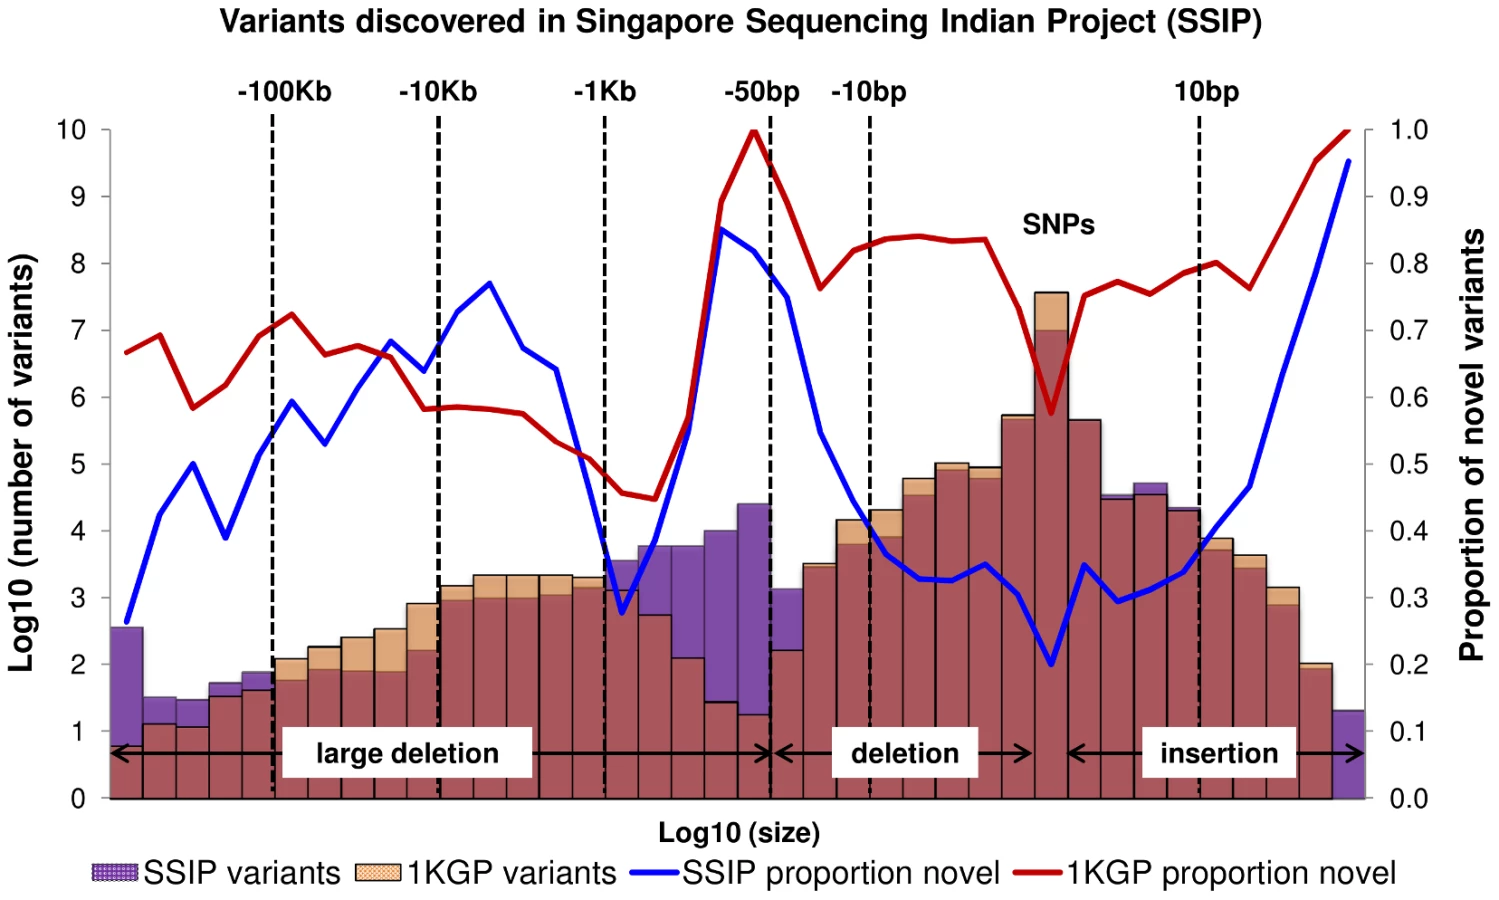
A total of 10,305,409 SNPs, 1,269,000 indels and 56,088 large deletions were detected in the 36 SSIP samples (Table 1), where 20.02%, 32.90% and 76.67% respectively were found to be novel (defined as not present in dbSNP137, 1 KGP, the SSMP or the Database of Genomic Variants (DGV) accordingly, Figure 1). While the vast majority of the SNPs discovered were bi-allelic, there were 18,904 tri-allelic and 27 quad-allelic SNPs, of which 5.4% of these were not previously known. The transition-to-transversion (Ts/Tv) ratio for the bi-allelic SNPs was 2.14 across the whole genome, and was significantly higher at 3.24 if restricted to only the exonic SNPs (Table S3) due to the over-representation of CpG sites in the exome (calculated in SSIP at 32.6% in the exome, and 17.2% across the genome). With the available sample size, each variant is classified according to the alternative allele frequency (AAF) as either low-frequency (AAF<5%) or common (AAF≥5%). The majority of the known bi-allelic SNPs were common while the opposite was observed for novel SNPs, where the majority was low-frequency in nature (Table 1).

Bi-allelic SNPs and indels were further annotated with SNPEff which catalogued each variant into one of four categories according to the predicted level of impact to protein function [17]. In the SSIP samples, 928 and 37,378 SNPs were classified into the high and moderate impact categories respectively (Table 1). Among these SNPs, 5,075 SNPs were predicted by both SIFT and PolyPhen v2 to be damaging to the protein product. Similarly, the majority of the indels were catalogued as modifiers with low or no impact to protein function, and only 712 and 590 indels were annotated as high and moderate impact variants respectively. Intriguingly, almost all the observed indels were present in the SSIP samples at minor allele frequencies >5%.
When compared to the variants that have been reported by 1 KGP, there were more SNPs and indels present in 1 KGP than SSIP (Figure 1). However, SSIP identified more deletions between the sizes of 50 bp and 1 kb than 1 KGP. This is likely attributed to the higher coverage of the sequencing, which provided greater confidence in identifying the smaller deletions that may only be identified with sufficient sequence depth.
Loss-of-function variants
We identified 1,429 loss-of-function variants (LOFs) in the 36 SSIP samples, of which 635 LOFs were novel and 407 LOFs had AAF>5% (Table S4). On average, each sample carried 350 LOFs, which exceeded a previous report of around 100 genuine LOFs per healthy individual [18] but was similar to the average of 470 LOFs per sample in the SSMP [3]. A gene-set analysis using Visualization and Integrated Discovery (DAVID) identified significant enrichment of LOFs in pathways related to olfactory transduction, ATP-bind cassette (ABC) transporters and Histidine metabolism, although only the olfactory transduction pathway remained statistically significant after correcting for multiple testing with the Benjamini-Hochberg procedure (Pcorrected = 2.8×10⁻³, Table S5). The LOFs in the olfactory pathway may have emerged to perceive chemicals due to differential diet and environmental exposure that may have geographical specificity.
The LOFs were also mapped to the Catalogue of Somatic Mutations In Cancer (COSMIC) database with SNPnexus, and 11 variants were found to be associated with ovarian, gastrointestinal, hepatic and pancreatic cancer (Table S6). The risk alleles at these variants generally were found at higher frequencies in the SSIP samples, although we caution against over-interpreting the significance given the small sample set in the SSIP. When checked against the genome-wide association studies (GWAS) database, 3 LOFs were reported to be associated with conduct disorder, triglyceride and high density lipoprotein cholesterol, and Type 2 diabetes (Table S7). In particular, the LOF rs1048886 that was reported to be associated with diabetes was first established from a diabetes GWAS in Singapore Indians.
Population structure of SSIP samples
A PCA was performed with the SSIP samples and a panel of 132 South Asians from 25 well-defined groups from the Indian subcontinent [11] in an attempt to understand the ancestral origins of the Singapore Indians. Consistent with the findings by Reich and colleagues [11], the first principal component (PC) distinguished the Great Andamanese, Onge, Nyshi, AoNaga and Siddi samples from all other Indian subgroups (including SSIP, Figure 2A). When samples from these five groups were removed, it was observed that SSIP samples were located with all the south Indian groups (Hallaki, Kamsali, Velama) except Chenchu (Figures 2B, C), although there were considerable heterogeneity amongst the north Indian groups (Figure 2C) that precluded a clear latitudinal distinction of north and south Indians. We performed admixture analysis on 104 individuals from 20 Indians groups reported by Reich and colleagues, together with the SSIP samples. The results supported the hypothesis that the SSIP individuals are genetically more homogenous to the south Indians than to the north Indians (Figure S14).

A separate PCA with samples from 16 populations (SSIP, SSMP and Phase 1 of 1 KGP) was performed to place these 36 Singapore Indians amongst global populations (Figure 3A). The first PC differentiated the SSIP samples from Africans and East Asians although the second PC was necessary to distinguished them from the Europeans. However, there appeared to be considerable diversity between the Americans that confounded the distinction between them and the SSIP samples. This was similarly evident in the FST analyses, where the Americans were found to be most similar to the SSIP (Figure S7). Excluding the admixed American populations, the SSIP was genetically closest to the Europeans in the panel of populations considered.
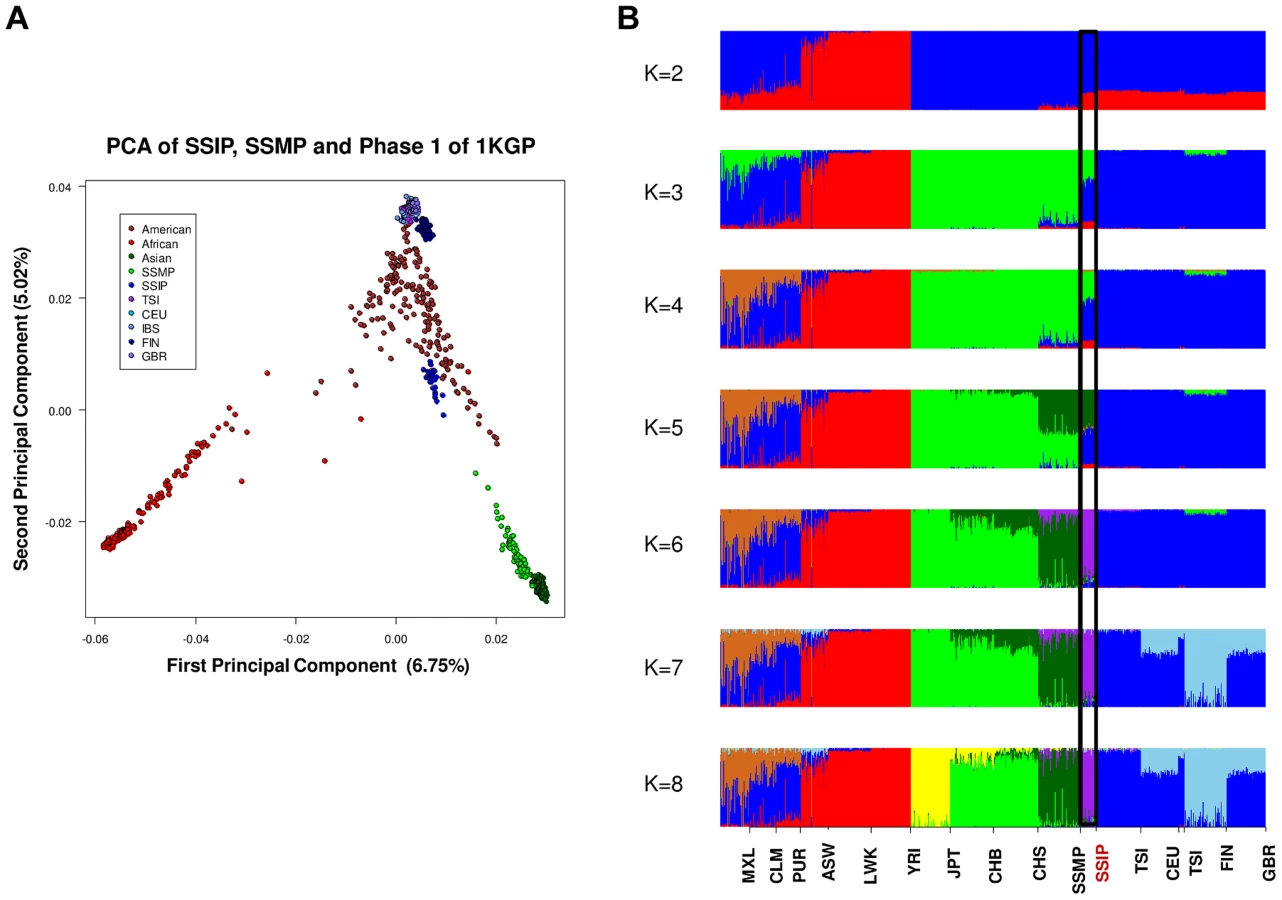
In an admixture analysis of the 16 populations, we observed that the SSIP were consistently inferred to be significantly admixed with the Europeans until at least six distinct groups were assumed (K≥6, Figure 3B), where the European component stabilized to an average of 7.1%, 4.3% of Malay and 1.3% of East Asians (Table S8).
Assessing between and within population diversity
One measure of population diversity we investigated was the proportion of SNPs that was shared uniquely with only one other population when assessed across all 16 populations (Figure 4A). We observed that SSIP exhibited the greatest sharing with SSMP, although this is likely to be attributed to the >30X sequencing depth for both populations, since the remaining 14 populations in 1 KGP were sequenced at between 2-6X. Unsurprisingly, populations from the same continent generally exhibited higher sharing amongst themselves (Figure 4B) and the admixed populations from the Americas tend to possess greater sharing with either the European populations or the African populations.

In addition to evaluating the inter-population diversity, we also investigated intra-population diversity by measuring the degree of SNP sharing between every pair of samples in each population. This presented a distance measure D that is scaled between 0 and 1, where a higher value indicated a greater degree of heterogeneity in SNP content between the two samples (or a lower degree of SNP sharing). As expected, the African populations exhibited the highest intra-population diversity while the East Asian populations exhibited the lowest (Figure 5). In comparison, SSIP had a median intra-population diversity that was marginally higher than the Europeans, while SSMP was between the East Asians and Europeans. Other than the median, the spread of the D metric calculation between every pair of samples is also indicative of the inter-sample diversity within a population. As expected, the American populations exhibited the largest spread due to differential degree of admixture between the samples. Excluding the Americans, SSMP exhibited the largest spread for a population, suggesting that there were considerable differences in the extent of genetic dissimilarities between the Singapore Malays, likely a reflection of the heterogeneous ancestry of the Singapore Malays. The trend in the distribution of the D metric was consistent even when the analysis was restricted to 36 samples from each population (Figure S8) to avoid confounding due to the different number of samples in each population. Consistent results were similarly observed when the same analysis was performed on samples from seven populations in 1 KGP that were sequenced by Complete Genomics to deeper coverage of between 51X and 89X, which included the Gujarati Indians from Houston that exhibited a D distribution highly concordant to the SSIP (Figure S9).

While SSIP exhibited the highest intra-population diversity amongst the five Asian populations (CHB, CHS, JPT, SSMP, SSIP), we similarly observed the highest ratio of heterozygous genotypes to homozygous genotypes (Het/Hom) in the SSIP samples among all Asians, and the levels present in the SSIP were comparable to those in Europeans (Figure S10). The trend in the distribution of Het/Hom remained consistent even when adjusted for sample size and sequencing coverage (Figures S10, S11), where Africans generally displayed Het/Hom of around 2, East Asians around 1.4, and South Asians (SSIP, GIH from Complete Genomics) and Europeans around 1.6.
Mitochondria and Y chromosome haplogroup membership
We assigned the 36 SSIP mitochondria (mtDNA) sequences to known mitochondria haplogroups with HaploGrep [19]. The majority of the samples were assigned to the haplogroups M, N and R (Table 2) which were found in high frequencies in South Asian populations [20], [21], [22]. However, the remaining 9 samples were assigned to haplogroups F, HV, T, U and W. Other than haplogroup F that was found mostly in East Asia, the other four haplogroups were predominantly present in European populations. In a similar analysis of chromosome Y for the 11 male SSIP samples (Table 3), eight of the Y chromosomes were assigned to haplogroups that were predominantly found in South Asia (F: primarily a south Indian Dravidian-speaking haplogroup; H: present mainly in the Indian subcontinent; L: present mainly in South and Central Asia). Two samples were assigned to haplogroups J2b2 that were present mainly in the Mediterranean and Southern Europe, while the remaining sample was assigned to R1a1, a haplogroup that is mostly present in Europe but is found at low frequencies in South Asia.


To investigate the correlation between the admixture analysis and the haplogroup assignments, we stratified the 36 samples according to the mitochondria haplogroups into a European dominant group (haplogroups HV, T, U and W; 8 samples) and a non-European dominant group (haplogroups F, M, N and R; 28 samples) and compared the estimated degree of European admixture between these two groups when we assumed six distinct populations in the admixture analysis (Table S8). We assumed six distinct populations as this yielded amongst the lowest cross-validation errors and was the most parsimonious choice (Figure S15). We observed a significant elevation of the European component (9.1% versus 6.5%, P = 0.047) in the samples identified with European-dominant mitochondrial haplogroup assignment, despite this not being evident in the PCA with autosomal SNPs (Figure S12). We observed that the extent of European admixture in the SSIP was about 7% (at K = 6, Figure S15), which was lower than previous studies where two reported around 50% north Indian ancestry in 17 Indian subgroups [11], [23]. However, the results between the different studies are not directly comparable due to the makeup of the European populations, since our analyses have considered five European subgroups (CEU, FIN, GBR, IBS, TSI) while the published reports have used only CEU to represent Europeans in the admixture estimation. This can be seen in our admixture analysis that assumed three distinct populations (K = 3), where the SSIP is observed to possess an average of 53% European admixture (Figure S16), which is in fact in agreement with previous reports.
Admixture with ancient genomes
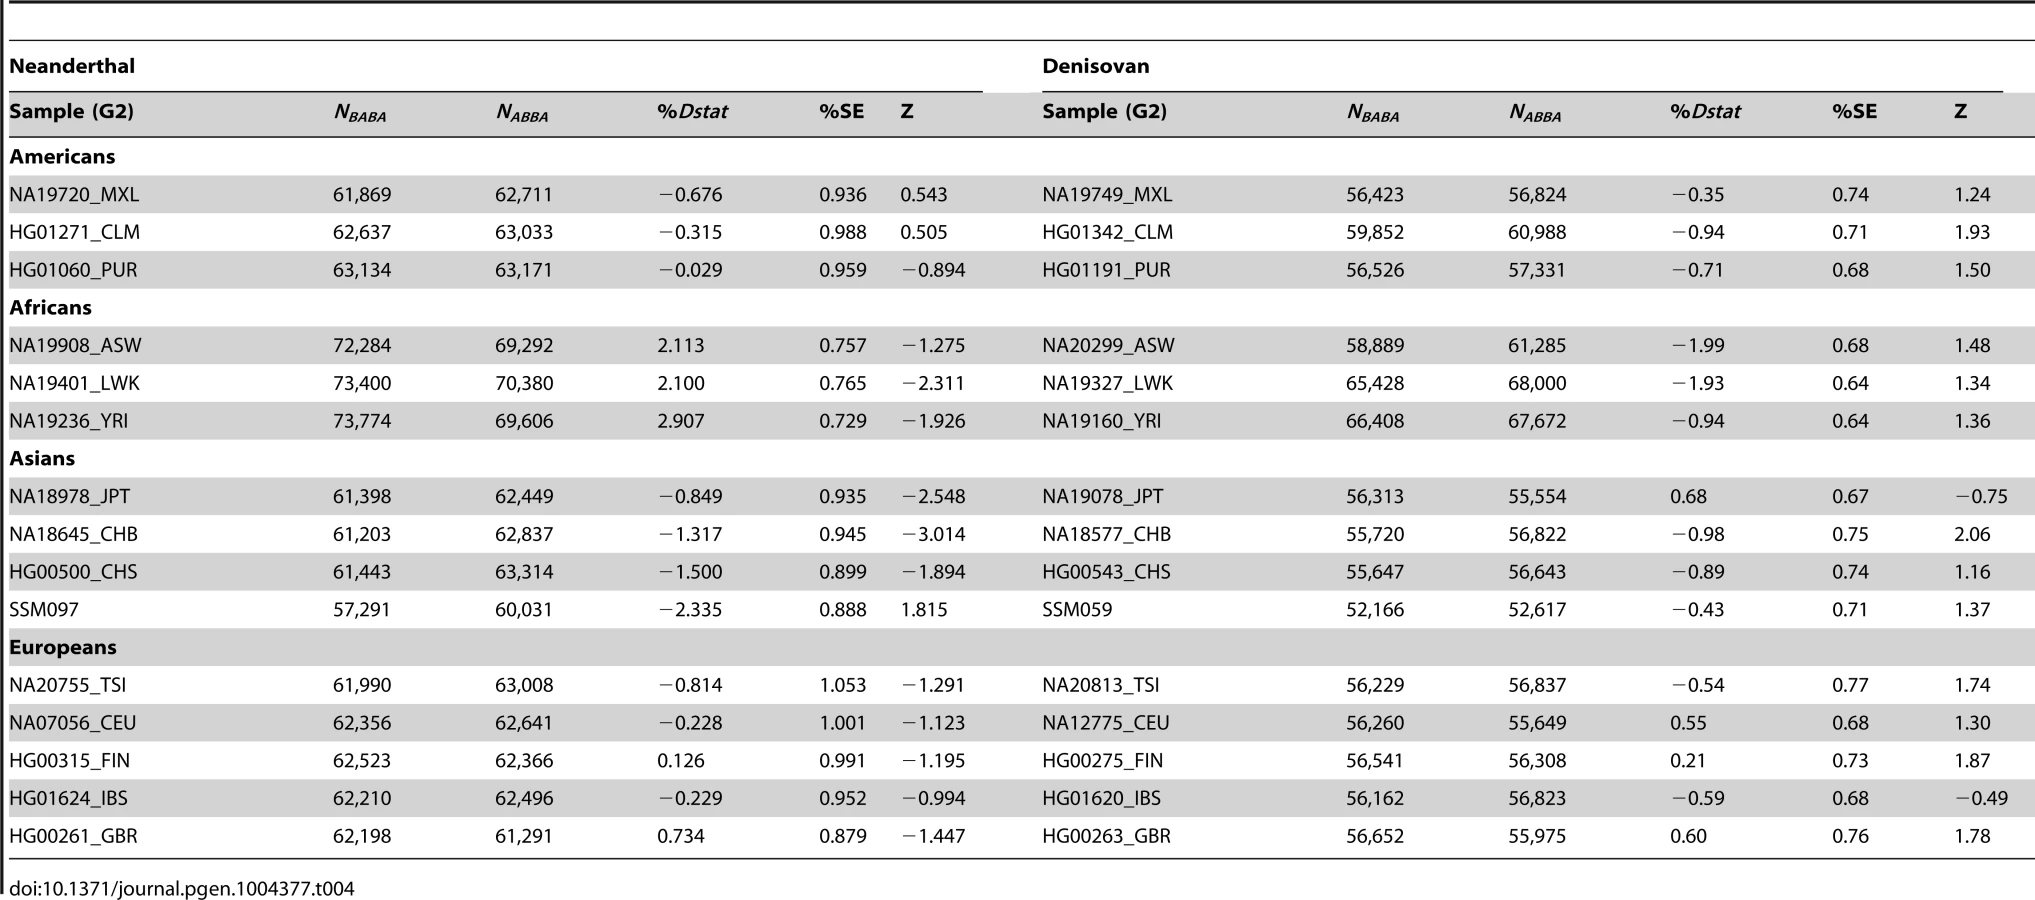
By randomly choosing one sample from each of the 16 populations, we calculated the Dstatistic metric to investigate the relative extent of admixture of two ancient hominid genomes, a Neanderthal and a Denisovan, into modern humans. As Dstatistic required the input of four genomes, the analysis was anchored with a specific SSIP sample (SSI033 as G1) together with an ancient hominid and the chimpanzee genome, and we varied only the sample that was used in this four-sample analysis (Table 4). We observed significantly greater extent of Neanderthal genome in East Asians (CHB, JPT) relative to SSIP, but lesser in the Luhya Kenyans (LWK) than SSIP. This was consistent with the estimations by Wall and colleagues, despite the use of Gujarati Indians as their South Asian samples [24]. There was also evidence to suggest a greater degree of Denisovan admixture in northern Han Chinese (CHB) than SSIP, although this observation was not reproduced for the other two East Asian populations (CHS, JPT). To evaluate the robustness of these analyses to the choice of samples and sequence coverage, we additionally performed the Dstatistic calculation on five randomly chosen pair of samples from each population (anchored with a different SSIP sample as G1), and also performed the same analyses on the populations sequenced by Complete Genomics (to a minimum coverage of 51X). These additional analyses indicated that our original observations were robust (Table 5, Table S9).

Discussion
The Singapore Sequencing Indian Project has produced a publicly available genomic resource by sequencing the genomes of 36 South Asian Indians from Singapore at a target coverage of 30X. This complements the existing resource of 96 Southeast Asian Malays from the SSMP, as well as 1,092 samples from Phase 1 of the 1000 Genomes Project. By comparing against a panel of 132 South Asians with well-defined geographical origins, the 36 Singapore Indians were found to be genetically closer to the South Asians from south India. The assignment of Y chromosomes and mitochondria to known haplogroups identified 18% and 22% of the samples respectively to belong to haplogroups that are predominantly present in Europeans, and these memberships were not discernible in the PCA using autosomal SNPs of SSIP with other global populations, even though there were marginally higher degree of Caucasian admixture in these samples that were statistically significant.
The PCA of the South Asian samples revealed greater genetic heterogeneity in Asian Indians that originated from northern parts of India, while those that originated from the south were considerably more homogeneous (see Figure 2C). In an independent analysis of HapMap Gujarati Indians with Asian Indians from the Singapore Genome Variation Project, around a third of the Gujarati Indians were found to cluster with the Singapore Indians (Figure S13). With an original sample size of 38, the SSIP is hardly representative of the complex genomic diversity that is present in the Indian subcontinent, nor does it contain geographically well-distributed samples to yield deeper insights into the migratory history of South Asians. Many theories have been proposed on the differentiation between Indo-Aryan and Dravidian-speaking Indians, and we emphasize the SSIP is not intended to investigate the different hypotheses, although it can serve as a potential population panel when more South Asian genetics data become available. Individuals in the SSIP have been sampled from Singapore, a location which is geographically distant from India, and migration and inter-marriages likely will have confounded genetic membership to specific geographical origins in south India, and thus the SSIP is likely to be more representative of cosmopolitan Indians in Singapore.
While our assessment of intra-population diversity considers the extent of SNP sharing between pairs of samples in a population, the variance of this metric provides an effective measure of the genetic homogeneity of population labels. For example, the admixed Mexican population exhibited the largest spread in the pairwise distances, even though the median distance for Mexicans was in the same range as with the Caucasians (see Figure 5). This suggests that for subjects labeled as Mexicans, there are pairs of samples where the extent of SNP sharing was as similar as East Asians, while at the same time there are pairs within the population that were significantly more diverse than between pairs of SSIP samples. The downstream implication to such variable degree of intra-population diversity is the interpretation and relevance of population labels as surrogate for genomic information in the practice of public health. An example of this is in warfarin pharmacology. Although polymorphisms in VKORC1 and CYP2C9 can explain up to 70% of dosage variance between populations [25], it is still common to rely on race or ethnic labels to identify the loading dosages when initiating warfarin therapy in the absence of information from genetic screening [25], [26]. A population with a large variance for the intra-population diversity suggests that the adherence to self-reported population labels may serve as a poor surrogate for the underlying pharmacogenomics, which was evident in the larger range of warfarin international normalized ratio (INR) for African Americans and Caucasians, as compared to the Chinese and Japanese (see figure 1 of [26]).
The SSIP resource is expected to be a timely complement to Phase 3 of the 1 KGP, which has sequenced the genomes of samples from three additional migrant South Asian groups in Houston (Gujarati Indians) and the United Kingdom (Sri Lankan Tamils, Indian Telegus), as well as two native South Asian groups in Bangladesh (Bengali) and Pakistan (Punjabi). Similar to the Phase 1 design, these five groups have been sequenced at a low coverage of between 2 - to 6-fold, and it can be useful to evaluate whether the availability of the SSIP data will benefit the process of variant calling for these populations that have undergone low-pass sequencing. The variants for the 36 SSIP samples are publicly available in the variant call format (VCF), and these can be accessed along with phased haplotypes for the SSIP samples at http://www.statgen.nus.edu.sg/~SSIP.
Materials and Methods
Samples
Subjects enrolled in the SSIP consisted of 38 subjects, 12 males and 26 females, from the Multi-Ethnic Cohort (MEC) of the Singapore Population Health Study who self-reported themselves as Singapore Indians. This is a cross-sectional survey on individuals of ages between 40 and 65 years old, the exclusion criteria at the time of the initial enrolment into the MEC were: (i) below 21 years of age; (ii) having any mental condition that may interfere with the participant's competency in giving informed consent; and were suffering from any of the following conditions (iii) renal failure; (iv) stroke; (v) cancer; (vi) heart disease (including congenital conditions). We confirmed the ethnic membership of each individual via a telephone survey to verify that both sets of grandparents similarly self-reported to be South Asian Indians. Informed consent was obtained from all participants and ethical approvals were obtained for the Singapore Population Health Study and the extension to perform whole-genome sequencing from two independent Institutional Review Boards at the National University Hospital (Singapore) and the National University of Singapore respectively.
Sample preparation and sequence data generation
The blood samples of all 38 Singapore Indians were extracted from the Singapore BioBank, and DNA extraction was performed at the Defence Medical and Enviromental Research Institute according the protocol by Illumina, with DNA quantification performed using picogreen and the SpectraMax Gemini EM microplate reader (with spectrophometic set at 480/520 nm) to ensure DNA concentration for each sample was at least 50 ng/µl. Whole genome sequencing was performed at the Illumina facility at Hayward, California, USA, using the Illumina HiSeq 2000 sequencer, where each sample was run on a unique lane to achieve a target coverage of 30-fold with 2×100 paired-end reads and a target insert size of between 300–400 bp. To ensure consistent and quality sequencing, multiple quality control procedures were adopted: (i) in preparing the libraries, the Bioanalyzer was used to ensure DNA quality and size distribution; (ii) a short paired-end sequencing reaction was applied to each sample after library preparation to ensure the extent of GC bias and the observed sequencing quality were within normal ranges; (iii) sequencing of each sample was performed on a unique lane, with the condition that at least 80% of the generated bases must attain a quality score of at least 30, failing which the sample was re-sequenced. Each sample was also genotyped on the Illumina Omni2.5 M microarray, where genotype calling was performed with the proprietary GenomeStudio software by Illumina.
Read assembly and alignment
Assembly and alignment of each individual genome to the human reference genome (National Center for Biotechnology Information, NCBI build 37) was performed using the proprietary Illumina CASAVA version 1.9.0a1_110909 assembler. CASAVA aligned sequence reads using Eland v2e, and the aligned reads for each sample were then consolidated into the BAM format file [27].
Variant discovery
Two methods were used to call SNPs and indels: (i) single sample calling by CASAVA; and (ii) multi sample calling by GATK version 2.1.8 [28], [29] (see Supplementary Methods for details). We assessed the performance of both methods by comparing the concordance of the genotypes called by CASAVA and GATK with the genotypes reported in the Illumina Omni2.5 M array. We reported only variants that were identified by both CASAVA and GATK, but used the genotype calls from the software that yielded a higher concordance rate. SNP annotation was performed using SNPEff version 3.1 b [17], while the functional impact of the SNPs were predicted using both SIFT [30] and Polyphen [31] where a non-synonymous SNP was defined as damaging if SIFT yielded a score ≤0.05 and PolyPhen-2 yielded a score ≥0.95. We defined LOF SNPs as those that were annotated by SNPEff to be nonsense mutations, splice-site mutations, or frame-shifts caused by indels [2], and the Database for Annotation, DAVID [32] was used to identify biological pathways that were enriched with LOF SNPs in our samples. In addition, we mapped the LOF variants in our samples to the COSMIC [33], [34] and previous discoveries from GWAS [35] with the online SNPnexus platform [36] to identify any functional impact of these LOF SNPs. SVs were called with 4 methods: (i) BreakDancer v1.1._2011_02_21 [37]; (ii) VariationHunter Release_v0.3 [38]; (iii) Pindel version 0.2.2 [39]; and (iv) Delly v0.0.5 [40], although the focus was primarily on deletions. Large deletions of size 50 bp to 10 Mbp that were successfully called by at least one of the four algorithms were consolidated, whereby for structural deletions that were detected by multiple methods, the boundaries were obtained by considering the union of the deleted regions from these methods (see Supplementary Methods). A SNP or indel is defined to be novel if it is not present in dbSNP 137 or the SSMP [3], while a structural deletion is defined to be novel if there is less than 50% overlap with previously reported deletions in the SSMP, 1 KGP and DGV released 2013-07-23 [41].
Assessing population structure
PCA was used to assess the population structure of the SSIP samples with samples from worldwide populations using the pca option in the software eigenstrat [42]. As part of the sample QC process, a PCA was performed with 420,817 autosomal SNPs on the 38 SSIP samples and 268 samples from the SGVP [43] to ensure that the SSIP samples clustered together with the SGVP Indian samples. The SSIP samples that remained after QC were jointly analyzed with 96 samples from the SSMP and 1,092 samples from 14 populations in Phase 1 of 1 KGP in a PCA of the 16 populations on 217,302 SNPs (Table S1). A third PCA was performed with 202,600 SNPs on the SSIP samples with 132 South Asian samples from 25 well-defined Indian groups [44], where the latter samples can be broadly categorized into Southern Indians and Northern Indians according to the latitude of the sampling location (Table S2). To estimate the membership of each sample in the 16 populations to dominant population groups in the world, an admixture analysis was performed using ADMIXTURE version 1.22 program [45] with 6,519,079 autosomal SNPs, where the number of ancestral population (K) was set to range from 2 to 16.
Assessing population diversity
We measured the genetic diversity of SSIP, SSMP and 14 populations in Phase 1 of 1 KGP with a distance metric calculated between every possible pair of samples in each of the 16 populations, defined as , where min(S1,S2) is the minimun number of SNPs in two samples denoted as S1 and S2, and represents the number of SNPs present in both S1 and S2. A high D value thus reflects a lower degree of SNP sharing, or greater genetic heterogeneity, between the two samples; a low D value indicates that SNPs present in S1 are likely to be present in S2, thus reflecting greater genetic homogeneity between the two samples. To evaluate whether the number of samples in each population influenced the comparison, we additionally performed the analysis with the same number of samples selected randomly from each population. To ensure that the results of this analysis were robust to sequencing coverage and the method used for variant calling, we also measured D for samples from six populations in 1 KGP (CEU, CHB, JPT, LWK, TSI and YRI) that were sequenced by Complete Genomics [46] at a higher coverage of 51-fold to 89-fold (see Table S1). For each individual, we also measured the ratio of heterozygous genotypes to homozygous genotypes (Het/Hom) across all the autosomal SNPs. A population-level metric is calculated as the average of the Het/Hom across all the individuals in a specific population. This metric was similarly calculated with the same number of samples chosen randomly from each population, and including samples from Complete Genomics to calibrate against sequencing coverage and variant calling differences.
Mitochondria and chromosome Y haplogroup assignment
Every SSIP individual was assigned to a unique mitochondria haplogroup on the basis of the complete sequence of the mtDNA. This was performed with haplogrep with reference to PhyloTree mtDNA tree Build 15 [19], [45] using a FASTA-based input generated with the consensus calls from GATK and mpileup in SAMTOOLS [27] (see Supplementary Methods for details). Each of the 11 male subjects in SSIP was also assigned to a unique chromosome Y haplogroup defined using a maximum likelihood approach against the 2008 chromosome Y tree with Yfitter [47]. An input VCF file of the detected variants was generated with mpileup in SAMTOOLS, which was subsequently converted to the qcall input file used by Yfitter for haplogroup assignment. Default settings for Yfitter and haplogrep were used in our analyses.
Relatedness with ancient genomes
We evaluated the relative degree of relatedness between one SSIP sample (SSI033, chosen randomly) and a randomly chosen sample from each of the 15 populations (SSMP, 1 KGP) with an ancient genome using the Dstatistic metric [48]. Calculating this metric requires information at bi-allelic transversion substitutions as transition mutations are likely results of deamination of cytosine residues in ancient DNA [49] (denoted generically as alleles A and B) sites from two modern human genomes (G1, G2), an ancient genome (either Denisovan or Neanderthal) and the chimpanzee genome, and where NBABA denote the total number of sites where G1 and the ancient genome carried allele B while G2 and the chimpanzee genome carried allele A; and NABBA denote the total number of sites where G1 and the chimpanzee genome carried allele A while G2 and the ancient genome carried allele B. At sites where the ancient genome carries different alleles to the chimpanzee genome, Dstatistic thus measures the deviation in similarity between the ancient genome and each of the two modern genomes. The genome was divided into M non-overlapping blocks of 5 Mb and a jack-knife approach was used to calculate the mean, standard error and Z score of Dstatistic. Two ancient genomes were considered: (i) the Denisovan genome, sequenced on the Illumina Genome Analyzer IIx at a coverage of 30-fold [50]; and (ii) the Neanderthal genome, sequenced on the Illumina HiSeq at a coverage of 50-fold (http://www.eva.mpg.de/neandertal/index.html).
A full description of the Methods can be found in the Text S1 and Supplementary Methods at the SSIP website.
Supporting Information
Zdroje
1. MardisER (2011) A decade's perspective on DNA sequencing technology. Nature 470 : 198–203.
2. AbecasisGR, AutonA, BrooksLD, DePristoMA, DurbinRM, et al. (2012) An integrated map of genetic variation from 1,092 human genomes. Nature 491 : 56–65.
3. WongLP, OngRT, PohWT, LiuX, ChenP, et al. (2013) Deep whole-genome sequencing of 100 southeast Asian Malays. Am J Hum Genet 92 : 52–66.
4. MeyerM, KircherM, GansaugeMT, LiH, RacimoF, et al. (2012) A high-coverage genome sequence from an archaic Denisovan individual. Science 338 : 222–226.
5. GreenRE, KrauseJ, BriggsAW, MaricicT, StenzelU, et al. (2010) A draft sequence of the Neandertal genome. Science 328 : 710–722.
6. ReichD, GreenRE, KircherM, KrauseJ, PattersonN, et al. (2010) Genetic history of an archaic hominin group from Denisova Cave in Siberia. Nature 468 : 1053–1060.
7. KellerA, GraefenA, BallM, MatzasM, BoisguerinV, et al. (2012) New insights into the Tyrolean Iceman's origin and phenotype as inferred by whole-genome sequencing. Nat Commun 3 : 698.
8. DESA (2009) World population prospects: the 2008 revision. New York: Department for Economic and Social Affairs.
9. MacaulayV, HillC, AchilliA, RengoC, ClarkeD, et al. (2005) Single, rapid coastal settlement of Asia revealed by analysis of complete mitochondrial genomes. Science 308 : 1034–1036.
10. ThangarajK, ChaubeyG, KivisildT, ReddyAG, SinghVK, et al. (2005) Reconstructing the origin of Andaman Islanders. Science 308 : 996.
11. ReichD, ThangarajK, PattersonN, PriceAL, SinghL (2009) Reconstructing Indian population history. Nature 461 : 489–494.
12. MoorjaniP, ThangarajK, PattersonN, LipsonM, LohPR, et al. (2013) Genetic evidence for recent population mixture in India. Am J Hum Genet 93 : 422–438.
13. Singstat (2012) Population Trends 2012. Singapore: Department of Statistics.
14. Leow BG, Singapore. Dept. of Statistics. (2001) Census of population 2000. Demographic characteristics. Singapore: Dept. of Statistics. 142 pp.
15. Periasamy M (2007) Indian Migration into Malaya and Singapore During the British Period. Singapore: Biblioasia.
16. Turnbull CM (2009) A History of Modern Singapore. Singapore: National University of Singapore Press.
17. CingolaniP, PlattsA, WangLL, CoonM, NguyenT, et al. (2012) A program for annotating and predicting the effects of single nucleotide polymorphisms, SnpEff: SNPs in the genome of Drosophila melanogaster strain w1118; iso-2; iso-3;. Fly 6 : 80–92.
18. MacArthurDG, BalasubramanianS, FrankishA, HuangN, MorrisJ, et al. (2012) A systematic survey of loss-of-function variants in human protein-coding genes. Science 335 : 823–828.
19. Kloss-BrandstätterA, PacherD, SchönherrS, WeissensteinerH, BinnaR, et al. (2011) HaploGrep: a fast and reliable algorithm for automatic classification of mitochondrial DNA haplogroups. Human Mutation 32 : 25–32.
20. RajkumarR, BanerjeeJ, GunturiHB, TrivediR, KashyapVK (2005) Phylogeny and antiquity of M macrohaplogroup inferred from complete mt DNA sequence of Indian specific lineages. BMC Evol Biol 5 : 26.
21. van OvenM, KayserM (2009) Updated comprehensive phylogenetic tree of global human mitochondrial DNA variation. Hum Mutat 30: E386–394.
22. ChandrasekarA, KumarS, SreenathJ, SarkarBN, UradeBP, et al. (2009) Updating phylogeny of mitochondrial DNA macrohaplogroup m in India: dispersal of modern human in South Asian corridor. PLoS One 4: e7447.
23. MoorjaniP, ThangarajK, PattersonN, LipsonM, LohP-R, et al. (2013) Genetic Evidence for Recent Population Mixture in India. American journal of human genetics 93 : 422–438.
24. WallJD, YangMA, JayF, KimSK, DurandEY, et al. (2013) Higher Levels of Neanderthal Ancestry in East Asians than in Europeans. Genetics 194 : 199–209.
25. ChanSL, SuoC, LeeSC, GohBC, ChiaKS, et al. (2012) Translational aspects of genetic factors in the prediction of drug response variability: a case study of warfarin pharmacogenomics in a multi-ethnic cohort from Asia. Pharmacogenomics J 12 : 312–318.
26. ChanSL, SuoC, ChiaKS, TeoYY (2012) The population attributable fraction as a measure of the impact of warfarin pharmacogenetic testing. Pharmacogenomics 13 : 1247–1256.
27. LiH, HandsakerB, WysokerA, FennellT, RuanJ, et al. (2009) The Sequence Alignment/Map format and SAMtools. Bioinformatics 25 : 2078–2079.
28. DePristoMA, BanksE, PoplinR, GarimellaKV, MaguireJR, et al. (2011) A framework for variation discovery and genotyping using next-generation DNA sequencing data. Nat Genet 43 : 491–498.
29. McKennaA, HannaM, BanksE, SivachenkoA, CibulskisK, et al. (2010) The Genome Analysis Toolkit: A MapReduce framework for analyzing next-generation DNA sequencing data. Genome Research 20 : 1297–1303.
30. NgPC, HenikoffS (2003) SIFT: predicting amino acid changes that affect protein function. Nucleic Acids Research 31 : 3812–3814.
31. AdzhubeiI, SchmidtS, PeshkinL, RamenskyV, GerasimovaA, et al. (2010) A method and server for predicting damaging missense mutations. Nature methods 7 : 248–249.
32. Huang daW, ShermanBT, LempickiRA (2009) Bioinformatics enrichment tools: paths toward the comprehensive functional analysis of large gene lists. Nucleic Acids Res 37 : 1–13.
33. Forbes SA, Bhamra G, Bamford S, Dawson E, Kok C, et al.. (2008) The Catalogue of Somatic Mutations in Cancer (COSMIC). Curr Protoc Hum Genet Chapter 10: Unit 10 11.
34. ForbesSA, BindalN, BamfordS, ColeC, KokCY, et al. (2011) COSMIC: mining complete cancer genomes in the Catalogue of Somatic Mutations in Cancer. Nucleic Acids Res 39: D945–950.
35. HindorffLA, SethupathyP, JunkinsHA, RamosEM, MehtaJP, et al. (2009) Potential etiologic and functional implications of genome-wide association loci for human diseases and traits. Proc Natl Acad Sci U S A 106 : 9362–9367.
36. Dayem UllahAZ, LemoineNR, ChelalaC (2012) SNPnexus: a web server for functional annotation of novel and publicly known genetic variants (2012 update). Nucleic Acids Res 40: W65–70.
37. ChenK, WallisJW, McLellanMD, LarsonDE, KalickiJM, et al. (2009) BreakDancer: an algorithm for high-resolution mapping of genomic structural variation. Nat Meth 6 : 677–681.
38. HormozdiariF, HajirasoulihaI, DaoP, HachF, YorukogluD, et al. (2010) Next-generation VariationHunter: combinatorial algorithms for transposon insertion discovery. Bioinformatics 26: i350–i357.
39. YeK, SchulzMH, LongQ, ApweilerR, NingZ (2009) Pindel: a pattern growth approach to detect break points of large deletions and medium sized insertions from paired-end short reads. Bioinformatics 25 : 2865–2871.
40. RauschT, ZichnerT, SchlattlA, StützAM, BenesV, et al. (2012) DELLY: structural variant discovery by integrated paired-end and split-read analysis. Bioinformatics 28: i333–i339.
41. IafrateAJ, FeukL, RiveraMN, ListewnikML, DonahoePK, et al. (2004) Detection of large-scale variation in the human genome. Nat Genet 36 : 949–951.
42. PriceAL, PattersonNJ, PlengeRM, WeinblattME, ShadickNA, et al. (2006) Principal components analysis corrects for stratification in genome-wide association studies. Nat Genet 38 : 904–909.
43. TeoYY, SimX, OngRT, TanAK, ChenJ, et al. (2009) Singapore Genome Variation Project: a haplotype map of three Southeast Asian populations. Genome Res 19 : 2154–2162.
44. ReichD, ThangarajK, PattersonN, PriceAL, SinghL (2009) Reconstructing Indian population history. Nature 461 : 489–494.
45. AlexanderDH, NovembreJ, LangeK (2009) Fast model-based estimation of ancestry in unrelated individuals. Genome Research 19 : 1655–1664.
46. DrmanacR, SparksAB, CallowMJ, HalpernAL, BurnsNL, et al. (2010) Human Genome Sequencing Using Unchained Base Reads on Self-Assembling DNA Nanoarrays. Science 327 : 78–81.
47. Jostins L (2011) YFitter: a program for assigning haplogroups using maximum likelihood.
48. PattersonN, MoorjaniP, LuoY, MallickS, RohlandN, et al. (2012) Ancient Admixture in Human History. Genetics 192 : 1065–1093.
49. ReichD, GreenRE, KircherM, KrauseJ, PattersonN, et al. (2010) Genetic history of an archaic hominin group from Denisova Cave in Siberia. Nature 468 : 1053–1060.
50. MeyerM, KircherM, GansaugeM-T, LiH, RacimoF, et al. (2012) A High-Coverage Genome Sequence from an Archaic Denisovan Individual. Science 338 : 222–226.
Štítky
Genetika Reprodukční medicínaČlánek vyšel v časopise
PLOS Genetics
2014 Číslo 5
- Kazuistika – Perspektivy využití precizované medicíny v rámci personalizované specifické terapie onkologických pacientů
- Nobelova cena za chemii pro genetické nůžky: Objev, který změní naši budoucnost?
- Technologie na bázi RNA v klinické praxi: od přebarvených petúnií k terapii vzácných a dosud jen obtížně léčitelných chorob u lidí
- „Nepředstavovali jsme si, že náš výzkum povede přímo ke vzniku nových léků, dokonce ještě za našeho života“
- Bezplatné služby pro diagnostiku ATTRv amyloidózy pro kardiology
Nejčtenější v tomto čísle
- PINK1-Parkin Pathway Activity Is Regulated by Degradation of PINK1 in the Mitochondrial Matrix
- Null Mutation in PGAP1 Impairing Gpi-Anchor Maturation in Patients with Intellectual Disability and Encephalopathy
- Phosphorylation of a WRKY Transcription Factor by MAPKs Is Required for Pollen Development and Function in
- p53 Requires the Stress Sensor USF1 to Direct Appropriate Cell Fate Decision
Zvyšte si kvalifikaci online z pohodlí domova
Mazová zátka a její řešení
nový kurzVšechny kurzy