
The Spatiotemporal Program of DNA Replication Is Associated with Specific Combinations of Chromatin Marks in Human Cells
Replication is the mechanism by which genomes are duplicated into two exact copies. Genomic stability is under the control of a spatiotemporal program that orchestrates both the positioning and the timing of firing of about 50,000 replication starting points, also called replication origins. Replication bubbles found at origins have been very difficult to map due to their short lifespan. Moreover, with the flood of data characterizing new sequencing technologies, the precise statistical analysis of replication data has become an additional challenge. We propose a new method to map replication origins on the human genome, and we assess the reliability of our finding using experimental validation and comparison with origins maps obtained by bubble trapping. This fine mapping then allowed us to identify potential regulators of the replication dynamics. Our study highlights the key role of CpG Islands and identifies new potential epigenetic regulators (methylation of lysine 4 on histone H4, and tri-methylation of lysine 27 on histone H3) whose coupling is correlated with an increase in the efficiency of replication origins, suggesting those marks as potential key regulators of replication. Overall, our study defines new potentially important pathways that might regulate the sequential firing of origins during genome duplication.
Published in the journal:
. PLoS Genet 10(5): e32767. doi:10.1371/journal.pgen.1004282
Category:
Research Article
doi:
https://doi.org/10.1371/journal.pgen.1004282
Summary
Replication is the mechanism by which genomes are duplicated into two exact copies. Genomic stability is under the control of a spatiotemporal program that orchestrates both the positioning and the timing of firing of about 50,000 replication starting points, also called replication origins. Replication bubbles found at origins have been very difficult to map due to their short lifespan. Moreover, with the flood of data characterizing new sequencing technologies, the precise statistical analysis of replication data has become an additional challenge. We propose a new method to map replication origins on the human genome, and we assess the reliability of our finding using experimental validation and comparison with origins maps obtained by bubble trapping. This fine mapping then allowed us to identify potential regulators of the replication dynamics. Our study highlights the key role of CpG Islands and identifies new potential epigenetic regulators (methylation of lysine 4 on histone H4, and tri-methylation of lysine 27 on histone H3) whose coupling is correlated with an increase in the efficiency of replication origins, suggesting those marks as potential key regulators of replication. Overall, our study defines new potentially important pathways that might regulate the sequential firing of origins during genome duplication.
Introduction
The faithful duplication of mammalian genomes at each S phase is under the control of a spatiotemporal program that orchestrates and regulates both the positioning and the timing of firing of replication starting points also called replication origins. The molecular mechanisms involved in coordinating of the activation of 50,000 to 100,000 origins in each cell and at each cell cycle are still poorly understood, despite the need for a comprehensive understanding of these processes. Indeed, defects in the normal sequence of events leading to replication initiation may be directly responsible for genomic instability and/or the deregulation of differentiation programs. Consequently, the first and necessary step towards understanding this regulation is to refine our vision of the spatiotemporal replication program. For this reason several laboratories have chosen to map both the spatial and temporal programs of replication, in different systems and cell lines.
The temporal program of replication has been successfully analyzed in many laboratories with no particular controversy. By contrast, attempts to identify replication origins remain a subject of passionate debate in the field, as the intrinsic rarity of replication bubbles makes it difficult to purify the genomic material. The most popular method for mapping replication starting points in mammals is the purification of short nascent strands (SNS). Several laboratories have demonstrated that this purification requires the use of the -exonuclease to remove the high background due to broken genomic DNA [1]–[3]. The debate has been kept alive because previous studies that did not use -exonuclease [4] reported SNS levels incompatible with true initiation events [1], [5]. The debates then turned to the putative lack of overlap between datasets from different laboratories using SNS enrichment with exonuclease purification, even for the same cell line, suggesting that the method was probably inaccurate. However this argument is almost entirely based on a comparison of two data-sets for the same cell line [1], [6], but the results of the first study [6] have repeatedly been shown to display a marked lack of overlap with those of other studies, whereas the results of the second [1] overlap significantly with those of other studies [7], [8].
Agreement on a consensual protocol for SNS enrichment and quantification has also become a critical issue as the scale of investigation of replication origins has changed profoundly in recent years. Beginning with investigations of individual loci, and continuing with the microarray technology, there has recently been another technological shift in this field towards the use of ultra-deep sequencing [8]. Origin-omics has now become a way of thinking about replication that incorporates tens of thousands of loci embedded within various genomic landscapes. The emphasis also needs to shift from protocols to methods used for the analysis of genome-wide replication data. Indeed, despite a spectacular increase in the sensitivity of detection, Origin-omics is already subject to the same pitfalls as all other types of omics: the difficulty achieving an appropriate balance between the specificity and sensitivity of the analysis method. In a recent study based on the ultra-deep sequencing of SNS, origins were detected using chIP-Seq tools [9] for peak detection. This resulted in 250,000 identified origins in different human cell lines [10]. These predictions cover 6% of the human genome, with average origins length of 760 bp, that presumably includes most of the previously reported origins (except those reported in the above mentioned study [6], which should now reasonably be excluded). We noticed however one possible caveat in the use of chIP-Seq tools for the detection of replication origins based on sequenced SNS. Indeed, prior to the sequencing, SNS are first selected based on their size (about 1.5–2 kb). Hence the resolution of detection of replication origins cannot be less than this size. It is therefore possible that chIP-Seq tools tend to split the signal into multiple peaks and hence tend to overestimate the number of replication origins. In this work, we first address this issue of resolution of detection. We propose a peak-detection method that is adapted to the special case of SNS sequencing data, based on the prior control of the resolution of detection of exceptional local enrichments of reads. The method relies on sliding windows, the size of which is imposed by the size of the sequenced SNS fragments. We deal with multiple testing by providing a significance threshold that controls for false-positive detections, and that is adaptive to local coverage variations. The consensus on the SNS purification protocol made it possible to apply our method to our samples (K562 cells) and to published data [10] (from four different cell lines), which allows us to compare detection methods on SNS data.
Origin-omics shares another difficulty with other omics fields, which is the need for validation of genome-wide detections by an independent method. Very interestingly, the field has recently been enriched by another genome-wide map of replication origins obtained by bubble trapping [11], which is based on the sequencing of EcoR1 fragment containing at least one replication bubble. This new map consists of ∼125,000 EcoR1 fragments that cover 25% of the human genome. We took this opportunity to confront different genome-wide detections of replication origins based on different methods and protocols, which had never been done before. Comparisons between SNS-based origins and bubble trapping based origins on different cell lines show a good agreement between maps. Furthermore these comparisons indicate that the sensitivity and specificity of the detection of origins based on SNS data is significantly improved with our dedicated method compared to previously used chIP-Seq tools.
Now that a consensus set of replication origins has been identified, the time has come to unravel the genomic and epigenetic characteristics that make these particular loci replication origins. To proceed we focus on the connections between the spatial and temporal programs of replication at fine scales. It is now well established that genomes are organized into early-, mid - and late-replicating domains, and early domains have been shown to be associated with active epigenetic marks such as H3K4me1, 2 and 3, H3K27ac, H3K36me3 and H3K9ac [12]. However, different studies have generated conflicting results, demonstrating the difficulties involved in precisely defining the chromatin landscape of the domains replicated in mid - and late S-phase. The first genome-wide studies showed that late-replicating domains were weakly correlated with the repressive mark H3K9me2, but not with H3K27me3 [12]. This result conflicted with the finding of a previous study based on 1% of the human genome (ENCODE regions), which reported a strong correlation between late replication and H3K27me3 [13]. Finally, an association of H3K27me3 with mid-S phase-replicating chromosomal domains was recently demonstrated, together with a substantial correlation with early-replicating domains [14]. These results also highlight the difficulties involved in assessing the impact of specific modifications on normal S-phase progression. We hypothesize that the imprecise mapping of origin positions has hampered the search for specific epigenetic signatures. In this study we integrated data collected in several genome-wide studies aiming to map DNA replication timing domains and chromatin states. We provide unique datasets including origin position, efficiency and timing, and the local genomic characteristics of each origin (histone modifications, sequence characteristics). Overall, our findings make it possible to define new mechanisms potentially involved in defining of origin sub types activated sequentially during S phase.
Results
Sliding windows for the detection of significant read enrichments
OriSeq data analysis based on SNS material consists in detecting significant read enrichments corresponding to accumulations of SNS throughout the human genome. For a given origin, reads accumulate around the initiation starting point with a span determined by the size of the SNS fragments. It is important to notice that SNS are selected based on their size (between 1.5–2 kb), and then fragmented and sequenced. hence, for a given origin the resolution of detection can not be smaller than 1.5–2 kb. Tools for the detection of peak-like patterns in ChIP-Seq data, such as SoleSearch [9], [10], have been used for detection purposes, without controlling for the size of the peak, which results in peaks smaller than 1 kb on average (Table 1). In our method we control the resolution of detection by considering sliding windows of size 2 kb. Then we define an appropriate statistical model for discriminating between signal and noise and controlling for false-positive peaks, while accounting for the genome-ordered structure of the data. We used scan statistics by calculating the probability that the richest window corresponded to a false positive [15]. This approach is designed to avoid false-positive detections, and was calibrated adaptively to coverage variations to account for coverage heterogeneities along the genome (Figure 1-A). Using the scan method, we detected between 60,000 and 90,000 replication origins (depending on read depth), which cover ∼12% of the genome (Table 1). Details are provided in the Methods Section.


We first generated our SNS samples from K562 cell lines (see Materials and Methods) and we showed that the reproducibility of our detections was good, as of origins detected in one technical replicate are found in another (on K562 cells, Supp. Table S1), which actually corresponds to the technical reproducibility of origins detected by bubble trapping [11]. Then we investigated the quantitative properties of our analysis. In OriSeq data, which are obtained from populations of asynchronous cells, the number of reads for a detected origin reflects the percentage of cell cycles using this locus as a starting point for replication. The density of reads within an origin, therefore, constitutes a measurement of the efficiency of that origin. We assessed the precision of our method, by randomly selecting weak, intermediate and strong origins on the basis of read densities. We found that the number of reads detected for a given origin and the efficiency of that origin, as assessed by qPCR on an independent SNS preparation, were correlated (, , Figure 1-B). These experimental validations confirm that the set of replication origins detected by our method is likely to correspond to true positive initiation events.
Comparing genome-wide detections of replication origins: A matter of resolution
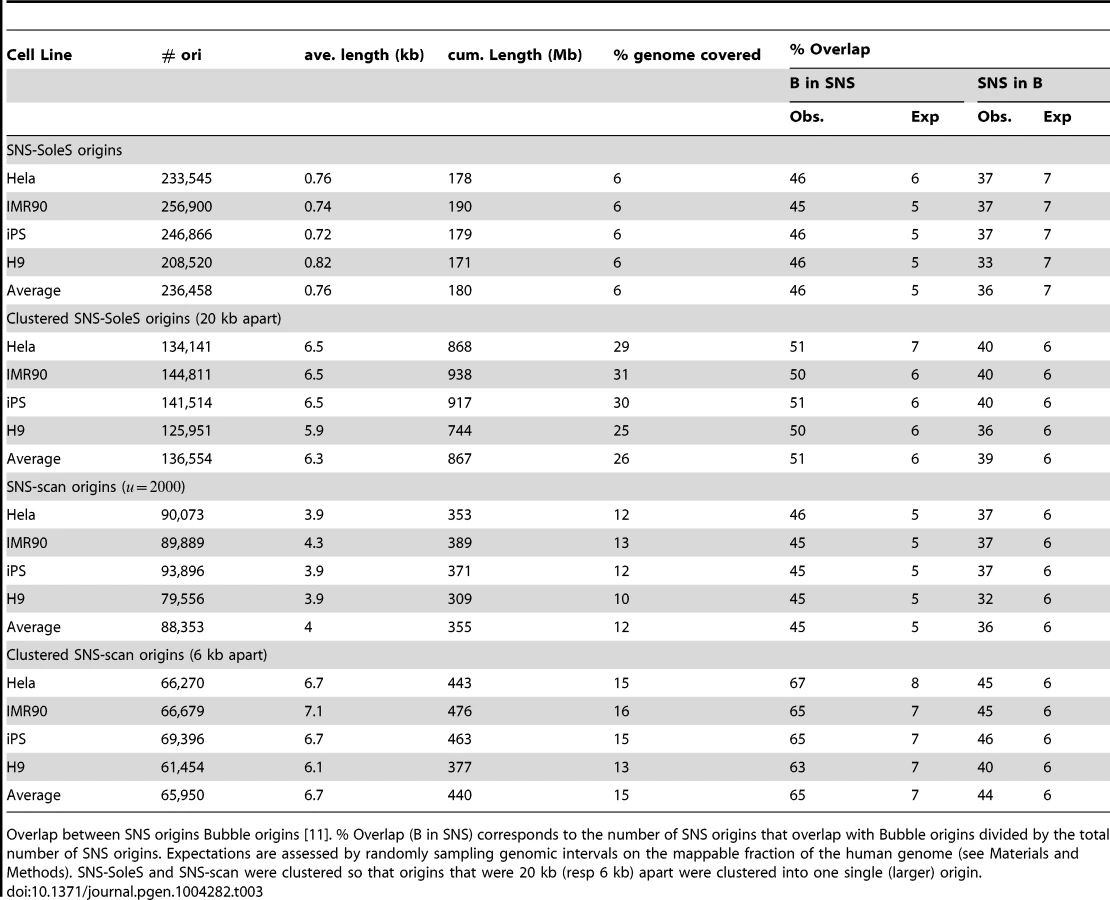
To evaluate the reproducibility of replication origin detections, we compared our results with those of two previously published studies [10], [11]. The first dataset was obtained with the same SNS purification protocol but in a different laboratory [10], on different cell lines (IMR-90, HeLa, human embryonic stem cell H9, induced pluripotent stem cells from IMR90 (IPS)). These datasets were comparable with ours, despite coverage differences (Table 1). In the original publication, detections were made using SoleSearch on these data [9]. For comparison we re-analyzed them using the scan method (Table 1). The second dataset corresponds to origins detected using bubble trapping, which is based on the sequencing of EcoR1 fragments containing at least one bubble (on GM06990 cells). In this case detections were based on a background read depth distribution [11]. For the sake of simplicity, the three data sets will be referred to as SNS-scan, SNS-SoleS and Bubble origins.
The three methods differ widely in the number of detected origins, with about 2 to 3 times more SNS-SoleS origins than Bubble and SNS-scan origins, even for data from the same cell lines (Table 1). SNS-SoleS origins are 760 bp long on average and cover ∼6% of the genome, whereas SNS-scan origins are longer (∼4 kb on average) and cover ∼12% of the genome, and Bubble origins (6.4 kb long on average) cover ∼25% of the genome (Table 1, Figure 1-C). The strong contrast between SNS-detected origins and Bubble origins reflects differences in the level of resolution of the methods: whereas SNS data allow the detection of origins at relatively high resolution (based on 1.5–2 kb fragments), the resolution of bubble trapping experiments is limited by the genomic density in EcoR1 restriction sites. For SNS data, the main difference between our scan approach and the SoleSearch method is that this latter does not control the level of resolution and hence tends to detect many small peaks. To compare datasets we computed the proportion of origins of a given dataset that overlap with origins of another dataset.
Comparison of peak detection methods on SNS data
In a first step we compared SNS-scan origins with SNS-SoleS origins on 4 different cell lines (Table 2). On average 70% of SNS-scan origins overlap with SNS-SoleS origins (on the same cell line) and 58% of SNS-SoleS origins overlap with SNS-scan origins, compared with 3–6% expected by chance (Table 2, the randomization procedure being detailed in the Methods section). Visual inspections suggested that in many cases, SNS-SoleS origins corresponded to multiple small peaks located within a same SNS-scan origin (Supp. Figure S1). To account for this difference in resolution, we clustered neighboring SNS-SoleS results so that origins from both methods have the same length on average (Table 2, Supp. Figure S1). By doing so, 71% SNS-scan origins overlap with (clustered) SNS-SoleS origins and 63% of SNS-SoleS origins overlap with SNS-scan origins. Thus, when compared at the same resolution, the overlap between methods is between 60 and 70%.

Comparison of SNS and Bubble trapping detections
Then we compared SNS origins with Bubble origins to assess the overlap between experimental protocols. Here 45–46% of SNS origins (SNS-SoleS or SNS-scan) overlap with Bubble origins and 36–37% of Bubble origins overlap with SNS origins (vs. 5–7% expected by chance, Table 3). Given the strong difference in resolution between the two methods (Table 1, Supp. Figure S1), we repeated the comparison after having clustered SNS origins (so that to obtain a resolution comparable to that of Bubble origins (Table 3). With this procedure, 65% (51%) of SNS-scan (SNS-SoleS) origins overlap with Bubble origins and 44% (37%) of Bubble origins overlap with SNS-scan (SNS-SoleS) origins, compared to 6–7% expected by chance (Table 3). We note that the cross-validation of SNS-detected origins by Bubble origin data is stronger when we used SNS-scan origins than SNS-SoleS origins, which suggests that the scan approach achieves a better sensitivity and specificity than SoleSearch. It should be noticed that the comparisons between replication origins detected by SNS or by bubble trapping were performed on different cell lines, and hence underestimate the true overlap between the different methods. The matter of resolution appears central in a fair comparison between datasets, and was partly assessed by considering clustered SNS origins. However the distributions of origins length still differ between methods, despite comparable on average (Figure 1-D). Nevertheless, this study demonstrates a good agreement between SNS-based and bubble trapping-based replication origin maps, with at least 65% of SNS origins confirmed by bubble trapping.
Most early origins are constitutive, efficient, and strongly associated with CGIs
The first attempts to unravel the spatial program of replication showed that replication origins were associated with specific genomic features, such as high GC content, CpG islands (CGIs) [1], [16], [17] and G-quadruplexes [10], [18]. Moreover, a recent study showed that origins could be divided into subgroups [10]: constitutive origins, which are common to all cell lines investigated; specific origins, which are found in only one cell type; and common origins, which are neither constitutive nor specific. This suggests that the same genomic and epigenomic constraints may apply to all constitutive origins (and possibly to other types of origins too).
We confirmed the strong overlap of datasets from different cell lines, as constitutive origins accounted for 57%, 35%, and 35% of origins in K562, HeLa and IMR90 cell lines respectively, whereas specific origins accounted for only 15, 13, and 9%. We then showed that the clustering of origins previously described [10] was specific to constitutive origins, as the size distribution was skewed towards large sizes (average sizes of 4.1 kb, 2.4 kb, 2.1 kb for constitutive, common and K562-Specific Oris, respectively, Supp. Figure S2), indicating that constitutive origins may present the highest density of initiation events.
We then connected the temporal and spatial programs of replication at fine scales, by assigning a temporal status to each origin on the basis of publicly available replication timing data [19]–[21], as explained in the Methods section. This made it possible to distinguish between origins activated in early S-phase (classes 1–2) and origins activated in mid - and late S-phase (classes 3–4 and 5–6, respectively). Most early origins (67%) were found to be constitutive, whereas late origins tended to be more cell type-specific (Figure 2-A for K562 cells, Supp. Figure S3-A for HeLa and IMR90 cells). This suggests that a large proportion of the origins replicated early in S phase are controlled by a highly robust combination of factors common to most cell lines.

We then focused on the strong overlap between replication origins and CGIs [1], [16], [17]. We showed that this enrichment was not homogeneous throughout S phase, as 32.5%, 15% and 8% of early, mid and late origins overlapped with CGIs, this enrichment being significant whatever the timing of replication, in the three cell lines investigated (Table 4). This suggests that CGIs intrinsically favor initiation activities. In addition, 86% of the origins associated with CGIs were constitutive origins (Figure 2-B, Supp. Figure S3-B). Read accumulation levels were much higher for CGI-constitutive origins (Figure 2-C, Supp. Figure S3-C), consistent with the larger size of the constitutive-CGI origins (Supp. Figure S2). Moreover, when considering origin efficiency, corresponding to the total number of reads divided by the length of the origin, origins were found to be more efficient in early S phase (as already reported [10], [16]), but we found that origins were more efficient when associated with CGIs (Figure 2-C, Supp. Figure S3-C).

As most CGIs overlap with promoters and transcriptional regulatory elements, we also analyzed the distribution of origins with respect to transcription start sites (TSSs). We also used maps of several chromatin states as a function of transcriptional activity [22] to evaluate the impact of transcription on the replication program. We found that 5 to 37% of origins were associated with a TSS in K562 cells, depending on the timing of replication (Table 4). Inactive poised promoters were poorly represented, whereas active and weak promoters were evenly distributed and significantly enriched in early S origins (Table 5). The association of many origins with weakly transcribed regions (39% of early origins and 19% of mid-S phase origins were found to be associated with chromHMM-11, Table 5) is also consistent with previous studies [16], [23] indicating that many initiation events take place within the body of genes. We also found associations between early origins and strong and weak poised enhancers (Table 5).

These results confirm the early data obtained with small fractions of the human and mouse genomes [1], [17] and indicate that the contribution of CGIs to the establishment of the spatiotemporal program of DNA replication extends to the whole genome, together with potential transcriptional regulatory elements. Moreover, the extension of the study to several cell lines showed that 42% of CGIs were very efficiently recognized as sites of replication initiation in all cell types, thus defining a very robust and efficient subset of replication origins with a tendency to fire early in S phase. The key role of CGIs was also highlighted by the clear increase in the percentage of CGIs overlapping at least one origin in one cell line with the number of cell lines investigated (Figure 2-D). With the datasets for five cell lines used here, we were able to associate ∼76% of CGIs with at least one origin, but the trend clearly suggests that most CGIs are potential origins of replication.
Association with ORC1 binding
ORC1 binding sites were recently mapped genome-wide in HeLa cells [7]. ORC1 is a subunit of the origin recognition complex (ORC) used as a landing platform for the assembly of a cascade of components that together form the prereplicative complex (pre-RC) in G1. Pre-RCs, including the core replicative helicase Mcm2–7, are sequentially activated during S phase. It has now been established that more pre-RCs are formed in G1 than are actually required in S phase. This redundancy has the advantage of providing “dormant origins”, which may be used in a fail-safe mechanism activated in the vicinity of arrested replication forks, to restart replication [24], [25]. Thus, this model predicts that more pre-RC (ORC1) binding sites than initiation sites should be mapped. However, only 13,604 ORC1-enriched peaks were identified [7], suggesting that the ORC1-ChIP experiment was not sensitive enough to detect every site of replication initiation and/or pre-RC formation. Nonetheless, the strong association with TSSs and known replication origins observed suggests that this new analysis identifies potential initiation sites (even though restricted to a subset). We, therefore, studied the association of ORC1 binding sites with replication origins observed in HeLa cells, and found that 44% (5,957) of ORC1 peaks were located within replication initiation sites (vs. 3%, as would be expected by chance). Given that the overlap between two anti-ORC1 ChIP-Seq replicates in HeLa cells was ∼60%, these results suggest that our SNS method is highly reliable for the determination of origin positions. The association of origins with ORC1 was stronger for constitutive origins (66% (3917) of ORC1 binding sites co-localize with constitutive origins, 30% and 4% for common and cell-specific origins respectively), consistent with the stronger Orc1-chIP signal for efficient origins (Figure 3-A). Consistently, ORC1-bound origins were found to be enriched in CGIs (60% are CGIs, and CGI-origins account for 16% of all origins), supporting a central role for CGIs in replication.
Origins are strongly associated with G-quadruplexes
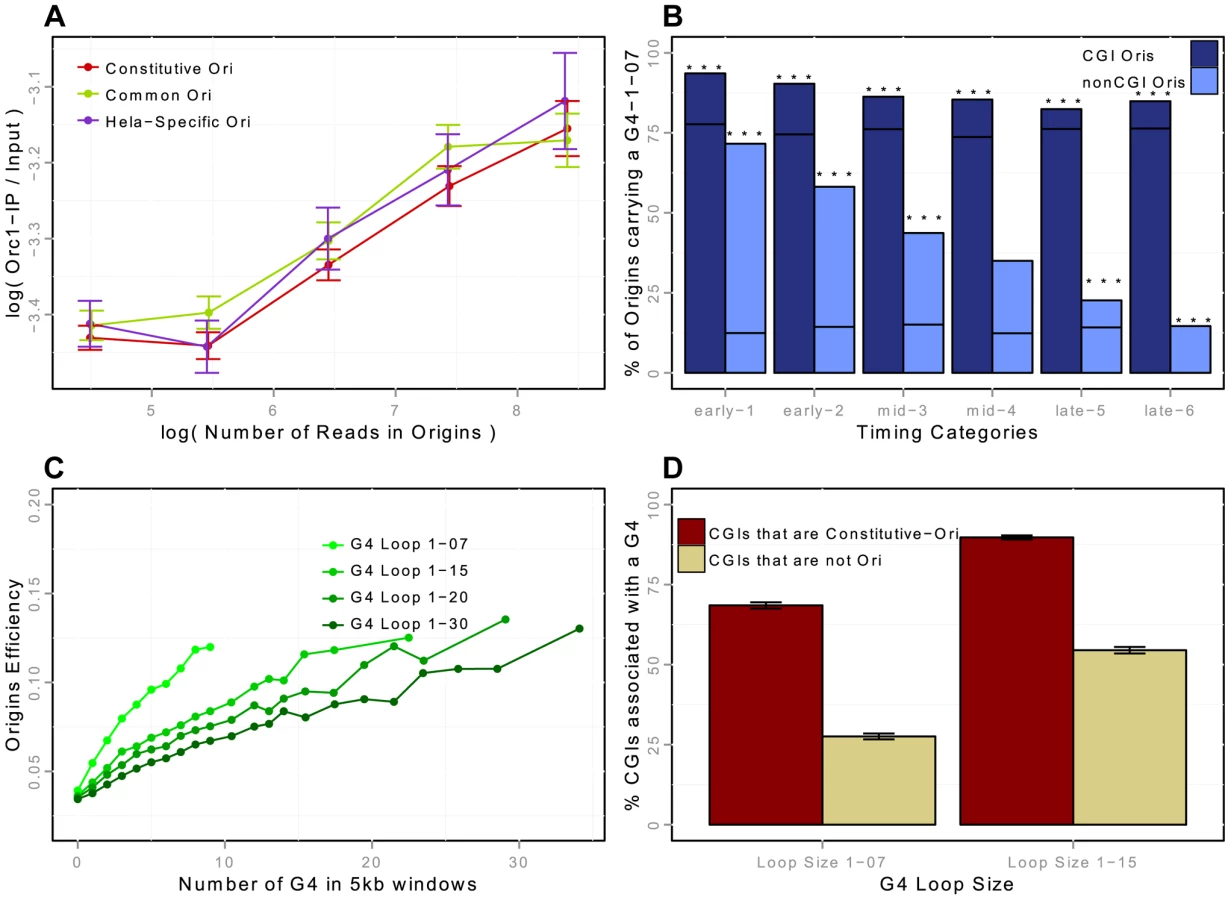
Two recent studies suggested that G-rich motifs capable of forming G-quadruplexes (G4s) are potential regulators of origin function [10], [18]. These motifs are able to form four-stranded DNA structures with loops of different sizes. We showed that the association of G4 with origins was dynamic and dependent on the association with CGIs: the enrichment in CGI-origins was higher than expected and remained high for origins of all replication timing groups, whereas the enrichment of non-CGI origins in G4 was also much higher than expected but was lower for late-replicating origins (Figure 3-B). We then assessed the impact of the size of the G4 loops on origin efficiency (Figure 3-C). We showed that the efficiency of replication origins increased with the local density of G4s (as measured by the number of G4s in a 5 kb window), and that G4s with short loops had a greater impact (Figure 3-C). This result is in agreement with the observation that on one model origin two G4 motifs cooperate to drive initiation very efficiently [26].
We investigated the importance of G4s for origin selection further, by determining whether CGIs associated with origins (Ori-CGIs) displayed a higher level of enrichment in G4s than CGIs not associated with origins (nonOri-CGIs). The human genome contains a total of 28,691 CGIs (from the UCSC database-hg19), 50% of which overlap with constitutive origins (76% overlapped with origins in at least one of the cell lines investigated). As mentioned above, constitutive origins are the most efficient and tend to fire in early S phase. We found that CGIs overlapping with constitutive origins displayed a greater enrichment in G4 L1–7 and L1–15 than nonOri-CGIs (Figure 3-D). This result again strongly supports the hypothesis that G4 L1–7 plays an important role in the control of origin selection.
Replication origins interact dynamically with histone marks at fine scales
Many studies have tried to decipher the roles of histone marks and nucleosomal organization in origin selection. However, our understanding of the complex relationships between chromatin states and replication has been limited by the scale of investigation, as all studies consider replication timing domains of 200 kb to 2 Mb, potentially resulting in a lack of resolution [27]–[30]. Moreover, origins of replication have been found embedded within many types of chromatin substrates [1], [31], [32], suggesting that any regulatory effect of chromatin structure would not be homogeneous across replication initiation sites. This was confirmed by studies in mouse Embryonic stem cells (ESCs) and neural precursor cells (NPCs), showing regions that replicate early to be enriched in open chromatin marks, such as H3K4me3 and H3K36me3 [33], whereas little (if any) association was detected with other marks, such as H3K27me3, H3K9me3 or H4K20me3. Investigations of the methylation of H4K20 have provided new insight. Several studies have shown that PR-Set7, which is involved in depositing the histone mark H4K20me1, plays a role in the control of origin firing [34]. These findings are consistent with recent data indicating that Suv4-20h plays a crucial role in the further methylation of H4K20me1 [35]. Nevertheless the fraction of replication origins that really do carry this mark (and are therefore potentially regulated by this modification) remains unknown.
Our study provides a unique framework for unraveling the connections between the fine-scale spatiotemporal program of replication and the landscape of chromatin modifications (links to chromatin data are provided in Supp. Table S3). The H4K20 monomethylation mark thought to control origin licensing has been shown to be associated with 50% of origins, this enrichment being significant for origins activated early or in mid-S (Figure 4-A and Table 6). The dynamic association of replication origins with open chromatin marks, such as H3K9ac, H3K4me3 and H2AZ, was strong (and significant) for origins replicated early in S phase, whereas origins activated in the second part of S phase were less associated with such marks (Figure 4-A and Table 6). We also found that these marks tended to be absent from late-activated origins, such as K562 cells (Table 6). Overall, 64% of origins carried none of these three open chromatin, indicating that most origins may not be directly driven by the presence of open chromatin marks, as previously proposed [1], [32].


The association with heterochromatin marks has been reported to be negatively correlated with replication timing. We, therefore, also investigated two histone marks known to be enriched in facultative and constitutive heterochromatin. Early origins displayed a significant depletion of H3K9me3, whereas late origins were characterized by a significant enrichment in this mark (Figure 4-A and Table 6). These results were confirmed by an independent study defining chromatin states (Table 5, HMM13). By contrast, we found that origins activated early and in mid-S phase were enriched in H3K27me3, which was thus associated with a large proportion of replication origins (40%) (Figure 4-A and Table 6). The association of this mark, deposited by PRC2 complexes, is confirmed by the strong overlap between H3K27me3 and Ezh2 responsible for the deposition of this mark (Table 6). These results were also confirmed by an independent study in which the polycomb-repressed chromatin state was annotated (Table 5), although the overlap with replication origins was weaker in this case.
We further focused on spatial interactions between marks that might characterize the temporal progression of replication. For each origin detected in K562 cells, we considered its linear distance to the closest mark, H2AZ, H4K20me1, H3K27me3, H3K9me3, H3K9ac or H3K4me3. We then used a discriminant analysis to identify combinations of chromatin marks that could discriminate (and thus characterize) early, mid - and late S-phase origins on the basis of their spatial co-localizations with replication origins. A complete description of the discriminant analysis is provided in the Methods section. A first combination of marks was characterized by the proximity of early origins to open chromatin marks (H2AZ, H3K9ac and H3K4me3) and H4K20me1. The distance between early origins and open marks increased with the progression of replication, whereas mid-S phase origins remain strongly associated with H4K20me1. Mid-S phase origins were also characterized by a strong association with H3K27me3, and the coupling of H4K20me1 and H3K27me3 with the exclusion of other marks constituted a strong characteristics of this category of origins. Finally the association with H3K9me3 was identified as characteristics of late origins, further from H4K20me1 and H3K27me3.
H4K20me1 and H3K27me3 as potential regulators of replication
Once we had elucidated the spatiotemporal interactions between origins and histone modifications, we further investigated whether they were associated with functional effects such as efficiency, length and density (Figure 4). We first investigated the responses to separate associations, and then studied the effect of combinations of marks. The separate analysis identified H4K20me1 and H3K27me3 as potential regulators of the replication program. When associated with CGIs, origins carrying these marks were characterized by a higher efficiency and length (Figure 4-B, C and Supp. Table S4), suggesting that they were associated with a larger number of initiation events. Colocalization with H4K20me1 and H3K27me3 was also associated with a higher density of origins (Figure 4-D, Supp. Table S5). By contrast, when associated with open marks, origins were less dense (Figure 4-D, Supp. Table S4), but their efficiency and length were not affected (Figure 4-B–C, Supp. Table S4), the slight effect on origin length observed in early S-phase being due to a high proportion of origins carrying both open chromatin marks and H4K20me1, as shown in Figure 5-A.

We then characterized the functional responses associated with marks combinations that we identified for early, mid-S phase and late origins. We found that H4K20me1 and open chromatin marks co-localize on 38% of early origins and 16% of for mid S-phase origins, this proportion being increased for CGI origins to 64% of early and 48% of mid-S phase origins, (Figure 5-A, Supp. Figure S4 for non-CGI origins). Moreover, H4K20me1 also colocalized with H3K27me3, particularly in origins activated in mid-S phase (Figure 5-A). These highly frequent colocalizations of marks were associated with different functional responses, as the coupling between H4K20me1 and H3K27me3 was the only combination to be associated with a significant increase in efficiency and density whatever the timing of replication (Figure 5-B–C, Supp. Table S5). The colocalization of H4K20me1 with open chromatin marks had very moderate additional effect over and above the separate effects of each mark (Figure 5-B–C, Supp. Table S5). The presence in ∼60% of origins of H4K20me1 or H3K27me3 (or both), and the strong functional responses associated with the colocalization of these marks suggests their potential importance in the control of the human genome replication program.
Discussion
We aimed to identify sets of replication origins in a reliable manner, paying particular attention to the development of tools with good specificity and sensitivity. By comparing raw datasets obtained in two independent laboratories applying the same protocol to five different cell lines, we validated the SNS enrichment method, showing it to be highly reproducible. Moreover, the comparison of SNS-based detections with bubble trapping-based detections shows the validity of genome-wide detections of replication origins by two independent protocols. By applying this method to the data obtained for five different cell lines, we identified a subclass of constitutive origins common to all five cell lines, constituting a very robust set of human replication origins. These origins were enriched in CGIs and almost all of the CGI-Oris found in a given cell type were found to be constitutive.
Identification of a consensus cis-element in replication origins
Origins overlapping with a CGI tended to be more efficient than non-CGI origins and were more abundant than would be expected on the basis of chance among the origins active in early S phase. This constitutes a subclass of origins playing an important role in establishing the spatiotemporal program of DNA replication. One key issue to be resolved concerns the way in which origins of this type are regulated. We investigated the characteristics making CGI active origins, by focusing on the differences between CGIs associated with origins (Ori-CGIs) and CGIs that were not associated with an origin (nonOri-CGIs). We found that Ori-CGIs were enriched in potential G4s L1–7, suggesting that G4s might be important cis-regulators of origin activity. This hypothesis was also supported by the observation that nonCGI-Oris also overlapped strongly with G4s. However, not all G4s are origins, suggesting that G4s are therefore not sufficient to induce the formation of an efficient origin.
We also performed genetic studies on one model origin, which confirmed that a structured G4 was important for origin activity and that this structured G4 had to cooperate with a 200 bp flanking cis-regulatory element to form a functional origin [26]. The cooperation with a flanking cis-module identified in one model origin added complexity to the origin signature, accounting for G4s not being systematically associated with origin function. We predict that the cooperating cis-module will act by binding transcription factors. Different classes of transcription factors may be involved, resulting in a complex signature motif for replication start sites. Taken together, our genome-wide and genetic studies and other published results [10], [18] suggest that G4s can be considered consensus cis-regulatory elements for replication origins in vertebrates. Further studies should search for trans-factors capable of recognizing structured G4s and, through this function, regulating origin function.
Are there key histone marks involved in origin function?
We also deciphered the epigenetic characteristics of the temporal program of replication, providing new insight to improve our understanding of the spatiotemporal regulation of origins. Our work provides the first genome-wide demonstration of the strong association between early-firing origins and open chromatin marks. Our study was mainly based on origins detected in K562 cells, but we also provide similar analysis on HeLa cells (Supp. Figures S5, S6, S7, S8, Supp. Table S6). Early-replicated origins are enriched in open chromatin marks (they have more such marks than origins of other timing categories), consistent with the findings of previous genetic studies showing that the deposition of open chromatin marks close to replication origins can impose early firing in vertebrates [36], [37]. Moreover, a recent study showed that a strong replication origin lying within a region that is naturally replicated in late S phase may be induced to replicate earlier in S phase by the presence of binding sites for the USF transcription factor [37]. This shift is local, because replicons located 50 kb away are not affected, and it is associated with the appearance of open chromatin marks at the shifted origin. We also found that early origins are enriched in binding sites for transcription factors known to recruit open chromatin marks, including USF (data not shown). Overall, the results of genetic and genome-wide studies suggest that the deposition of open chromatin marks may be an important pathway for the regulation of early firing in vertebrates. We also found that early-replicated origins were the most efficient and that most were constitutive. We suggest that the construction of large early-replicated domains is dependent on the overlap of very efficient origins (CGI origins) and the recruitment of open chromatin marks by transcriptional regulatory factors, the binding sites of which are highly abundant in these domains.
We identified new associations with combinations of chromatin marks for origins replicated in mid-S phase regions, corresponding to the colocalization of the polycomb mark H3K27me3 with H4K20me1. A positive correlation between the PcG-mediated H3K27me3 mark and late replication has been reported in Drosophila [38], but no correlation has yet been established in mammalian cells, with the exception of one study that explored only 1% of the human genome, the findings of which conflicted with those of other genome-wide analyses [13]. However an association of H3K27me3 with mid - S phase-replicating chromosomal domains was recently identified, although a substantial correlation with early-replicating domains was also described [14]. Likewise, a recent study demonstrated a direct role for Pc-G proteins in the regulation of late replication in Drosophila [39], and studies have provided strong support suggesting that this mark is important for the control of DNA replication particularly in mid-S phase [40], [41]. One study showed that Pc-G-mediated chromatin assembly occurs during the post-mitotic G1 phase in human cells and that the depletion of Suz12 (the essential non catalytic subunit of the enzyme responsible for the trimethylation of H3K27) in G1 impairs the progression of cells in the following S phase and, particularly, in mid/late S phase [40]. In another study on mouse embryos, the depletion of components of the PRC1 complex (Ring1 and Rnf2), which recognizes H3K27me3, was shown to block DNA synthesis in most two-cell embryos. Based on the appearance of H2AX foci in two-cell embryos, the authors also concluded that most depleted embryos did not finish S phase, suggesting their arrest in S phase [41]. Our study is the first to demonstrate a strong genome-wide association of H3K27me3 with replication origins activated in mid-S phase, suggesting that this mark is important for the control of DNA replication in mid-S phase in vertebrates. Moreover, we found that origins associated with this mark were generally more efficient and were embedded in regions with a higher density of replication origins (Figure 4-B), suggesting a regulatory role of this mark in origin selection. Further studies should focus on the local effect of this mark on origin firing.
Our results also highlight a potential key role of the H4K20me1 chromatin mark. It has already been suggested that the histone H4 Lys 20 methyltransferase PR-Set7 regulates replication origins in mammalian cells, based on the observations that 1) the onset of licensing coincides with an increase in H4K20me1 at known replication origins, and 2) PR-Set7 is normally degraded in S phase and the PR-Set7 mutant insensitive to this degradation displays the maintenance of H4K20me1 at replication origins and repeated DNA replication [34]. It has recently been shown that the function of PR-Set7 is dependent on the further methylation of H4K20me1 by Suv4-20h [35]. Thus, the regulation and timing of H4K20me1/2/3 is critical for the accurate regulation of origin firing. H4K20me1 mark deposition is the primary and necessary event leading to the trimethylated state. We investigated the statistical association of this monomethylation with replication origins and found a very strong coincidence of this mark with origins, suggesting that many replication origins may have the potential to be controlled by this modification. We also showed that origins carrying this mark were associated with increased efficiency and were located in regions with a higher density of potential origins. The next step in our investigations of this regulation will be the mapping of H4K20me1/2 and 3, genome-wide, during the different phases of the cell cycle crucial for origin preparation, from early G1 to late S phase. This work will provide insight into the relationship between the dynamics of H4K20 methylation and origin function.
Materials and Methods
SNS preparation, sequencing, and data access
Short nascent strands were purified as previously described [32], but with minor changes to the protocol. We pooled fractions 18 to 24. These fractions contained single-stranded DNA molecules of various sizes, from 1.5 to 2.5 kb. We used 500 U of a custom-made -exonuclease (Fermentas (50 U.l-1)) for each preparation. For the genome-wide mapping of origins, eight SNS preparations were obtained independently from cells each and then pooled. SNS were made double-stranded by random priming with the Klenow exo-polymerase ( EP0421, Fermentas) and random primers (48190011, Invitrogen). Adjacent strands were then ligated with Taq DNA Ligase (M0208L, Biolabs). Two libraries were constructed with Illumina protocols and five deep sequencing runs were performed with a Solexa/Illumina GA I genome analyzer generating 75 bp reads. SOAP (v2) software was used to map reads to the reference human hg19 genome with the following parameters: r:0, I:30 and v:5 command-line. Data were deposited in the Gene Expression Omnibus (http://www.ncbi.nlm.nih.gov/geo/query/acc.cgi?token=pzexhssiceikczw&acc=GSE46189).
Detection of replication origins with scan statistics
According to our detection model, read occurrences throughout the genome follow a Poisson distribution with a heterogeneous intensity that can be interpreted as the coverage process. We also assume that at a given position t along the genome, the number of reads follows a geometric distribution . We then consider , which counts the number of reads along the genome and, to detect local exceptional read accumulations, we compute , which quantifies the number of reads within a window of size u = 2 kb. For calculations of the the significance threshold for detection, we used scanning statistic results for compound distributions, making it possible to calculate the probability of the richest window actually being a false positive [15]. The detection is performed at level by setting threshold such that . To account for coverage heterogeneities, we segment the coverage process () into regions of constant intensities (constant ). We use a segmentation model for this purpose, based on the Poisson distribution adapted from segmentation models for array CGH data analysis [42]. This segmentation step has two main advantages: First, it automatically detects regions of constant coverage (constant ) and regions with extremely low coverage that are excluded from the study. Second, it allows our significance thresholds to adapt to coverage variations. An example of detection is provided in Figure 1-A. Our method is available at http://pbil.univ-lyon1.fr/members/fpicard/research.html. Threshold was calibrated using independent input DNA from public databases since input DNA was not available at the time of the experiment. We applied the detection method to input DNA and we assessed the percentage of nucleotides detected as origins in the SNS data that were also detected as peaks in the input DNA data (Supp. Table S2). We chose which corresponds to an estimated false discovery rate of 4%, 10% and 18% for K562, IMR90, and HeLa cells. This constitutes an overestimation of the false discovery rate of detection since origins detected in peak-assigned regions of the input-DNA are not necessarily false positives.
Genomic and chromatin feature extraction
TSS, CpG islands, and chromatin mark positions were downloaded from the UCSC Genome Browser (http://genome.ucsc.edu/). Details on the datasets are provided in Supp. Table S3. The positions of G-quadruplexes were determined by applying Quadparser on hg19 [43], specifying the length of the spacer between 4 tracks of GGG or CCC with spacer of size 1–7, 1–15, 1–20, and 1–30. All results and tables can be downloaded from http://pbil.univ-lyon1.fr/members/fpicard/research.html.
Determining mean replication timing profiles
We determined the mean replication timing profiles throughout the complete human genome from Repli-Seq data [19], [21], as previously described [44]. Repli-Seq tags for six FACS fractions were downloaded from the NCBI SRA website (study accession number: SPR0013933) for the erythroid K562 cell line, and from the UCSC ENCODE website http://hgdownload.cse.ucsc.edu/goldenPath/hg19/encodeDCC/wgEncodeUwRepliSeq/for the IMR90 fetal lung fibroblast cell line. For the HeLa cell line, we calculated the mean replication timing (MRT) rather than the S50 (median replication timing) [19], [20]. Timing categories were determined by dividing timing values into 6 intervals (, , early origins, , , mid-S origins, , , late origins).
Randomization procedure
We used a randomization procedure to assess the expected overlap between origins of replications detected by SoleSearch, scan, and by bubble trapping. To compute the expected overlap between SNS-SoleS and SNS-scan origins (SoleS in scan, Table 2), we randomly sampled genomic intervals on the mappable fraction of the human genome that were excluding SNS-SoleS origins. The number of sampled intervals was the same as the number of SNS-SoleS origins, and we sampled 50 sets of such random origins. The overlap of SNS-scan with sampled intervals was used to assess the expected SoleS in scan overlap. To assess the scan in SoleS overlap, genomic intervals excluding SNS-scan origins were sampled. The procedure was similar to compute the expected overlap between Bubble and SNS origins.
We also used a randomization procedure to determine whether the association of replication origins with genomic features (such as CGIs, chromatin marks, Gquadruplex motifs) was significantly more frequent than would be expected by chance alone. For a given cell line, we compared the observed proportion of replication origins overlapping a given genomic feature with the expected proportion calculated from genomic intervals randomly sampled from throughout the genome. We excluded the replication origins we detected and the non mappable regions of the human genome as provided by the 1,000 Genomes Project [45], and we sampled 100,000 random intervals of the same length as origins of replication, on average. This procedure was repeated 1,000 times, to account for different sequence characteristics (such as gene density, or GC content). When replication timing was considered, the timing of replication for randomly sampled origins was determined from published timing data [21]. Random intervals were considered to be associated with genomic features if their intervals overlapped.
Discriminant analysis for determining combination of marks
We consider a linear discriminant analysis to find a linear combination of chromatin features which characterize early, mid-S phase and late origins [46]. We consider the data matrix with rows corresponding to origins detected in K562 cells and columns corresponding to linear distances to chromatin marks (datasets links are provided in Supp. Table S3). The interpretation of a discriminant analysis is based on two key ingredients (similarly to Principal Component Analysis): the position of the origins on the discriminant axis (Figure 6-A) and the correlations of the chromatin features with the discriminant axis (Figure 6-B,C). DA1 is the discriminant axis best discriminating between timing categories. It comprises the distances of origins to open chromatin marks (negative correlation with distances to H2AZ, H3k9ac, H3k4me3) and to H4k20me1/H3K27me3 (Table 7). This indicates that the temporal decrease observed along DA-1 (Figure 6-A) corresponded to an increase in the distance to these marks. Consequently, the first combination of chromatin marks that emerged was the proximity of open chromatin marks and H4K20me1 to early origins. The second axis (DA2) illustrates the opposition between H3K9me3 and other marks, and shows a different pattern between mid and late origins. Mid origins have a lower coordinate on DA2 (Figure 6-A), which corresponds to a smaller distance to H3K27me3/H4K20me1. DA2 was controlled by a positive correlation with the distance to H3K27me3/H4K20me1 (and to a lesser extent to H2AZ), along with a strong negative correlation with the distance to H3K9me3 (Table 7). Thus the proximity of origins to H3K27me3 and H4K20me1 emerged as a marks combination for mid-S phase origins. Finally late origins have a higher coordinate on DA2 (Figure 6-A), which corresponds to a smaller distance to H3K9me3.


Supporting Information
Zdroje
1. CadoretJC, MeischF, Hassan-ZadehV, LuytenI, GuilletC, et al. (2008) Genome-wide studies highlight indirect links between human replication origins and gene regulation. Proc Natl Acad Sci USA 105 : 15837–15842.
2. CayrouC, GregoireD, CoulombeP, DanisE, MechaliM (2012) Genome-scale identification of active DNA replication origins. Methods 57 : 158–164.
3. GerbiSA, BielinskyAK (1997) Replication initiation point mapping. Methods 13 : 271–280.
4. LucasI, PalakodetiA, JiangY, YoungDJ, JiangN, et al. (2007) High-throughput mapping of origins of replication in human cells. EMBO Rep 8 : 770–777.
5. CadoretJC, PrioleauMN (2010) Genome-wide approaches to determining origin distribution. Chromosome Res 18 : 79–89.
6. KarnaniN, TaylorCM, MalhotraA, DuttaA (2010) Genomic study of replication initiation in human chromosomes reveals the inuence of transcription regulation and chromatin structure on origin selection. Mol Biol Cell 21 : 393–404.
7. DellinoGI, CittaroD, PiccioniR, LuziL, BanfiS, et al. (2013) Genome-wide mapping of hu-man DNA-replication origins: levels of transcription at ORC1 sites regulate origin selection and replication timing. Genome Res 23 : 1–11.
8. GilbertDM (2012) Replication origins run (ultra) deep. Nat Struct Mol Biol 19 : 740–742.
9. BlahnikKR, DouL, O'GeenH, McPhillipsT, XuX, et al. (2010) Sole-Search: an integrated analysis program for peak detection and functional annotation using ChIP-seq data. Nucleic Acids Res 38: e13.
10. BesnardE, BabledA, LapassetL, MilhavetO, ParrinelloH, et al. (2012) Unraveling cell type-specific and reprogrammable human replication origin signatures associated with G-quadruplex consensus motifs. Nat Struct Mol Biol 19 : 837–844.
11. MesnerLD, ValsakumarV, CieslikM, PickinR, HamlinJL, et al. (2013) Bubble-seq analysis of the human genome reveals distinct chromatin-mediated mechanisms for regulating early - and late-firing origins. Genome Res 23 : 1774–1788.
12. RybaT, HirataniI, LuJ, ItohM, KulikM, et al. (2010) Evolutionarily conserved replication timing profiles predict long-range chromatin interactions and distinguish closely related cell types. Genome Res 20 : 761–770.
13. ThurmanRE, DayN, NobleWS, StamatoyannopoulosJA (2007) Identification of higher-order functional domains in the human ENCODE regions. Genome Res 17 : 917–927.
14. ChandraT, KirschnerK, ThuretJY, PopeBD, RybaT, et al. (2012) Independence of repressive histone marks and chromatin compaction during senescent heterochromatic layer formation. Mol Cell 47 : 203–214.
15. ChanH, ZhangN (2007) Scan statistics with weighted observations. Journal of the American Statistical Association 102 : 595–602.
16. CayrouC, CoulombeP, VigneronA, StanojcicS, GanierO, et al. (2011) Genome-scale analysis of metazoan replication origins reveals their organization in specific but flexible sites defined by conserved features. Genome Res 21 : 1438–1449.
17. Sequeira-MendesJ, Diaz-UriarteR, ApedaileA, HuntleyD, BrockdorffN, et al. (2009) Tran-scription initiation activity sets replication origin efficiency in mammalian cells. PLoS Genet 5: e1000446.
18. CayrouC, CoulombeP, PuyA, RialleS, KaplanN, et al. (2012) New insights into replication origin characteristics in metazoans. Cell Cycle 11 : 658–667.
19. ChenCL, RappaillesA, DuquenneL, HuvetM, GuilbaudG, et al. (2010) Impact of replication timing on non-CpG and CpG substitution rates in mammalian genomes. Genome Res 20 : 447–457.
20. GuilbaudG, RappaillesA, BakerA, ChenCL, ArneodoA, et al. (2011) Evidence for sequential and increasing activation of replication origins along replication timing gradients in the human genome. PLoS Comput Biol 7: e1002322.
21. HansenRS, ThomasS, SandstromR, CanfieldTK, ThurmanRE, et al. (2010) Sequencing newly replicated DNA reveals widespread plasticity in human replication timing. Proc Natl Acad Sci USA 107 : 139–144.
22. ErnstJ, KheradpourP, MikkelsenTS, ShoreshN, WardLD, et al. (2011) Mapping and analysis of chromatin state dynamics in nine human cell types. Nature 473 : 43–49.
23. NecsuleaA, GuilletC, CadoretJC, PrioleauMN, DuretL (2009) The relationship between DNA replication and human genome organization. Mol Biol Evol 26 : 729–741.
24. GeXQ, JacksonDA, BlowJJ (2007) Dormant origins licensed by excess Mcm2–7 are required for human cells to survive replicative stress. Genes Dev 21 : 3331–3341.
25. IbarraA, SchwobE, MendezJ (2008) Excess MCM proteins protect human cells from replicative stress by licensing backup origins of replication. Proc Natl Acad Sci USA 105 : 8956–8961.
26. ValtonAL, Hassan-ZadehV, LemaI, BoggettoN, AlbertiP, et al. (2014) G4 motifs affect origin positioning and efficiency in two vertebrate replicators. EMBO J in press.
27. AuditB, BakerA, ChenCL, RappaillesA, GuilbaudG, et al. (2013) Multiscale analysis of genome-wide replication timing profiles using a wavelet-based signal-processing algorithm. Nat Protoc 8 : 98–110.
28. AuditB, ZaghloulL, VaillantC, ChevereauG, d'Aubenton CarafaY, et al. (2009) Open chromatin encoded in DNA sequence is the signature of ‘master’ replication origins in human cells. Nucleic Acids Res 37 : 6064–6075.
29. HamlinJL, MesnerLD, LarO, TorresR, ChodaparambilSV, et al. (2008) A revisionist replicon model for higher eukaryotic genomes. J Cell Biochem 105 : 321–329.
30. McNairnAJ, GilbertDM (2003) Epigenomic replication: linking epigenetics to DNA replication. Bioessays 25 : 647–656.
31. GayS, LachagesAM, MillotGA, CourbetS, LetessierA, et al. (2010) Nucleotide supply, not local histone acetylation, sets replication origin usage in transcribed regions. EMBO Rep 11 : 698–704.
32. PrioleauMN, GendronMC, HyrienO (2003) Replication of the chicken beta-globin locus: early - firing origins at the 5′ HS4 insulator and the rho - and betaA-globin genes show opposite epigenetic modifications. Mol Cell Biol 23 : 3536–3549.
33. HirataniI, RybaT, ItohM, YokochiT, SchwaigerM, et al. (2008) Global reorganization of repli-cation domains during embryonic stem cell differentiation. PLoS Biol 6: e245.
34. TardatM, BrustelJ, KirshO, LefevbreC, CallananM, et al. (2010) The histone H4 Lys 20 methyltransferase PR-Set7 regulates replication origins in mammalian cells. Nat Cell Biol 12 : 1086–1093.
35. BeckDB, BurtonA, OdaH, Ziegler-BirlingC, Torres-PadillaME, et al. (2012) The role of PR-Set7 in replication licensing depends on Suv4-20h. Genes Dev 26 : 2580–2589.
36. GorenA, TabibA, HechtM, CedarH (2008) DNA replication timing of the human beta-globin domain is controlled by histone modification at the origin. Genes Dev 22 : 1319–1324.
37. Hassan-ZadehV, ChilakaS, CadoretJC, MaMK, BoggettoN, et al. (2012) USF binding sequences from the HS4 insulator element impose early replication timing on a vertebrate replicator. PLoS Biol 10: e1001277.
38. EatonML, PrinzJA, MacAlpineHK, TretyakovG, KharchenkoPV, et al. (2011) Chromatin signatures of the Drosophila replication program. Genome Res 21 : 164–174.
39. Lo SardoF, LanzuoloC, ComoglioF, De BardiM, ParoR, et al. (2013) PcG-mediated higher-order chromatin structures modulate replication programs at the Drosophila BX-C. PLoS Genet 9: e1003283.
40. AotoT, SaitohN, SakamotoY, WatanabeS, NakaoM (2008) Polycomb group protein-associated chromatin is reproduced in post-mitotic G1 phase and is required for S phase progression. J Biol Chem 283 : 18905–18915.
41. PosfaiE, KunzmannR, BrochardV, SalvaingJ, CabuyE, et al. (2012) Polycomb function during oogenesis is required for mouse embryonic development. Genes Dev 26 : 920–932.
42. PicardF, RobinS, LavielleM, VaisseC, DaudinJJ (2005) A statistical approach for array CGH data analysis. BMC Bioinformatics 6 : 27.
43. HuppertJL, BalasubramanianS (2005) Prevalence of quadruplexes in the human genome. Nucleic Acids Res 33 : 2908–2916.
44. BakerA, AuditB, ChenCL, MoindrotB, LeleuA, et al. (2012) Replication fork polarity gradients revealed by megabase-sized U-shaped replication timing domains in human cell lines. PLoS Comput Biol 8: e1002443.
45. AbecasisGR (2012) An integrated map of genetic variation from 1,092 human genomes. Nature 491 : 56–65.
46. Le CaoKA, BoitardS, BesseP (2011) Sparse PLS discriminant analysis: biologically relevant feature selection and graphical displays for multiclass problems. BMC Bioinformatics 12 : 253.
47. GiardineB, RiemerC, HardisonRC, BurhansR, ElnitskiL, et al. (2005) Galaxy: a platform for interactive large-scale genome analysis. Genome Res 15 : 1451–1455.
Štítky
Genetika Reprodukční medicínaČlánek vyšel v časopise
PLOS Genetics
2014 Číslo 5
- Kazuistika – Perspektivy využití precizované medicíny v rámci personalizované specifické terapie onkologických pacientů
- Nobelova cena za chemii pro genetické nůžky: Objev, který změní naši budoucnost?
- Technologie na bázi RNA v klinické praxi: od přebarvených petúnií k terapii vzácných a dosud jen obtížně léčitelných chorob u lidí
- „Nepředstavovali jsme si, že náš výzkum povede přímo ke vzniku nových léků, dokonce ještě za našeho života“
- Bezplatné služby pro diagnostiku ATTRv amyloidózy pro kardiology
Nejčtenější v tomto čísle
- PINK1-Parkin Pathway Activity Is Regulated by Degradation of PINK1 in the Mitochondrial Matrix
- Null Mutation in PGAP1 Impairing Gpi-Anchor Maturation in Patients with Intellectual Disability and Encephalopathy
- Phosphorylation of a WRKY Transcription Factor by MAPKs Is Required for Pollen Development and Function in
- p53 Requires the Stress Sensor USF1 to Direct Appropriate Cell Fate Decision
Zvyšte si kvalifikaci online z pohodlí domova
Mazová zátka a její řešení
nový kurzVšechny kurzy