
Recent Mitochondrial DNA Mutations Increase the Risk of Developing Common Late-Onset Human Diseases
There is a growing body of evidence indicating that mitochondrial dysfunction, a result of genetic variation in the mitochondrial genome, is a critical component in the aetiology of a number of complex traits. Here, we take advantage of recent technical and methodological advances to examine the role of common mitochondrial DNA variants in several complex diseases. By examining over 50,000 individuals, from 11 different diseases we show that mitochondrial DNA variants can both increase or decrease an individual's risk of disease, replicating and expanding upon several previously reported studies. Moreover, by analysing several large disease groups in tandem, we are able to show a commonality of association, with the same mitochondrial DNA variants associated with several distinct disease phenotypes. These shared genetic associations implicate a shared underlying functional effect, likely changing cellular energy, which manifests as distinct phenotypes. Our study confirms the important role that mitochondrial DNA variation plays on complex traits and additionally supports the utility of a GWAS-based approach for analysing mitochondrial genetics.
Published in the journal:
. PLoS Genet 10(5): e32767. doi:10.1371/journal.pgen.1004369
Category:
Research Article
doi:
https://doi.org/10.1371/journal.pgen.1004369
Summary
There is a growing body of evidence indicating that mitochondrial dysfunction, a result of genetic variation in the mitochondrial genome, is a critical component in the aetiology of a number of complex traits. Here, we take advantage of recent technical and methodological advances to examine the role of common mitochondrial DNA variants in several complex diseases. By examining over 50,000 individuals, from 11 different diseases we show that mitochondrial DNA variants can both increase or decrease an individual's risk of disease, replicating and expanding upon several previously reported studies. Moreover, by analysing several large disease groups in tandem, we are able to show a commonality of association, with the same mitochondrial DNA variants associated with several distinct disease phenotypes. These shared genetic associations implicate a shared underlying functional effect, likely changing cellular energy, which manifests as distinct phenotypes. Our study confirms the important role that mitochondrial DNA variation plays on complex traits and additionally supports the utility of a GWAS-based approach for analysing mitochondrial genetics.
Introduction
Mitochondria are the principal source of cellular adenosine triphosphate (ATP) generated through oxidative phosphorylation (OXPHOS), which is linked to the respiratory chain. In humans, thirteen OXPHOS proteins are synthesised from the 16.5 Kb mitochondrial genome (mtDNA). MtDNA has accumulated genetic variants over time, and being strictly maternally inherited, undergoes negligible intermolecular recombination. As a consequence, ancient variants extant in the human population define haplogroups that have remained geographically or ethnically restricted [1]. Work on European haplogroups has shown that some polymorphic mtDNA variants affect mitochondrial function [2], [3].
Given emerging evidence that mitochondria play a key role in several common diseases, it is likely that variation of mtDNA could alter the risk of developing different human disorders. Early mtDNA genetic association studies were under-powered, and the vast majority have not been replicated [4]. However, some recent large studies have found replicable associations with specific human diseases [5]–[11], most notably in sporadic Parkinson's disease [12]–[14]. These observations implicate mtDNA as part of the “missing heritability” of complex human disease traits.
Ultimately, mtDNA codes for a limited number of proteins that affect the same common pathway of energy production implicated in several human diseases. It is likely, therefore, that functional genetic variation of mtDNA will have impact on more than one disease – but this has not been directly studied before. To test this hypothesis, we analysed mtDNA SNP data from 51,106 subjects from the Wellcome Trust Case Control Consortium, comparing genotypes from 11 major diseases: ankylosing spondylitis (AS, n = 2,005), ischemic stroke (IS, n = 4,205), multiple sclerosis (MS, n = 11,377), Parkinson's disease (PD, n = 2,197), primary biliary cirrhosis (PBC, n = 1,921), psoriasis (PS, n = 2,622), schizophrenia (SP, n = 2,019), ulcerative colitis (UC, n = 2,869), coronary artery disease (CAD, n = 3,215), hypertension (HT, n = 2,943) and type-2 diabetes (T2D, n = 2,975) to three independent control groups genotyped on the same platforms (WTCCC-58C, n = 2997, WTCCC-NBS, n = 2897 and WTCCC2-MetabaloChip, n = 5841).
Results
Common mtDNA variants are associated with common disease
After applying stringent quality control measures (Supplementary Materials, Table S1 & S2), we initially compared the two healthy control groups using PLINK v2.050 [15] (Supplementary Materials, Figure S1), and found no significant difference in allele frequencies. We therefore merged control groups genotyped on the same platform for all subsequent analyses as follows: WTCCC-Control-1, WTCCC-Control-2 and WTCCC-Control-3 (Supplementary Materials, Table S2).
Cluster plots produced by principle component analysis (PCA) revealed no significant population stratification when comparing either: datasets from the same array or array-specific control datasets (Supplementary Materials, Figure S4).
We then compared genotyped SNPs in each disease group to platform-matched control datasets using PLINK v2.050 [15] (Figure 1 & Supplementary Materials, Table S3). This confirmed previously reported associations at the low-resolution haplogroup level [5], [12], [16], [17], endorsing the methodological approach.

Phylogenetically-related mtDNA variants are associated with common disease
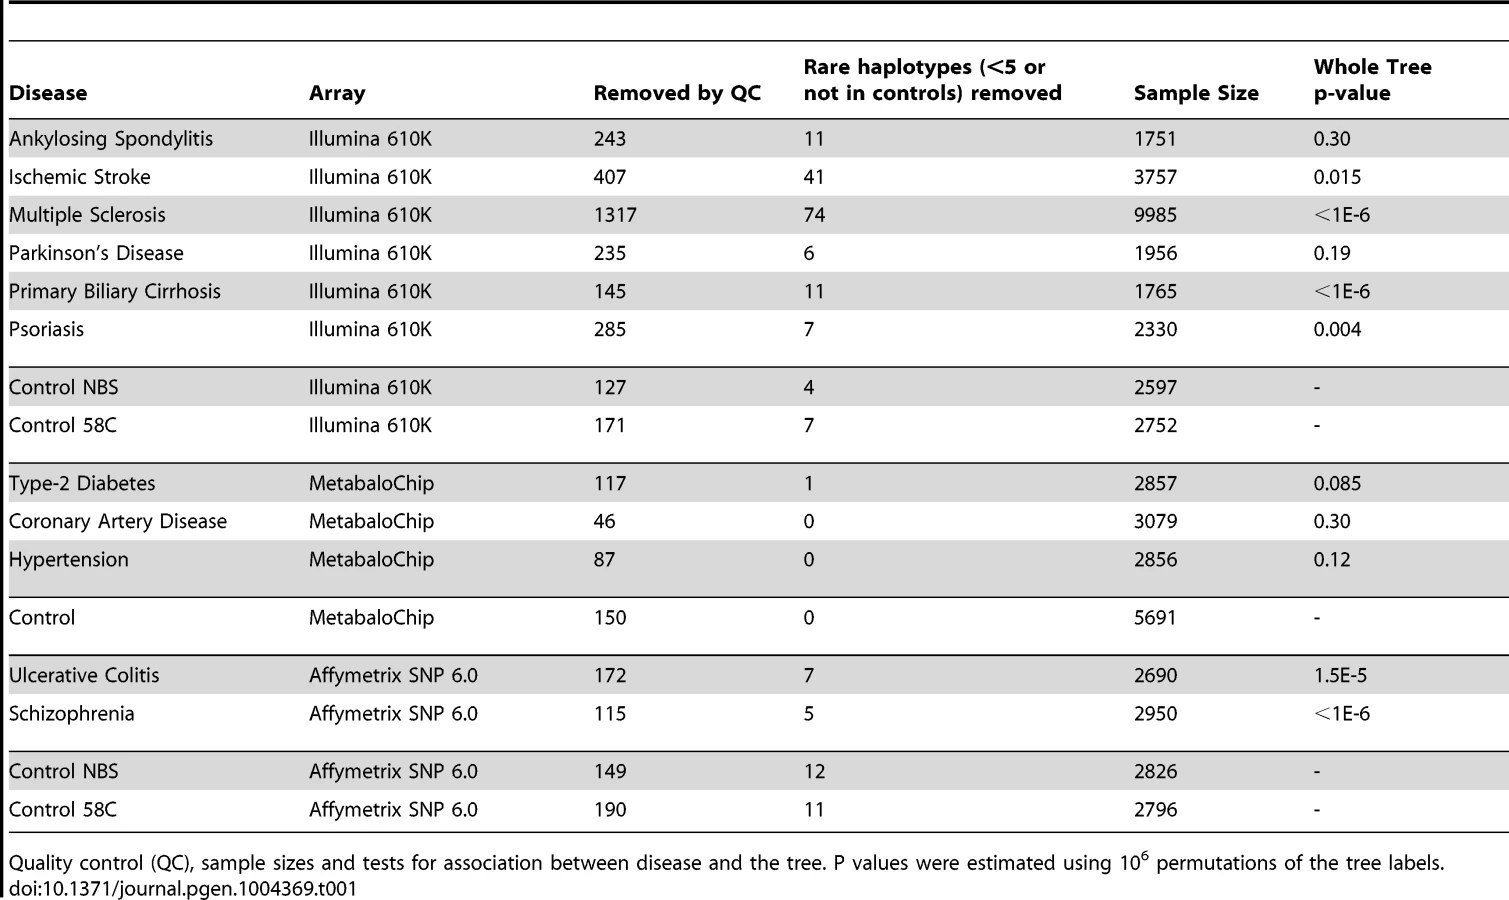
Next we performed lexical tree building to identify new associations with phylogenetically related variants, but without basing our anlysis on any prior assumptions related to the published mtDNA haplogroup structure [18], [19]. This method uses fewer SNPs because individuals with missing SNP data cannot be used, but has greated power, and provides graphical summaries of the combinations of SNPs that are associated with increased or descreased risk of disease (Supplementary Materials, Table S4). Lexical tree analysis identified significant relationships between the mtDNA tree structure and schizophrenia, primary biliary cirrhosis, multiple sclerosis (each at p<10−6), ulcerative colitis (p<10−4), and Parkinson's disease (p = 0.004) (Table 1 and Supplementary Materials Figure S3), independently confirming previous haplogroup based association associations [5], [12], [16], [17], and revealing new mtDNA clades associated with several different diseases. The other case-control trees, and comparisons between the different control populations were not significant at the 1% level.
Imputed mtDNA variants are associated with several different common diseases
To determine the functional basis of the associations we imputed missing genotypes across the whole mitochondrial genome using 7,729 complete mtDNA sequences. Subsequent analyses were performed on 35,901 European cases and 15,302 European controls, and captured 40.41% of European mtDNA population genetic variation (Supplementary Materials, Figure S2).
In keeping with our original hypothesis, specific variants with predicted functional consequences conferred either an increased risk (Table 2a) or decreased risk (Table 2b) across several different diseases. In addtion, we identified the same allelic-specific associations for different diseases compared to different platform-specific control groups, re-inforcing these findings. Functional variants associated with an increased risk in two or more diseases were limited to two structural genes: MTCYB (m.14793, m.15218) and MTCO3 (m.9477, m.9667). The only non-synonmous protien encoding variant consistently associated with a reduced risk of disease was in MTND3 (m.10398).
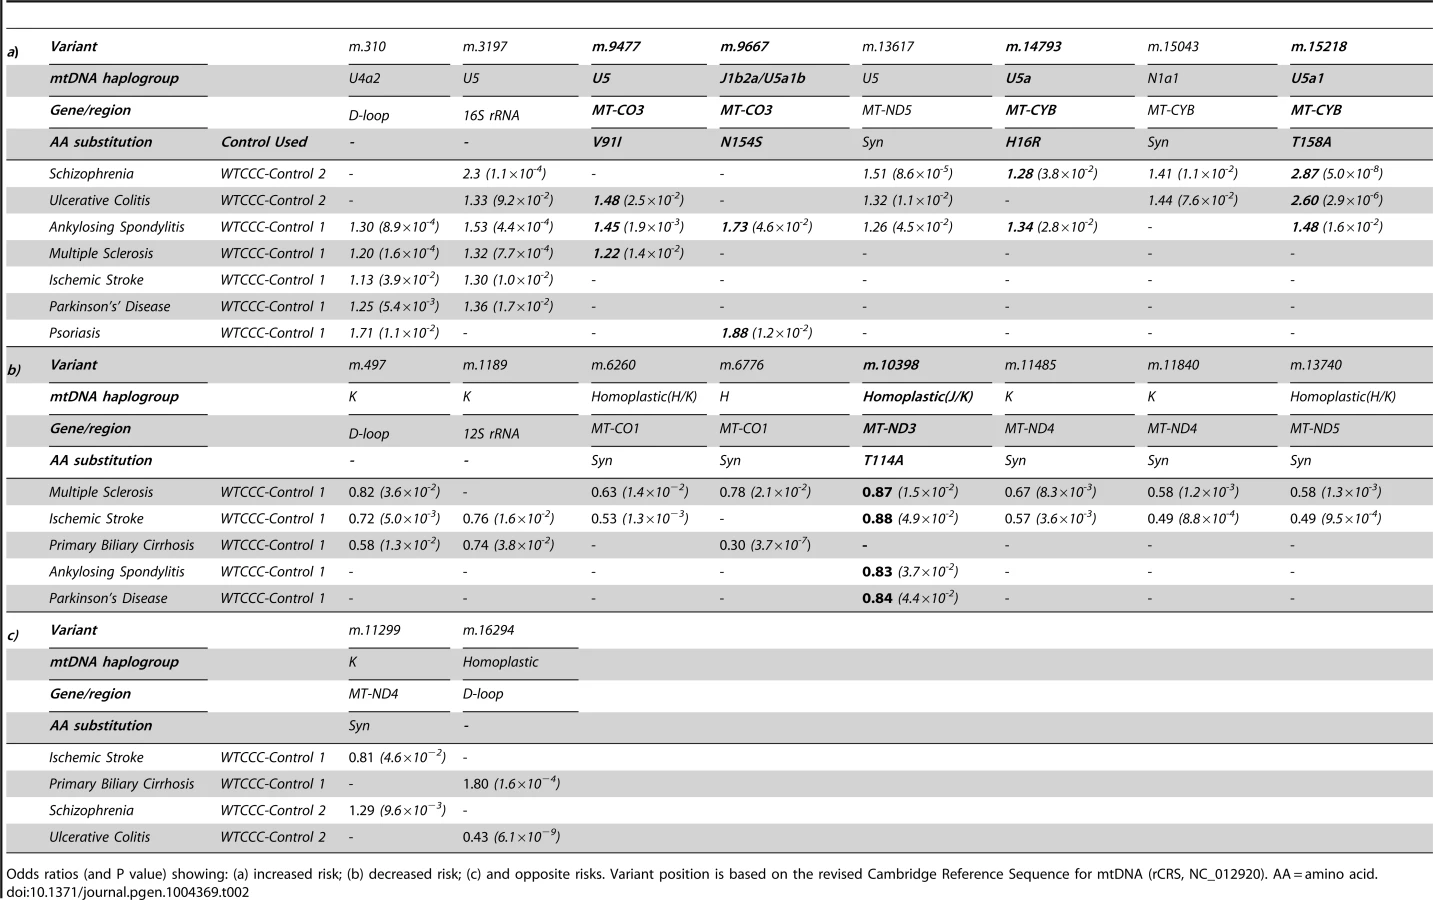
We also found evidence of associations across multiple diseases within the non-coding region (d-loop) of mtDNA, and 16S ribosomal RNA subunit genes (Figure 2 and Table 2 and Supplementary Materials, Table. S3). Intriguingly, the same alleles were not associated with all of the diseases we studied, and for two variants (m.11299, m.16294), the same allele had opposite effects for two different diseases (Table 2c).

Overall, the majority of disease-associated alleles conferred an increased risk (61/99), and not a decreased risk (38/99, P<0.001) (Supplementary Materials, Table S3).
Discussion
Following stringent quality control, our initial analysis confirmed previous associations between mtDNA haplogroups and common disease in a much larger data set. These findings were independentely supported by lexical tree based analysis at higher levels of statistical significance. Subsequent imputation of missing genotypes captured >40% of European mtDNA population genetic variation in 35,901 European cases and 15,302 European controls. By simultaneously analysing eleven, ostensibly unrelated, diseases we identified several imputed mtDNA variants that were associated with more than one disease. The same associations were seen in different disease groups compared to different control groups. This provided confirmatory independent replication of a disease association, and supports our original hypothesis that the same genetic variants of mtDNA contribute to the risk of developing several common complex diseases.
Variants increasing the risk of two or more diseases were limited to MTCYB (m.14793, m.15218) and MTCO3 (m.9477, m.9667), encoding variants in cytochrome b (H16R, T158A) and subunit 3 of cytochrome c oxidase (complex IV, V91L, N154S). Functional variants of MTCYB have previosly been associated with several human phenotypes [20]–[22], but the most compelling evidence of a prior disease association is the increased risk of developing blindness in subjects harboring the mtDNA mutations in MTND genes known to cause Leber hereditary optic neuropathy (LHON), where they synergistically interact with a primary LHON mutation to cause a defect of OXPHOS complex I activity [23]. On the other hand, the only non-synonmous protien encoding variant associated with a reduced risk of several diseases was m.10398 in the MTND3 variant (complex I, T114A). m.10398 occurs twice on the human mtDNA phylogeny (homoplastic on haplogroups J and K), and has previously been associated with a reduced risk of Parkinson's disease [14], [24]. This variant has been shown to reduce complex I activity, cytosolic calcium levels, and the mitochondrial membrane potential [3], [25], [26] and thus may reduce the level of reactive oxygen species, contributing to the underlying disease mechanim of several disorders.Variants in MTCO3 are typically associated with primary mitochondrial disorders [27], [28], but have been also been indentified as risk factors in Alzheimer's disease [29], [30], migrainous stroke [31] and sporadic optic neuropathy [32]. M.9477 and m.9667 are non-synonmous protien encoding variants which are cladally related; present on haplogroup U sub branches (U5 and U5a1b, respectively). Cybrid studies of haplogroup U show a reduction in mtDNA copy number, resulting in a reduction in mitochondrial protein synthesis and complex IV activity [3], [25], impairing energy production and likely contributing to disease.
We also noted disease associations with substitutions in the non-coding region and ribosomal genes (Table 2 and Supplementary Materials, Table S3). Although highly polymorphic at the population level (Figure 2), there is emerging evidence that both regions can have functional effects either through an effect on mtDNA replication, transcription or translation [33], [34], as proposed in Alzheimer's disease [34].
It is intriguing that there were more functional variants associated with an increased risk, than with a decreased risk of disease (Table 2 and Supplementary Materials, Table S3). This suggests that deleterious, novel sub-haplogroup variants have not yet been removed from the population through natural selection, possibly including the younger d-loop variants. This has been observed in the nuclear genome in the rapidly expanding human population [35], [36], implying that the modern human population is far from equilibrium. An alternative explantion is that mtDNA alleles may escape purifying selection because the associated disease phenotype only becomes manifest after female reproductive life.
For two variants (m.11299, m.16294), the same allele was associated with an increased risk of developing one disease, and a reduced risk of developing another (Table 2). Although differences in the sample size post-QC provide one explanation, these findings raise the possibility that different mtDNA-mediated mechanisms are involved in different contexts, perhaps because some variants have a greater impact on bioenergetics, and others on the generation of reactive oxygen species. Alternatively, it is conceivable that the relevance of specific alleles may be context-specific, only excerting a functional effect on a particular haplogroup background [37]. Substantially larger whole mtDNA genome studies will be required to detect clade-specific epistastic interactions if they exist.
In some instances we observed multiple associations with different variants found within the same phylogenetic cluster. For example m.499 (K1a), m.11485 (K1a4) and m.11840 (K1a4a1) are known to reside within subdivisions of the major haplogroup K, and all associated decreased risk of MS and IS. Conversely, m.310 (U4a2) and m.3197 (U5) are distinct subclades of the U associated with increased risk of PS, MS, IS PD AS and UC. Although reassuring from a technical perpective, this illustrates the challenge of mtDNA association studies, where variants with a close ancestral relationship inevitably co-segregate, making it difficult to determine which alleles are responsible for the disease risk.
Finally, analysis of imputed data also revealed several different mtDNA alleles asssociated with different diseases, often reaching high levels of statistical significance (P<10−10, Supplementary Materials, Table S3). However, these findings should only be considered preliminary and require independent replication in other populations (where specific European haplogroup distributions can vary) and thus do not form the major focus of this report.
In conclusion, these findings underscore the role of mitochondrial mechanisms in the pathogenesis of common diseases, and emphasise the importance of incorporating the mitochondrial genome in comprehensive genetic association studies. Although the strict phylogenetic stucture of maternally inherited mtDNA makes it difficult to identify the precise variants responsible, higher resolution genotyping at the whole mtDNA genome level will cast further light on the genetic mechanisms, particularly if recurrent homoplasies independently associate with phenotypes across several clades.
Materials and Methods
This study used data generated through the Welcome Trust Case Control Consortium. A full list of the corresponding investigators who generated each dataset is available from http://www.wtccc.org.uk/ccc2/wtccc2_studies.html [38]–[45]. Both case and control datasets were downloaded from the European Genotype Archive (http://www.ebi.ac.uk/ega).
Psoriasis (PS), multiple sclerosis (MS), ischemic stroke (IS), Parkinson's disease (PD), primary biliary sclerosis (PBC) and ankylosing spondylitis (AS) patient cohorts were genotyped using the Illumina 610K quad array (Illumina San Diego California USA) and were compared array specific controls, denoted here as WTCCC-Control-1 (combined WTCCC-58C and WTCCC-NBS) genotyped on the Illumina 1.2M Duo platform (Illumina San Diego California USA). Illumina array systems contain 138 mtDNA variants.
Ulcerative colitis (UC), schizophrenia (SP) and their array-specific controls, denoted here as WTCCC-Control-2 (combined, WTCCC-58C and WTCCC-NBS), were genotyped using the Affymetrix SNP6.0 array (Affymetrix, Santa Clara, CA). The Affymetrix SNP6.0 array system contains 445 mtDNA variants.
Coronary artery disease (CAD), Type-2 diabetes (T2D) and hypertension (HT) cohorts and their array specific controls, denoted here as WTCCC-Control-3 (combined WTCCC-58C and WTCCC-NBS), were genotyped using the MetabaloChip array system [46]. The MetabaloChip array system contains 135 mtDNA variants.
To ensure valid comparisons, each disease sample set wasonlycompared to its corresponding control array counterpart(i.e. SNP6.0 cases were compared to SNP6.0 controls).”
Statistical power
Given the case cohort sample sizes post QC (Supplementary Materials, Table S1), the corresponding control cohorts (Supplementary Materials, Table S1), an expected MAF of 0.01, an α = 3.85×10⁻³ to 3.97×10⁻⁴(averaging 13-126 tests dependent upon specific dataset) and disease prevalences of: psoriasis = 2% [47], multiple sclerosis = 1% [48], ischemic stroke = 1% [49], primary biliary cirrhosis = 0.1% [50], Parkinson's disease = 0.3% [51], ankylosing spondylitis = 0.1% [52], ulcerative colitis = 0.1% [53], schizophrenia = 0.33% [54], Type-2 diabetes = 10% [55], coronary artery disease = 3% [56] and hypertension = 30% [57]; we had >80% power to detect an effect size of >1.2 in each cohort (specifically, psoriasis = 79.8%, multiple sclerosis = 93.2%, ischemic stroke = 84.5%, primary biliary cirrhosis = 79.9%, Parkinson's disease = 85.9%, ankylosing spondylitis = 85.4%, ulcerative colitis = 78.9%, schizophrenia = 80.3%, Type-2 diabetes = 85.3%, coronary artery disease = 82.6% and hypertension = 98.7%). Power calculations were carried out using Genetic Power Calculator [58].
Primary association analysis
Stringent quality control (QC) was applied to each individual cohort (Table S1) [59]. Briefly, each cohort was pruned of missing phenotypes (defined as -9 in the pedigree/sample files). Poorly performing SNPs (genotyped = 0.1[59]), and subsequenctly, samples were removed (individual missingness = 0.1 [59]) using PLINK v2.050 [15]. Additionally non-European mtDNA sequences (defined with m.8701A, m.8540T and 10873T) were also removed [1], [60], [61]. Finally, to verify the quality of genotypes cluster plots of normalized intensity for each SNP were generated using R (http://www.R-project.org) and inspected.
In order to increase statistical power, WTCCC-58C and WTCCC-NBS control cohorts were merged. Initially, we compared the two healthy control groups (Supplementary Materials, Figure S1), and found no significant difference in allele frequencies. Briefly, each control cohort was merged with its array genotyped counterpart (Supplementary Materials, Table S2). As with individual cohorts, MAF = 0.00001, implemented in PLINK v2.050 [15], was used to remove SNPs with missing genotpyes (i.e. call = 0 0). Poorly performing SNPs (genotyped = 0.1[59]), and subsequenctly, samples were removed (individual missingness = 0.1[59]) using PLINK v2.050 [15]. Finally, to correct for control popualtion stratitification, variant frequency was compared between -58C and –NBS using ‘—assoc' PLINK v2.050 (P threshold = 0.05) [15]. Variants with signifcantly different 58C/NBS frequencies were removed. This QC lead to the formation of 3 merged control cohorts: WTCCC-Control-1, WTCCC-Control-2 and WTCCC-Control-3.
Prior to association testing QC'd case cohorts were merged with corresponding QC'd control cohorts (i.e. Multiple sclerosis versus WTCCC-Control-1). Differential missingness tests, which statistically compare the frequency of ‘missing’ genotype data between cases and controls were performed on each case-control comparison [59]. Variants were removed when missingness was significantly different (P = <10−4) [59]. Allelic association was implemented in PLINK v2.050 [15]. Given the discovery nature of the experiment, statistical significance was defined as P<0.05.
Population stratification
Only ancestral Europeans, determined by mitchondrial DNA genotype, were included in this study [1], [60], [61]. Additionally, population structure in each cohort (post-QC) and combined by array type was assessed by principle component analysis (PCA) of mitochondrial DNA variants [62]. Plots were made of the first two components for each array dataset (Illumina = AS, IS, MS, NBS, PBC, PD, PS, WTCCC-58C and WTCCC-NBS, Affymetrix = SP, UC, WTCCC-58C and WTCCC-NBS and Metabalo = T2D, CAD, HT and controls [previously combined WTCCC-58C and WTCCC-NBS]) and separately for the control cohorts for each platform (Supplementary Figure S3). At this resolution, individual PCA cluster analysis showed no significant stratification differences. All principle component scores were calculated in R using the ‘princomp’ function and plotted in R using ggplot (R Core Team 2013) [63].
Imputation
Imputation was implemented in PLINK v2.050 [15]. Initially a reference panel was constructed. Whole Human mtDNA genome data, n = 18,114 sequences, were downloaded from the National Centre for Biotechnology Information Nucleotide database (http://www.ncbi.nlm.nih.gov/nuccore/), using the keyword phrase ‘Homo [Organism] AND gene_in_mitochondrion[PROP] AND 14000∶19000[SLEN] NOT pseudogene[All Fields]'. Sequences with pathogenic mtDNA variants (available at www.mitomap.org) were removed (n = 458 sequences), non Homo sapien sequences were removed (n = 7). Similar to genotype QC, non-European mtDNA sequences (defined with m.8701A, m.8540T and 10873T) were also removed (n = 7051). Finally truncated mtDNA sequences (<16,500 bp) were removed (n = 663) leaving a final dataset of n = 9,935 sequences. The sequence dataset was aligned using MUSCLE [64], analysed using Haplogrep [65], [66] and subsequently filtered to match the Major European haplogroups (H, V, J, T, U, K, W, X, I, R and N) leaving a final sequence aplosamples and 2,873 variants, representing 100% of of the genetic varation in the reference dataset.
The reference panel was merged with each QC'd case-control cohort in PLINK (v2.050),[15] invoking ‘—flip-scan' to detect and correct any stranding issues. Imputation association testing was carried out using ‘—proxy-assoc’ and, in order to assess the imputation performance, ‘—proxy-drop’.[15] Significant SNPs associations with >99% of samples imputed, number of proxy SNPS >3, a MAF >0.01 and a content metric >0.8 were retained.[15] Given a popualtion size of 7,729 and total genotypic information of 2,873 as 100%, imputation of alleles with MAF>0.0 captures 40% of total mtDNA genetic variabilty (Figure S2).
Circularised Manhattan plot
Cicularised Manhattan plots were generated using code adapted from http://gettinggeneticsdone.blogspot.co.uk/2013/11/a-mitochondrial-manhattan-plot.html, solarplot.R and ggplot2 (http://ggplot2.org/).
Lexical tree analysis
Lexical tree analysis was performed in R (R Core Team 2013) [63] using a custom library (snptree, publically available from http://www.staff.ncl.ac.uk/i.j.wilson/). This analysis was performed on the Illumina 610K quad array, the Affymetrix SNP6.0 and the MetabaloChip datasets independently. An independent stringent QC was performed, removing in order: the SNPs with a call rate of below 95% or a MAF of below 0.5%, the 2% of individuals with the most missing sites, the bottom 50% of SNPs with the most missing samples at that site, and those individuals with any missing data from the remaining SNPs. Finally, those individuals with haplotypes (defined by all the remaining SNPs) that were not present in controls or had a frequency of less than 5 were removed. This left 27054 individuals on 24 SNPs for the Illumina 610K quad array, 10,745 individual at 15 SNPs for the Affymetrix 6.0 chip and 14,484 individuals at 5 SNPs for the MetabaloChip. The SNPs retained and their minor allele frequencies (MAF) in the control populations are shown in Supplementary Materials, Table S4. A tree structure was contructed for haplotypes made from the retained SNPs by initially grouping all individuals at the root of a tree, and then successively considering all retained SNPs in decreasing order of their minor allele frequency (Supplementary Materials, Figure S3). At each stage, the haplotypes at each leaf node are split with those with the wild type being put on the left branch and those with the mutant allele on the right. This creates a tree with all leaves representing complete haplotypes and internal nodes partial haplotypes. Test statistics were then calculated for each node on the tree. An overall test statistic for the tree was calculated by calculating the the sum of the five largest node values that were not ancestors or descendents of each other. The test statistic was tested for significance by 1,000,000 random permutations of the Case/Control labels.
Supporting Information
Zdroje
1. TorroniA, RichardsM, MacaulayV, ForsterP, VillemsR, et al. (2000) mtDNA haplogroups and frequency patterns in Europe. Am J Hum Genet 66 : 1173–1177.
2. CarelliV, VerganiL, BernazziB, ZampieronC, BucchiL, et al. (2002) Respiratory function in cybrid cell lines carrying European mtDNA haplogroups: implications for Leber's hereditary optic neuropathy. Biochim Biophys Acta 1588 : 7–14.
3. Gomez-DuranA, Pacheu-GrauD, Martinez-RomeroI, Lopez-GallardoE, Lopez-PerezMJ, et al. (2012) Oxidative phosphorylation differences between mitochondrial DNA haplogroups modify the risk of Leber's hereditary optic neuropathy. Biochim Biophys Acta 1822 : 1216–1222.
4. SamuelsDC, CarothersAD, HortonR, ChinneryPF (2006) The power to detect disease associations with mitochondrial DNA haplogroups. Am J Hum Genet 78 : 713–720.
5. ChinneryPF, ElliottHR, SyedA, RothwellPM (2010) Mitochondrial DNA haplogroups and risk of transient ischaemic attack and ischaemic stroke: a genetic association study. Lancet Neurol 9 : 498–503.
6. HagenCM, AidtFH, HedleyPL, JensenMK, HavndrupO, et al. (2013) Mitochondrial haplogroups modify the risk of developing hypertrophic cardiomyopathy in a Danish population. PLoS One 8: e71904.
7. Fernandez-CaggianoM, Barallobre-BarreiroJ, Rego-PerezI, Crespo-LeiroMG, PaniaguaMJ, et al. (2013) Mitochondrial DNA haplogroup H as a risk factor for idiopathic dilated cardiomyopathy in Spanish population. Mitochondrion 13 : 263–268.
8. Ruiz-PesiniE, LapenaAC, Diez-SanchezC, Perez-MartosA, MontoyaJ, et al. (2000) Human mtDNA haplogroups associated with high or reduced spermatozoa motility. Am J Hum Genet 67 : 682–696.
9. CarrieriG, BonafeM, De LucaM, RoseG, VarcasiaO, et al. (2001) Mitochondrial DNA haplogroups and APOE4 allele are non-independent variables in sporadic Alzheimer's disease. Hum Genet 108 : 194–198.
10. van der WaltJM, DementievaYA, MartinER, ScottWK, NicodemusKK, et al. (2004) Analysis of European mitochondrial haplogroups with Alzheimer disease risk. Neurosci Lett 365 : 28–32.
11. MancusoM, ConfortiFL, RocchiA, TessitoreA, MugliaM, et al. (2004) Could mitochondrial haplogroups play a role in sporadic amyotrophic lateral sclerosis? Neurosci Lett 371 : 158–162.
12. HudsonG, NallsM, EvansJR, BreenDP, Winder-RhodesS, et al. (2013) Two-stage association study and meta-analysis of mitochondrial DNA variants in Parkinson disease. Neurology 80 : 2042–2048.
13. Gaweda-WalerychK, MaruszakA, SafranowK, BialeckaM, Klodowska-DudaG, et al. (2008) Mitochondrial DNA haplogroups and subhaplogroups are associated with Parkinson's disease risk in a Polish PD cohort. J Neural Transm 115 : 1521–1526.
14. GhezziD, MarelliC, AchilliA, GoldwurmS, PezzoliG, et al. (2005) Mitochondrial DNA haplogroup K is associated with a lower risk of Parkinson's disease in Italians. Eur J Hum Genet 13 : 748–752.
15. PurcellS, NealeB, Todd-BrownK, ThomasL, FerreiraMA, et al. (2007) PLINK: a tool set for whole-genome association and population-based linkage analyses. Am J Hum Genet 81 : 559–575.
16. BanM, ElsonJ, WaltonA, TurnbullD, CompstonA, et al. (2008) Investigation of the role of mitochondrial DNA in multiple sclerosis susceptibility. PLoS One 3: e2891.
17. RollinsB, MartinMV, SequeiraPA, MoonEA, MorganLZ, et al. (2009) Mitochondrial variants in schizophrenia, bipolar disorder, and major depressive disorder. PLoS One 4: e4913.
18. SevonP, ToivonenH, OllikainenV (2006) TreeDT: tree pattern mining for gene mapping. IEEE/ACM Trans Comput Biol Bioinform 3 : 174–185.
19. WilsonIJ, HoweyRA, HounietDT, Santibanez-KorefM (2011) Finding genes that influence quantitative traits with tree-based clustering. BMC Proc 5 Suppl 9S98.
20. KeightleyJA, AnitoriR, BurtonMD, QuanF, BuistNR, et al. (2000) Mitochondrial encephalomyopathy and complex III deficiency associated with a stop-codon mutation in the cytochrome b gene. Am J Hum Genet 67 : 1400–1410.
21. De CooIF, RenierWO, RuitenbeekW, Ter LaakHJ, BakkerM, et al. (1999) A 4-base pair deletion in the mitochondrial cytochrome b gene associated with parkinsonism/MELAS overlap syndrome. Ann Neurol 45 : 130–133.
22. AndreuAL, CheccarelliN, IwataS, ShanskeS, DiMauroS (2000) A missense mutation in the mitochondrial cytochrome b gene in a revisited case with histiocytoid cardiomyopathy. Pediatr Res 48 : 311–314.
23. HudsonG, CarelliV, SpruijtL, GerardsM, MowbrayC, et al. (2007) Clinical expression of Leber hereditary optic neuropathy is affected by the mitochondrial DNA-haplogroup background. Am J Hum Genet 81 : 228–233.
24. HuertaC, CastroMG, CotoE, BlazquezM, RibacobaR, et al. (2005) Mitochondrial DNA polymorphisms and risk of Parkinson's disease in Spanish population. J Neurol Sci 236 : 49–54.
25. Gomez-DuranA, Pacheu-GrauD, Lopez-GallardoE, Diez-SanchezC, MontoyaJ, et al. (2010) Unmasking the causes of multifactorial disorders: OXPHOS differences between mitochondrial haplogroups. Hum Mol Genet 19 : 3343–3353.
26. KulawiecM, OwensKM, SinghKK (2009) Cancer cell mitochondria confer apoptosis resistance and promote metastasis. Cancer Biol Ther 8 : 1378–1385.
27. Mkaouar-RebaiE, EllouzeE, ChamkhaI, KammounF, TrikiC, et al. (2011) Molecular-clinical correlation in a family with a novel heteroplasmic Leigh syndrome missense mutation in the mitochondrial cytochrome c oxidase III gene. J Child Neurol 26 : 12–20.
28. BrownMD, TorroniA, HuoponenK, ChenYS, LottMT, et al. (1994) Pathological significance of the mtDNA COX III mutation at nucleotide pair 9438 in Leber hereditary optic neuropathy. Am J Hum Genet 55 : 410–412.
29. HambletNS, RaglandB, AliM, ConyersB, CastoraFJ (2006) Mutations in mitochondrial-encoded cytochrome c oxidase subunits I, II, and III genes detected in Alzheimer's disease using single-strand conformation polymorphism. Electrophoresis 27 : 398–408.
30. TranahGJ, NallsMA, KatzmanSM, YokoyamaJS, LamET, et al. (2012) Mitochondrial DNA sequence variation associated with dementia and cognitive function in the elderly. J Alzheimers Dis 32 : 357–372.
31. FinnilaS, HassinenIE, MajamaaK (2001) Phylogenetic analysis of mitochondrial DNA in patients with an occipital stroke. Evaluation of mutations by using sequence data on the entire coding region. Mutat Res 458 : 31–39.
32. BosleyTM, BrodskyMC, GlasierCM, Abu-AmeroKK (2008) Sporadic bilateral optic neuropathy in children: the role of mitochondrial abnormalities. Invest Ophthalmol Vis Sci 49 : 5250–5256.
33. SuissaS, WangZ, PooleJ, WittkoppS, FederJ, et al. (2009) Ancient mtDNA genetic variants modulate mtDNA transcription and replication. PLoS Genet 5: e1000474.
34. CoskunPE, BealMF, WallaceDC (2004) Alzheimer's brains harbor somatic mtDNA control-region mutations that suppress mitochondrial transcription and replication. Proc Natl Acad Sci U S A 101 : 10726–10731.
35. FuW, O'ConnorTD, JunG, KangHM, AbecasisG, et al. (2013) Analysis of 6,515 exomes reveals the recent origin of most human protein-coding variants. Nature 493 : 216–220.
36. KeinanA, ClarkAG (2012) Recent explosive human population growth has resulted in an excess of rare genetic variants. Science 336 : 740–743.
37. PelloR, MartinMA, CarelliV, NijtmansLG, AchilliA, et al. (2008) Mitochondrial DNA background modulates the assembly kinetics of OXPHOS complexes in a cellular model of mitochondrial disease. Hum Mol Genet 17 : 4001–4011.
38. Wellcome Trust Case ControlC, Australo-Anglo-American SpondylitisC, BurtonPR, ClaytonDG, CardonLR, et al. (2007) Association scan of 14,500 nonsynonymous SNPs in four diseases identifies autoimmunity variants. Nat Genet 39 : 1329–1337.
39. International Stroke GeneticsC, Wellcome Trust Case-ControlC (2010) Failure to validate association between 12p13 variants and ischemic stroke. N Engl J Med 362 : 1547–1550.
40. BanM, GorisA, LorentzenAR, BakerA, MihalovaT, et al. (2009) Replication analysis identifies TYK2 as a multiple sclerosis susceptibility factor. Eur J Hum Genet 17 : 1309–1313.
41. International Parkinson Disease GenomicsC, NallsMA, PlagnolV, HernandezDG, SharmaM, et al. (2011) Imputation of sequence variants for identification of genetic risks for Parkinson's disease: a meta-analysis of genome-wide association studies. Lancet 377 : 641–649.
42. EvansDM, SpencerCC, PointonJJ, SuZ, HarveyD, et al. (2011) Interaction between ERAP1 and HLA-B27 in ankylosing spondylitis implicates peptide handling in the mechanism for HLA-B27 in disease susceptibility. Nat Genet 43 : 761–767.
43. International Stroke GeneticsC, Wellcome Trust Case ControlC, BellenguezC, BevanS, GschwendtnerA, et al. (2012) Genome-wide association study identifies a variant in HDAC9 associated with large vessel ischemic stroke. Nat Genet 44 : 328–333.
44. FisherSA, TremellingM, AndersonCA, GwilliamR, BumpsteadS, et al. (2008) Genetic determinants of ulcerative colitis include the ECM1 locus and five loci implicated in Crohn's disease. Nat Genet 40 : 710–712.
45. FerreiraMA, O'DonovanMC, MengYA, JonesIR, RuderferDM, et al. (2008) Collaborative genome-wide association analysis supports a role for ANK3 and CACNA1C in bipolar disorder. Nat Genet 40 : 1056–1058.
46. VoightBF, KangHM, DingJ, PalmerCD, SidoreC, et al. (2012) The metabochip, a custom genotyping array for genetic studies of metabolic, cardiovascular, and anthropometric traits. PLoS Genet 8: e1002793.
47. LangleyRG, KruegerGG, GriffithsCE (2005) Psoriasis: epidemiology, clinical features, and quality of life. Ann Rheum Dis 64 Suppl 2ii18–23 discussion ii24–15.
48. AlonsoA, JickSS, OlekMJ, HernanMA (2007) Incidence of multiple sclerosis in the United Kingdom: findings from a population-based cohort. J Neurol 254 : 1736–1741.
49. MarkusH (2004) Genes for stroke. J Neurol Neurosurg Psychiatry 75 : 1229–1231.
50. PrinceMI, JamesOF (2003) The epidemiology of primary biliary cirrhosis. Clin Liver Dis 7 : 795–819.
51. de LauLM, BretelerMM (2006) Epidemiology of Parkinson's disease. Lancet Neurol 5 : 525–535.
52. GranJT, HusbyG (1993) The epidemiology of ankylosing spondylitis. Semin Arthritis Rheum 22 : 319–334.
53. PodolskyDK (2002) Inflammatory bowel disease. N Engl J Med 347 : 417–429.
54. SahaS, ChantD, McGrathJ (2008) Meta-analyses of the incidence and prevalence of schizophrenia: conceptual and methodological issues. Int J Methods Psychiatr Res 17 : 55–61.
55. HexN, BartlettC, WrightD, TaylorM, VarleyD (2012) Estimating the current and future costs of Type 1 and Type 2 diabetes in the UK, including direct health costs and indirect societal and productivity costs. Diabet Med 29 : 855–862.
56. LiuJL, ManiadakisN, GrayA, RaynerM (2002) The economic burden of coronary heart disease in the UK. Heart 88 : 597–603.
57. ManciaG, FagardR, NarkiewiczK, RedonJ, ZanchettiA, et al. (2013) 2013 ESH/ESC guidelines for the management of arterial hypertension: the Task Force for the Management of Arterial Hypertension of the European Society of Hypertension (ESH) and of the European Society of Cardiology (ESC). Eur Heart J 34 : 2159–2219.
58. PurcellS, ChernySS, ShamPC (2003) Genetic Power Calculator: design of linkage and association genetic mapping studies of complex traits. Bioinformatics 19 : 149–150.
59. Wellcome Trust Case ControlConsortium (2007) Genome-wide association study of 14,000 cases of seven common diseases and 3,000 shared controls. Nature 447 : 661–678.
60. TorroniA, HuoponenK, FrancalacciP, PetrozziM, MorelliL, et al. (1996) Classification of European mtDNAs from an analysis of three European populations. Genetics 144 : 1835–1850.
61. HudsonG, PanoutsopoulouK, WilsonI, SouthamL, RaynerNW, et al. (2013) No evidence of an association between mitochondrial DNA variants and osteoarthritis in 7393 cases and 5122 controls. Ann Rheum Dis 72 : 136–139.
62. BiffiA, AndersonCD, NallsMA, RahmanR, SonniA, et al. (2010) Principal-component analysis for assessment of population stratification in mitochondrial medical genetics. Am J Hum Genet 86 : 904–917.
63. Team RC (2013) R: A language and environment for statistical computing.: R Foundation for Statistical Computing, Vienna, Austria.
64. EdgarRC (2004) MUSCLE: a multiple sequence alignment method with reduced time and space complexity. BMC Bioinformatics 5 : 113.
65. Kloss-BrandstatterA, PacherD, SchonherrS, WeissensteinerH, BinnaR, et al. (2011) HaploGrep: a fast and reliable algorithm for automatic classification of mitochondrial DNA haplogroups. Hum Mutat 32 : 25–32.
66. van OvenM, KayserM (2009) Updated comprehensive phylogenetic tree of global human mitochondrial DNA variation. Hum Mutat 30: E386–394.
Štítky
Genetika Reprodukční medicínaČlánek vyšel v časopise
PLOS Genetics
2014 Číslo 5
- Kazuistika – Perspektivy využití precizované medicíny v rámci personalizované specifické terapie onkologických pacientů
- Nobelova cena za chemii pro genetické nůžky: Objev, který změní naši budoucnost?
- Technologie na bázi RNA v klinické praxi: od přebarvených petúnií k terapii vzácných a dosud jen obtížně léčitelných chorob u lidí
- „Nepředstavovali jsme si, že náš výzkum povede přímo ke vzniku nových léků, dokonce ještě za našeho života“
- Bezplatné služby pro diagnostiku ATTRv amyloidózy pro kardiology
Nejčtenější v tomto čísle
- PINK1-Parkin Pathway Activity Is Regulated by Degradation of PINK1 in the Mitochondrial Matrix
- Null Mutation in PGAP1 Impairing Gpi-Anchor Maturation in Patients with Intellectual Disability and Encephalopathy
- Phosphorylation of a WRKY Transcription Factor by MAPKs Is Required for Pollen Development and Function in
- p53 Requires the Stress Sensor USF1 to Direct Appropriate Cell Fate Decision
Zvyšte si kvalifikaci online z pohodlí domova
Mazová zátka a její řešení
nový kurzVšechny kurzy