
Non-Coding Changes Cause Sex-Specific Wing Size Differences between Closely Related Species of
The genetic basis of morphological differences among species is still poorly understood. We investigated the genetic basis of sex-specific differences in wing size between two closely related species of Nasonia by positional cloning a major male-specific locus, wing-size1 (ws1). Male wing size increases by 45% through cell size and cell number changes when the ws1 allele from N. giraulti is backcrossed into a N. vitripennis genetic background. A positional cloning approach was used to fine-scale map the ws1 locus to a 13.5 kilobase region. This region falls between prospero (a transcription factor involved in neurogenesis) and the master sex-determining gene doublesex. It contains the 5′-UTR and cis-regulatory domain of doublesex, and no coding sequence. Wing size reduction correlates with an increase in doublesex expression level that is specific to developing male wings. Our results indicate that non-coding changes are responsible for recent divergence in sex-specific morphology between two closely related species. We have not yet resolved whether wing size evolution at the ws1 locus is caused by regulatory alterations of dsx or prospero, or by another mechanism. This study demonstrates the feasibility of efficient positional cloning of quantitative trait loci (QTL) involved in a broad array of phenotypic differences among Nasonia species.
Published in the journal:
. PLoS Genet 6(1): e32767. doi:10.1371/journal.pgen.1000821
Category:
Research Article
doi:
https://doi.org/10.1371/journal.pgen.1000821
Summary
The genetic basis of morphological differences among species is still poorly understood. We investigated the genetic basis of sex-specific differences in wing size between two closely related species of Nasonia by positional cloning a major male-specific locus, wing-size1 (ws1). Male wing size increases by 45% through cell size and cell number changes when the ws1 allele from N. giraulti is backcrossed into a N. vitripennis genetic background. A positional cloning approach was used to fine-scale map the ws1 locus to a 13.5 kilobase region. This region falls between prospero (a transcription factor involved in neurogenesis) and the master sex-determining gene doublesex. It contains the 5′-UTR and cis-regulatory domain of doublesex, and no coding sequence. Wing size reduction correlates with an increase in doublesex expression level that is specific to developing male wings. Our results indicate that non-coding changes are responsible for recent divergence in sex-specific morphology between two closely related species. We have not yet resolved whether wing size evolution at the ws1 locus is caused by regulatory alterations of dsx or prospero, or by another mechanism. This study demonstrates the feasibility of efficient positional cloning of quantitative trait loci (QTL) involved in a broad array of phenotypic differences among Nasonia species.
Introduction
Somatic sexual differentiation is an ancient feature of animals, yet sex differences in morphological traits can evolve rapidly. Because of this, between-species genetic analysis of recently evolved sexual differences has been proposed as a way of identifying the genes and genetic changes that underlie morphological diversification [1]. For example, Kopp et al. [2] have found that a sex-specific abdominal pigmentation difference that recently evolved between Drosophila species is caused by non-coding cis-regulatory changes in the bric-a-brac gene, changes which involve binding sites for conserved transcription factors doublesex and ABD-B [3]. The study of recently evolved sex differences can therefore reveal changes in tissue - and sex-specific gene regulatory networks. Nevertheless, there have been few studies investigating the genetic and molecular basis of the recent evolution of morphological differences between species, due in part to the difficulty of conducting genetic analyses in diverged species that are often reproductively incompatible.
An active debate concerns whether the evolution of differences between species are due primarily to cis-regulatory or protein coding changes (e.g., [4]–[8]). While protein-coding changes have been the focus of most historical studies of phenotypic evolution, it has been argued that changes to non-coding cis-regulatory elements may be more important, as they are crucial to the spatiotemporal control of gene expression in development and can change with potentially fewer pleiotropic effects on other processes [4],[5]. However, empirical support for this claim is limited, largely by the difficulty of determining the genetic basis of phenotypic changes to a fine enough level to distinguish between cis and protein-coding changes [6]. An additional issue concerns whether the standing genetic variation for phenotypes within populations represent the same spectrum of mutations that go to fixation and become involved in species differences in phenotype [7]. Therefore, additional genetic studies of phenotypic evolution in recently diverged species are needed to help reveal the processes by which new morphologies evolve and the relative roles of cis-regulatory versus protein-coding changes in morphological evolution.
Here we investigate the genetic basis of male-specific differences between two species of Nasonia, N. vitripennis and N. giraulti. Nasonia is a complex of four closely related parasitic wasp species that is rapidly emerging as a model for evolutionary and developmental genetics [9],[10]. Nasonia males are haploid, and therefore can be readily genotyped for visible and molecular markers regardless of marker dominance. Furthermore, unlike most organisms, Nasonia species can be made inter-fertile in the lab by removing bacterial symbionts (Wolbachia) that cause sperm-egg incompatibilities among the species [11],[12]. This permits movement of genes involved in phenotypic differences between the species by backcrossing [13]–[15]. Utilizing flanking visible and recessive lethal mutations and genetic and genomic tools in Nasonia, positional cloning of genes involved in species differences can then be accomplished [9].
N. giraulti males have large wings (Figure 1) and are capable of flight, whereas N. vitripennis males have vestigial wings and do not fly, although they use them in courtship and agonistic displays [16]. A major portion of the male-specific wing-size difference is due to two loci, wing-size1 (ws1) and widerwing (wdw) [13],[15]. Both ws1 and wdw increase wing size in a sex specific fashion, as seen when introgressed from N. giraulti by backcrossing into an N. vitripennis background. In this study, we positionally clone the ws1 locus to a 13.5 Kb non-coding region, which falls near the sex determining locus doublesex [17],[18] and includes its 5′ UTR. This is the first positional cloning of a gene in Nasonia, and the study illustrates methods for utilizing haplodiploidy for efficient cloning of interspecies QTL in this genetic system.

Results/Discussion
Sex-specific differences in wing size
Nasonia wings are composed of a larger forewing and smaller hindwing. Here we focus our attention on the forewing, although more subtle differences in the hindwing are also found between the species and sexes. N. giraulti male forewings are 2.16 fold larger in area than N. vitripennis male forewings, although female wings of both species are large and more similar in size (Figure 1; Table 1; [13],[15]). Weston et al. [13] previously identified a major locus affecting the interspecies male wing size difference, called wing-size-1 (ws1). The giraulti allele at this locus (ws1g) was shown to increase wing size by approximately 60% when introgressed from N. giraulti into a N. vitripennis background, accounting for 44% of the species difference. To positional clone this major sex-specific wing QTL and to more precisely describe its phenotypic effects we (a) reduced the size of the introgressed sequence flanking the ws1 locus to a 40kb segment (see fine-scale mapping and cloning below) and (b) backcrossed the introgressed ws1g segment into a standard N. vitripennis strain (AsymCX) genetic background for >10 generations. This strain is referred to as ws1gV_40kb, and is used to more precisely assess the effects of the ws1g allele on wing size in comparison to the ws1v allele in the same genetic background. Overall male forewing area of ws1gV_40kb is 45% larger than the wild-type ws1vV allele (Figure 1; Table 1; Tukey's HSD test, p<0.001), and the locus accounts for 39% of the species difference in male wing area. Male forewing length and width are similarly increased (Table 1; HSD tests, p<0.001). In contrast, female wing length, width and area are unaffected by the ws1 allele (Table 1; HSD tests; p>0.05), confirming the sex-specific effects of this locus.

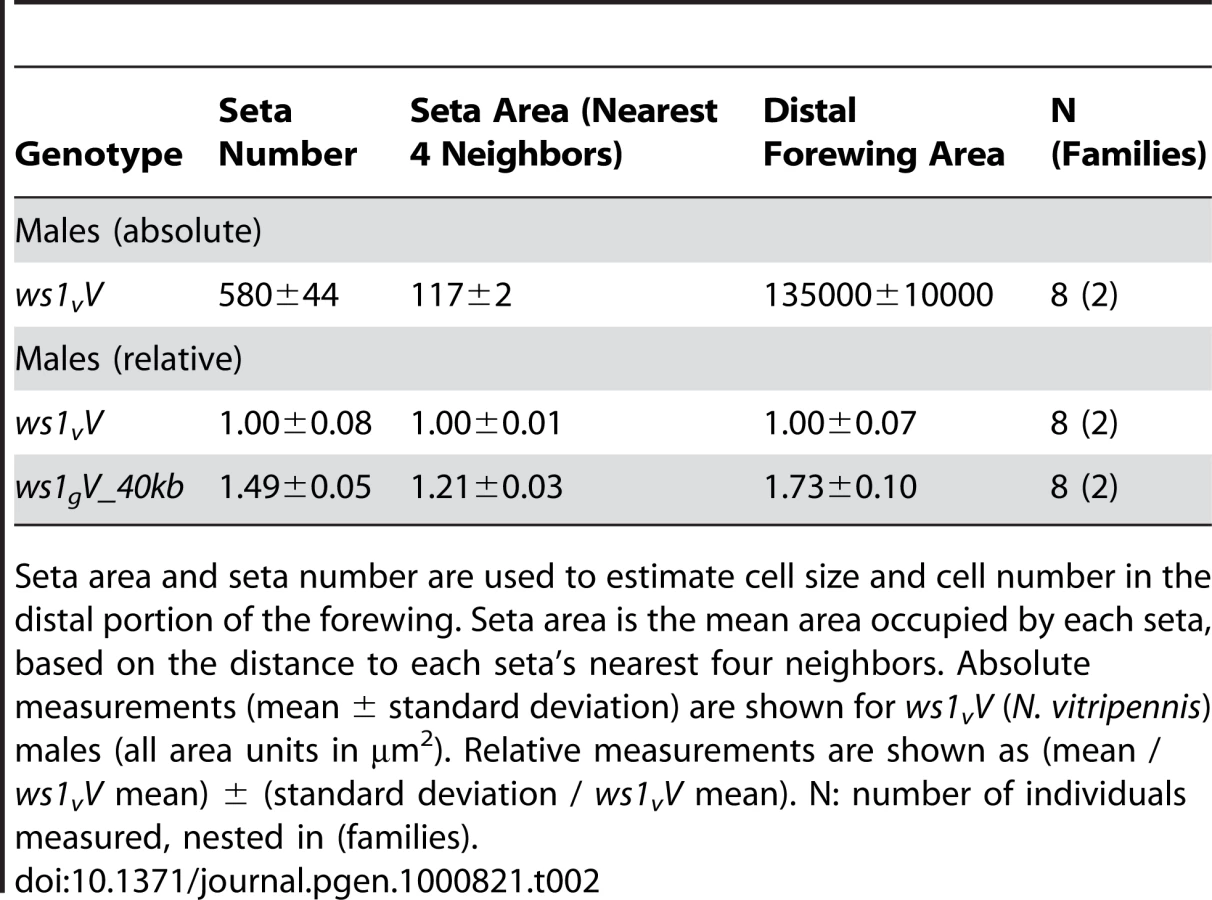
A more detailed analysis of phenotype was conducted using setae (wing cell hairs) to estimate cell size and cell number effects of ws1g. Setae have also been used in Drosophila to estimate the relative contribution of cell size and cell number to wing size (e.g., [19]). In Nasonia, setae cover the distal portion of the wing, but are sparse in the proximal portion (Figure 1). Most of the size increase due to ws1g is in the distal portion of the wing as well (73% increase distal to the costal cell versus 21% increase proximal). We therefore estimated seta densities in the distal portion of the adult wing after first establishing that there was a relationship between cell number and seta number. Cell density per seta in pupal wings was estimated by DAPI and phalloidin staining (Figure S1). The average number of cells per seta in N. vitripennis male forewings is 3.2±0.4 SD, compared to 4.6±0.4 SD in N. giraulti (Mann-Whitney U-test, p<0.05, n = 12). In contrast, the ws1gV introgression shows the same density of cells per seta as N. vitripennis (3.2±0.3 SD for each; U-test, p>0.05, n = 12), indicating that this species difference is not under the genetic control of the ws1 locus. We then estimated cell number by counting total seta numbers on the distal portion of the adult wing and estimated cell size by calculating the distance to each seta's nearest neighbors. Based on these calculations, the wslg allele increases overall cell size by 21%±3% (SD) and cell number by 45%±5%, resulting in a 73%±10% increase in area of the distal half of the wing (Table 2; HSD tests, p<0.05).
It would be useful to know whether large or small male wing-size is ancestral in the Nasonia lineage. Other closely related species (e.g. Trichomalopsis sarcophagae, T. dubia, and Urolepis rufipes) have males with large functional wings, suggesting that this state is ancestral. However, the situation is complicated by the fact that the most basal diverging Nasonia species, N. vitripennis, has small wings (Figure 1), whereas the other species form a monophyletic clade [20] that contains both species with intermediate (N. longicornis) and large winged males (N. giraulti and N. oneida) [15],[20]. Thus, we can postulate that either (a) male wing reduction began in the common ancestor to all four species, with subsequent increase in the lineage leading to N. giraulti and N. oneida, (b) smaller male wing size has independently evolved in N. vitripennis and N. longicornis, or (c) there has been introgression of one or more small-wing alleles between N. vitripennis and N. longicornis. Resolution of these alternatives will require more detailed phenotypic and sequence evaluation of the QTL involved in sex specific wing evolution.
Positional cloning of ws1
Positional cloning of the ws1 locus involved the following steps: (a) recessive lethals flanking ws1 were generated using already identified linked visible mutants, (b) these were then used to sequentially generate a set of recombinants on both sides of ws1 for fine-scale mapping and cloning of the gene, (c) a molecular (AFLP) marker tightly linked to ws1 was identified by genotyping recombinants, (d) this marker was then used to identify a set of BACs covering the region, which were assembled into contigs [21], (e) PCR based markers were developed for determining recombination intervals within the region using sequences from the BAC containing the AFLP marker, end sequences of flanking BACs, and corresponding vitripennis and/or giraulti markers (Table S1), (f) a set of increasingly finer-scale recombinants were screened to delineate the ws1 region and finally (g) additional sequence analysis within the cloned region was conducted to identify features within the region and differences between N. vitripennis and N. giraulti. The latter effort was enhanced by the availability of genome sequences for N. vitripennis (Genbank AAZX00000000) and N. giraulti (Genbank ADAO00000000) [10] which became available during the course of this project.
The method of assembly of BAC contigs is described in [21]. The approach for generating linked lethals and using these for cloning of QTL is described in methods and shown in Figure 2. Due to male haploidy, this method can be used to efficiently screen for recessive lethals linked to any gene of interest within the genome. Briefly, new lethal mutations linked to ws1 were generated by EMS mutagenesis followed by screening for linkage of the lethal to ws1. Use of custom-made lethals in this approach was effective because non-recombinant haploid males with the genotype lethal ws1g die and, therefore, the only surviving males carrying the ws1g allele are recombinants between the lethal and wing size locus (+ ws1g) (Figure 2). These tightly linked lethals increased the “effective” discovery rate of recombinants within the region by 100–200 fold (Figure 2), greatly enhancing efficiency of the positional cloning effort. Thus, we were able to positionally clone ws1 despite a 10-fold lower recombination rate in this region, 0.10–0.14 centimorgan/megabase (cM/Mb) relative to the genome-wide average of 1.4–1.5 cM/Mb [22].

We first isolated the giraulti allele of ws1 by backcrossing into a vitripennis background and mapping the locus using visible, lethal and molecular markers (Figure 3A, see also Materials and Methods). Using one line (Rec1, Figure 3C) generated by recombination to the flanking recessive lethal D4, we then generated recombinants on the opposite side between ws1 and the flanking visible marker bl13, resulting in a recombinant line showing the ws1g phenotype with only 40kb of introgressed giraulti sequence. This large-winged recombinant strain (ws1gV_40kb) is used for our detailed phenotypic and gene expression analyses. Screening of additional recombinant males further reduced the size of the region known to cause the ws1g large-wing phenotype to 13.5kb (Figure 3C).

Positional cloning ws1 shows it to fall adjacent to the protein coding region of doublesex (dsx, GeneID 100302336), a master sex determination gene found from nematodes to mammals [17],[18]. The 13.5kb ws1 region contains the dsx 5′UTR, promoter and presumed cis-regulatory region but notably excludes the protein coding regions of dsx or any other gene (Figure 3B). This gene was confirmed as the Nasonia ortholog of doublesex based on protein domains, expression pattern, sex specific splice forms, and experimental demonstration that splice forms are associated with sex in a gynandromorph producing line [18]. This previous work on Nasonia dsx [18] confirmed the coding regions, 5′UTR, 3′UTR, exons and introns for both male and female specific splice-forms (shown in Figure S2) in both N. vitripennis and N. giraulti.
Upstream of the ws1 region, the nearest gene was identified by BLAST to be a homolog of the D. melanogaster gene prospero (pros, GeneID 100118692, [18]), 24.5kb away from the ws1 region (Figure 3B). In Drosophila, prospero is a transcription factor that specifies cell fate and cell growth in the nervous system [23]. We also identified a single EST (Genbank EV431998) within the 13.5kb region from the Nasonia EST dataset [10]. The EV431998 EST contains 5–8 stop codons in each frame and is not spliced, and therefore does not appear to be a protein-coding gene. RT-PCR of EV431998 failed to detect this transcript from wing, leg or whole prepupa cDNA, whereas the primers did amplify from genomic DNA controls. The evidence therefore indicates that the ws1 phenotype is due to non-coding DNA within the 13.5kb region.
A number of sequence differences occur between giraulti and vitripennis in the 13.5kb ws1 region (Figure 3D), including single nucleotide polymorphisms (SNPs), insertions/deletions (indels) and the insertion of a foldback transposable element into vitripennis. We sequenced the full foldback element and found that it does not contain protein coding sequences, but two inverted repeats of approximately 1.5kb and two small “stem loop” regions. Investigation of intraspecific variation in the 13.5kb region and ultra-fine scale mapping is now being undertaken to narrow the region that is involved in the ws1 phenotype.
Effects of ws1 on dsx and pros expression
Based on our findings revealing ws1 to contain the 5′ non-coding region of doublesex, we next determined whether this region affects dsx expression. Nasonia doublesex has male and female splice-forms, and experimental evidence supports its role in sex determination in Nasonia [18]. As expected, the male splice-form of dsx (dsxM) is present in developing male wings of vitripennis (ws1vV) and ws1gV_40kb (Figure S3). However, quantitative RT-PCR reveals an estimated 2.4X higher level of dsxM transcript in developing prepupal male wings of ws1v relative to ws1g in the same vitripennis genetic background (Figure 4; U-test, p = 0.04, n = 7 biological replicates). In contrast, there is no significant difference between the two genotypes in dsxM transcript levels in male legs or whole pre-pupae (Figure 4; U-tests, p>0.05, n = 5). We also measured expression of dsx in female wings using non-sex-specific primers and observed no clear difference due to ws1g (median 1.01x expression difference, n = 3; Table 3).


No expression difference was found in male wings for the flanking gene prospero (Table 3; median 1.07x expression difference between ws1vV and ws1gV_40kb). We note that while the introgression appeared to have no effect on pros expression in wings, higher pros transcript levels were observed in ws1vV_40kb whole prepupae (Table 3). A likely explanation for this whole-body effect is that the larger 40kb of giraulti sequence in the tested strain extends over part of the pros gene, possibly affecting its regulation in whole body.
These gene expression data provide a sex - and tissue-specific correlation between dsx expression level and wing size. As with other positional cloning studies, our data do not rule out alternative scenarios that could link causative sequence changes in the 13.5kb region to wing size, such as (undetected) effects on prospero or long-distance regulation of a different gene. However, we do note that we started with a sex-specific phenotype and “walked” to a region adjacent to a gene known to be involved in somatic sex determination. Future work will be geared towards determining how ws1 affects sex-specific changes in wing development, and specifically whether changes in dsx expression level causally influence male wing size in Nasonia.
Concluding remarks
Our results show that non-coding changes are responsible for the ws1 male-specific wing phenotype. Unlike studies of candidate genes involved in sex differentiation, the positional cloning approach is candidate-blind, so it is intriguing that the region we identified as causing a sex specific increase in wing size (ws1) also contains the 5′ UTR of the sex-signaling gene doublesex. Nevertheless a causal relationship between ws1 and dsx has not yet been established. Previous studies [3],[24] have implicated dsx in the evolution of sex-specific morphology. But rather than changes in doublesex itself, these studies revealed changes in downstream targets of dsx, via changes to specific DNA sequences to which DSX protein binds in the cis-regulatory regions of the bric-a-brac and desatF genes and affecting sex differences in abdominal pigmentation and pheromone production. In this study, we observed tissue-specific changes in dsx level, possibly due to cis-regulation. Dsx expression level manipulation has been found to affect cell number of a sex-specific cell type in the Drosophila brain [25]. If dsx is indeed the mechanism behind ws1, it would be the second case of dsx regulating sex-specific cell proliferation. Further, it would suggest that sex-specific morphology can evolve by spatially regulated changes in expression within the sex-determining pathway without disrupting other sex-determination functions. Other molecular mechanisms linking the cloned 13.5kb ws1 region to wing size evolution could also occur, including cis-regulation of prospero, changes in non-coding RNAs, or long-distance regulation of another gene. Prospero is of particular interest because it is a transcription factor known to regulate cell proliferation in the Drosophila nervous system [23].
Cell size and cell number regulation are crucial elements of both organ size determination and control of human diseases such as cancer and diabetes [26]. Understanding how growth regulation can evolve therefore has the potential to broaden our knowledge of the operation of these gene networks. One notable example of organ size evolution is fw2.2, which regulates tomato fruit size via cell number changes [27]. This gene was positionally cloned [27] and found to be a cell cycle regulator in plants [28]. In Nasonia, non-coding cis-regulatory evolution at the ws1 locus causes changes in both cell size and cell number. The two genes flanking the ws1 region, doublesex and prospero, have both been found to regulate neuronal cell numbers in Drosophila, and doublesex does so sex-specifically [23],[25]. How a 45% change in organ size might be achieved by either of these genes, each of which has a conserved homologue in the human genome, remains to be determined.
This study demonstrates the feasibility of positional cloning genes in Nasonia. A number of biologically important phenotypic differences occur between Nasonia species, which are ripe for genetic investigation using this approach, such as wing and antennal morphology [20], [29]–[30], host preference [14], pheromones and cuticular hydrocarbons [31], diapause [32], hybrid incompatibility [33]–[35], male courtship behavior [36] and female mate preference [20],[37]. The four known Nasonia species are all inter-fertile in the laboratory, facilitating the isolation of genes involved in complex trait differences between each species [15],[30]. The availability of genome sequences [10] combined with the haplodiploid positional cloning methods described here now make it possible to determine the evolution of these complex traits on a molecular level in this emerging model organism [9].
Materials and Methods
Strains used
Wing measurements were conducted using the inbred N. vitripennis strain AsymC and inbred N. giraulti strain R16A; these data are also reported in [15]. Gene expression experiments were conducted with the N. vitripennis AsymCX strain used for genome sequencing [10], which was derived from AsymC by multiple generations of sib-mating. All wing size and gene expression experiments used the minimal-introgression ws1gV strain ws1gV_40kb, produced by backcrossing and selection for recombinants between ws1 and linked visible and lethal mutants (see Positional Cloning below). This strain contains ∼40Kb of introgressed giraulti DNA containing ws1g in a vitripennis genetic background. It was constructed by backcrossing males from minimal-recombinant strain wm114 (Rec 4 in Figure 3C) into AsymCX for 10 generations to produce a homogeneous genetic background. Wild-type N. vitripennis and N. giraulti are also referred to as ws1vV and ws1gG in the text.
Wing size, cell size, and cell number measurements
Wing measurements were performed as in [15]. Briefly, individual females were given two Sarcophaga bullata hosts for 48 hours at 25C after host-feeding for 24 hours on two hosts (which were discarded). Male wing samples were collected from the offspring of single virgin females, while female wing samples were collected from the offspring of single mated females. Adult wings were dissected at the hinge adjoining the thorax and dry mounted on microscope slides under coverslips. Five individuals per family for 5–8 families were mounted; occasional damaged or misshapen wings meant that four individuals per family were measured.
Wings were photographed on a Zeiss AxioImager Z1 compound scope at 10X as mosaic images. Measurements were performed on the wing images using AxioVision 4.6 software (Zeiss). Wing length, width, area, and head width (inter-ocular distance, a measure of body size) were measured as in [15]. Briefly, wing length is the distance between a notch at the proximal anterior end of the costal cell and the distal tip of the forewing. Wing width is the distance perpendicular to the length axis between the most anterior and most posterior points on the wing. Wing area is defined by outlining the wing starting at the proximal anterior notch. Measurements of wild-type N. vitripennis and N. giraulti shown here (Figure 1) are also reported in [15]. Images of ws1gG and ws1vV male wings shown in Figure 1 were cropped to remove other mounted wings which appear in frame but are not related to the displayed image.
Setae, hair-like structures produced by cells on the wing blade, were used to infer changes to cell size and number. This approach has been used to estimate cell size in other insects, particularly Drosophila [19]. To determine if seta number is a reasonable estimator of cell number in Nasonia, the number of cells per seta was determined at the red-orange-eye pupal stage, where setae are most distinguishable before the wing sclerotizes and cell nuclei disappear. Pupal male forewings were clipped and dissected from the cuticle in 1x TBST (6g Tris, 8.76g NaCl, 1mL Tween, 0.2g NaN3, 1L H2O, pH 7.5) then fixed on lysine-coated slides in 3.7% formaldehyde. Slides were stained with DAPI and Alexa Fluor488-Phalloidin (Invitrogen, Carlsbad, CA, USA) and mounted in ProLong Gold (Invitrogen). The wing is not completely expanded at this stage and has some three-dimensional structure (Figure S1). Therefore, wings were imaged at 20x as mosaics under multiple focal planes, so that setae on both wing surfaces and all nuclei could be detected. All setae and nuclei were then counted within a 30 µm radius circle placed between the stigma and the distal tip of the forewing.
Cell size and cell number estimates were derived from seta measurements on adult wings. Seta number and area per seta were counted in the distal half of the wing, where setae occur, following [15]. Specifically, a subset of the mounted adult male forewings was re-imaged at 20x through multiple focal planes. Each seta on the dorsal surface of the wing was counted and the area of the seta-containing part of the wing was measured (defined as the area distal to the costal cell, based on the length (proximal-distal) axis described above; [15]). Cell number was inferred from the total seta number. Cell size was inferred by estimating the mean area occupied by each seta based on nearest neighbor distances using a custom perl script. Specifically, the average distance to each seta's four nearest neighbors (nnd4i) was calculated and then average area per seta across all i setae was estimated as the mean of pi * (nnd4i /2)2.
Pairwise comparisons of wing measurements between genotypes (strains) were conducted using Tukey's Honestly Significant Difference (HSD test, [38]), based on ANOVAs using family as a nesting factor within genotype. Because several morphological variables were measured per genotype, we used the conservative Bonferroni correction for multiple tests. P-values shown were corrected by multiplying by the number of tests conducted in each analysis (Table 1: 8 tests (4 variables and 2 sexes per genotype). Table 2: 3 tests (3 variables per genotype).
Positional cloning methods
Positional cloning efforts were begun by identifying visible mutants linked to ws1. Using the original ws1 introgression from giraulti into vitripennis (INTw1.1, [13]), it was ascertained that the visible eye color mutant or123 and body color mutant bl13 map near to ws1. A second introgression of ws1g into vitripennis containing a large giraulti flanking region was used for most of the fine-scale mapping and positional cloning work (strain INT_bkbw, described in [14]). This introgression contains a naturally occurring giraulti black eye color allele, bkg, linked to ws1. We found that bkg fails to complement the N. vitripennis mutant bk576 in heterozygous females. bkg produces oyster-gray eyes in the pe333 (peach eye) mutant background, which is easier to see than the black eyes of the mutant in wild-type background. A recombination map of these visible markers is shown in Figure 3A.
To further assist in the positional cloning, recessive lethal mutations linked to ws1 were generated in the INT_bkbw strain by ethyl methanesulfonate (EMS) treatment of males carrying ws1g. Ten bkbw (ws1g bkg; pe333) males were placed in 25mm Drosophila vials containing filter paper soaked 10% sucrose solution containing 0.25–0.5% EMS (Sigma Chemical). After 7–10h, males were transferred to a vial containing clean filter paper overnight. Mutagenized males were then crossed to linked visible mutant strain bl13; pe333. F1 virgin females were collected, transferred to individual cells of plastic 24-well culture plates (various manufacturers) and given a single fly host to lay eggs. Plates were sealed with a double layer of Micropore tape (product number 1530–03, 3M Corporation) and incubated at 25C. After 48h, females were transferred to a new plate containing a pe333 male black-stage pupa and a spot of honey water. After mating, the wasps were anaesthetized at 4C and on ice, 2 fly hosts were added to each well, and then incubated at 21C. Newly-created linked recessive lethal markers were identified by distortions in F2 ratios of the visible markers (ws1g, bkg and bl13) among the haploid F2 males of the virgin hosting (as in Figure 2) and then linkage relationships were determined. Lethal lines were maintained using heterozygous female offspring. One lethal line, lethalD4, was primarily used for mapping in this study, due to its close linkage to ws1 and its position on the side opposite the visible markers (Figure 3A).
To collect recombinant males for positional cloning, females heterozygous for ws1g and a flanking visible or lethal marker were set as virgins and resulting haploid male progeny were screened for recombination between the marker locus and ws1 by phenotype (Figure 2). Use of lethals in this approach was especially effective because non-recombinant haploid lethal ws1g males die; the only surviving males carrying the ws1g allele were recombinants between the lethal and wing size locus. Penetrance of the lethal genes used was found to be 100%. These tightly linked markers increased the “effective” discovery rate of recombinants within the region by 100–200 fold, greatly enhancing efficiency of the positional cloning efforts.
A crucial step in the cloning effort was identification of molecular markers within the ws1 region to assist in fine-scale recombinant mapping. Initially this was accomplished by screening the original ws1gV introgression line and recombinants between it and flanking visible markers for linked Amplified Fragment Length Polymorphism (AFLP) markers. This was done using methods previously reported in [39]. A marker termed “AF1” was identified and found to be tightly linked to ws1. The marker was cloned and sequenced. PCR products from primers designed to AF1 were used to screen a BAC library to N. vitripennis. Ends of a subset of BACs were sequenced, the library re-screened, and then RFLP typed to assemble a set of contig BACs [21]. BAC-end sequences were then used to generate a set of molecular markers distinguishing vitripennis and giraulti by PCR and RFLP (Table S1; [21]). Subsequent sequencing of a giraulti BAC (Genbank accession AC185330) which included the entire ws1g region and alignment of vitripennis and giraulti trace reads from the Nasonia genome project were used to identify additional PCR markers for ultra fine-scale mapping, and identification of recombination breakpoints by sequencing. Genotyping primers and PCR conditions are shown in Table S1.
Over 2000 recombinant haploid males were identified between ws1 and either the visible or lethal marker. These were screened with molecular markers to identify the location of recombination within the region around ws1. The most informative recombinants are shown in Figure 3C. These include recombinants produced from the INT_w1.1 introgression (Rec 5) and the INT_bkbw introgression (Recs 1–4, 6–7). To define the ws1 region further, a strain was established from a recombinant between the flanking lethalD4 and ws1 that contained a relatively small region of giraulti introgression but retained the large wing phenotype (Rec1 in Figure 3C). This strain was used for subsequent recombination to the other flanking region (bl13 side). A recombinant from this second set containing only 40kb of giraulti sequence (Rec4, Figure 3C) yet still showing the “ws1” large-wing phenotype (Figure 1) was then backcrossed into the genome-sequenced AsymCX strain for >10 generations, and then purebred. This strain (called ws1gV_40kb) was used for wing measurements and quantitative PCR. Additional recombinants from these experiments further localized the ws1g effect to a 10.8kb region in giraulti, and a corresponding 13.5kb in vitripennis due to insertion/deletion differences. We examined this sequence and flanking regions for gene predictions [10] and also manually scanned the region for open reading frames and ESTs [18]. The region does not contain protein coding sequence for dsx, but only the dsx 5′ UTR, promoter and cis-regulatory region.
Recombination rate
We estimated the recombination rate between ws1 and lethalD4 by counting all (living) male offspring of a set of virgin females (lethalD4 ws1g/+ +) hosted for positional cloning. 89 males out of 15594 screened were recombinant (+ ws1g), a map distance of 0.57cM. Of a larger set of 683 + ws1g recombinant males screened with the ws1–8 marker (Table S1), 6 were recombinant between ws1–8 and ws1g, a distance of 36–50kb (uncertainty is due to the uncertainty in the location of ws1g in the 13.5kb region). Local recombination rate was calculated as [(0.57 cM between ws1g and lethalD4) / (683 recombinants between ws1g and lethalD4)] *[(6 recombinants between ws1g and ws1–8) / (36 or 50kb between ws1g and ws1–8)] = 0.14 – 0.10 cM/Mb.
RT–PCR and quantitative RT–PCR
RNA was isolated from wing discs, leg discs and whole individuals at the third instar larvae - prepupal transition. We found that this stage can be precisely identified to a few hours, between defecation of the larvae and ecdysis. Wing and leg discs were dissected from post-defecation prepupae under RNAse free conditions in 1X phosphate-buffered saline. After dissection, tissues were placed immediately on dry ice and if necessary stored at −80°C until RNA was isolated. Independent extractions of tissue were conducted to produce independent biological replicates. Each biological replicate consisted of 15–30 prepupal wings or legs or a single whole prepupa of each genotype (ws1vV and ws1gV_40kb). Total RNA was isolated using Trizol (Invitrogen). RNA was then quantified using a Qubit fluorometer (Invitrogen) and a Quant-iT RNA Assay Kit (Invitrogen) or a ND-1000 Spectrophotometer (NanodropTechnologies, Oxfordshire, UK). Expression of EV431998 was tested in RT-PCR with primers TCGAGGCGGATAGTAAGGGC and AACTTTGTATTCCCTCAGCCAC. RT-PCR of other genes (dsx and pros) and reaction conditions are presented in [18].
For quantitative RT-PCR, first-strand cDNA Synthesis and qPCR were performed using SuperScript™ III Platinum SYBR Green Two-Step qRT-PCR Kit with ROX (Invitrogen) on an Applied Biosystems 7300 Real Time PCR System. RNA samples were split into reverse-transcribed and -RT controls. Male specific dsx (dsxM) was amplified using primers GCGGATGTGGAAGTAGCCAT and AATACTTGAACTTTTGACGATAAGCACT (Figure S2). In females, dsx was amplified using non-sex-specific primers CGAGCCACTGCCGAGTAT and TGGTAGCCAAACCGTTGTAAT. pros was amplified with GCTGATGTTCTTCTGGGTGAG and CCAGGAAGTTAGGACTCTTGAAG. The ribosomal protein rp49 was used as a control, with primers CTTCCGCAAAGTCCTTGTTC and AACTCCATGGGCAATTTCTG. All steps were performed according to the respective manufacturer's protocols. Each biological replicate was tested with two primer pairs (e,g., dsxM and rp49). Each experiment was composed of one ws1gV_40kb and one ws1vV tissue sample (15–30 wings, 15–30 legs, or one whole prepupa), +RT and –RT, each run in triplicate. The median cycle threshold value of each triplicate was used for calculation. Expression ratios of dsx to rp49 were calculated using the 2−ΔΔCT method [40]: 2̂-((ct[ws1vV dsxM] - ct[ws1vV rp49]) - (ct[ws1gV_40kb dsxM] - ct[ws1gV_40kb rp49])). Expression ratios were not corrected for differential amplification efficiency, and so the magnitude of expression ratios should be considered approximate.
Supporting Information
Zdroje
1. KoppA
TrueJR
2002 Evolution of male sexual characters in the Oriental Drosophila melanogaster species group. Evol Dev 4 278 291
2. KoppA
DuncanI
CarrollSB
2000 Genetic control and evolution of sexually dimorphic characters in Drosophila. Nature 408 553 559
3. WilliamsTM
SelegueJE
WernerT
GompelN
KoppA
2008 The regulation and evolution of a genetic switch controlling sexually dimorphic traits in Drosophila. Cell 134 610 623
4. SternDL
2000 Perspective: Evolutionary Developmental Biology and the Problem of Variation. Evolution 54 1079 1091
5. CarrollSB
2005 Evolution at Two Levels: On Genes and Form. PLoS Biol 3 e245 doi:10.1371/journal.pbio.0030245
6. HoekstraHE
CoyneJA
2007 The locus of evolution: evo devo and the genetics of adaptation. Evolution 61 995 1016
7. SternDL
OrgogozoV
2008 The loci of evolution: How predictable is genetic evolution? Evolution 54 2155 2177
8. WagnerGP
LynchVJ
2008 The gene regulatory logic of transcription factor evolution. Trends Ecol Evol 23 377 385
9. WerrenJH
LoehlinDW
2009 Nasonia: An Emerging Model System With 10. Haplodiploid Genetics. CSH Protoc doi:10.1101/pdb.emo134
10. WerrenJH
RichardsS
DesjardinsCA
NiehuisO
GadauJ
2010 Functional and evolutionary insights from the genomes of three parasitoid Nasonia species. Science. In press
11. BreeuwerJAJ
WerrenJH
1990 Microorganisms Associated With Chromosome Destruction and Reproductive Isolation Between Two Insect Species. Nature 346 558 560
12. BordensteinSR
WerrenJH
2007 Bidirectional Incompatibility among divergent Wolbachia and incompatibility level differences among closely related Wolbachia in Nasonia. Heredity 99 278 287
13. WestonRF
QureshiI
WerrenJH
1999 Genetics of a wing size difference between two Nasonia species. J Evol Biol 12 586 595
14. DesjardinsCA
PerfecttiF
BartosJD
EndersLS
WerrenJH
2010 The genetic basis of interspecies host preference differences in the model parasitoid Nasonia. Heredity. In press. DOI:HDY.2009.145
15. LoehlinDW
EndersLS
WerrenJH
2010 Evolution of sex-specific wing shape at the widerwing locus in four species of Nasonia. Heredity. In press DOI:HDY.2009.146
16. WhitingAR
1967 The biology of the parasitic wasp Mormoniella vitripennis [ = Nasonia brevicornis] (Walker). Q Rev Biol 42 333 406
17. RaymondCS
MurphyMW
O'SullivanMG
BardwellVJ
ZarkowerD
2000 Dmrt1, a gene related to worm and fly sexual regulators, is required for mammalian testis differentiation. Genes Dev 14 2587 2595
18. OliveiraDCSG
WerrenJH
VerhulstEC
GiebelJD
KampingA
2009 Identification and characterization of the doublesex gene of Nasonia. Insect Mol Biol 18 315 324
19. ZwaanBJ
AzevedoRBR
JamesAC
Van 'T LandJ
PartridgeL
2000 Cellular basis of wing size variation in Drosophila melanogaster: a comparison of latitudinal clines on two continents. Heredity 84 338 347
20. RaychoudhuryR
DesjardinsCA
BuellesbachJ
LoehlinDW
GrillenbergerBK
2010 Behavioural and Genetic Characteristics of a New Species of Nasonia. Heredity. In press DOI:HDY.2009.147
21. Muñoz-TorresM
SaskiC
BlackmonB
Romero-SeversonJ
TomkinsJ
2010 Development of bacterial artificial chromosome library resources for parasitoid Hymenoptera (Nasonia vitripennis and Nasonia giraulti: Pteromalidae). Insect Mol Biol In press
22. NiehuisO
GibsonJD
RosenbergM
PannebakkerB
KoevoetsT
2010 Recombination and its impact on the genome of the haplodiploid parasitoid wasp Nasonia. PLoS ONE. In Press
23. DoeCQ
Chu-LaGraffQ
WrightDM
ScottMP
1991 The prospero gene specifies cell fates in the Drosophila nervous system. Cell 65 451 464
24. ShirangiTR
DufourHD
WilliamsTM
CarrollSB
2009 Rapid Evolution of Sex Pheromone-Producing Enzyme Expression in Drosophila. PLoS Biol 7(8)26 doi:10.1371/journal.pbio.1000168
25. SandersLE
ArbeitmanMA
2008 Doublesex establishes sexual dimorphism in the Drosophila central nervous system in an isoform-dependent manner by directing cell number. Dev Biol 320 378 390
26. KozmaSC
ThomasG
2002 Regulation of cell size in growth, development and human disease: PI3K, PKB and S6K. Bioessays 24 65 71
27. FraryA
NesbittCT
FraryA
GrandilloS
van der KnaapE
2000 Fw2.2: a quantitative trait locus key to the evolution of tomato fruit size. Science 289 85 88
28. CongB
TanksleySD
2006 FW2.2 and cell cycle control in developing tomato fruit: a possible example of gene co-option in the evolution of a novel organ. Plant Mol Biol 62 867 880
29. DarlingDC
WerrenJH
1990 Biosystematics of Nasonia (Hymenoptera: Pteromalidae): Two new species reared from birds' nests in North America. Ann Ent Soc Am 83 352 370
30. GadauJ
PageRE
WerrenJH
2002 The genetic basis of the interspecific differences in wing size in Nasonia (Hymenoptera: Pteromalidae): major quantitative trait loci and epistasis. Genetics 161 673 684
31. SteinerS
HermannN
RutherJ
2006 Characterization of a female-produced courtship pheromone in the parasitoid Nasonia vitripennis. J Chem Ecol 32 1687 1702
32. WolschinF
GadauJ
2009 Deciphering proteomic signatures of early diapause in Nasonia. PLoS ONE 4 e6394 doi:10.1371/journal.pone.0006394
33. BreeuwerJAJ
WerrenJH
1995 Hybrid Breakdown Between Two Haplodiploid Species: The Role of Nuclear and Cytoplasmic Genes. Evolution 49 705 717
34. NiehuisO
JudsonAK
GadauJ
2008 Cytonuclear genic incompatibilities cause increased mortality in male F-2 hybrids of Nasonia giraulti and N. vitripennis. Genetics 178 413 426
35. ClarkME
O'HaraPF
ChawlaA
WerrenJH
2010 Behavioural and spermatogenic hybrid male breakdown in Nasonia. Heredity In press. DOI:HDY.2009.152
36. BeukeboomLW
Van den AssemJ
2002 Courtship and mating behaviour of interspecific Nasonia hybrids (Hymenoptera, Pteromalidae): A grandfather effect. Behav Genet 31 167-.177
37. VelthuisBJ
YangW
van OpijnenT
WerrenJH
2005 Genetics of female mate discrimination of heterospecific males in Nasonia (Hymenoptera, Pteromalidae). Anim Behav 69 1107 1120
38. SokalRR
RohlfFJ
1994 Biometry (3rd edition). 880p San Francisco W.H. Freeman and co
39. VosP
HogersR
BleekerM
ReijansM
van de LeeT
1995 AFLP: A new technique for DNA-fingerprinting. Nucleic Acids Res 23 4407 4414
40. LivakKJ
SchmittgenTD
2001 Analysis of relative gene expression data using real-time quantitative PCR and the 2−ΔΔCT method. Methods 25 402
Štítky
Genetika Reprodukční medicínaČlánek vyšel v časopise
PLOS Genetics
2010 Číslo 1
- Kazuistika – Perspektivy využití precizované medicíny v rámci personalizované specifické terapie onkologických pacientů
- Nobelova cena za chemii pro genetické nůžky: Objev, který změní naši budoucnost?
- Technologie na bázi RNA v klinické praxi: od přebarvených petúnií k terapii vzácných a dosud jen obtížně léčitelných chorob u lidí
- „Nepředstavovali jsme si, že náš výzkum povede přímo ke vzniku nových léků, dokonce ještě za našeho života“
- Bezplatné služby pro diagnostiku ATTRv amyloidózy pro kardiology
Nejčtenější v tomto čísle
- A Major Role of the RecFOR Pathway in DNA Double-Strand-Break Repair through ESDSA in
- Kidney Development in the Absence of and Requires
- The Werner Syndrome Protein Functions Upstream of ATR and ATM in Response to DNA Replication Inhibition and Double-Strand DNA Breaks
- Alternative Epigenetic Chromatin States of Polycomb Target Genes
Zvyšte si kvalifikaci online z pohodlí domova
Mazová zátka a její řešení
nový kurzVšechny kurzy