
Genetic Crossovers Are Predicted Accurately by the Computed Human Recombination Map
Hotspots of meiotic recombination can change rapidly over time. This instability and the reported high level of inter-individual variation in meiotic recombination puts in question the accuracy of the calculated hotspot map, which is based on the summation of past genetic crossovers. To estimate the accuracy of the computed recombination rate map, we have mapped genetic crossovers to a median resolution of 70 Kb in 10 CEPH pedigrees. We then compared the positions of crossovers with the hotspots computed from HapMap data and performed extensive computer simulations to compare the observed distributions of crossovers with the distributions expected from the calculated recombination rate maps. Here we show that a population-averaged hotspot map computed from linkage disequilibrium data predicts well present-day genetic crossovers. We find that computed hotspot maps accurately estimate both the strength and the position of meiotic hotspots. An in-depth examination of not-predicted crossovers shows that they are preferentially located in regions where hotspots are found in other populations. In summary, we find that by combining several computed population-specific maps we can capture the variation in individual hotspots to generate a hotspot map that can predict almost all present-day genetic crossovers.
Published in the journal:
. PLoS Genet 6(1): e32767. doi:10.1371/journal.pgen.1000831
Category:
Research Article
doi:
https://doi.org/10.1371/journal.pgen.1000831
Summary
Hotspots of meiotic recombination can change rapidly over time. This instability and the reported high level of inter-individual variation in meiotic recombination puts in question the accuracy of the calculated hotspot map, which is based on the summation of past genetic crossovers. To estimate the accuracy of the computed recombination rate map, we have mapped genetic crossovers to a median resolution of 70 Kb in 10 CEPH pedigrees. We then compared the positions of crossovers with the hotspots computed from HapMap data and performed extensive computer simulations to compare the observed distributions of crossovers with the distributions expected from the calculated recombination rate maps. Here we show that a population-averaged hotspot map computed from linkage disequilibrium data predicts well present-day genetic crossovers. We find that computed hotspot maps accurately estimate both the strength and the position of meiotic hotspots. An in-depth examination of not-predicted crossovers shows that they are preferentially located in regions where hotspots are found in other populations. In summary, we find that by combining several computed population-specific maps we can capture the variation in individual hotspots to generate a hotspot map that can predict almost all present-day genetic crossovers.
Introduction
Meiotic crossovers are tightly clustered into hotspots in many organisms, including human, mouse and yeast [1]–[4]. Although hotspots may not be necessary to explain patterns of linkage disequilibrium in human populations [5], their existence is strongly supported by numerous experimental studies [6]–[9] (for review see [3],[4]) and detailed studies of the MHC class II region indicate that hotspots are mainly responsible for the patterns of linkage disequilibrium in that region [10]. High resolution experimental studies also show that hotspots are surrounded by regions of very low recombination rates, much lower than the genome average [8],[11],[12].
Although hotspots exist, their existence as well as their transmission from generation to generation is puzzling. According to current models of meiotic recombination [1]–[3] the fragment of DNA around the double strand break (DSB) from the initiating chromosome is replaced with the DNA sequence from the non-initiating chromosome. Therefore, if this initiating DSB is caused by a genetic element located inside or near the hotspot, theoretical studies predict that hotspots will self destruct (the hotspot paradox) [13]. As a consequence, theoretical analyses and computer simulations show that there should be a constant turnover of hotspots [14]–[16]. Thus, it is difficult to explain the existence and relative abundance of strong hotspots [16], although simulations suggest that genetic drift can lead to fixation of weaker hotspots [14],[15]. Some potential solutions of the hotspot paradox include alternative activation mechanisms [17],[18] or incorporation of natural selection in the analysis [19].
In agreement with theoretical analyses, a high level of variation in meiotic recombination has been observed in humans (for review see [4], [20]–[23]). It has been shown that there is essentially no correlation in the positions of the hotspots of meiotic recombination between chimpanzee and human in the roughly 1.5 Mb region compared [24]–[26]. In the shorter timescale of human evolution, variation in meiotic recombination between individuals and populations has been seen using both cytogenetic and genetic methods [23],[27],[28], by computational studies of patterns of linkage disequilibrium in several dozen human genes [29]–[35] and by the direct observation of polymorphisms in hotspots detected by sperm genotyping [7], [8], [11], [36]–[41]. Interestingly, on a megabase scale recombination rates appear to be similar between populations [42],[43] and even in distantly related species, such as human and mouse [44], suggesting the existence of constraints on domain-wide recombination rates.
The mechanisms responsible for hotspot formation and the regulation of hotspots in humans are poorly understood. If in yeast, for example, the presence or absence of short sequence motifs can turn on and off meiotic recombination at specific locations (see [2] for review); in mammals the situation appears to be more complex. Although a redundant 13-mer CCNCCNTNNCCNC has been identified in the human genome as associated with higher recombination rates [45] it is relatively non-specific and is found near only 40% of hotspots. Thus, it is unlikely that this motif can explain all hotspots in humans. Nevertheless, strand asymmetry in the initiation of meiotic recombination has been observed in several human [36],[37],[40],[41] and mouse hotspots [46]–[51]. It has been also shown that this haplotype-specific variation in meiotic recombination can be inherited [41]. This differential activity of haplotypes indicates that subtle sequence or epigenetic differences can dramatically influence meiotic recombination both at the level of hotspots and, as reported, on a more global level as well [27],[52]. In terms of the mechanism of regulation, both cis - and trans-activating genetic factors have been identified in human [53] and mouse [46],[49],[50]. Several chromatin modifications, notably H3K4 tri-methylation are associated with meiotic recombination in yeast [54],[55] and mouse [56]. A combination of such epigenetic and genetic factors is likely responsible for the high level of variation in meiotic recombination in humans.
Studies of the regulation of meiotic recombination are hampered by the fact that currently there is no practical way to experimentally determine genome-wide hotspot map in human. A commonly used approach suitable for defining genome-wide hotspot map is to calculate recombination rates from patterns of linkage disequilibrium in human populations. There are many potential reasons why the computed map may be different from the actual distribution of present-day crossovers. One possibility is rapid change in the meiotic hotspots. Another possibility is errors inherent in calculating recombination rate profiles from population variability data. The inaccuracy in defining recombination rates from sequence variation data is high [34], [57]–[59]. Current methods rely on a rather simplistic population history model and substantial deviations in local population history will affect rate estimates [58],[60]. Natural selection also may lead to both the “disappearance” [60] and “appearance” [61] (although these findings were later disputed [62]) of hotspots. A lack of diversity in population samples will also lead to an inability to accurately reconstruct recombination rates (see [60] and references therein). Thus, it is important to establish how well the computed map predicts genetic crossovers.
Recently Coop et al. [52] performed a genome-wide mapping of meiotic crossovers in Hutterites and compared the locations of crossovers with the positions of computed hotspots. They reported that while the majority of crossovers originate in hotspots, approximately 40% of recombination events take place outside of hotspots calculated from patterns of linkage disequilibrium. Moreover, they observed a great variation in the usage of LD-defined hotspots in different individuals. In up to a third of individuals the estimated hotspot usage (fraction of recombination events that originate in hotspots) is below 50% and even reaches 0% in two individuals (95% confidence interval less than 50% usage). This observation suggests that the calculated map may not accurately describe the distribution of meiotic recombination events in some individuals.
We, however, believe that some of the calculations in the Coop et al. paper are may not accurately reflect the similarity of the crossover distribution to the computed map. The most important conclusions in the Coop paper are based on the use of an indirect estimate for the true fraction of crossovers that originate in hotspots that did not take into account differences in hotspot strength and the variation in the background recombination rate. All calculations are based on “hotspot usage” as defined by Coop et al. This usage, however, would be identical whether a very strong hotspot is surrounded by areas of low recombination rate or a very weak hotspot is in a region with a high background. To evaluate the accuracy of the computed map we have mapped crossovers in CEPH pedigrees and then estimated how well this map predicts the positions of the crossovers. In our work we are not only asking if hotspots explain all crossovers, but also if the distribution of crossovers is consistent with the computed map.
Results
Mapping crossovers in CEPH families
To define regions recombining in the present day we determined 4778 intervals containing crossovers in 69 siblings from ten large CEPH Utah reference families (CEPH/UTAH Pedigrees 1334, 1340, 1341, 1350, 1362, 1408, 1420, 1447, 1454 and 1459, grandparents and parents from these families were previously genotyped by the HapMap project [32],[63] as a part of the CEU population) using the Affymetrix 500K mapping set (see Methods). To map crossover positions from SNP genotype data we developed an algorithm that phases chromosomes in nuclear families with multiple siblings and then determines regions where derived chromosome sequence switches from one of the parental chromosomes to the other. We first determined phase in the positions where trivial haplotype inference is possible (SNPs homozygous in one parent and heterozygous in the other) and then in the positions heterozygous in both parents (for details see Text S1). The uncertainty in defining crossover positions ranges from 50 bp to over 30 Mb (a crossover mapped to centromere of chromosome 9) with a median of ∼70 Kb (Figure S1, Table S1, Table S2). The patterns of the distribution of crossovers such as an excess of maternal crossovers, and telomeric distribution of paternal crossovers are consistent with previously reported observations (Figure S2). We achieved substantially higher resolution of crossover mapping (70 vs 93 Kb) than has been reported before [52], although it is not clear whether this improvement is due to the more precise crossover mapping or results from differences between the CEPH and Hutterite datasets. The higher resolution of crossover mapping may be partially explained by the ∼10% higher number of genotyped SNPs in our study and by the larger number of children per CEPH family (6.9 on average) compared to the number of children per Hutterite family.
We used a coalescence-based computational approach [57] (see Methods for details on computational procedures) to estimate the genome-wide recombination rates for each of the populations represented in Phase II of the HapMap dataset [32] and then we identified hotspots in each of the population-specific recombination rate maps and in a population-averaged map (Figure S3, Table S3). Hotspots were defined as peaks in the recombination rate profile less than 100 Kb in width with strength above 0.01 cM. The use of this definition results in the identification of 45,872 hotspots in the CEU sample (see Text S1 for details). In addition to using the peak-based definition of the hotspots, we also included in the analysis 32,996 hotspots previously inferred from the HapMap Phase II dataset using the likelihood-ratio test implemented in LDHot [32],[63]. LDHot hotspots were defined as hotspots detected in more than one population and thus they are not population specific. The work by Coop et al [52] is based exclusively on LDHot hotspots and did not take into account differences in the strengths of the hotspots.
The population-averaged map accurately describes the distribution of present day crossovers
First we asked how well hotspots predict CEPH crossovers. Since the average size of crossover-containing intervals is comparable with the distance between hotspots, some crossover intervals overlap hotspots due to our inability to map them precisely. To address this issue we analyzed separately three subsets of crossovers mapped to intervals of different size (Figure 1). Smaller crossover intervals are less likely to overlap hotspots by chance (Figure S4).

In general, the distribution of present-day crossovers is clearly non-random. Crossovers are relatively well predicted by either LDHot - or peak-defined hotspots. The majority of crossover intervals overlap hotspots and the proportion of predicted crossovers is significantly higher (P<0.001 by simulation) than for identically sized crossover intervals randomly distributed in the genome. While 68%–74% of crossover intervals smaller than 20 Kb overlap hotspots, only 22 and 30% of randomly distributed crossovers intervals are expected to overlap hotspots (Figure S5, for details on simulation see Text S1). Nevertheless, we find that 26% of the present-day crossover intervals smaller than 20 Kb do not overlap CEU hotspots and 32% of crossover intervals do not overlap LDHot hotspots (Figure 1B and 1C). As expected, the percentage of crossover intervals overlapping hotspots is dependent on how accurately we can map the crossovers (Figure 1B and 1C, Figure S4). The percentage of not predicted (we consider crossovers to be “predicted” if crossover intervals overlap at least one hotspot) crossovers in the CEPH sample is very close to the percentage of not predicted crossovers previously reported in Hutterites (28% for crossover intervals smaller than 30 Kb [52] and Figure S6).
Hotspots account for only 71–79% of the genetic map (Table S3). Thus, even if crossovers would be distributed in perfect agreement with the map, a fraction of crossovers proportional to the fraction of the recombination rate map that lies outside hotspots is expected to be not predicted by hotspots. An additional complication in estimating the expected fraction of crossovers that overlap hotspots by chance arises from the limited resolution of the mapping of crossovers. The percentage of crossovers predicted by chance depends on the size and distribution of hotspots and the size of the crossover intervals. To calculate the expected fraction of predicted crossovers we performed a computer simulation. We re-distributed the experimentally determined crossover intervals according to the computed recombination rate map (Text S1). We generated 1000 datasets where crossovers were distributed according to the CEU or the population-averaged maps (Figure 1B and 1C).
Both the CEU and LDHot hotspots predict at least as many as expected CEPH crossovers (Figure 1B, Figure S6) and Hutterite crossovers (Figure S7) if we re-distribute crossovers according to the population-averaged map. For both sets of hotspots the fraction of not predicted crossovers is significantly lower than expected for crossover intervals smaller than 50 Kb and all crossover intervals (P<0.001 by simulation, Figure 1B, Figure S7, S8) and not significantly different for crossover intervals smaller than 20 Kb (P = 0.34 for CEU hotspots, P = 0.37 for LDHot hotspots, Figure 1B, Figure S7, S8). Thus, the observed fraction of not predicted crossovers agrees with the expected fraction of not predicted crossovers if crossovers are distributed according to the population-averaged map.
Unlike the results for the simulation with the population-averaged map, we find that when crossovers are distributed according to the CEU map the fraction of crossovers that are not predicted by the CEU hotspots is significantly higher than expected (P<0.001 by simulation for all sets of crossovers, Figure 1C, Figure S8). For LDHot hotspots, the fraction of not predicted crossovers is significantly higher than expected for crossover intervals smaller than 20 Kb and 50 Kb (P<0.001, P<0.017 by simulation, respectively) and is not different from expectations if we compare all crossovers (P = 0.18) (Figure 1C, Figure S7). This excess of not predicted crossovers is observed for all subsets of Hutterite crossovers as well (Figure S7). Thus, our computer simulation is sensitive enough to distinguish the population-averaged map from the CEU map and the population-averaged map appears to be closer to the observed distribution of crossovers.
Hotspots of different strengths are detected in the computed map with comparable efficiency
The comparison of observed and expected fractions of predicted crossover intervals did not take into account the relative strength of individual hotspots. One can imagine that weak or strong hotspots are predicted with different efficiency. To estimate the relative impact of hotspots of different strength on present-day crossovers we calculated how frequently hotspots of different strength overlap crossover intervals. Because the number of hotspots in the human genome is larger than the number of mapped crossovers in either CEPH or Hutterite datasets, we cannot perform such an assessment for the majority of individual hotspots. To account for this relatively low number of crossovers we grouped together hotspots of similar strengths. We ranked all CEU hotspots based on their strength and divided them into twenty bins of equal aggregate strength, so each of the bins is expected to predict an equal fraction of crossovers. For example, the first bin contains the 261 strongest hotspots and the last bin (bin number 20) contains the 11,837 weakest hotspots, but both are expected to predict 5% of crossovers (Table S4). We then calculated the percentage of crossovers actually predicted by each of the bins and plotted these values (Figure 2 and plotted according to the minimal strength of the hotspots in the bin in Figure S9, similar analysis performed for LDHot hotspots is presented in Figure S10). This cumulative recombination frequency graph indicates the relative capacity in predicting crossovers of hotspots of different strengths.
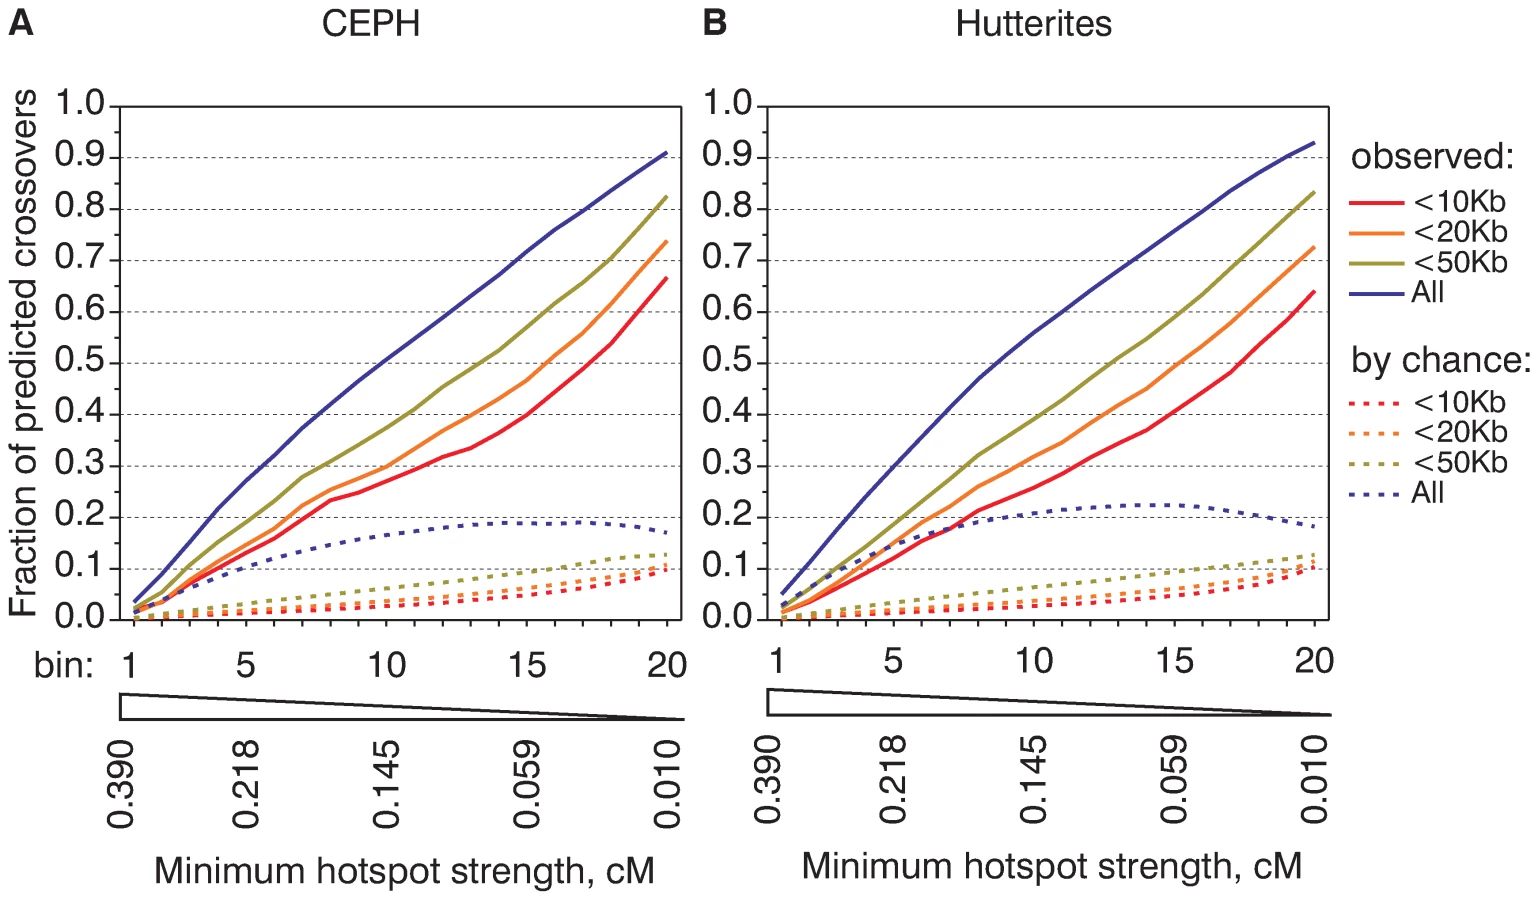
In the ideal case if crossovers could be mapped precisely, if hotspots could explain all crossovers and if the strength of hotspots could be estimated without errors we would expect to see a straight diagonal line with exactly 5% of crossovers per bin. The observed shape of the cumulative frequency graph although not ideal, is reasonably close to a straight line. This indicates approximately equal contributions from hotspots of different strength. The cumulative recombination frequency graphs are highly similar for the CEPH and Hutterite datasets (Figure 2) and for LDHot-defined hotspots (Figure S10). On the other hand, there is a marked difference in the slope of the cumulative frequency graph for subsets of crossovers mapped to larger and smaller intervals. This difference in the slope cannot be completely accounted by crossovers that overlap hotspots by chance (see Figure 2). This is likely an expression of finer differences between the computed map and the observed distribution of crossovers and indicates a tendency for not predicted crossovers to locate near hotspots.
The observed cumulative recombination frequency graphs are similar to those expected from the population-averaged map
Compared to the analysis presented on Figure 1 where all of the hotspots were combined, the cumulative recombination frequency graphs reflect the relative activity of hotspots of different strengths. To better estimate how close the computed recombination rate maps are to the observed distribution of crossovers we compared the observed cumulative recombination frequency graphs with those obtained by computer simulation (Figure 3, Figure S11). Here we again clearly see that the crossover distribution both in CEPH and Hutterite datasets resembles the population-averaged map better than the CEU map. We must note, however, that the observed distribution of crossovers is not identical to that of either the CEU or the population-averaged map. For most subsets of crossovers hotspots predict more crossover intervals than expected from the population-averaged map. This suggests that the population-averaged map slightly underestimates the strength of hotspots and the peak rate inside them. For the CEU map we see exactly the opposite effect — hotspots predict less crossovers than expected. This means that the CEU map tends to overestimate the strength of some hotspots and that the actual distribution of crossovers is less concentrated in hotspots compared to what would be expected from the CEU map.

How many crossovers are not predicted by hotspots?
Because some crossovers can overlap hotspots by chance, the observed proportion of crossover intervals overlapping hotspots can be higher than the true fraction of crossovers that were initiated in hotspots. There are several ways to estimate the proportion of hotspot-derived crossovers. One way is to calculate the fraction of predicted crossovers assuming that the distribution of not predicted crossovers is known. We have uniformly re-distributed crossovers near their original location and Coop et al [52] re-distributed crossovers normally. An application of this approach results in estimates of 23%–33% for the fraction of not predicted crossovers for smaller and larger crossover intervals respectively (see Text S1, Figure S12, Table S5 for details).
Another way to estimate the true proportion of hotspot-derived crossovers comes from examining cumulative frequency graphs. In the ideal situation for a perfect correlation between the map and the observed distribution of crossovers each bin would predict exactly 5% of crossovers. The difference between the “ideal” 5% slope and the observed slope in the cumulative recombination frequency graph is an estimate of the proportion of not predicted crossovers. This estimate is based on two assumptions: that in the middle of graph the fraction of crossovers overlapping hotspots by chance is low and that hotspots from all of the bins are equally effective in initiating crossovers. The first assumption is justified by the relatively low number of hotspots in the “stronger” bins. The fraction of crossovers that overlap hotspots by chance depends on the number of hotspots. The total number of hotspots in the first ten bins is only 7,778, or approximately 1/6 of all hotspots. We estimate that less than 0.5% crossovers per bin overlap hotspots by chance (see Figure 2). The second assumption is justified by the relatively linear shape of the graph.
The slope in the middle of the cumulative frequency graph is between 0.034/bin and 0.042/bin for the smaller and larger crossover intervals respectively, resulting in estimates of the not predicted fraction of between 0.016 and 0.008 per bin or, if we extend this estimate to all twenty bins we obtain 16–32% for all hotspots. Thus, application of both approaches results in similar estimates of 16–33% for the fraction of not predicted crossovers.
Which hotspots are best in predicting CEPH crossovers?
So far we have shown that the observed distribution of CEPH crossovers closely resembles the distribution expected from the population-averaged map. An independent question is which set of hotspots is best at predicting crossovers. We have four populations-specific sets of peak-defined hotspots, the population-averaged set of peak-defined hotspots and LDHot hotspots. To compare these six independent hotspot sets we again ranked hotspots based on their strength calculated from either one of the population-specific or the population-averaged maps. We then took the 10,000 strongest hotspots and compared the numbers of crossovers overlapping them (Figure 4). First of all, all the sets of hotspots have a very similar efficiency in predicting crossovers. These 10,000 strongest hotspots overlap between 46% and 50% of crossover intervals smaller than 50 Kb. When we use either population-specific or population-averaged recombination rate estimates for ranking, the 10,000 strongest hotspots according to the population-averaged map always predict more crossovers (Figure 4). This again proves that the population-averaged map is closer to the actual distribution of crossovers and provides the best estimate of hotspot strengths. Out of all sets, the LDHot-defined hotspots overlap the largest number of crossover intervals (50.2%). Thus, LDHot-defined hotspots are most efficient in identifying universally conserved, strongest hotspots. When we compare observations to expectations, hotspots predict crossovers better than expected from the population-averaged map (Figure S13). Along with our previous comparison of cumulative recombination frequency graphs this observation again suggests that the peak rate in hotspots is slightly underestimated.

Where are the not predicted crossovers?
We find that 26–32% of crossovers cannot be explained by either CEU hotspots or LDHot-defined hotspots, respectively. First we asked if there is one or several large genomic regions where the distribution of crossovers strongly deviates from the hotspot map. An examination of the genomic distribution of not predicted crossover on a large scale does not show a strong tendency towards accumulation in specific genomic region(s) (Figure S14). Thus, it is unlikely that all not predicted crossovers can be explained by such local deviations.
The finding that the population-averaged map is in closer agreement with the distribution of crossovers compared to the CEU map suggests that hotspots from other populations may be in fact active in the CEU sample but not detected in the CEU profile. Thus, we asked where such not predicted crossovers are located relative to hotspots detected in other populations. We find that, depending on the accuracy of mapping, between 50 and 61 percent of not predicted crossovers overlap at least one hotspot from another population (YRI, CHB or JPT) (results for CEPH crossovers are shown in Figure 5 and for Hutterite crossovers are shown in Figure S15). Importantly, this proportion is significantly higher than expected if crossovers would be distributed randomly (P<0.001 by simulation, see Figure 5 and Figure S15 for all crossovers; data are not shown for other subsets of crossovers) meaning that crossovers are preferentially located in regions where hotspots are found in other populations. Furthermore, as one might expect, the fraction of not predicted crossovers that overlap at least one hotspot from another population is similar to the expected proportion if crossovers would be distributed according to the population-averaged map (Figure 5, Figure S15).

A potential explanation for the preferential co-localization of crossovers not predicted by CEU hotspots with the hotspots from the other populations could be the increased power to detect hotspots in the larger combined population set. To check whether adding individuals from the same population sample increases our ability to predict crossovers as well as adding individuals from a different population we generated 100 subsets from the CEU and CHB samples and then calculated hotspots as for the full samples. We find that hotspots from subsets of the CHB sample overlap more not predicted crossovers compared to hotspots from matching subsets of the CEU sample (Figure S16). A lack of SNP diversity in population sample decreases the power of LD-based coalescent analysis to accurately estimate recombination rates. Thus, one interpretation of the more frequent association of not predicted crossovers with the hotspots found in other populations is a lack of SNP diversity in the CEU sample. To evaluate the effect of the SNP diversity on identification of weaker hotspots we compared average minor allele frequencies in the four population samples in predicted and not predicted crossover intervals smaller than 50 Kb. (Figure S17). The average minor allele frequency (MAF) for SNPs located inside not predicted crossover intervals is not lower than the MAF in predicted crossovers. Thus, other underlying differences are likely responsible for the preferential association of the not predicted crossovers with the hotspots found in other populations.
Discussion
In this work we analyze the distribution of meiotic crossovers mapped at high resolution and use this dataset to probe calculated maps. Our main conclusion is that the calculated recombination rate map is in good agreement with observations. Although we estimate that more than 30% of crossovers are not predicted by hotspots, a number in agreement with previous findings [52], this does not necessarily mean that the distribution of crossovers is different from the computed map. We calculate that if crossovers are distributed according to the population-averaged map we expect to find approximately as many not predicted crossovers, roughly one third, as we estimate from crossover mapping data. Moreover, the inclusion of hotspots from other populations allows us to account for the majority of not predicted crossovers.
Coop et al. [52] reported less that 50% usage of LDHot hotspots in roughly 30% of Hutterites. Taken by itself, this observation could suggest relatively poor agreement between LDHot hotspots and positions of crossovers in Hutterites. While Coop et al. have asked whether all crossovers overlap hotspots we addressed an arguably more relevant question whether the observed distribution of crossovers is consistent with the recombination rate map. LDHot hotspot usage utilized by Coop et al. to describe the similarity of recombination map to observations is an indirect estimate of true proportion of recombination events in hotspots. That analysis considered only the location of hotspots and did not take into account the non-uniformity of recombination rates. When we carefully account for recombination rate variation in the computed map, we don't observe a strong disagreement between the positions of genetic crossovers and computed hotspots. Both our analysis of the CEPH dataset and our independent re-analysis of the Hutterite data suggests that all crossovers taken together agree with the computed map. This does not mean that there are no individuals with substantial differences in hotspots use. We would argue, however, that individuals in which meiotic crossovers occur mostly outside of hotspots are relatively rare, at least in European populations. Moreover, we observe a great degree of similarity in the ability of population-specific hotspots to predict both CEPH and Hutterite crossovers suggesting that a much lower than average hotspot usage is rare in all populations.
Although 30% of crossovers are not predicted by hotspots, we believe that this fact is largely a reflection of the properties of the computed map itself and hotspot definition rather than a measure of the dis-similarity of the crossover distribution to the map. Neither peak-based nor LDHot hotspots account for more than 79% of the total genetic map length. So, most not predicted crossovers can be accounted for by this “outside of the hotspots” part of the map. Why is not all of the genetic map captured by hotspots? Does it mean that not all recombination events occur in hotspots? Although this question is difficult to address directly based on crossover mapping data, the preferential location of not predicted crossovers where hotspots are found in other populations suggests otherwise. Multiple sperm genotyping studies show very low levels of background, non-hotspot recombination [7], [12], [36]–[38]. It is likely that weaker and difficult to detect hotspots are responsible for most of the not predicted crossovers. Computational methods are not sufficiently sensitive to detect these weaker and/or polymorphic hotspots. Difference in population sample histories and random errors in the estimation of recombination rates may result in a more efficient detection of some weak hotspots in other populations. It is also possible that these undetected hotspots are stronger in other populations.
Our analysis shows that in addition to hotspot position, our computed estimates of hotspot strength are largely accurate. One consequence of that is that both very strong and very weak hotspots exist. For example, the 700 strongest hotspots (Bins 1 and 2, mean strength 0.41 cM and representing 10% of the total hotspot strengths) account for 9% of all CEPH crossovers (Figure 2). Even if we conservatively estimate that half of these 9% of all CEPH crossover intervals overlap these 700 hotspots by chance, we still find support for more than several hundred hotspots stronger than 0.2 cM. Thus, in agreement with observations by Jeffereys [40] and Coop et al. [52] we find that very strong hotspots do exist. A similar logic supports the existence of weak hotspots. Bin 20 which contains more than 10000 hotspots between 0.01 and 0.016 cM accounts for 4–6% of crossovers.
Then, how many hotspots of meiotic recombination exist in humans? This number clearly depends on how hotspots are defined. The application of the rather conservative LDHot method to the HapMap Phase II dataset results in the identification of nearly 33,000 hotspots [32],[63]. If we look simply for peaks in the recombination rate profile, we find around 50,000 peaks with an estimated strength above 0.01 cM or more than 150,000 peaks if we don't restrict hotspot strength. Our probing of the calculated map with present day crossovers gives some further insight into this question (Figure 6). There are several hundred, perhaps up to a thousand strong hotspots (calculated strength above 0.25 cM), but it is unlikely that they are responsible for more than 10% of all crossovers. Around 50% of crossovers (see Figure 2 and Figure 4) of crossovers is explained by roughly 10000 moderately strong hotspots between 0.1 and 0.25 cM. Then, there are tens of thousands of weak and/or polymorphic hotspots. Although individual hotspots are weak, more than 30% of all crossovers are explained by hotspots weaker than 0.1 cM. We also believe that the remaining 10% or so unaccounted for crossovers (see below) are largely due to cryptic hotspots. It is likely that the number of such cryptic hotspots is not smaller than the number of the detected “weak” hotspots, roughly 35,000. We estimate, therefore, that the total number of active hotspots, including polymorphic ones may reach up to 60,000–80,000 or more.

What are the implications of our study for the mechanism of hotspot variability within a population and between populations? We find that inclusion of hotspots from other populations allows us to account for 61% of crossovers (here we consider the set of all crossovers not restricted by the accuracy of mapping) that do not overlap CEU hotspots. In total, 95–97% of all of the observed crossovers can be accounted for by the hotspots from all four populations. Also, a comparison of different population-specific hotspots shows that all of them are highly efficient in predicting CEPH crossovers. Similarly, the better agreement between the distribution of CEPH crossovers and the population-averaged map rather than with the CEU map argues that there is a greater similarity between the recombination rate maps of different populations than what we are able to compute at this time. One way to reconcile these data is that hotspots arise at a limited number of potential sites. Consequently, different populations have hotspots mostly at the same locations although their strengths vary. The site selection for meiotic DSB formation is driven by a genomic susceptibility profile, defined either by nucleotide sequence or by chromatin structure, which determines propensity to form meiotic DSBs at a given location, a universal recombinome for humans. This susceptibility profile results in a set of potential hotspots which are sampled in different individuals and populations and is further regulated at a higher, perhaps domain-wide level. In yeast, for example, chromatin modifications have a profound effect on meiotic recombination [54],[55] and trans-activating regulators has been described in mammals [46],[49],[50],[53]. We also suggest that this intrinsic genomic susceptibility profile is largely intact between populations and individuals and most of the variation is seen at the level of the strength of the hotspots. This situation is very much akin to the variability in levels of gene expression in different individuals [64]–[66]. Variation in gene expression is caused both by genetic and epigenetic factors and is heritable to a large extent [65],[66]. As with the recombinome, all genes are present in all individuals but the level of transcripts is highly variable among individuals.
What are practical implications of our analysis? First of all, we find that the computed recombination rate map closely approximates present-day recombination profiles. Second, we find that it is important to include in the analysis samples from distantly related population samples. Both the closer similarity of the population-averaged profile to observations and the frequent detection of cryptic hotspots in other population-specific profiles clearly show that meiotic recombination in present-day individuals of European descent is better described by looking at more than one HapMap population. Presently and in the nearest future the experimental determination of individual recombination rate maps is still beyond our capabilities. We believe that the increased availability of high resolution data from diverse population samples, such as the ongoing Phase III of HapMap project, will allow highly accurate computational reconstruction and will provide further insights into hotspot variability and the regulation of meiotic recombination.
Methods
Recombination rate calculations
To calculate recombination rates we used LDHat version 2 [57] with minor modifications. We have used the complete Phase II data (phased genotypes from release 21a) from the HapMap project as a source of genotypes (www.hapmap.org and [32],[63]). Hotspots were defined as relatively narrow peaks (peak width <100 Kb) having strength above 0.01 cM. All coordinates are given relative to the NCBI35 version of the human genome assembly. Statistical calculations were performed in JMP version 7. This study utilized the high-performance computational capabilities of the Biowulf Linux cluster at the National Institutes of Health, Bethesda, MD (http://biowulf.nih.gov).
Crossover mapping
DNA samples from the CEPH/UTAH pedigrees 1334, 1340, 1341, 1350, 1362, 1408, 1420, 1447, 1454 and 1459 were obtained from the Coriell cell repository. Samples were genotyped using Affymetrix 500K genotyping array sets according to recommendations of the manufacturer. To map crossovers we developed a multi-step algorithm (see Text S1) based on mendelian inheritance.
Supporting Information
Zdroje
1. KeeneyS
NealeMJ
2006 Initiation of meiotic recombination by formation of DNA double-strand breaks: mechanism and regulation. Biochem Soc Trans 34 523 525
2. PetesTD
2001 Meiotic recombination hot spots and cold spots. Nat Rev Genet 2 360 369
3. KauppiL
JeffreysAJ
KeeneyS
2004 Where the crossovers are: recombination distributions in mammals. Nat Rev Genet 5 413 424
4. ArnheimN
CalabreseP
Tiemann-BoegeI
2007 Mammalian meiotic recombination hot spots. Annu Rev Genet 41 369 399
5. WangN
AkeyJM
ZhangK
ChakrabortyR
JinL
2002 Distribution of recombination crossovers and the origin of haplotype blocks: the interplay of population history, recombination, and mutation. Am J Hum Genet 71 1227 1234
6. HubertR
MacDonaldM
GusellaJ
ArnheimN
1994 High resolution localization of recombination hot spots using sperm typing. Nat Genet 7 420 424
7. JeffreysAJ
MurrayJ
NeumannR
1998 High-resolution mapping of crossovers in human sperm defines a minisatellite-associated recombination hotspot. Mol Cell 2 267 273
8. CullenM
PerfettoSP
KlitzW
NelsonG
CarringtonM
2002 High-resolution patterns of meiotic recombination across the human major histocompatibility complex. Am J Hum Genet 71 759 776
9. GreenawaltDM
CuiX
WuY
LinY
WangH-Y
2006 Strong correlation between meiotic crossovers and haplotype structure in a 2.5-Mb region on the long arm of chromosome 21. Genome Res 16 208 214
10. KauppiL
SajantilaA
JeffreysAJ
2003 Recombination hotspots rather than population history dominate linkage disequilibrium in the MHC class II region. Hum Mol Genet 12 33 40
11. Tiemann-BoegeI
CalabreseP
CochranDM
SokolR
ArnheimN
2006 High-resolution recombination patterns in a region of human chromosome 21 measured by sperm typing. PLoS Genet 2 e70 doi:10.1371/journal.pgen.0020070
12. JeffreysAJ
KauppiL
NeumannR
2001 Intensely punctate meiotic recombination in the class II region of the major histocompatibility complex. Nat Genet 29 217 222
13. BoultonA
MyersRS
RedfieldRJ
1997 The hotspot conversion paradox and the evolution of meiotic recombination. PNAS 94 8058 8063
14. CalabreseP
2007 A population genetics model with recombination hotspots that are heterogeneous across the population. Proc Natl Acad Sci U S A 104 4748 4752
15. CoopG
MyersSR
2007 Live Hot, Die Young: Transmission Distortion in Recombination Hotspots. PLoS Genet 3 e35 doi:10.1371/journal.pgen.0030035
16. Pineda-KrchM
RedfieldRJ
2005 Persistence and Loss of Meiotic Recombination Hotspots. Genetics 169 2319 2333
17. ArchettiM
2003 A selfish origin for recombination. J Theor Biol 223 335 346
18. PetersAD
2008 A combination of cis and trans control can solve the hotspot conversion paradox. Genetics 178 1579 1593
19. FribergU
RiceWR
2008 Cut thy neighbor: cyclic birth and death of recombination hotspots via genetic conflict. Genetics 179 2229 2238
20. CoopG
PrzeworskiM
2007 An evolutionary view of human recombination. Nat Rev Genet 8 23 34
21. KhilPP
Camerini-OteroRD
2009 Variation in patterns of human meiotic recombination. Genome Dyn 5 117 127
22. BuardJ
de MassyB
2007 Playing hide and seek with mammalian meiotic crossover hotspots. Trends Genet 23 301 309
23. LynnA
AshleyT
HassoldT
2004 Variation in human meiotic recombination. Annu Rev Genomics Hum Genet 5 317 349
24. PtakSE
HindsDA
KoehlerK
NickelB
PatilN
2005 Fine-scale recombination patterns differ between chimpanzees and humans. Nat Genet 37 429 434
25. PtakSE
RoederAD
StephensM
GiladY
PaaboS
2004 Absence of the TAP2 human recombination hotspot in chimpanzees. PLoS Biol 2 e155 doi:10.1371/journal.pbio.0020155
26. WincklerW
MyersSR
RichterDJ
OnofrioRC
McDonaldGJ
2005 Comparison of Fine-Scale Recombination Rates in Humans and Chimpanzees. Science 308 107 111
27. CheungVG
BurdickJT
HirschmannD
MorleyM
2007 Polymorphic variation in human meiotic recombination. Am J Hum Genet 80 526 530
28. JorgensonE
TangH
GaddeM
ProvinceM
LeppertM
2005 Ethnicity and human genetic linkage maps. Am J Hum Genet 76 276 290
29. CrawfordDC
BhangaleT
LiN
HellenthalG
RiederMJ
2004 Evidence for substantial fine-scale variation in recombination rates across the human genome. Nat Genet 36 700 706
30. ClarkAG
NielsenR
SignorovitchJ
MatiseTC
GlanowskiS
2003 Linkage disequilibrium and inference of ancestral recombination in 538 single-nucleotide polymorphism clusters across the human genome. Am J Hum Genet 73 285 300
31. EvansDM
CardonLR
2005 A comparison of linkage disequilibrium patterns and estimated population recombination rates across multiple populations. Am J Hum Genet 76 681 687
32. 2005 The International HapMap Consortium: A haplotype map of the human genome. Nature 437 1299 1320
33. FearnheadP
SmithNGC
2005 A Novel Method with Improved Power To Detect Recombination Hotspots from Polymorphism Data Reveals Multiple Hotspots in Human Genes. Am J Hum Genet 77 781 794
34. MyersS
BottoloL
FreemanC
McVeanG
DonnellyP
2005 A Fine-Scale Map of Recombination Rates and Hotspots Across the Human Genome. Science 310 321 324
35. ConradDF
JakobssonM
CoopG
WenX
WallJD
2006 A worldwide survey of haplotype variation and linkage disequilibrium in the human genome. Nat Genet 38 1251 1260
36. JeffreysAJ
NeumannR
2002 Reciprocal crossover asymmetry and meiotic drive in a human recombination hot spot. Nat Genet 31 267 271
37. JeffreysAJ
NeumannR
2005 Factors influencing recombination frequency and distribution in a human meiotic crossover hotspot. Hum Mol Genet 14 2277 2287
38. JeffreysAJ
NeumannR
PanayiM
MyersS
DonnellyP
2005 Human recombination hot spots hidden in regions of strong marker association. Nat Genet 37 601 606
39. NeumannR
JeffreysAJ
2006 Polymorphism in the activity of human crossover hotspots independent of local DNA sequence variation. Hum Mol Genet 15 1401 1411
40. WebbAJ
BergIL
JeffreysA
2008 Sperm cross-over activity in regions of the human genome showing extreme breakdown of marker association. Proc Natl Acad Sci U S A 105 10471 10476
41. JeffreysAJ
NeumannR
2009 The rise and fall of a human recombination hot spot. Nat Genet 41 625 629
42. KauppiL
StumpfMPH
JeffreysAJ
2005 Localized breakdown in linkage disequilibrium does not always predict sperm crossover hot spots in the human MHC class II region. Genomics 86 13 24
43. SerreD
NadonR
HudsonTJ
2005 Large-scale recombination rate patterns are conserved among human populations. Genome Res 15 1547 1552
44. Jensen-SeamanMI
FureyTS
PayseurBA
LuY
RoskinKM
2004 Comparative Recombination Rates in the Rat, Mouse, and Human Genomes. Genome Res 14 528 538
45. MyersS
FreemanC
AutonA
DonnellyP
McVeanG
2008 A common sequence motif associated with recombination hot spots and genome instability in humans. Nat Genet 40 1124 1129
46. BaudatF
de MassyB
2007 Cis - and Trans-Acting Elements Regulate the Mouse Psmb9 Meiotic Recombination Hotspot. PLoS Genet 3 e100 doi:10.1371/journal.pgen.0030100
47. BoisPR
2007 A highly polymorphic meiotic recombination mouse hot spot exhibits incomplete repair. Mol Cell Biol 27 7053 7062
48. YaukCL
BoisPR
JeffreysAJ
2003 High-resolution sperm typing of meiotic recombination in the mouse MHC Ebeta gene. Embo J 22 1389 1397
49. GreyC
BaudatF
de MassyB
2009 Genome-wide control of the distribution of meiotic recombination. PLoS Biol 7 e35 doi:10.1371/journal.pbio.1000035
50. ParvanovED
NgSH
PetkovPM
PaigenK
2009 Trans-regulation of mouse meiotic recombination hotspots by Rcr1. PLoS Biol 7 e36 doi:10.1371/journal.pbio.1000036
51. PaigenK
SzatkiewiczJP
SawyerK
LeahyN
ParvanovED
2008 The recombinational anatomy of a mouse chromosome. PLoS Genet 4 e1000119 doi:10.1371/journal.pgen.1000119
52. CoopG
WenX
OberC
PritchardJK
PrzeworskiM
2008 High-resolution mapping of crossovers reveals extensive variation in fine-scale recombination patterns among humans. Science 319 1395 1398
53. KongA
ThorleifssonG
StefanssonH
MassonG
HelgasonA
2008 Sequence variants in the RNF212 gene associate with genome-wide recombination rate. Science 319 1398 1401
54. MieczkowskiPA
DominskaM
BuckMJ
LiebJD
PetesTD
2007 Loss of a histone deacetylase dramatically alters the genomic distribution of Spo11p-catalyzed DNA breaks in Saccharomyces cerevisiae. Proc Natl Acad Sci U S A 104 3955 3960
55. BordeV
RobineN
LinW
BonfilsS
GeliV
2009 Histone H3 lysine 4 trimethylation marks meiotic recombination initiation sites. EMBO J 28 99 111
56. BuardJ
BarthesP
GreyC
de MassyB
2009 Distinct histone modifications define initiation and repair of meiotic recombination in the mouse. Embo J 28 2616 2624
57. McVeanGA
MyersSR
HuntS
DeloukasP
BentleyDR
2004 The fine-scale structure of recombination rate variation in the human genome. Science 304 581 584
58. SmithNG
FearnheadP
2005 A comparison of three estimators of the population-scaled recombination rate: accuracy and robustness. Genetics 171 2051 2062
59. AutonA
McVeanG
2007 Recombination rate estimation in the presence of hotspots. Genome Res 17 1219 1227
60. StumpfMP
McVeanGA
2003 Estimating recombination rates from population-genetic data. Nat Rev Genet 4 959 968
61. ReedFA
TishkoffSA
2006 Positive selection can create false hotspots of recombination. Genetics 172 2011 2014
62. McVeanG
2007 The structure of linkage disequilibrium around a selective sweep. Genetics 175 1395 1406
63. FrazerKA
BallingerDG
CoxDR
HindsDA
StuveLL
2007 A second generation human haplotype map of over 3.1 million SNPs. Nature 449 851 861
64. StoreyJD
MadeoyJ
StroutJL
WurfelM
RonaldJ
2007 Gene-expression variation within and among human populations. Am J Hum Genet 80 502 509
65. StrangerBE
NicaAC
ForrestMS
DimasA
BirdCP
2007 Population genomics of human gene expression. Nat Genet 39 1217 1224
66. PriceAL
PattersonN
HancksDC
MyersS
ReichD
2008 Effects of cis and trans genetic ancestry on gene expression in African Americans. PLoS Genet 4 e1000294 doi:10.1371/journal.pgen.1000294
Štítky
Genetika Reprodukční medicínaČlánek vyšel v časopise
PLOS Genetics
2010 Číslo 1
- Kazuistika – Perspektivy využití precizované medicíny v rámci personalizované specifické terapie onkologických pacientů
- Nobelova cena za chemii pro genetické nůžky: Objev, který změní naši budoucnost?
- Technologie na bázi RNA v klinické praxi: od přebarvených petúnií k terapii vzácných a dosud jen obtížně léčitelných chorob u lidí
- „Nepředstavovali jsme si, že náš výzkum povede přímo ke vzniku nových léků, dokonce ještě za našeho života“
- Bezplatné služby pro diagnostiku ATTRv amyloidózy pro kardiology
Nejčtenější v tomto čísle
- A Major Role of the RecFOR Pathway in DNA Double-Strand-Break Repair through ESDSA in
- Kidney Development in the Absence of and Requires
- The Werner Syndrome Protein Functions Upstream of ATR and ATM in Response to DNA Replication Inhibition and Double-Strand DNA Breaks
- Alternative Epigenetic Chromatin States of Polycomb Target Genes
Zvyšte si kvalifikaci online z pohodlí domova
Mazová zátka a její řešení
nový kurzVšechny kurzy