
A Comprehensive Map of Insulator Elements for the Genome
Insulators are DNA sequences that control the interactions among genomic regulatory elements and act as chromatin boundaries. A thorough understanding of their location and function is necessary to address the complexities of metazoan gene regulation. We studied by ChIP–chip the genome-wide binding sites of 6 insulator-associated proteins—dCTCF, CP190, BEAF-32, Su(Hw), Mod(mdg4), and GAF—to obtain the first comprehensive map of insulator elements in Drosophila embryos. We identify over 14,000 putative insulators, including all classically defined insulators. We find two major classes of insulators defined by dCTCF/CP190/BEAF-32 and Su(Hw), respectively. Distributional analyses of insulators revealed that particular sub-classes of insulator elements are excluded between cis-regulatory elements and their target promoters; divide differentially expressed, alternative, and divergent promoters; act as chromatin boundaries; are associated with chromosomal breakpoints among species; and are embedded within active chromatin domains. Together, these results provide a map demarcating the boundaries of gene regulatory units and a framework for understanding insulator function during the development and evolution of Drosophila.
Published in the journal:
. PLoS Genet 6(1): e32767. doi:10.1371/journal.pgen.1000814
Category:
Research Article
doi:
https://doi.org/10.1371/journal.pgen.1000814
Summary
Insulators are DNA sequences that control the interactions among genomic regulatory elements and act as chromatin boundaries. A thorough understanding of their location and function is necessary to address the complexities of metazoan gene regulation. We studied by ChIP–chip the genome-wide binding sites of 6 insulator-associated proteins—dCTCF, CP190, BEAF-32, Su(Hw), Mod(mdg4), and GAF—to obtain the first comprehensive map of insulator elements in Drosophila embryos. We identify over 14,000 putative insulators, including all classically defined insulators. We find two major classes of insulators defined by dCTCF/CP190/BEAF-32 and Su(Hw), respectively. Distributional analyses of insulators revealed that particular sub-classes of insulator elements are excluded between cis-regulatory elements and their target promoters; divide differentially expressed, alternative, and divergent promoters; act as chromatin boundaries; are associated with chromosomal breakpoints among species; and are embedded within active chromatin domains. Together, these results provide a map demarcating the boundaries of gene regulatory units and a framework for understanding insulator function during the development and evolution of Drosophila.
Introduction
The spatiotemporal regulation of transcription is controlled by the binding of transcription factors to their target cis-regulatory modules (CRM) and their resulting interactions with promoters. Such regulatory interactions between CRMs and promoters can occur over short distances when regulatory sequences are immediately proximal to their target promoter or, in many cases, over longer distances involving many thousands of base pairs. Because of the variability in the distances over which CRMs can act, delineating the molecular boundaries of genes can be challenging. Mechanisms by which a CRM targets the appropriate promoter among a collection of adjacent promoters are poorly defined. However, one such mechanism involves the partitioning of the genome into regulatory domains by genome features known as insulators, or boundary DNA elements.
Since their initial characterization twenty years ago [1]–[4], insulator elements have been thought to create distinct regulatory domains, and thus allow enhancers to find their proper target promoter [5]. Insulators have been identified in Drosophila as well as in vertebrate genomes [6] based on their ability to disrupt the communication between an enhancer and a promoter when inserted between them. This enhancer-blocking activity is dependent upon the binding of insulators by several proteins. The CCCTC-binding Factor (CTCF) was first identified in vertebrates [7]; its Drosophila homolog, dCTCF, is known to bind several insulators and is necessary for their function [8]–[11]. CTCF is currently the only vertebrate protein known to be associated with insulator elements. In Drosophila however, several other proteins have been identified for their insulator function. Su(Hw) is associated with the gypsy retrotransposon insulator and other endogenous binding sites [4], [12]–[14]. The insulator activity of gypsy is dependent on the recruitment by Su(Hw) of two other proteins: Modifier of mdg4 [Mod(mdg4)] [15],[16] and CP190 [17]. Three additional proteins have been linked to insulator function in Drosophila. The binding of Zw5 and BEAF-32 on the scs/scs' elements of the hsp70 locus is required for their enhancer-blocking activity [18],[19]. Similarly, the ubiquitous transcription factor GAF (GAGA Associated Factor) is necessary for the enhancer-blocking activity of particular insulators [20]–[22]. Apart from their enhancer-blocking activity, insulators act as chromatin boundary elements. Such boundaries block the spreading of epigenetic marks or chromatin proteins such as repressive heterochromatin proteins or Polycomb Group-dependent (PcG) silencing [23]–[27].
While genetic and molecular studies of insulator function suggest that insulators play a major role in the regulatory organization of the genome, functional data have been collected on only a dozen insulator sequences in Drosophila and mammals. The identification of new insulators in flies and mammals by genome-wide approaches has only recently been initiated in different biological sources [10], [14], [27]–[30]. Here we provide a uniformly collected dataset and comprehensive analysis from developing embryos for six different insulator proteins.
Results
Genome-wide mapping of insulator-associated proteins
We mapped the genome-wide binding sites of 6 insulator-associated proteins: CTCF, CP190, BEAF-32, Su(Hw), Mod(mdg4) and GAF by Chromatin ImmunoPrecipitation coupled with microarrays (ChIP-chip) in Drosophila embryos (0–12 h of development). For CTCF and Su(Hw), 2 different antibodies for each factor were used as controls to demonstrate the reproducibility of our experiments. At a 1% False Discovery Rate (FDR), we identified between 2,500 and 6,600 binding sites for each factor (Figure 1 and Table S1), which included all functionally verified Drosophila melanogaster insulator sequences (Figure 1, Table S2, and Figure S1). The reproducibility of different ChIP-chip experiments for 2 different antibodies for CTCF and Su(Hw) is very high, with 94% of CTCF and 87% of Su(Hw) binding sites overlapping (Figure S2 and Figure S3). Moreover, we were able to recapitulate the profiles for CTCF and Su(Hw) generated in Drosophila embryos for the homeotic complexes and 3 Mb of the Adh region [10],[14] with an overlap of 94% (31/33) for CTCF and 70% (27/41) for Su(Hw) between the published dataset and our mapping in the same genomic region.

To characterize the sequence specificity of each insulator-associated protein, we identified significantly enriched sequence motifs for each set of target sites (Figure S4). The most enriched motif identified for CTCF strongly resembles the CTCF motif identified in vertebrates [31] and Drosophila [10]. Likewise, the motif for Su(Hw) that was discovered in this study is similar to a motif previously identified in Drosophila from a limited number of Su(Hw) sites [14],[32],[33]. The discovered motifs are present in 75.6% of CTCF, 86.8% of BEAF-32, 84% of Su(Hw) and 88.6% of GAF binding sites (Table S3). Additionally, the motifs identified for one insulator-factor were often also enriched at the binding sites of other insulator-factors (Figure 2A). This cross-enrichment was not observed however, when only binding sites associated with a single factor were considered (Figure 2B), suggesting that each factor retains unique DNA-level binding specificity but associates with other insulator proteins via clustered binding sites and/or protein-protein interactions.

Cell-type specificity of CTCF binding
Previous analyses have suggested that, in human cells, insulator binding sites are remarkably conserved across cell types [27],[31],[34]. Given the large overlap between binding sites here identified in whole embryos and data previously produced in Drosophila S2 cells for CTCF and CP190 [30], we investigated this trend further. We performed ChIP-chip experiments for CTCF in S2 and Kc cells. Approximately 74–81% of CTCF binding sites identified independently in each cell type overlap (specifically, have a midpoint to midpoint distance less than 250 bases)(Figure S5 and Figure S6A). This observation is consistent with a recently published analysis of CTCF binding sites in S2 and Mbn2 cells [35], in which, by the same criteria, 77–86% of binding sites overlap.
However, given the technical differences in protocols for embryos and suspension cell culture and the loss of information inherent in a comparison of independently thresholded binding site calls, we regard this as a conservative estimate. Qualitative observation of binding profiles suggests that many putatively differential binding sites may result from the threshold applied and normalization issues (Figure S5 and Figure S6B). Indeed, we note that the IP signals at non-overlapping binding sites are, on average, four-fold greater than input background, while overlapping binding sites are six-fold greater. In an attempt to avoid such biases, we used a linear mixed model framework to build a binding site detection model that jointly analyzes the data from multiple cell types (see Text S1). This model identifies 2,784 CTCF binding sites, only 166 of which show significant cell type specificity (Figure S7). In summary, while most insulator sites identified in this study appear to be conserved across cell types, a small fraction appear to function in a regulated fashion.
Binding-site clustering identifies two major categories of insulator sequences
While the six insulator associated proteins mapped in this study often bind independently, we find clusters of overlapping binding sites far more often than would be expected by chance, indicating insulator-associated proteins often bind jointly to the same sequence. Indeed, 45% of the 14,145 binding sites identified in this study are occupied by more than one insulator associated protein. For example, 77% of CTCF binding sites cluster with at least another factor (Figure 2 and Table S1). Analysis of binding site cluster types revealed several notable trends (Figure 2C and Figure S3). CP190 is frequently (5690 out of 6651 total sites) found to bind with additional factors, BEAF-32 being its most common partner (3329/6651). BEAF-32, CTCF, and CP190 cluster together (1378/8872), as do Mod(mdg4) and Su(Hw) (1101/5381), while GAF displays a significant lack of clustering with other insulator proteins (2973 single sites out of 3905 total sites). This binding site clustering and the functional data presented below suggest a previously underappreciated compositional complexity of insulator sequences but also clearly identifies two major classes of insulators: Class I principally representing binding sites for BEAF-32/CP190/CTCF and Class II representing Su(Hw)-associated binding sites.
Positional classification of insulators
The distribution of insulator binding sites relative to different classes of functional genomic elements further supports the existence of several distinct functional classes of insulators. BEAF-32, CP190, CTCF, GAF, and Mod(mdg4) are clearly enriched at promoters (Figure 3A, Figure S8, and Table S4), while Su(Hw) is depleted. BEAF-32, CP190, CTCF and Mod(mdg4) binding sites are also strongly enriched within 5′UTRs as well as in intergenic regions (Figure S8) and at transcription end sites (Figure 3B). In contrast, they are largely excluded from transposable elements and coding exons (Figure S8 and Figure S9), suggesting a role of Class I insulator proteins, but not Class II, in regulating the transcription of genes.
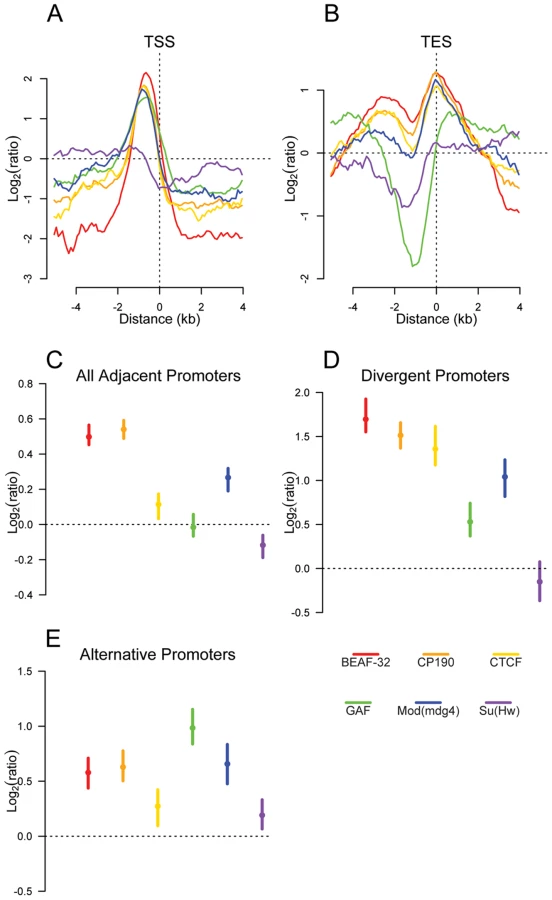
We reasoned that if insulators act as gene boundaries, they should partition genes into distinct regulatory environments. Indeed, we find that four of the six insulator-associated proteins binding sites are significantly enriched between adjacent consecutive promoters (Figure 3C) with a stronger enrichment of BEAF-32, CP190, CTCF and Mod(mdg4) between adjacent divergently oriented promoters (Figure 3D). Additionally, as suggested previously in vertebrates for CTCF [31], Class I and Class II insulator proteins are significantly enriched between alternative promoters, providing a potential mechanism for their independent regulation (Figure 3E).
Insulators demarcate differentially expressed genes
The distribution of insulators relative to a variety of genomic functional element classes suggests a pervasive role in controlling gene regulatory environments. To further address this hypothesis we mapped active promoters in embryos of the same developmental stage that we used for insulator mapping. To identify active promoters, we performed ChIP-chip with antibodies directed against the trimethylated lysine 4 of Histone H3 (H3K4me3), which is a clear mark of activation [36]–[39], and against the largest subunit of the RNA Polymerase II (PolII). We combined these two mappings with hybridization on tiling arrays of total RNA extracted from the same material. In Drosophila embryos, H3K4me3 is associated with gene Transcription Start Sites (TSS) and colocalizes with PolII immediately downstream of the TSS of active genes (Figure S10A and S10B). We extracted from this dataset a set of high confidence actively transcribed promoters, which overlap with H3K4me3 and PolII signals and whose exons overlap significant RNA signal (Figure S10C). We hypothesized that if insulators do indeed demarcate regulatory units, insulators would separate promoters with differing expression status. We repeated the positional analysis of insulator proteins between divergent, adjacent, and alternative promoters while taking into account the transcriptional status of the promoters (Figure 4A–4C). We observed that the enrichment of BEAF-32, CP190, CTCF, GAF, and Mod(mdg4) is greater between promoter pairs when they are differentially expressed (Figure 4, Figure S11, and Figure S12).

It is possible however that this result comes from an averaging of promoter activity across all the cell types present in the embryo at this developmental stage. We then repeated H3K4me3 ChIP-chip as a marker of active promoters in 2 embryonic Drosophila cell types: S2 and Kc cells. The overlap of H3K4me3 between embryos and Kc and S2 cell lines is between 71 and 75% respectively, while it is 85% between S2 and Kc cells (Figure S13A). Using H3K4me3 binding sites as a guide, we identified active promoters in each cell type. As in whole embryos, genes flanking CTCF binding sites identified in S2 and Kc cells show a significant enrichment of differentially expressed divergent and alternative promoters (Figure S13B and S13C) further demonstrating that Class I insulators delimit the boundaries of gene regulatory units.
Insulators partition CRMs and promoters
Consistent with the limited previous functional data demonstrating the enhancer-blocking activity of insulators, we find binding sites for BEAF-32, CP190, and Su(Hw) are significantly depleted between annotated CRMs and their target promoters across the entire genome (Figure 4D, Figure S14), while CP190, CTCF, GAF, and Mod(mdg4) are enriched between cis-regulatory elements and their nearest non-target promoter, distributions that strongly support their proposed enhancer blocking function. Interestingly, we note that binding sites for GAF are significantly enriched between CRMs and their target promoters. Similarly, we find that BEAF-32, CP190, and Su(Hw) binding sites are depleted between distinct CRMs of the same gene, while GAF is found more frequently than expected (Figure S14).
We note that the enrichment of insulators within such genomic features may, in part, be driven by the effects of differential promoter density or biases in chromatin accessibility. In order to understand how such factors could affect any interpretation of our data, we reanalyzed binding site data for 36 recently published datasets corresponding to 21 transcription factors, from the Berkeley Drosophila Transcription Network Project (BDTNP) [40]. We first observed that none of our insulator binding sites preferentially localize with this transcription factor set (Figure S15). Despite several transcription factors that preferentially bind promoter-proximal sequences (Figure S16), the enrichment of insulators between promoter pairs is greater than for any of the published transcription factors (Figure S17A, S17B, S17C). In contrast to these findings, and as expected, the published BDTNP transcription factors are not as strongly biased towards CRM, non-target promoter separation (Figure S17D).
Insulators mark the boundary of chromatin domains
Previous studies have demonstrated that insulators delimit distinct organizational domains of a genome [27],[30]. One such chromatin domain is marked by the trimethylated Lysine 27 of Histone H3 (H3K27me3), a histone modification deposited and recognized by the repressive Polycomb protein complexes [41]. We mapped by ChIP-chip the H3K27me3 mark in Drosophila embryos. We observed in whole embryos, as described previously [42],[43], that H3K27me3 is distributed throughout the genome in large domains (Figure S18). To better define the boundaries of these large genomic regions, we used a hidden Markov model based segmentation algorithm. We confirm that the genes affected by this silencing mark correspond to the previously described Polycomb target genes [42]–[45]. We identified 140 regions of substantial H3K27me3 density and quantified the distribution of each insulator binding site type with respect to the domain boundaries. Interestingly we find that all 6 factors are significantly depleted within and enriched outside these regions (Figure 5A). In addition, CTCF, GAF, and Mod(mdg4) are enriched at the boundaries of regions of high H3K27me3 density, with this enrichment significantly decreasing at increasing distances, further supporting the insulators' role in chromatin domain boundary determination (Figure 5A and Figure S18). It is possible that this result is confounded by the fact that insulators are enriched at TSSs. We performed Pearson's chi-squared contingency table tests to assess if the frequency of insulator-H3K27me3 boundary overlaps are independent of (and greater than) the frequency of TSS - H3K27me3 boundary overlaps. Indeed, CP190 (p<9.8e-6), BEAF-32 (p<1.8e-5), CTCF (p<0.00013), GAF (p<0.0022), Mod(mdg4) (p<0.00035), and Su(Hw) (p<0.0088) are independently associated with H3K27me3 breakpoints.

Insulator binding site sequence constraint and conservation of synteny
Given their apparently pervasive role in the establishment of gene regulatory units, we examined the role insulator sequences have played in shaping the evolution of the Drosophila genome. First, insulators show evidence of local sequence constraint. Based on either 15-way insect multiple sequence alignments or pair-wise alignments between the closely related Drosophila melanogaster and Drosophila simulans, insulator binding sites evolve significantly slower than fast evolving introns, although more swiftly than either coding exons or most transcription factor binding sites [46] (Figure S19). Second, we find that BEAF-32, CP190, CTCF, and Mod(mdg4) are significantly enriched near the 12 Drosophila species syntenic breakpoints (Figure 5B) [47]. Chi-squared tests demonstrate that for CP190 (p<0.0031), BEAF-32 (p<0.0086), GAF (p<0.027), and Mod(mdg4) (p<0.034), this result is independent of the association of TSSs and syntenic breaks. This finding provides evidence to support the hypothesis [48] that selective pressure has maintained gene regulatory units established by flanking insulators.
Insulators are sites of dynamic chromatin
We find that binding sites for 5 of the 6 insulator-associated proteins (Su(Hw)is the exception) are regions of reduced nucleosome density relative to surrounding regions (Figure 6A). Reduced nucleosome density often corresponds to sites of high histone replacement or displacement [49],[50] and classical “active” chromatin as defined by salt solubility properties [51]. We also find that the same 5 of the 6 insulator proteins are preferentially bound in regions characterized by low-salt soluble nucleosomes (Figure 6B and 6C), depleted in the remaining high-salt-soluble fraction (Figure 6D) and highly enriched in the salt-washed insoluble pellet (Figure 6E). Similar analyses of only non-promoter proximal insulators reveal the same trends, indicating that the shared solubility properties of insulators and promoters are indeed independent (Figure S20). Given the correspondence between these results and the regulatory boundary analyses presented above, we hypothesize that this difference in chromatin properties may explain why Su(Hw), defining ClassII insulators, does not act as a gene boundary in the genome.

Discussion
Insulator identification has been the source of much recent interest. Indeed, in the last 6 months CTCF was mapped in S2 cells [52]; BEAF-32 in embryos (6–16 h of development) [53], CTCF and CP190 in S2 cells [54] and more recently CTCF, Su(Hw), CP190 and BEAF-32 in Kc cells and Mbn2 cells [35]. Interestingly, the latter paper describes three subclasses of insulators, with CP190/BEAF association being distinct from CP190/CTCF and CP190/Su(Hw).
We present in this study the embryonic binding profile of six factors previously known to be associated with insulator function in Drosophila. Our analysis of insulator binding site distributions and protein composition suggest there exist 2 principal categories of insulator elements (Class I and Class II). In particular, we have shown that Class I insulators, identified by the binding of CTCF, CP190 or BEAF-32, segregate differentially expressed genes and delimit the boundaries of chromatin silencing, while they are depleted between known CRMs and their target genes. We do not find evidence supporting a significant distinction between CP190/BEAF and CP190/CTCF or CTCF/BEAF. In contrast, our analyses suggest that BEAF-32, CP190, and CTCF are distributed and function quite similarly, while Su(Hw) appears distinct. The Class II insulators, bound by Su(Hw), are often exceptional in our analyses. We note that the analysis of genome-wide mapping data, expression data, and genome annotation provides an endogenous boundary assay that demonstrates that, while Su(Hw) has been described as an insulator before, it is not systematically associated with the boundaries of the gene units.
By helping to delimit the regulatory boundaries of genes, the Class I insulator map presented here will aid in the identification of transcription factor target genes and the construction of transcriptional regulatory networks. As an example of this concept, we illustrate the distribution of known regulatory elements and insulators across the Antennapedia Complex (ANT-C) of homeotic genes (Figure 7). This region quite strikingly demonstrates the potential utility of insulator binding data for cis-regulatory annotation. Across approximately 500 kb, cis-regulatory elements and their target promoters are found between insulator pairs. For example, a single insulator separates the lab and Edg84A genes, with their respective cis-regulatory elements narrowly partitioned on either side. The adjacent regulatory elements and promoters of zen and bcd are similarly insulator segregated.

The presence of an insulator 3′ of ftz was previously hypothesized [55] to explain the ability of distal Scr regulatory elements to bypass ftz by pairing with the proximal SF1 insulator, located between Scr and ftz. Lastly, at Antp, as we observe genome wide, two alternative promoters and their proximal regulatory elements are segregated by a single insulator. We are currently developing analysis methods to systematically partition the entire genome into such regulatory domains.
Consistent with their observed regulatory boundary functions, Class I insulators are embedded within local regions of active chromatin and are frequently associated with syntenic breakpoints between species. Previous work has demonstrated that active promoters in yeast and Drosophila are associated with reduced nucleosome occupancy and low-salt soluble and high-salt insoluble chromatin [50],[56] (Figure S20). Therefore, surprisingly, dynamic chromatin is a shared feature between promoters and most classes of insulators. It is notable however that some studies have revealed functional similarities between insulators and promoters in transgenic assays [57]. These results have been described as paradoxical, as insulators can negatively affect promoters by blocking communication between enhancers and promoters. One proposed model for insulator function is that they act as promoter “decoys” by recruiting away factors necessary for transcriptional initiation [57]. Alternatively, insulators and promoters might require common chromatin features to function by mechanisms that are still unknown. One potential interpretation is that the dynamic chromatin at insulators forms a flexible chromatin joint that would affect the probability of productive contact between separated regulatory elements. In this way, the similarity between promoters and insulators would be a consequence of their common requirement for dynamic chromatin, although with very different consequences. This model may explain why promoters are so frequently scored as insulators in the classical insulator assay, when an element is placed between an enhancer and a promoter [1],[58].
Materials and Methods
ChIP–chip
Chromatin immunoprecipitations have been performed as described previously [59]. Briefly, the biological material is homogenized in the presence of 1.8% formaldehyde. The cross-linked chromatin is sonicated using a Bioruptor (Diagenode) to an average size of 500 bp. Pre-cleared chromatin extract is incubated overnight at 4C with the specific antibody and immunoprecipitated with protein-A Sepharose beads. After purification of the DNA and amplification of the libraries by linker-mediated PCR, the samples are labeled according to Affymetrix protocols and hybridized in parallel with an input sample onto the Affymetrix Drosophila Tiling Array, v2.0 R.
Antibodies
CTCF-C and CTCF-N antibodies are described in [8], CP190 antibody is described in [60], BEAF-32 antibody is described in [18], Mod(mdg4) antibody is directed against the 67.2 isoform and is described in [61], Su(Hw)-1 antibody is described in [62], Su(Hw)-2 is described in [63], GAF antibody is described in [64], H3K27me3 antibody is from Upstate (07-449 lot DAM1387952), H3K4me3 antibodies is from Abcam (ab8580 lot 411277) and PolII antibody is from Covance (8wG16 lot 14861301).
Analysis of arrays
Insulator binding data was processed with Model based Analysis Tiling-arrays (MAT) software [65]. We ran paired MAT analysis with MaxGap of 500, MinProbe of 10, and a Bandwidth of 250. H3K4me3, PolII and RNA data were analyzed with TAS (Tiling Array Software) and a threshold of 5% of the highest pValues was applied to identify the high intensity signals. The same parameters as for the MAT analysis have been applied to then call the peaks with TAS.
We developed a new HMM-based segmentation algorithm to identify H3K27me3 domains, as well as a novel mixed model framework for the joint analysis of ChIP-chip data from more complicated experimental designs, here applied to CTCF binding data from multiple cell types (see details in Text S1).
Motif discovery
Motif discovery was performed separately for each insulator. Peak centers that were at least 1 kb away from the peak center of any other insulator were taken (“uniquely bound peaks”) and +/ − 100 bp windows were generated excluding coding exons, repeats, transposons, 3′ untranslated regions and non-coding RNAs (“excluded regions”). For each insulator up to 500 of the regions were randomly selected and enriched motifs were identified using MEME [66], AlignACE [67], and MDscan [68]. All programs were run with default parameters except for MEME, which was restricted to a maximum of 3 iterations and a maximum motif width of 25. Instances of each of the motifs at conservation levels from 0.0 to 1.0 confidence (in steps of 0.1) were identified in all Intergenic regions (defined as genomic regions excluding those noted above) using the motif instance pipeline described in [69] with a PWM threshold corresponding to a p-value of 4−8 as determined by TFM-Pvalue [70]. The motifs were ranked using the fraction of instances found in the uniquely bound regions divided by the fraction for instances of shuffled control motifs at the same conservation cutoff (Wilson's confidence interval at Z = 1.5 was used on the ratios to give a conservative enrichment). This procedure is designed to reduce biases due to composition or conservation level. The motif with the highest enrichment at any confidence level was selected. This procedure was repeated using the MAT peak regions (rather than +/ − 100 bp) to produce the comparison in Figure S4 (otherwise the +/ − 100 bp motifs are used throughout).
Genomic distribution analyses
Genomic distribution analyses only used insulators mapped to chromosomes 2L, 2R, 3L, 3R, 4, and X. All gene annotations, including transcription start site locations and alternative promoter presence were defined according to RefSeq annotations. Transposable element locations were based on Flybase annotations. Divergently transcribed genes were identified as all adjacent transcription start sites, on opposite strands, between 500 and 2500 bases apart. Alternative promoters were identified as all RefSeq annotated genes with more than one distinct transcription start site. The ‘all adjacent’ gene set included all adjacent gene pairs whose transcription start sites were between 1500 and 20000 bases apart, regardless of strand. Cis-regulatory elements and their target genes were defined according to the RedFly database [71]. Breakpoints of regions of conserved synteny across the 12 sequenced Drosophilids were identified in [47].
All genomic distributional analyses were first conducted by mapping protein binding sites relative to the genomic feature of interest. This mapping was performed in one of two ways; First, for genomic features that can be faithfully represented as a single base (e.g., a transcription start site), the distance from each insulator to its nearest feature was tabulated, second, for paired genomic features (e.g., divergent promoters), the number of intervening insulators for each feature pair was tabulated. To quantify if the distribution of mapped insulators relative to the genomic feature of interest is significantly different than would be expected by chance (given the number of insulators and the distribution of the particular feature of interest), we performed simulations as follows. First, permuted insulator binding sites were generated by sampling n sites from a random, uniform distribution, the length of each chromosome, where n is the number of observed insulator binding sites, by chromosome. In other words, a simulated insulator is equally likely to be placed at any location across a chromosome. Second, the simulated binding sites were mapped relative to the genomic feature of interest, as with each real dataset. This procedure was repeated 10,000 times for each insulator, target element combination. The median simulated values were used to normalize the real data counts to produce enrichment estimates. The 2.5 and 97.5 percentiles of the simulated distributions were used to produce confidence intervals for display purposes and significance estimates. Empirical p-values were calculated as the fraction of simulations that produced a number of mapped features as extreme as observed in the real data.
Nucleosome enrichment and salt fractionation
The position of binding sites have been compared to data of nucleosome density and salt fractionation of the chromatin extraction as described in [51]. Binding sites are defined by their midpoint and nucleosome density and salt fractionation data from S2 cells are plotted as a log ratio of enrichment in a 3 kb interval around the midpoint of the binding site.
GEO accession number of described datasets
GSE16245
Supporting Information
Zdroje
1. KellumR
SchedlP
1991 A position-effect assay for boundaries of higher order chromosomal domains. Cell 64 941 950
2. KellumR
SchedlP
1992 A group of scs elements function as domain boundaries in an enhancer-blocking assay. Mol Cell Biol 12 2424 2431
3. HoldridgeC
DorsettD
1991 Repression of hsp70 heat shock gene transcription by the suppressor of hairy-wing protein of Drosophila melanogaster. Mol Cell Biol 11 1894 1900
4. GeyerPK
CorcesVG
1992 DNA position-specific repression of transcription by a Drosophila zinc finger protein. Genes Dev 6 1865 1873
5. WallaceJA
FelsenfeldG
2007 We gather together: insulators and genome organization. Curr Opin Genet Dev 17 400 407
6. ChungJH
WhiteleyM
FelsenfeldG
1993 A 5′ element of the chicken beta-globin domain serves as an insulator in human erythroid cells and protects against position effect in Drosophila. Cell 74 505 514
7. BellAC
WestAG
FelsenfeldG
1999 The protein CTCF is required for the enhancer blocking activity of vertebrate insulators. Cell 98 387 396
8. MoonH
FilippovaG
LoukinovD
PugachevaE
ChenQ
2005 CTCF is conserved from Drosophila to humans and confers enhancer blocking of the Fab-8 insulator. EMBO Rep 6 165 170
9. CiavattaD
RogersS
MagnusonT
2007 Drosophila CTCF is required for Fab-8 enhancer blocking activity in S2 cells. J Mol Biol 373 233 239
10. HolohanEE
KwongC
AdryanB
BartkuhnM
HeroldM
2007 CTCF genomic binding sites in Drosophila and the organisation of the bithorax complex. PLoS Genet 3 e112 doi:10.1371/journal.pgen.0030112
11. MohanM
BartkuhnM
HeroldM
PhilippenA
HeinlN
2007 The Drosophila insulator proteins CTCF and CP190 link enhancer blocking to body patterning. EMBO J 26 4203 4214
12. GolovninA
BiryukovaI
RomanovaO
SilichevaM
ParshikovA
2003 An endogenous Su(Hw) insulator separates the yellow gene from the Achaete-scute gene complex in Drosophila. Development 130 3249 3258
13. ParnellTJ
VieringMM
SkjesolA
HelouC
KuhnEJ
2003 An endogenous suppressor of hairy-wing insulator separates regulatory domains in Drosophila. Proc Natl Acad Sci U S A 100 13436 13441
14. AdryanB
WoerfelG
Birch-MachinI
GaoS
QuickM
2007 Genomic mapping of Suppressor of Hairy-wing binding sites in Drosophila. Genome Biol 8 R167
15. GauseM
MorcilloP
DorsettD
2001 Insulation of enhancer-promoter communication by a gypsy transposon insert in the Drosophila cut gene: cooperation between suppressor of hairy-wing and modifier of mdg4 proteins. Mol Cell Biol 21 4807 4817
16. GhoshD
GerasimovaTI
CorcesVG
2001 Interactions between the Su(Hw) and Mod(mdg4) proteins required for gypsy insulator function. EMBO J 20 2518 2527
17. PaiCY
LeiEP
GhoshD
CorcesVG
2004 The centrosomal protein CP190 is a component of the gypsy chromatin insulator. Mol Cell 16 737 748
18. ZhaoK
HartCM
LaemmliUK
1995 Visualization of chromosomal domains with boundary element-associated factor BEAF-32. Cell 81 879 889
19. GasznerM
VazquezJ
SchedlP
1999 The Zw5 protein, a component of the scs chromatin domain boundary, is able to block enhancer-promoter interaction. Genes Dev 13 2098 2107
20. OhtsukiS
LevineM
1998 GAGA mediates the enhancer blocking activity of the eve promoter in the Drosophila embryo. Genes Dev 12 3325 3330
21. BelozerovVE
MajumderP
ShenP
CaiHN
2003 A novel boundary element may facilitate independent gene regulation in the Antennapedia complex of Drosophila. EMBO J 22 3113 3121
22. SchweinsbergS
HagstromK
GohlD
SchedlP
KumarRP
2004 The enhancer-blocking activity of the Fab-7 boundary from the Drosophila bithorax complex requires GAGA-factor-binding sites. Genetics 168 1371 1384
23. RosemanRR
PirrottaV
GeyerPK
1993 The su(Hw) protein insulates expression of the Drosophila melanogaster white gene from chromosomal position-effects. EMBO J 12 435 442
24. KahnTG
SchwartzYB
DellinoGI
PirrottaV
2006 Polycomb complexes and the propagation of the methylation mark at the Drosophila ubx gene. J Biol Chem 281 29064 29075
25. MallinDR
MyungJS
PattonJS
GeyerPK
1998 Polycomb group repression is blocked by the Drosophila suppressor of Hairy-wing [su(Hw)] insulator. Genetics 148 331 339
26. SigristCJ
PirrottaV
1997 Chromatin insulator elements block the silencing of a target gene by the Drosophila polycomb response element (PRE) but allow trans interactions between PREs on different chromosomes. Genetics 147 209 221
27. CuddapahS
JothiR
SchonesDE
RohTY
CuiK
2009 Global analysis of the insulator binding protein CTCF in chromatin barrier regions reveals demarcation of active and repressive domains. Genome Res 19 24 32
28. EmberlyE
BlattesR
SchuettengruberB
HennionM
JiangN
2008 BEAF regulates cell-cycle genes through the controlled deposition of H3K9 methylation marks into its conserved dual-core binding sites. PLoS Biol 6 e327 doi:10.1371/journal.pbio.0060327
29. JothiR
CuddapahS
BarskiA
CuiK
ZhaoK
2008 Genome-wide identification of in vivo protein-DNA binding sites from ChIP-Seq data. Nucleic Acids Res 36 5221 5231
30. BartkuhnM
StraubT
HeroldM
HerrmannM
RathkeC
2009 Active promoters and insulators are marked by the centrosomal protein 190. EMBO J
31. KimTH
AbdullaevZK
SmithAD
ChingKA
LoukinovDI
2007 Analysis of the vertebrate insulator protein CTCF-binding sites in the human genome. Cell 128 1231 1245
32. SpanaC
HarrisonDA
CorcesVG
1988 The Drosophila melanogaster suppressor of Hairy-wing protein binds to specific sequences of the gypsy retrotransposon. Genes Dev 2 1414 1423
33. PollardD
2008 Bergman 2004 matrices.
34. HeintzmanND
HonGC
HawkinsRD
KheradpourP
StarkA
2009 Histone modifications at human enhancers reflect global cell-type-specific gene expression. Nature
35. BusheyAM
RamosE
CorcesVG
2009 Three subclasses of a Drosophila insulator show distinct and cell type-specific genomic distributions. Genes Dev 23 1338 1350
36. BernsteinBE
MikkelsenTS
XieX
KamalM
HuebertDJ
2006 A bivalent chromatin structure marks key developmental genes in embryonic stem cells. Cell 125 315 326
37. MikkelsenTS
KuM
JaffeDB
IssacB
LiebermanE
2007 Genome-wide maps of chromatin state in pluripotent and lineage-committed cells. Nature 448 553 560
38. PanG
TianS
NieJ
YangC
RuottiV
2007 Whole-genome analysis of histone H3 lysine 4 and lysine 27 methylation in human embryonic stem cells. Cell Stem Cell 1 299 312
39. ZhaoXD
HanX
ChewJL
LiuJ
ChiuKP
2007 Whole-genome mapping of histone H3 Lys4 and 27 trimethylations reveals distinct genomic compartments in human embryonic stem cells. Cell Stem Cell 1 286 298
40. MacArthurS
LiXY
LiJ
BrownJB
ChuHC
2009 Developmental roles of 21 Drosophila transcription factors are determined by quantitative differences in binding to an overlapping set of thousands of genomic regions. Genome Biol 10 R80
41. CaoR
ZhangY
2004 The functions of E(Z)/EZH2-mediated methylation of lysine 27 in histone H3. Curr Opin Genet Dev 14 155 164
42. SchwartzYB
KahnTG
NixDA
LiXY
BourgonR
2006 Genome-wide analysis of Polycomb targets in Drosophila melanogaster. Nat Genet 38 700 705
43. SchuettengruberB
GanapathiM
LeblancB
PortosoM
JaschekR
2009 Functional anatomy of polycomb and trithorax chromatin landscapes in Drosophila embryos. PLoS Biol 7 e13 doi:10.1371/journal.pbio.1000013
44. TolhuisB
de WitE
MuijrersI
TeunissenH
TalhoutW
2006 Genome-wide profiling of PRC1 and PRC2 Polycomb chromatin binding in Drosophila melanogaster. Nat Genet 38 694 699
45. NegreN
HennetinJ
SunLV
LavrovS
BellisM
2006 Chromosomal distribution of PcG proteins during Drosophila development. PLoS Biol 4 e170 doi:10.1371/journal.pbio.0040170
46. HalliganDL
KeightleyPD
2006 Ubiquitous selective constraints in the Drosophila genome revealed by a genome-wide interspecies comparison. Genome Res 16 875 884
47. BhutkarA
SchaefferSW
RussoSM
XuM
SmithTF
2008 Chromosomal rearrangement inferred from comparisons of 12 Drosophila genomes. Genetics 179 1657 1680
48. EngstromPG
Ho SuiSJ
DrivenesO
BeckerTS
LenhardB
2007 Genomic regulatory blocks underlie extensive microsynteny conservation in insects. Genome Res 17 1898 1908
49. DionMF
KaplanT
KimM
BuratowskiS
FriedmanN
2007 Dynamics of replication-independent histone turnover in budding yeast. Science 315 1405 1408
50. MitoY
HenikoffJG
HenikoffS
2005 Genome-scale profiling of histone H3.3 replacement patterns. Nat Genet 37 1090 1097
51. HenikoffS
HenikoffJG
SakaiA
LoebGB
AhmadK
2009 Genome-wide profiling of salt fractions maps physical properties of chromatin. Genome Res 19 460 469
52. SmithST
WickramasingheP
OlsonA
LoukinovD
LinL
2009 Genome wide ChIP-chip analyses reveal important roles for CTCF in Drosophila genome organization. Dev Biol 328 518 528
53. JiangN
EmberlyE
CuvierO
HartCM
2009 Genome-wide mapping of boundary element-associated factor (BEAF) binding sites in Drosophila melanogaster links BEAF to transcription. Mol Cell Biol 29 3556 3568
54. BartkuhnM
StraubT
HeroldM
HerrmannM
RathkeC
2009 Active promoters and insulators are marked by the centrosomal protein 190. EMBO J 28 877 888
55. MaedaRK
KarchF
2003 Ensuring enhancer fidelity. Nat Genet 34 360 361
56. LeeCK
ShibataY
RaoB
StrahlBD
LiebJD
2004 Evidence for nucleosome depletion at active regulatory regions genome-wide. Nat Genet 36 900 905
57. GeyerPK
1997 The role of insulator elements in defining domains of gene expression. Curr Opin Genet Dev 7 242 248
58. ChopraVS
CandeJ
HongJW
LevineM
2009 Stalled Hox promoters as chromosomal boundaries. Genes Dev 23 1505 1509
59. NegreN
LavrovS
HennetinJ
BellisM
CavalliG
2006 Mapping the distribution of chromatin proteins by ChIP on chip. Methods Enzymol 410 316 341
60. WhitfieldWG
ChaplinMA
OegemaK
ParryH
GloverDM
1995 The 190 kDa centrosome-associated protein of Drosophila melanogaster contains four zinc finger motifs and binds to specific sites on polytene chromosomes. J Cell Sci 108 (Pt 11) 3377 3387
61. GerasimovaTI
CorcesVG
1998 Polycomb and trithorax group proteins mediate the function of a chromatin insulator. Cell 92 511 521
62. GerasimovaTI
GdulaDA
GerasimovDV
SimonovaO
CorcesVG
1995 A Drosophila protein that imparts directionality on a chromatin insulator is an enhancer of position-effect variegation. Cell 82 587 597
63. ParnellTJ
KuhnEJ
GilmoreBL
HelouC
WoldMS
2006 Identification of genomic sites that bind the Drosophila suppressor of Hairy-wing insulator protein. Mol Cell Biol 26 5983 5993
64. TsukiyamaT
WuC
1996 Purification of GAGA factor of Drosophila and its role in nucleosome disruption. Methods Enzymol 274 291 299
65. JohnsonWE
LiW
MeyerCA
GottardoR
CarrollJS
2006 Model-based analysis of tiling-arrays for ChIP-chip. Proc Natl Acad Sci U S A 103 12457 12462
66. BaileyTL
ElkanC
1994 Fitting a mixture model by expectation maximization to discover motifs in biopolymers. Proc Int Conf Intell Syst Mol Biol 2 28 36
67. HughesJD
EstepPW
TavazoieS
ChurchGM
2000 Computational identification of cis-regulatory elements associated with groups of functionally related genes in Saccharomyces cerevisiae. J Mol Biol 296 1205 1214
68. LiuXS
BrutlagDL
LiuJS
2002 An algorithm for finding protein-DNA binding sites with applications to chromatin-immunoprecipitation microarray experiments. Nat Biotechnol 20 835 839
69. KheradpourP
StarkA
RoyS
KellisM
2007 Reliable prediction of regulator targets using 12 Drosophila genomes. Genome Res 17 1919 1931
70. TouzetH
VarreJS
2007 Efficient and accurate P-value computation for Position Weight Matrices. Algorithms Mol Biol 2 15
71. HalfonMS
GalloSM
BergmanCM
2008 REDfly 2.0: an integrated database of cis-regulatory modules and transcription factor binding sites in Drosophila. Nucleic Acids Res 36 D594 598
Štítky
Genetika Reprodukční medicínaČlánek vyšel v časopise
PLOS Genetics
2010 Číslo 1
- Kazuistika – Perspektivy využití precizované medicíny v rámci personalizované specifické terapie onkologických pacientů
- Nobelova cena za chemii pro genetické nůžky: Objev, který změní naši budoucnost?
- Technologie na bázi RNA v klinické praxi: od přebarvených petúnií k terapii vzácných a dosud jen obtížně léčitelných chorob u lidí
- „Nepředstavovali jsme si, že náš výzkum povede přímo ke vzniku nových léků, dokonce ještě za našeho života“
- Bezplatné služby pro diagnostiku ATTRv amyloidózy pro kardiology
Nejčtenější v tomto čísle
- A Major Role of the RecFOR Pathway in DNA Double-Strand-Break Repair through ESDSA in
- Kidney Development in the Absence of and Requires
- The Werner Syndrome Protein Functions Upstream of ATR and ATM in Response to DNA Replication Inhibition and Double-Strand DNA Breaks
- Alternative Epigenetic Chromatin States of Polycomb Target Genes
Zvyšte si kvalifikaci online z pohodlí domova
Mazová zátka a její řešení
nový kurzVšechny kurzy