
Evidence for Pervasive Adaptive Protein Evolution in Wild Mice
The relative contributions of neutral and adaptive substitutions to molecular evolution has been one of the most controversial issues in evolutionary biology for more than 40 years. The analysis of within-species nucleotide polymorphism and between-species divergence data supports a widespread role for adaptive protein evolution in certain taxa. For example, estimates of the proportion of adaptive amino acid substitutions (α) are 50% or more in enteric bacteria and Drosophila. In contrast, recent estimates of α for hominids have been at most 13%. Here, we estimate α for protein sequences of murid rodents based on nucleotide polymorphism data from multiple genes in a population of the house mouse subspecies Mus musculus castaneus, which inhabits the ancestral range of the Mus species complex and nucleotide divergence between M. m. castaneus and M. famulus or the rat. We estimate that 57% of amino acid substitutions in murids have been driven by positive selection. Hominids, therefore, are exceptional in having low apparent levels of adaptive protein evolution. The high frequency of adaptive amino acid substitutions in wild mice is consistent with their large effective population size, leading to effective natural selection at the molecular level. Effective natural selection also manifests itself as a paucity of effectively neutral nonsynonymous mutations in M. m. castaneus compared to humans.
Published in the journal:
. PLoS Genet 6(1): e32767. doi:10.1371/journal.pgen.1000825
Category:
Research Article
doi:
https://doi.org/10.1371/journal.pgen.1000825
Summary
The relative contributions of neutral and adaptive substitutions to molecular evolution has been one of the most controversial issues in evolutionary biology for more than 40 years. The analysis of within-species nucleotide polymorphism and between-species divergence data supports a widespread role for adaptive protein evolution in certain taxa. For example, estimates of the proportion of adaptive amino acid substitutions (α) are 50% or more in enteric bacteria and Drosophila. In contrast, recent estimates of α for hominids have been at most 13%. Here, we estimate α for protein sequences of murid rodents based on nucleotide polymorphism data from multiple genes in a population of the house mouse subspecies Mus musculus castaneus, which inhabits the ancestral range of the Mus species complex and nucleotide divergence between M. m. castaneus and M. famulus or the rat. We estimate that 57% of amino acid substitutions in murids have been driven by positive selection. Hominids, therefore, are exceptional in having low apparent levels of adaptive protein evolution. The high frequency of adaptive amino acid substitutions in wild mice is consistent with their large effective population size, leading to effective natural selection at the molecular level. Effective natural selection also manifests itself as a paucity of effectively neutral nonsynonymous mutations in M. m. castaneus compared to humans.
Introduction
Several approaches have revealed evidence for adaptation at the molecular level. Local reductions in diversity, indicating selective sweeps, have been identified in populations of a number of species [1],[2]. In Drosophila, reductions in neutral diversity have also been associated with increased divergence at amino acid sites, indicative of recurrent selective sweeps of advantageous amino-acid changing substitutions [3]. There is also evidence for a general reduction in diversity close to conserved sequence features in protein-coding genes and noncoding elements of hominids [4]. These reductions can be attributed either to genetic hitchhiking of positively selected alleles or background selection against negatively selected alleles. Higher FST within genic than nongenic regions of the human genome suggests that genic regions are subject to local adaptation within populations [5], (although see [6]). Further evidence for adaptation has come from attempts to identify sites or genes subject to recurrent positive selection by looking for an excess of substitutions in sites of interest over that expected. For example, a nonsynonymous to synonymous divergence ratio exceeding one at a locus may be evidence for positive selection at nonsynonymous sites. An approach that tests for an excess of substitutions at selected sites is the McDonald-Kreitman test [7], which contrasts levels of polymorphism with divergence at selected sites (e.g., nonsynonymous sites) and linked putatively neutral sites (e.g., synonymous sites). A recent extension of this test quantifies molecular adaptation as the fraction of substitutions driven to fixation by positive selection (α) [8],[9] by comparing the observed number of selected substitutions to the number expected, based on levels of polymorphism and divergence at neutral sites.
The application of derivatives of the McDonald-Kreitman test to amino-acid changing sites has resulted in a wide range of estimates of α, the causes of which may be multifaceted. Relatively high estimates of α have been obtained for enteric bacteria [10] and consistently high estimates have been obtained for Drosophila [9], [11]–[13], suggesting that α may be 50% or more in these species. On the other hand, estimates from yeast [14],[15], Arabidopsis [16] and hominids have been low. In the case of hominids, several independent estimates have found α for hominids to be 13% at most (with the exception of an estimate by Fay et al. [8]) [17]–[20].
Some of the observed variation in estimates of α may also be attributable to differences in the methods used. Specifically, some estimates of α are compromised by slightly deleterious mutations, since these contribute proportionately more than neutral polymorphisms to diversity than divergence. If slightly deleterious mutations are prevalent and not properly accounted for then α could be substantially underestimated [21]. This may partially explain low estimates of α obtained using methods that do not incorporate explicit population genetics models (e.g. yeast [14],[15] and Arabidopsis, [16]). Recently, improved methods to estimate α have been developed that model the contribution of slightly deleterious mutations to polymorphism and divergence [20],[22].
However, estimates of α obtained from hominids are low, even when based on methods that attempt to model for slightly deleterious mutations [20],[22], whereas estimates from Drosophila are high [22]. It is possible that this observation is a consequence of differences in effective population size (Ne). Drosophila melanogaster is estimated to have an Ne of 1–2 million, whereas hominids seem to have an unusually low recent Ne [23]. In D. miranda, which is estimated to have a lower Ne than D. melanogaster, Ne is probably still an order of magnitude larger than that for hominids, and a high estimate of α was observed [13]. The proportion of adaptive substitutions is expected to depend on Ne for two reasons. Firstly, a higher proportion of both advantageous and deleterious mutations are expected to be effectively neutral in species with low Ne, because selection for/against slightly advantageous/deleterious mutations becomes less effective (see [24]). In such species, a higher proportion of slightly deleterious mutations, and conversely, a smaller proportion of slightly advantageous mutations, are expected to contribute to divergence. Secondly, if the rate of adaptation is limited by the supply of mutations, then species with low Ne will adapt more slowly simply because they have to wait longer for each new advantageous mutation to appear in the population.
Currently there are no estimates for rates of adaptive evolution of protein-coding genes in mammals other than hominids, particularly for species with higher Ne. M. m. castaneus populations from NW India, a region believed to be part of the ancestral range of the house mouse sub-species complex [25], have silent-site diversity for the X-chromosome of the order of 1% [26]. When combined with an estimate of the per nucleotide mutation rate per generation for murids [27], this level of diversity suggests that M. m. castaneus Ne is two orders of magnitude higher than recent Ne of hominids, and comparable to Ne typically seen in Drosophila. We hypothesised that the murid protein-coding genes would therefore show pervasive natural selection, whereas its impact is much reduced in hominid orthologs. We tested the hypothesis by estimating α from protein-coding genes of murid rodents by comparing nucleotide polymorphism data of M. m. castaneus sampled from the NW Indian population with nucleotide divergence to M. famulus and the rat.
Results/Discussion
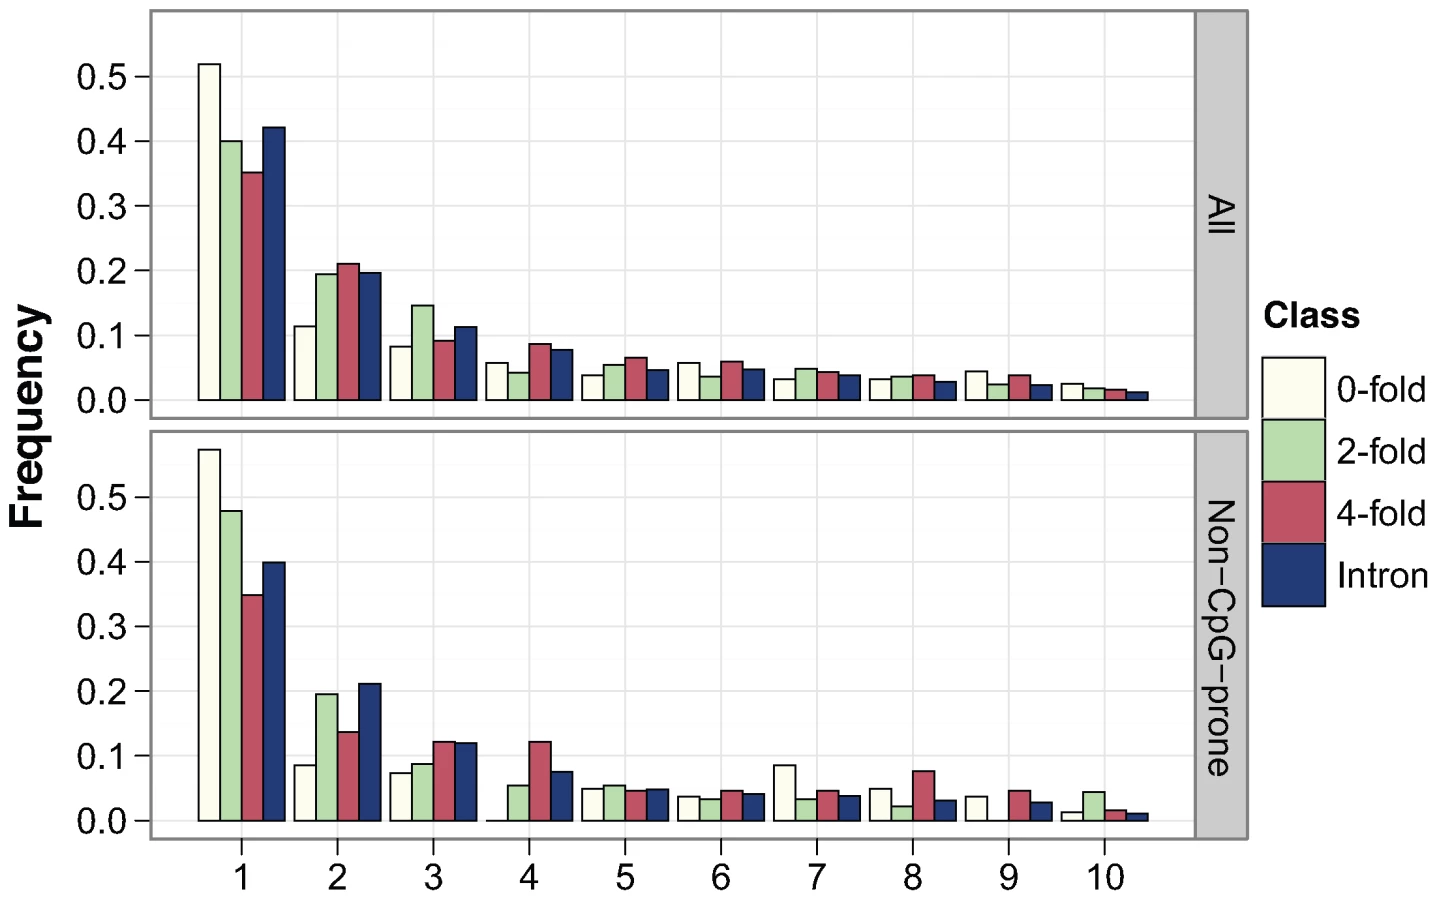
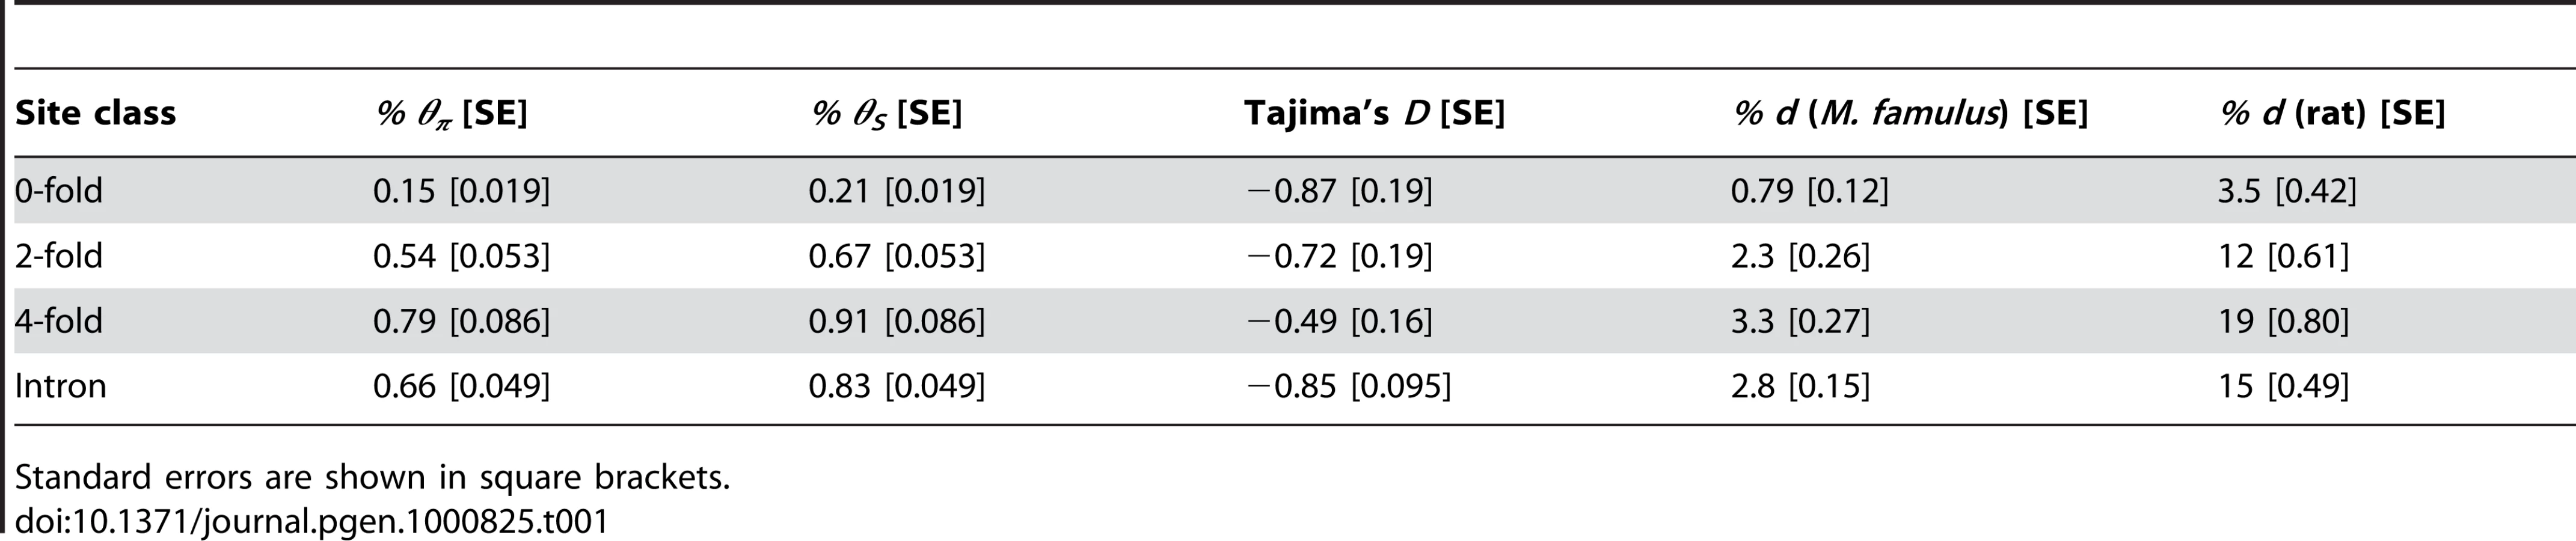
To infer levels of negative and positive selection in murid protein-coding genes, we analysed nucleotide diversity within a sample of 15 wild, unrelated M. m. castaneus from the NW Indian population together with the nucleotide divergence between M. m. castaneus and either M. famulus or the rat. We sequenced amplicons from a sample of 77 autosomal loci that are part of the Environmental Genome Project (EGP) [28] (details of the genes sequenced are presented in Table S1). These loci are not a random sample, since they are associated with human genetic diseases whose susceptibility is influenced by environmental challenge. However, they show low rates of adaptive amino acid substitution that are typical of hominids [17]–[20]. Summary statistics concerning nucleotide diversity at intronic, 4-fold degenerate, 2-fold degenerate and 0-fold degenerate sites are shown in Table 1 and Table S2 and the allele frequency distributions (or site frequency spectra, SFS) are plotted in Figure 1. As expected, zero-fold degenerate sites have the lowest nucleotide diversity, lowest divergence, the most negatively skewed SFS, and the most negative estimate of Tajima's D, a statistic related to the skew in the distribution of allele frequencies [29]. This is consistent with purifying selection keeping most amino acid mutations at low frequencies and reducing the number of fixations. Nucleotide diversity is higher for synonymous than intronic sites, as is Tajima's D. Together with a slightly higher synonymous than intronic divergence between M. m. castaneus and M. famulus (Table 1), this suggests somewhat weaker purifying selection acting on synonymous than intronic sites in murids, and that synonymous sites are likely to be the most appropriate neutral reference.
Recent Ne in wild mice, humans and Drosophila can be compared by equating synonymous site nucleotide diversity (θπ) to 4Neμ, where μ is an estimate of the mutation rate per site per generation (Table 2). Using estimates of μ based on synonymous site divergence and an assumption of two generations per year, our estimate of Ne for wild mice of 580,000 is similar to that obtained for African D. melanogaster, whereas, in African populations of humans, Ne is nearly two orders of magnitude smaller. Our estimate for M. m. castaneus is consistent with, although marginally higher than, a recent estimate of 400,000 (also assuming two generations per year) [30], based on smaller sample of loci. Nucleotide diversity in NW Indian M. m. castaneus is approximately one order of magnitude higher than observed in derived populations of M. m. domesticus and M. m. musculus from Europe and two orders of magnitude higher than among laboratory inbred mouse strains [26],[30],[31].

To estimate parameters of the distribution of fitness effects of deleterious amino acid-changing mutations we used a maximum likelihood (ML) procedure [32] that contrasts the SFS at putatively neutral sites (four-fold degenerate or intronic sites in this case) with sites assumed to be subject to purifying selection (nonsynonymous sites). The procedure fits a gamma distribution of deleterious mutational effects to the nonsynonymous SFS, and a demographic model to both the neutral and nonsynonymous SFSs that allows a step change in population size at some time in the past. The method assumes that positively selected mutations make a negligible contribution to polymorphism. Selective effects (s) of new amino acid mutations are estimated as the product of Ne and s (see Materials and Methods for details of the method). Assuming four-fold sites as the neutral reference, estimates of proportions of amino acid mutations that have fitness effects in different Nes ranges under the best-fitting mutation effect distributions are compared in Table 3 for our M. m. castaneus data set, three African or African-American human data sets ([28]; the “Seattle SNPs” Programs for Genomic Applications (PGA) [33]; the dataset of Boyko et al. [20]) and an African D. melanogaster data set [11]. Similar results are obtained if intronic sites are used as the neutral reference (Table 3). Nearly neutral deleterious amino acid mutations (i.e., mutations for which Nes<1), which have an appreciable chance of drifting to fixation, are relatively uncommon in both mice and Drosophila (10% and 6% of amino acid mutations, respectively), whereas they make up ∼20% of amino acid mutations in humans (maximum P = 0.038 for mouse versus human comparison, see Table 4 for details; P = 0.25 for mouse vs. Drosophila comparison). Strongly deleterious mutations (Nes>10), which essentially never become fixed, are inferred to be somewhat more frequent in mice and Drosophila (79% and 87%, respectively; P = 0.21) than humans (∼70%; P<0.05 for all contrasts with mice except one, see Table 4 for details). Whilst it is possible that these differences between the species in the relative frequencies of mutations in different Nes categories reflect differences in the distribution of absolute selection coefficients (s) between species, it is more likely that they reflect differences in Ne. For example, a lower long term Ne in humans would allow more deleterious mutations to segregate at higher frequencies than in either mice or Drosophila. ML estimates of the demographic parameters of the model using four-fold sites as the neutral reference imply that there has been a recent increase in Ne in M. m. castaneus (Table S3), as well as African D. melanogaster [32].


A lack of neutral diversity in fast evolving genes has previously been interpreted as evidence for the effects of selective sweeps and therefore adaptation in Drosophila [13],[34],[35]. However, in contrast to these results, we found a nonsignificant positive correlation between synonymous site diversity and nonsynonymous divergence (Spearman r = 0.21, p = 0.084 for dN vs. θπ and r = 0.16, p = 0.084 for dN vs θS). Therefore, unlike in Drosophila, our data do not suggest that selective sweeps in genes undergoing high rates of adaptive evolution reduce local neutral diversity, although our relatively small data set limits the power of this analysis.
To further investigate evidence for adaptation we estimated the fraction of adaptive amino acid substitutions, α, between M. m. castaneus and either M. famulus or the rat by a method related to the McDonald-Kreitman test for adaptive evolution [7] that contrasts polymorphism with divergence [22]. The method attempts to account for nearly neutral amino acid mutations, which, when compared to strongly deleterious mutations, contribute proportionately more to polymorphism than divergence. The parameters of the distribution of effects of deleterious amino acid mutations, estimated by ML from polymorphism within M. m. castaneus, and the neutral site divergence between M. m. castaneus and the outgroup (M. famulus or rat) are used to compute the number of amino acid substitutions expected between M. m. castaneus and the outgroup. The estimated fraction of adaptive substitutions is the difference between this expected number and the observed number of amino acid substitutions, scaled by the observed number (see [22] and Methods). Simulations suggest that the method produces close to unbiased estimates of α if the assumptions of the model are met, and is robust to substantial departures from the model assumptions, including complex demographic scenarios and linkage between sites [22]. However, in common with all McDonald-Kreitman based approaches, it is sensitive to long-term population size changes, a point that is discussed later.
Our estimate of α for wild mice, assuming four-fold sites as the neutral reference, is 57% (Table 3). This is somewhat higher than, but non-significantly different to, an estimate of 52% for African D. melanogaster with divergence to D. simulans (P = 0.54). However, the estimate for α in mice is very much higher than estimates for hominids for all the human polymorphism data sets, including the EGP data (P = 0.014 for a comparison only involving the subset of gene orthologs sequenced in mice using divergence to macaque) and PGA (P = 0.11 using divergence to macaque), and the data set of Boyko et al. [20] (P = 0.020 using divergence to chimpanzee). CpG dinucleotides have an elevated mutation rate in mammals and differ in frequency between coding and non-coding DNA. However, using only sites that are unlikely to be part of a CpG dinucleotide (non-CpG-prone sites) yields estimates of α that are similar to those based on all sites (Table 5).

Estimates of α could also be affected by more complex demographic scenarios, such as admixture between differentiated sub-species and/or population subdivision, that are not modelled in our algorithm. We tested for evidence of population structure or admixture using the program Structure [36] using one randomly sampled four-fold degenerate or intronic SNP per sequenced locus. For both intronic and 4-fold degenerate synonymous sites we found no evidence for population subdivision in the M. m. castaneus sample, since the “no-admixture” model gives P = 1 in all but one case for a number of populations parameter K = 1 (see Table S4 for details). However, under the “admixture” model there is better support for two populations (K = 2) than one population (Table S4), suggesting population subdivision. Figure 2 shows an ancestry plot for one randomly selected run that provided support for K = 2. In this plot each individual shows ancestries in both putative populations (with roughly equal proportions in the population), suggesting that they are admixed. However, we do not find any individuals that have ancestries in just one of the two populations (i.e., there are no individuals that are purely from population 1 or purely from population 2), suggesting that this result can be explained by a violation of an assumption in Structure, namely that genotype frequencies are at Hardy-Weinberg equilibrium. House mice are known to inbreed in the wild [37], potentially causing an elevated inbreeding coefficient (Fis). To determine whether such an effect can be observed in our sample, we calculated Fis values [38] for each SNP using the program Genepop (http://genepop.curtin.edu.au/). We found a substantial excess of loci showing positive Fis values, indicating a deficiency of heterozygotes and a deficiency of negative Fis values, indicating an excess of homozygotes (Figure S1). Thus, our sample shows evidence for inbreeding. In summary, our interpretation of these results is that the M. m. castaneus population shows no evidence for hidden population substructure or admixture between differentiated subspecies, but there is evidence that inbreeding is a feature of all individuals used in the study.

We attempted to account for the effect of inbreeding, and therefore the possibility that alleles from the same individual are not independent samples from the population, by repeating the analysis for 20 datasets created by randomly selecting one allele from each individual for each site, such that each sequence analysed in each data set was a composite, derived from a single individual. We then calculated mean estimates of α by averaging over the 20 randomly generated datasets. When calculated by this method, our estimates of mean α are only marginally lower than estimates using the complete data set (see Table S5).
Estimates of α obtained using rat as the outgroup are generally somewhat lower than those using M. famulus, but are still close to 40% (estimates range from 0.33 to 0.51, see Table 5), suggesting that the estimate of α in murids is robust to the choice of outgroup. An earlier method to estimate α [8] attempts to remove the influence of nearly neutral deleterious mutations by excluding polymorphisms at a frequency below an arbitrary threshold (e.g., 10%). Estimates of α produced by this method are somewhat lower than the estimates from our method (Table 6), but this is expected because estimates are likely to be downwardly biased [21]. However, they are substantially higher than estimates of α using this method in hominids [8]. If all sites are included in this analysis, irrespective of their frequency, estimates of α in wild mice are close to zero, or even negative (Table 6). This is likely to be due to slightly deleterious mutations, which contribute low frequency polymorphisms but have little chance of fixation, and lead to downwardly biased α estimates. Indeed even when low-frequency, segregating at a frequency of <10%, are excluded, analyses suggest that estimates of α may still be downwardly biased.
![Estimates of the fraction of substitutions driven to fixation by positive selection obtained using a simple extension of the McDonald-Kreitman test <em class="ref">[7]</em>.](https://pl-master.mdcdn.cz/media/cache/media_object_image_large/media/image/21e68ceb1e3d9c160a291782d4778a04.png)
Currently available estimates of α from a variety of species vary widely. The estimates of the fractions of adaptive substitutions in microbes [10], Drosophila [9],[11],[12] and now mice present a serious challenge to the neutralist view of protein evolution. Taken together these results suggest that most amino acid substitutions are caused by positive selection, and that genetic drift is therefore not the most important cause of protein evolution. However, estimates of α obtained for yeast [14],[15], Arabidopsis [16], and hominids (which are ∼10% at most [17]–[20]) suggest the opposite. There are several possible explanations for these discrepancies. One possibility is that the estimates obtained for yeast and Arabidopsis are not based on an explicit population genetics model, and even though attempts have been made to reduce the impact of slightly deleterious mutations, the estimates may still be downwardly biased. Nevertheless, these results are hard to reconcile with estimates from microbes, Drosophila and mice, since both of these species are thought to have a relatively high Ne. On the other hand, the low estimated proportion of adaptive substitutions in hominids may reflect their low Ne, since this will increase the proportion of effectively neutral advantageous and deleterious mutations. Low Ne will also reduce the rate of adaptive evolution if the rate is limited by the supply of mutations. This is consistent with the low recent Ne estimates for humans [23], chimpanzees [39] and gorillas [40]. It is also possible that most adaptive evolution occurs in noncoding regions in primates [41].
Alternatively, changes in effective population size can lead to bias in the estimate of α [7],[42]. It can be shown that if the true value of α is independent of Ne, but that the current Ne (which affects the level of polymorphism) is different to the average Ne over the evolution of the species (which affects the level of divergence) then the relationship between the true (αtrue) and estimated (αest) values of α is given by(1)[22], if the distribution of fitness effects is gamma, where λ is the ratio of the current and ancestral Ne and b is the shape parameter of the gamma distribution of mutational effects. Thus, a contraction in Ne will lead to an underestimate of α and an increase will lead to an overestimate. It is therefore possible that the difference in the estimate of α between hominids and rodents is due to recent demography; if the current Ne of humans was much smaller than the ancestral population size, and/or the current Ne of M. m. castaneus was much larger than the ancestral, then αtrue could be very similar in the two species. Recent evidence suggests that ancestral great ape Ne may have been substantially bigger than current [43]. So, for example, assuming b for humans is 0.2 [20],[32],[44], αest = 0.1 implies αtrue = 0.35 and 0.43 for 5 - and 10-fold reductions in long-term Ne, respectively (equation 1). However, we also infer from our polymorphism data that M. m. castaneus has undergone a recent increase in Ne, although our evidence for this is modest. Nevertheless, assuming that current M. m. castaneus Ne is 5 - and 10-fold larger than the ancestral Ne, our estimates of αest = 0.57 and b = 0.31 (see Table S3) would imply that αtrue = 0.29 and 0.12 respectively (consistent with the estimates from humans). More estimates of α from other murid and mammalian species will help to determine whether the high rate of adaptive evolution we have inferred is widespread amongst murid species and therefore not an artefact of demography.
Materials and Methods
Sampling of wild mice
The 15 M. m. castaneus individuals were collected in 2003 in 4 localities (2–5 individuals per locality) along a 130 km transect (from lat 32.244987°, lon 77.188181° to lat 30.977139°, lon 76.986026°) south of the Himalayas in the North-West Indian state of Himachal Pradesh. Each locality extended over an area covering 5 km2. To avoid collecting related individuals, we analysed only one individual per trap site within each locality and trap sites had to be separated by >500m. An individual M. famulus, originating from India (locality Kotagiri), was obtained from the Montpellier wild mice genetic repository (http://www.isem.cnrs.fr/spip.php?article477).
Selection of amplicons
DNA sequences were generated for genes sampled from a set whose human orthologs have been sequenced in the Environmental Genome Project (EGP) [28]. All genes sequenced as part of EGP are autosomal and many had polymorphism data available for African human populations at the time of searching, allowing us to make a direct comparison of the results we obtained in mice with results based on the same set of genes in a human population. Loci sequenced in Africans (618 as of 7th August 2007) whose orthologs could be identified in the mouse genome (585 genes, using NCBI Homologene) were considered. For 77 loci, DNA sequences were generated for the 15 M. m. castaneus individuals and one M. famulus individual. Primers were designed to amplify regions that captured coding and intronic DNA using Primer3 [45].
DNA sequences
PCR reactions were performed using GoTaq DNA polymerase (Promega) using a touchdown program consisting of 95°C for 15 minutes, followed by 28 cycles of 95°C for 30 seconds, 62°C for 45 seconds (reducing by 0.5°C every cycle), 72°C for 2 minutes, then 12 cycles of 95°C for 30 seconds, 52 °C for 45 seconds and 72°C for 2 minutes, with a final extension at 72°C for 10 minutes. Following evaluation on 1% agarose gels, products were purified using ExoSAP-IT (USB), or, if product indicated non-specific priming, the appropriate band was cut from a gel and extracted using Qiaquick gel extraction kit (Qiagen). Forward and reverse sequences were generated using Big Dye Terminator Sequencing Kits (Applied Biosystems) on an ABI Prism 3730 DNA Analyzer.
Sequence analysis and variant detection was carried out using CodonCode Aligner version 2.0.6 (http://www.codoncode.com/aligner/). Sequences had an average Phred score of >60. All sequence traces were manually checked. CodonCode was set to highlight any site with a Phred score <30 (which could include low quality sequence or heterozygous sites). All such sites were manually checked, but in order to avoid excluding heterozygotes, were not automatically excluded. Alignments between the 15 M. m. castaneus, the M. famulus individual and the M. m. musculus reference sequence were obtained. All alignments were manually checked before further analysis.
Processing of sequence data
Orthologous Rattus norvegicus sequences were obtained for each amplicon using a combination of approaches. Initially, the mouse reference sequence was BLASTed [46] against two different assemblies of the rat genome, downloaded from UCSC genome browser. The first was produced by the Baylor College of Medicine Human Genome Sequencing Center (BCM-HGSC) as part of the Rat Genome Sequencing Consortium, and the second (referred to as the alternative assembly) was produced by Celera Genomics. If no reciprocal-best-hit was found in the standard assembly, a reciprocal-best-hit search was done in the alternative assembly. The mouse and rat sequences were then aligned using MAVID [47], the alignments checked by eye, and poorly aligned sections masked in rat. If the reciprocal-best-hits approach failed to identify an orthologous section in rat, the relevant section from the “multiz30way” whole genome sequence alignments of 30 vertebrates (available at the UCSC genome browser http://genome.ucsc.edu/) was checked. If the sequence of interest was located entirely within a single unbroken alignment for mouse and rat, then the rat sequence was considered as orthologous, and the relevant section of the alignment was realigned, checked and masked as before. Using this procedure, we successfully identified rat sequences orthologous to at least part of each mouse amplicon.
Alignments for each amplicon were generated between M. m. musculus release mm9, the M. m. castaneus individuals, M. famulus and rat. Then, using the M. m. musculus annotation, sites were categorised as “0-fold” (0-fold degenerate sites, or nonsynonymous), “2-fold” (2-fold degenerate sites), “4-fold” (4-fold degenerate synonymous sites, or synonymous) or “intron”. We excluded potential splice sites (defined as the first 6bp or last 16bp of an intron). Sites were also scored for their CpG-prone status (defined as being preceded by a C or followed by a G in any species).
Summary statistics
We calculated two standard estimates of diversity, θS, the number of segregating sites divided by a normalising factor where n is the number of sequences [48], and θπ, the average heterozygosity, also known as nucleotide diversity or π [49]. Both estimators, when normalised per site, are unbiased estimates of 4Neμ (under a Fisher-Wright neutral of drift and an infinite sites model of mutation, such that each site experiences no more than one mutation). However, they are expected to differ if there is an excess or deficit of low or high frequency variants. This difference and therefore the level of skew in the SFS can be quantified with Tajima's D [29]. However, since D can only be calculated when the same number of chromosomes has been sequenced at each site (and this is not the case in the data presented here, see Table S6), we sampled sequences 20 times without replacement at each site (rejecting sites with fewer than 20 sequences) such that the number of chromosomes sampled per site was constant. We also calculated divergence between the M. m. castaneus sequences and both M. famulus and rat sequences using a Jukes-Cantor correction for multiple hits. 95% confidence intervals for θπ, θS, Tajima's D and divergence were calculated by bootstrapping 1,000 times by locus.
Inference of the distribution of fitness effects of new amino acid mutations
We extended a maximum likelihood approach [32] to estimate parameters of the distribution of fitness effects of new amino acid mutations using the allele frequency distributions (the site frequency spectra, SFSs) for 0-fold and putatively neutrally evolving sites (either 4-fold or intronic sites). We assumed that effects (s) of amino acid mutations are unconditionally deleterious, and sampled from a gamma distribution with shape and scale parameters a and b, respectively. These parameters were estimated along with the fraction of unmutated sites, f0, and demographic parameters N1, N2 and t, corresponding to ancestral population size, current population size and the number of generations since a population size change, respectively. Polymorphism data were summed across loci using folded SFSs. We extended the method to allow variation in the number of alleles at each site. We generated SFSs for sites with the same numbers of alleles, computed the log likelihood for each SFS, and summed these to compute the overall log likelihood. Selective effects are estimated on a scale Ns, where N is a measure of the population size at the time that the polymorphism data are censured. Under the assumption of a single step change in population size, there may be little information to estimate the relative values of the population size before (N1) and after (N2) the size change if, for example, t≫N2 or t≪N2. We therefore computed a weighted recent population size fromwhere and .
Estimating the proportion of adaptive substitutions, α
We estimated α for 0-fold substitutions using a method that attempts to account for the segregation of slightly deleterious mutations and recent population size changes [22]. The divergence at neutrally evolving sites (dS) is proportional to the mutation rate per site. At selectively evolving sites, the expected divergence due to fixation of deleterious mutations is proportional to the product of the mutation rate and the fixation probability, u(N, Nes), of a new mutation [50]. Defining dN as the observed divergence at the selectively evolving sites, and equating N with Ne (because these are equivalent under the transition matrix method under which population size is estimated) α is proportional to the difference between the observed and expected divergence:(note that dS and ds are different quantities). α was initially estimated using all sequenced alleles (i.e. a total of 30 alleles, two per individual).
To test whether our estimates of alpha could be biased as a result of assuming that different alleles from the same individual are independent, we also estimated α using only a selected and neutral reference sequence for each individual. Specifically we created 20 data sets in which, for each individual and for every site, we randomly picked a single base from the individuals' two alleles. Each data set therefore consisted of up to 15 selected/neutral reference sequences, each one corresponding to a different individual. Mean estimates of α were then computed by averaging over the 20 randomly generated datasets.
We also used Fay, Wyckoff and Wu's [8],[9] extension of the McDonald-Kreitman test to estimate the fraction of 0-fold substitutions driven to fixation by positive selection, αFWW:where DN (PN) and DS (PS) are numbers of divergent (polymorphic) sites for selected and neutral classes, respectively, and the summation is over genes. To reduce the influence of nearly neutral alleles on αFWW, we excluded sites where the rare variant was at a frequency of 10% or less. This method assumes that the number of alleles sampled is constant, so we again sampled the alignments to give 20 alleles per site and ignored sites that lacked an orthologous base in the outgroup. 95% confidence intervals for all statistics were obtained by bootstrapping 1,000 times by locus.
Inference of population structure
House mice, especially those originating from the ancestral range, could exhibit a complex genetic composition, reflecting either incomplete lineage sorting or admixture between the different subspecies [30],[51]. We used our multilocus SNP dataset to determine if the population sample of M. m. castaneus that was used in our study shows evidence for admixture or hidden population substructure. We randomly selected one SNP from each amplicon, excluding SNPs that cover known splice sites and only including SNPs where at least 10 of the 15 individuals could be sequenced. We excluded any SNPs covering indel sites. We separately analysed SNPs from intronic sites and SNPs from 4-fold degenerate sites. Altogether 84 (intronic data) or 82 (4-fold degenerate sites) unlinked SNP loci were included in the analysis.
We used the program Structure [36] to identify the presence of different subpopulations in the sample, if any, and to estimate the ancestry of the sampled individuals in each of these subpopulations. The number of subpopulations is inferred by calculating the probability P(X|K) of the data given a certain prior value of K (number of subpopulations) over a number of Monte Carlo Markov Chain (MCMC) iterations. The posterior probabilities P(K|X) can be calculated following Bayes' rule. The subpopulations are characterised by different allele frequencies, and, according to their multilocus genotypes, individuals are probabilistically assigned to one or more subpopulations. The scores of individuals in the subpopulations correspond to the probability of ancestry in any one of them. In this study we assumed prior values of K from 1 to 4. We considered two models for the ancestry of individuals. In the first, the “no-admixture model”, individuals are assumed to be drawn purely from one of K populations. In the second, the “admixture model”, individuals are allowed to have mixed ancestry, that is, some fraction of an individual's genome comes from different subpopulations. Both of those models assume that all the markers are unlinked and provide independent information on an individual's ancestry. Inferences of the number of subpopulations and ancestries of individuals are based on 1,000,000 iterations of the MCMC, after a “burn-in” period of 100,000 iterations. We ran the program without incorporation of prior population information. We performed 3 independent runs of the Markov chain for each parameter set to check for convergence of the chains.
Supporting Information
Zdroje
1. AndolfattoP
2001 Adaptive hitchhiking effects on genome variability. Curr Opin Genet Dev 11 635 641
2. NielsenR
2005 Molecular signatures of natural selection. Annu Rev Genet 39 197 218
3. MacphersonJM
SellaG
DavisJC
PetrovDA
2007 Genomewide spatial correspondence between nonsynonymous divergence and neutral polymorphism reveals extensive adaptation in Drosophila. Genetics 177 2083 2099
4. McVickerG
GordonD
DavisC
GreenP
2009 Widespread genomic signatures of natural selection in hominid evolution. PLoS Genet 5 e1000471 doi:10.1371/journal.pgen.1000471
5. HindsDA
StuveLL
NilsenGB
HalperinE
EskinE
2005 Whole-genome patterns of common DNA variation in three human populations. Science 307 1072 1079
6. CoopG
PickrellJK
NovembreJ
KudaravalliS
LiJ
2009 The Role of Geography in Human Adaptation. PLoS Genet 5 e1000500 doi:10.1371/journal.pgen.1000500
7. McDonaldJH
KreitmanM
1991 Adaptive protein evolution at the Adh locus in Drosophila. Nature 351 652 654
8. FayJC
WyckoffGJ
WuCI
2001 Positive and negative selection on the human genome. Genetics 158 1227 1234
9. SmithNG
Eyre-WalkerA
2002 Adaptive protein evolution in Drosophila. Nature 415 1022 1024
10. CharlesworthJ
Eyre-WalkerA
2006 The rate of adaptive evolution in enteric bacteria. Mol Biol Evol 23 1348 1356
11. ShapiroJA
HuangW
ZhangC
HubiszMJ
LuJ
2007 Adaptive genic evolution in the Drosophila genomes. Proc Natl Acad Sci U S A 104 2271 2276
12. MasideX
CharlesworthB
2007 Patterns of molecular variation and evolution in Drosophila americana and its relatives. Genetics 176 2293 2305
13. BachtrogD
2008 Similar rates of protein adaptation in Drosophila miranda and D. melanogaster, two species with different current effective population sizes. BMC Evol Biol 8 334 334
14. DonigerSW
KimHS
SwainD
CorcueraD
WilliamsM
2008 A catalog of neutral and deleterious polymorphism in yeast. PLoS Genet 4 e1000183 doi:10.1371/journal.pgen.1000183
15. LitiG
CarterDM
MosesAM
WarringerJ
PartsL
2009 Population genomics of domestic and wild yeasts. Nature 458 337 341
16. FoxeJP
DarVU
ZhengH
NordborgM
GautBS
2008 Selection on amino acid substitutions in Arabidopsis. Mol Biol Evol 25 1375 1383
17. Chimpanzee Sequencing and Analysis Consortium 2005 Initial sequence of the chimpanzee genome and comparison with the human genome. Nature 437 69 87
18. ZhangL
LiWH
2005 Human SNPs reveal no evidence of frequent positive selection. Mol Biol Evol 22 2504 2507
19. GojoboriJ
TangH
AkeyJM
WuCI
2007 Adaptive evolution in humans revealed by the negative correlation between the polymorphism and fixation phases of evolution. Proc Natl Acad Sci U S A 104 3907 3912
20. BoykoAR
WilliamsonSH
IndapAR
DegenhardtJD
HernandezRD
2008 Assessing the evolutionary impact of amino acid mutations in the human genome. PLoS Genet 4 e1000083 doi:10.1371/journal.pgen.1000083
21. CharlesworthJ
Eyre-WalkerA
2008 The McDonald-Kreitman test and slightly deleterious mutations. Mol Biol Evol 25 1007 1015
22. Eyre-WalkerA
KeightleyPD
2009 Estimating the rate of adaptive molecular evolution in the presence of slightly deleterious mutations and population size changes. Mol Biol Evol 26 2097 2108
23. TakahataN
1993 Allelic genealogy and human evolution. Mol Biol Evol 10 2 22
24. PatwaZ
WahlL
2008 The fixation probability of beneficial mutations. J R Soc Interface 5 1279 1289
25. DinW
AnandR
BoursotP
DarvicheD
DodB
1996 Origin and radiation of the house mouse: clues from nuclear genes. J Evol Biol 9 519 539
26. BainesJF
HarrB
2007 Reduced X-linked diversity in derived populations of house mice. Genetics 175 1911 1921
27. KeightleyPD
Eyre-WalkerA
2000 Deleterious mutations and the evolution of sex. Science 290 331 333
28. LivingstonRJ
von NiederhausernA
JeggaAG
CrawfordDC
CarlsonCS
2004 Pattern of sequence variation across 213 environmental response genes. Genome Res 14 1821 1831
29. TajimaF
1989 Statistical method for testing the neutral mutation hypothesis by DNA polymorphism. Genetics 123 585 595
30. GeraldesA
BassetP
GibsonB
SmithKL
HarrB
2008 Inferring the history of speciation in house mice from autosomal, X-linked, Y-linked and mitochondrial genes. Mol Ecol 17 5349 5363
31. SalcedoT
GeraldesA
NachmanMW
2007 Nucleotide variation in wild and inbred mice. Genetics 177 2277 2291
32. KeightleyPD
Eyre-WalkerA
2007 Joint inference of the distribution of fitness effects of deleterious mutations and population demography based on nucleotide polymorphism frequencies. Genetics 177 2251 2261
33. AkeyJM
EberleMA
RiederMJ
CarlsonCS
ShriverMD
2004 Population history and natural selection shape patterns of genetic variation in 132 genes. PLoS Biol 2 e286 doi:10.1371/journal.pbio.0020286
34. BegunDJ
HollowayAK
StevensK
HillierLW
PohYP
2007 Population genomics: whole-genome analysis of polymorphism and divergence in Drosophila simulans. PLoS Biol 5 e310 doi:10.1371/journal.pbio.0050310
35. AndolfattoP
2007 Hitchhiking effects of recurrent beneficial amino acid substitutions in the Drosophila melanogaster genome. Genome Res 12 1755 1762
36. PritchardJK
StephensM
DonnellyP
2000 Inference of population structure using multilocus genotype data. Genetics 155 945 959
37. BronsonFH
1979 The reproductive ecology of the house mouse. Q Rev Biol 54 265 299
38. WeirB
CockerhamCC
1984 Estimating F-statistics for the analysis of population structure. Evolution 38 1358 1370
39. CaswellJL
MallickS
RichterDJ
NeubauerJ
SchirmerC
2008 Analysis of chimpanzee history based on genome sequence alignments. PLoS Genet 4 e1000057 doi:10.1371/journal.pgen.1000057
40. YuN
Jensen-SeamanMI
ChemnickL
RyderO
LiWH
2004 Nucleotide diversity in gorillas. Genetics 166 1375 1383
41. HaygoodR
FedrigoO
HansonB
YokoyamaKD
WrayGA
2007 Promoter regions of many neural - and nutrition-related genes have experienced positive selection during human evolution. Nat Genet 39 1140 1144
42. Eyre-WalkerA
2002 Changing effective population size and the McDonald-Kreitman test. Genetics 162 2017 2024
43. BurgessR
YangZ
1994 Estimation of hominoid ancestral population sizes under bayesian coalescent models incorporating mutation rate variation and sequencing errors. Mol Biol Evol 25 1979 1994
44. Eyre-WalkerA
WoolfitM
PhelpsT
2006 The distribution of fitness effects of new deleterious amino acid mutations in humans. Genetics 173 891 900
45. RozenS
SkaletskyH
2000 Primer3 on the WWW for general users and for biologist programmers. Methods Mol Biol 132 365 386
46. AltschulSF
GishW
MillerW
MyersEW
LipmanDJ
1990 Basic local alignment search tool. J Mol Evol 215 403 410
47. BrayN
PachterL
2004 MAVID: Constrained ancestral alignment of multiple sequences. Genome Res 14 693 699
48. WattersonGA
1975 On the number of segregating sites in genetical models without recombination. Theor Popul Biol 7 256 276
49. TajimaF
1983 Evolutionary relationship of DNA sequences in finite populations. Genetics 105 437 460
50. KimuraM
1957 Some problems of stochastic processes in genetics. Ann Math Stat 28 882 901
51. BonhommeF
RivalsE
OrthA
GrantGR
JeffreysAJ
2007 Species-wide distribution of highly polymorphic minisatellite markers suggests past and present genetic exchanges among house mouse subspecies. Genome Biol 8 R80
52. NachmanMW
CrowellSL
2000 Estimate of the mutation rate per nucleotide in humans. Genetics 156 297 304
53. Haag-LiautardC
DorrisM
MasideX
MacaskillS
HalliganDL
2007 Direct estimation of per nucleotide and genomic deleterious mutation rates in Drosophila. Nature 445 82 85
Štítky
Genetika Reprodukční medicínaČlánek vyšel v časopise
PLOS Genetics
2010 Číslo 1
- Kazuistika – Perspektivy využití precizované medicíny v rámci personalizované specifické terapie onkologických pacientů
- Nobelova cena za chemii pro genetické nůžky: Objev, který změní naši budoucnost?
- Technologie na bázi RNA v klinické praxi: od přebarvených petúnií k terapii vzácných a dosud jen obtížně léčitelných chorob u lidí
- „Nepředstavovali jsme si, že náš výzkum povede přímo ke vzniku nových léků, dokonce ještě za našeho života“
- Bezplatné služby pro diagnostiku ATTRv amyloidózy pro kardiology
Nejčtenější v tomto čísle
- A Major Role of the RecFOR Pathway in DNA Double-Strand-Break Repair through ESDSA in
- Kidney Development in the Absence of and Requires
- The Werner Syndrome Protein Functions Upstream of ATR and ATM in Response to DNA Replication Inhibition and Double-Strand DNA Breaks
- Alternative Epigenetic Chromatin States of Polycomb Target Genes
Zvyšte si kvalifikaci online z pohodlí domova
Mazová zátka a její řešení
nový kurzVšechny kurzy