
The Human Blood Metabolome-Transcriptome Interface
Biological systems operate on multiple, intertwined organizational layers that can nowadays be accesses by high-throughput measurement methods, the so-called ‘omics’ technologies. A major aim in the field of systems biology is to understand the flow of biological information between the different layers at a systems level in both health and disease. To unravel the complex mechanisms underlying those molecular processes and to understand how the different functional levels interact with each other, an integrated analysis of multiple layers, i.e. a ‘multi-omics‘ approach is required. In our present study, we investigate the relationship between circulating metabolites in serum and whole-blood gene expression measured in the blood of individuals from a population-based cohort. To this end, we constructed a correlation network that displays which transcript and metabolite show the same trend of up - and down-regulation. We derived a functional characterization of the network by developing a novel computational analysis. The analysis revealed systematic signatures of signaling, transport and metabolic processes on both a regulatory and a pathway level. Moreover, integrating the network with associations to clinical markers such as HDL-cholesterol, LDL-cholesterol and TG identified coordinately activated pathways or modules which might help to assess the molecular machinery behind such an intermediate phenotype.
Published in the journal:
. PLoS Genet 11(6): e32767. doi:10.1371/journal.pgen.1005274
Category:
Research Article
doi:
https://doi.org/10.1371/journal.pgen.1005274
Summary
Biological systems operate on multiple, intertwined organizational layers that can nowadays be accesses by high-throughput measurement methods, the so-called ‘omics’ technologies. A major aim in the field of systems biology is to understand the flow of biological information between the different layers at a systems level in both health and disease. To unravel the complex mechanisms underlying those molecular processes and to understand how the different functional levels interact with each other, an integrated analysis of multiple layers, i.e. a ‘multi-omics‘ approach is required. In our present study, we investigate the relationship between circulating metabolites in serum and whole-blood gene expression measured in the blood of individuals from a population-based cohort. To this end, we constructed a correlation network that displays which transcript and metabolite show the same trend of up - and down-regulation. We derived a functional characterization of the network by developing a novel computational analysis. The analysis revealed systematic signatures of signaling, transport and metabolic processes on both a regulatory and a pathway level. Moreover, integrating the network with associations to clinical markers such as HDL-cholesterol, LDL-cholesterol and TG identified coordinately activated pathways or modules which might help to assess the molecular machinery behind such an intermediate phenotype.
Introduction
Blood is a connective tissue, which not only ensures nutrient and oxygen supply of all organs of the human body, but also the communication between them. Among the variety of key tasks performed by blood are immunological functions through white blood cells. Due to its diverse functionality, blood is heterogeneous and complex in its composition. Besides cellular constituents, which can be roughly divided into red and white blood cells, blood mainly consists of plasma. Plasma represents the aqueous phase containing proteins, peptides, signaling molecules and steroid hormones, but also other metabolites (e.g. carbohydrates, amino acids and lipids) which are consumed and released by the organs. This unique composition of blood, agglomerating both metabolic and transcriptional variation carrying molecular signatures of system-wide processes, together with its minimally invasive accessibility, makes blood a widely used system for integrative biomedical research [1,2].
With the development of high-throughput omics technologies for different levels of molecular organization, a systematic analysis of biological mechanisms underlying the functionality (or dysfunctionality) of a system became possible. In the case of transcriptomics data, an established framework to systematically investigate the constituents of involved biological processes and their interactions are network-based approaches, where pairwise associations between molecular entities (nodes) are modeled as network edges. Such studies commonly identify context-specific functional modules [3], but also global co-expression networks [4] from different organisms [5] and cell types [6]. When particularly focusing on the blood system, several studies investigated the co-regulation of transcripts either from single white blood cell types or whole blood samples. For example, regulatory networks [7,8] or global gene co-expression networks [9–11] were constructed from B - and T-cells to investigate pathways and mechanisms involved in the immune response. Further examples using whole blood data include the identification of disease related gene networks [12,13] or molecular signatures of distinct human vaccines captured in blood transcriptional modules [14].
Similarly, for metabolomics data a variety of studies extensively analyzed interactions between metabolites in various tissues, conditions and species [15–17]. Regarding blood measurements, we and others recently systematically characterized molecular interactions in the blood metabolome [18–21]. Utilizing Gaussian graphical models and serum metabolomics data from more than 1000 participants of a population cohort we were able to show that correlations between circulating blood metabolites resemble known metabolic pathways [22]. Furthermore, we have shown that these data-derived metabolic networks can be useful in a variety of applications, e.g. for the functional annotation of unknown metabolites [23] or to identify sex-specific serum metabolome differences [24].
The integration of multiple omics measurements (e.g. gene expression levels and metabolite concentrations) is an area of active research with many successful applications investigating the interplay between multiple organizational layers of a biological system [25–28]. However, only few studies with large sample sizes focused on a combined analysis in human blood. One recent example is the work of Inouye et al, who analyzed whole blood transcriptomics data in combination with blood lipid measurements and metabolites from a Finnish population cohort [29]. In their study, the authors associated a module of highly co-expressed genes with 134 blood metabolic markers in the context of heart disorders and identified a link between the immune system and circulating metabolites. The study by Inouye et al was among the first to provide clear evidence for this immune system link in blood, suggesting that gene expression in white blood cells is responsive to changing blood metabolite levels. Thus, it can be concluded that even if not cell-specific, the signals derived from whole blood data still reflect organism-wide processes. This is also in line with previous studies conducted on whole blood transcriptomics or metabolomics data separately [1,30,31].
The aim of the present study was to make use of the joint power of metabolomic and transcriptomic profiling to comprehensively characterize the complex interplay between serum metabolomics and whole-blood transcriptomics data. While serum metabolomics represent a footprint of whole-body processes, blood transcriptomics data will mainly reflect immune system processes through white blood cells. To this end, we analyzed metabolomics and transcriptomics measurements of 712 individuals from the German population study KORA (“Kooperative Gesundheitsforschung in der Region Augsburg”), comprising 440 metabolites and 16,780 genes after filtering. We constructed a global correlation network to elucidate the complex interplay and regulation between these omics layers (Fig 1A). The correlation analysis takes advantage of the naturally occurring variation from individual to individual, which we assume to carry a systematic footprint of the coregulation of metabolites and mRNAs. Such an integrative approach was recently termed “systems genetics”, providing a global view on the information flow between the various biological scales [32]. We deliberately left out an analysis of metabolite-metabolite and transcript-transcript correlations, which were rigorously investigated in the above-mentioned earlier studies. Instead, we specifically sought to assess the interconnection and information flow between the two omics layers.
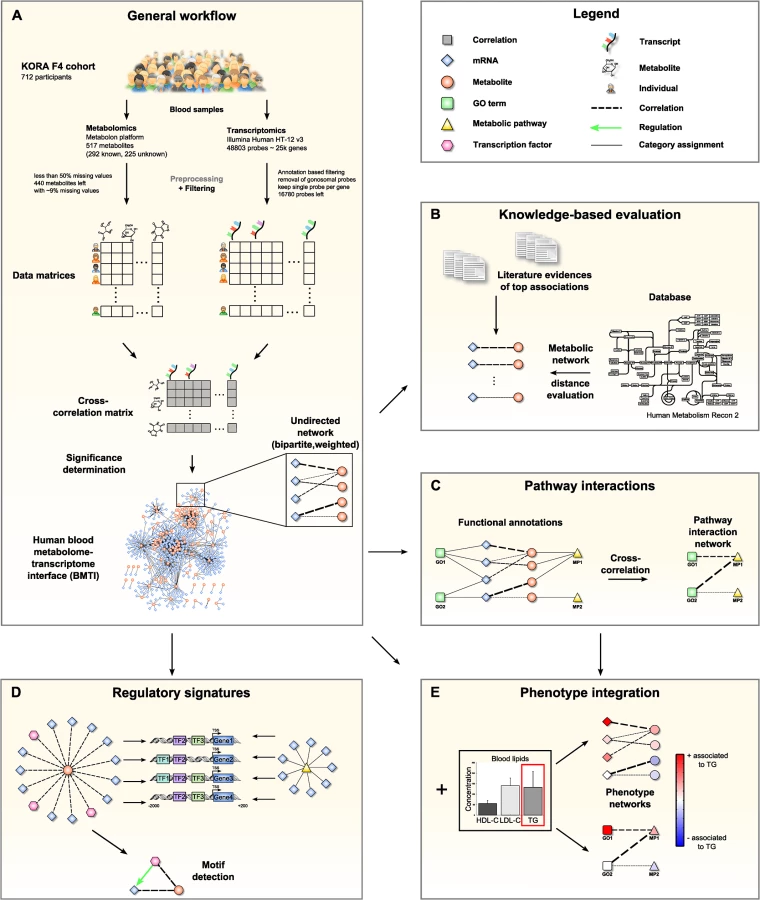
The manuscript is organized as follows: In the first part, we systematically characterize the blood metabolome-transcriptome interface (BMTI) using different strategies. First, we manually investigated the strongest associations and provide evidence from literature wherever possible. Moreover, using a Mendelian randomization (MR) approach, we examined potential causal relationships between metabolites and transcripts. Second, using the most recent genome-wide human metabolic network Recon 2 [33], we systematically analyzed correlations between metabolites and transcripts at a pathway level (Fig 1B). Third, we developed a novel network clustering approach based on functional annotations, leading to a pathway interaction network (PIN) that allows for fast functional interpretation of the BMTI and furthermore provides insights into the cross-talk among distinct molecular pathways (Fig 1C). In the second part of this manuscript, we demonstrate how the identified networks can be used as a resource to further investigate the link between metabolism and gene regulation by two different applications. First, we investigated whether a common regulatory signature is observable from transcripts connected to the same metabolite or to metabolites that are part of the same metabolic pathways. For this purpose, we analyzed promoter regions of the genes for overrepresented transcription factor binding sites (Fig 1D). Second, we integrated the metabolome-transcriptome and the pathway interaction network with associations to high density lipoprotein cholesterol (HDL-C), low density lipoprotein cholesterol (LDL-C) and triglycerides (TG), which are well-known risk factors for cardiovascular disease [34]. To this end, we mapped the results of linear regressions between these clinical lipid parameters with metabolites and mRNAs onto the networks (Fig 1E). Finally, we demonstrate the potential of our systems genetics approach to generate novel hypothesis by combining results from all separate analysis steps and establish an association between the branched-chain amino acid pathway and the levels of plasma TG and HDL-C.
All network results are available to the scientific community as interactive versions in graphml and Cytoscape format (S1 Dataset).
Results
The human blood metabolome-transcriptome interface
For this study, we focused on a subset from the KORA F4 cohort with simultaneously available metabolomics and transcriptomics data. After quality control and filtering, the data set comprised of 712 human blood samples (354 males, 358 females) with gene expression data of 16,780 uniquely mapping gene probes and metabolite concentrations of 440 metabolites (Fig 1A, see Materials and Methods for details). 186 of these 440 metabolites were not chemically identified, which is marked by a metabolite name starting with “X-”throughout this manuscript. Both gene expressions and metabolite concentrations were log transformed and adjusted for age and sex effects. Pairwise Spearman’s rank correlations between the measured mRNAs and metabolites were then calculated. We used this correlation method to account for possible non-linear associations and to ensure robustness against outliers. Note that for this particular dataset, Spearman and Pearson correlations produced almost identical results (S1 Fig). S1 Table provides a full list of identified significant associations between blood metabolites and transcripts.
Metabolite-mRNA Spearman correlation coefficients were symmetrically distributed around zero (mean:−4.5 × 10⁻⁴ ± 0.0433, Fig 2A) with a maximum absolute correlation value of ρ = 0.56. Moreover, the distribution of inter-omics correlations showed a rather narrow shape, indicating generally lower correlations when compared to the intra-omics correlations (mRNA-mRNA, metabolite-metabolite). The metabolite-metabolite distribution was strongly skewed for positive correlation values, which is in accordance with our previous findings on a different metabolomics panel [22]. In contrast, the mRNA-mRNA distribution displayed a broad and symmetric distribution of correlation values (Fig 2A).

We then generated a weighted bipartite network of metabolites and transcripts by constructing an edge between a pair of metabolite and transcript if the respective correlation was significant with a false discovery rate (FDR) of 0.01. This corresponded to an absolute correlation cutoff of ~0.181 and a p-value threshold at 1.07 × 10⁻⁶. Obviously, the number of edges in a correlation network heavily depends on the chosen threshold. It has been shown in previous studies that a biologically reasonable threshold can be found by investigating network density as a function of the correlation cutoff value [35]. According to that study, a cutoff value slightly above the minimal density combined with a decreasing number of nodes and edges leads to biologically meaningful results. As indicated in Fig 2B, a clear decline in the number of included nodes and edges can be observed for increasing correlation threshold levels beginning between correlation values of 0.15 and 0.25. Minimal network density was reached for a correlation threshold value between 0.13 and 0.18 (S2 Fig). Notably, applying the above-mentioned conventional statistical significance threshold to our data set precisely coincides with the network density-based threshold described by [35].
The resulting network, subsequently called the blood metabolome-transcriptome interface (BMTI), consisted of 636 nodes (114 metabolites, 522 transcripts) and 1109 edges, corresponding to a total network connectivity of ~0.015% (Fig 2B and 2D). Out of the total number of edges, 63% (699) were positive correlations and 37% (410) were negative correlations. The metabolite showing the highest degree was mannose, with significant correlations to 98 different transcripts. In contrast, the mRNA with the highest connectivity was SLC25A20 with 37 metabolites attached (S1 Table).
We used data from the DILGOM study, which included NMR metabolomics as well as transcriptomics data for 518 individuals, for independent replication of our correlations. In total, 17 metabolites (11 amino acids, 3 lipids, 2 carbohydrates and 1 belonging to the energy metabolism) overlapped between the KORA F4 dataset and the DILGOM study, which allowed us to investigate the replication of 211 edges (~19% of the BMTI). 61 out of the 211 edges (~29%) reached a nominal significance (p-value < 0.05) in the DILGOM study of which 38 (~18%) remained significant after multiple testing correction (FDR < 0.05, see S2 Table).
To investigate the possible origins of the metabolite-transcript correlations, we compared all genes represented in the BMTI with 1) two a priori defined blood cell type-specific marker gene lists, and 2) a database of more general tissue gene expression signatures (see Materials and Methods). For the first part, we used a list of genes derived from Palmer et al. [36] comprising 907 specifically expressed genes for 5 different blood cell types (leukocytes only) and a second list derived from the HaemAtlas as generated by Watkins et al. [37] comprising 1,716 genes characterizing 9 different blood cell types. For the second part, we used the HECS database from Shoemaker et al. [38] containing information for more than 6,000 genes and 84 tissues. Both comparisons in 1) showed that most of the BMTI genes (85% and 67%, respectively) were not specifically attributable to any blood cell type (see Fig 2C and S3 Table). The remaining genes could be assigned to the respective measured cell types, with granulocytes making up the largest blood cell faction in both cases (8% and 20%, respectively) and only minor signals for the other blood cell types. A similar result was observed when comparing the BMTI genes to the HECS database. 52% of the BMTI genes showed no tissue specificity, while 12 out of the 15 strongest tissue signatures where either blood cells or blood related tissues (S3 Table).
Strong network edges in the BMTI represent known pathway mechanisms
As a first step to characterizing the BMTI, we performed a manual literature lookup for the strongest absolute correlations in the network (Fig 1B). In the following, we provide a detailed discussion of the 25 strongest edges (Table 1). Notably, most of the top 25 identified associations reflect biochemically reasonable interactions like transport processes of lipids, but also regulatory signatures between signaling metabolites and transcription factors.

The strongest association in the dataset was observed between cortisol and DNA-Damage-Inducible Transcript 4 (DDIT4, ρ = 0.55, p-value = 7.70 × 10−59), which are known to play a role in stress response [39]. Cortisol is a glucocorticoid whose release is mainly induced by exogenous stress. Via binding to the glucocorticoid nuclear receptor (GR, official gene symbol NR3C1), it regulates various cellular processes like carbohydrate metabolism and the immune system by direct activation of target genes [40]. Remarkably, DDIT4 was identified as a GR target gene in mouse hepatocytes [41], rat hippocampus [42] and also in human peripheral blood lymphocytes [43] delivering a potential explanation of an indirect association for the observed correlation. Another GR target gene associated to cortisol is Suppressor Of Cytokine Signaling 1 (SOCS1, ρ = 0.36, p-value = 2.19 × 10⁻²³), a major constituent of the cytokine signaling pathway and inflammatory response [44]. We observed further top 25 correlations involving cortisol for Kruppel-Like Factor 9 (KLF9) and Dual Specificity Phosphatase 1 (DUSP1) (ρ = 0.34, p-value = 5.20 × 10⁻²¹; ρ = 0.34, p-value = 7.58 × 10⁻²¹, respectively). KLF9 is a ubiquitously expressed transcription factor involved in the regulation of diverse biological processes like cell development and differentiation in adipogenesis [45]. DUSP1 is an enzyme involved in the response to environmental stress [46]. Interestingly, for both transcripts, a cortisol-dependent regulation was already observed in epidermal cells [47] and peripheral blood mononuclear cells [48].
Another metabolite showing several strong associations to blood transcripts was 1-monoolein, which belongs to the class of monoacylgylcerols. This particular class of metabolites are bioactive compounds recently identified to be involved in various signaling processes of the immune system [49,50]. The source of 1-monolein in humans is not fully understood. Experiments in rodents suggest that dietary 1,3-diacylglycerols are preferentially digested to 1-monoacylglycerols and free fatty acid in the small intestine, making dietary 1,3-diacylglycerols containing an oleoyl moiety at position sn-1 or sn-3 a plausible source of 1-monoolein [51]. In our analysis, 1-monoolein showed a strong negative correlation to four transcripts – GATA Binding Protein 2 (GATA2), Histidine Decarboxylase (HDC), Solute Carrier Family 45, Member 3 (SLC45A3) and Chromosome 1 Open Reading Frame 186 (C1ORF186) (ρ between -0.41 and -0.32, p-values between 2.01 × 10⁻²⁹ and 4.72 × 10⁻¹⁸). HDC is a cytosolic enzyme that catalyzes the conversion of histidine to histamine and thus represents an important immune system trigger molecule [52]. In addition, GATA2, a key regulator of gene expression in hematopoietic cells [53], C1ORF186 and SLC45A3, two membrane-bound proteins, were all identified to play a role in the immune response [13].
Carnitine-acylcarnitine translocase (SLC25A20) occurred in 15 of the 25 top ranked correlations. This gene encodes an enzyme which transports acylcarnitines, i.e. the transport variant of fatty acids, into the mitochondria for subsequent ß-oxidation. Interestingly, the majority of SLC25A20-associated metabolites among our top 25 correlations belonged to the class of long chain fatty acids (11 long chain fatty acids, 2 essential fatty acids, 1 medium chain fatty acid, 1 ketone body), which is in accordance with its function as a lipid transporter. Of note, among the metabolites associated with SLC25A20 beyond the top 25 correlations were also 5 acylcarnitines, although at lower correlation values.
We observed a significant, negative correlation between isoleucine and ATP-Binding Cassette Sub-Family G Member 1 (ABCG1, ρ = −0.32, p-value = 3.39 × 10⁻¹⁸). It has been shown previously that circulating levels of branched-chain amino acids (BCAAs) affect a variety of metabolic processes such as glucose and lipid metabolism [54]. ABCG1 is a major player of lipid metabolism, controlling the transfer of cholesterol from peripheral macrophages to exogenous HDL [55]. Interestingly, an association between circulating BCAA levels and plasma HDL-C levels was also observed in a recent population study [56] and in a previous paper on the same population cohort used in the present study [57].
Causal analysis of BMTI edges
To assess whether metabolite-transcript links in BMTI contain causal effects, we performed a Mendelian randomization analysis [58]. For each metabolite-mRNA edge, we tested both the causal directions metabolite→mRNA and mRNA→metabolite given that adequate instrumental variables were available. As instruments we used SNP lists from previously published GWAS studies. After filtering for strong instrumental variables, we were left with 15 SNPs identified by a metabolomics GWAS study [23] associated to 16 metabolites in the BMTI. Moreover, for 157 mRNAs in the network, we selected 192 SNPs from [59]. In total, we tested the causal relationship of 440 BMTI edges (~40%) of which 60 could be tested bi-directional. In the BMTI, 42 metabolite-mRNA pairs (19 mRNA→metabolite; 23 metabolite→mRNA) showed a nominally significant (p-value < 0.05) causal effect. At an FDR of 0.05, none of the tested pairs remained significant (S4 Table).
Model-based evaluation reveals systematic signatures of metabolic reactions
In order to further reveal the underlying mechanisms determining the observed associations, we systematically analyzed whether correlating pairs of metabolites and transcripts (i.e. enzymes) correspond to the structure of the underlying metabolic network. Specifically, we investigated if strong metabolite-transcript edges of the BMTI tend to be in close proximity within biochemical pathways. All pairwise associations between metabolites and transcripts were mapped to their corresponding network nodes in the Human Recon 2 metabolic network reconstruction [33]. As a measure for metabolic network proximity, the length of the shortest path connecting each metabolite-enzyme pair was determined (Fig 3A). This measure is based on the common assumption that the shortest connection between two network entities corresponds to the biologically reasonable one [22,60]. To avoid potential biologically meaningless shortcuts, we removed co-factors and currency metabolites prior to the analysis (see Methods section for details and S5 Table for a list of removed metabolites).

We could map 121 metabolites and 1,467 enzymes out of the 254 metabolites with known identity and 16,780 transcripts onto the metabolic network, respectively. While most pairwise correlation coefficients were closely distributed around zero for all investigated network distances, a distinct pattern was observable for statistically significant correlations. The majority of significantly correlating pairs accumulated at short distances and was dominated by positive correlations (Fig 3B). To determine the significance of this observation, one-tailed Fisher’s exact tests were performed by either considering each distance individually or by aggregating all pairs up to a particular distance. The latter aggregation analysis combines all transcript-metabolite pairs which are reachable up to a certain number of steps (biochemical reactions) in the metabolic network. For both cases, we observed a substantial overrepresentation of significantly correlating pairs at short distances (Fig 3C). The strongest signals are observed for pairs that take part either directly in the same reaction (d = 0) or for those which are just one reaction apart (d = 1). For the cumulative distances we also observed significant enrichment up to a distance of d = 2 reactions. Proportions of significant and non-significant pairs per distance are given in S3 Fig and a detailed view on an exemplary path of length 2 is depicted in S4 Fig
To further characterize the underlying biochemical pathways, we calculated frequencies of functional annotations from Recon 2 among the significant associations for pathway distances 0 to 2 (Fig 3D and S5 Fig). At a distance of 0, we identified mainly transport reactions (67%) accompanied by reactions belonging to lipid metabolism (bile acid synthesis 11%, fatty acid oxidation 11%) and carbohydrate metabolism (pyruvate metabolism 11%). The transport reactions can be further subdivided into extracellular transport (45%), or mitochondrial transport (11%) and peroxisomal transport (11%). Similar signals can be found at distances of 1 and 2, where we additionally identified reactions belonging to energy metabolism (oxidative phosphorylation 27%) and amino acid metabolism (histidine metabolism 11%, glutamate metabolism 4%).
Taken together, the BMTI captured a systematic signal of metabolite-enzyme associations to be in close proximity when mapped onto a global metabolic network. Moreover, the strongest signals found for pathway distances of 0, 1 or 2 reflect distinct metabolic reactions mainly belonging to lipid, energy and amino acid metabolism, and transport mechanisms.
Functional annotation-based aggregation of the BMTI reveals cross-talk between pathways
Up to this point, our analysis was a reaction-centered approach limited to single edges only, thereby neglecting the global network structure and cross-talk between pathways captured in the BMTI. To derive a comprehensive functional description of the biological modules included in the BMTI, we developed a novel approach based on functional annotations which provides an integrated view on cellular processes. Briefly, the approach consists of three steps: First, we used pathway annotations to define groups of functionally related metabolites and transcripts. For metabolites, we used metabolic pathway annotations provided with the metabolomics dataset, and for transcripts we downloaded the Gene Ontology (GO) slim annotations. Second, an aggregated z-score (aggZ-score) was calculated for each functional category. Third, we calculated correlations between aggZ-scores of all functional categories. A schematic overview of this multi-step approach is provided in S6 Fig and described in more detail in the Material and Methods. A full list of the resulting categorical correlations can be found in S6 Table.
We again constructed a network (the pathway interaction network, PIN) by drawing edges between significantly correlated categories. Interestingly, even when applying a stringent Bonferroni-corrected threshold (α = 0.01, p-value ≤ 2.2 × 10⁻⁶) this resulted in an overly dense connected network of 166 nodes and 1220 edges. To generate a visually interpretable version of this network, an ad-hoc stringent threshold of p-value ≤ 1.0 × 10⁻¹¹ was applied to draw the network. This resulted in a PIN consisting of 113 nodes (93 GO terms, 20 metabolic pathways) connected by 244 edges (196 positive correlations, 48 negative; Fig 4A). Remarkably, we observed a high conformity between linked metabolic pathways and gene annotations. For example, the metabolic pathway “carnitine metabolism” was connected to the biological processes “lipid metabolic process” and “transmembrane transport”. Moreover, it was linked to the cellular component “mitochondrion”, indicating transport processes of fatty acids into the mitochondrion for subsequent ß-oxidation. Further biologically reasonable pairs were “Valine, Leucine and Isoleucine metabolism” and “Glutamate metabolism” attached to “cellular nitrogen compound metabolic process”. As a last example, “Steroid/Sterol” was connected to “response to stress” and “signal transducer activity”, pointing to an interaction between hormones and regulation of gene expression. In the following, we examine two selected category-category relationships in detail, including the individual metabolites and gene transcripts that gave rise to the association.

Scenario one: Fatty acid metabolism
The first scenario contained the metabolic pathway “long chain fatty acid” and the gene ontology annotation “lipid metabolic process” (Fig 4B). The subnetwork that induced this association consisted of 22 individual constituents (7 mRNAs, 15 metabolites) connected by 38 edges. Notably, this subnetwork coincides well with the above-mentioned fatty acid carnitine-shuttle, i.e. the transport of long chain fatty acids into the mitochondrion for subsequent degradation. Within this subnetwork, 8 long chain fatty acids were jointly associated to CPT1A and SLC25A20, while 7 additional fatty acids were associated to SLC25A20 alone. Moreover, acyl-CoA dehydrogenase very long-chain (ACADVL) and Perilipin 2 (PLIN2), both involved in ß-oxidation and long chain fatty acid transport, were associated to 5 and 7 out of the 15 long chain fatty acids, respectively. Three further transcripts, Tumor Necrosis Factor Receptor Superfamily, Member 21 (TNFRSF21), Aldo-Keto Reductase Family 1, Member C3 (AKR1C3) and 1-Acylglycerol-3-Phosphate O-Acyltransferase 4 (AGPAT4) were correlated with 5,8-tetradecadienoate, a side product of oleate ß-oxidation. While AKR1C3 and AGPAT4 are enzymes mainly related to arachidonic acid metabolism and phospholipid metabolism, potentially indicating a branching point to other pathways of the lipid metabolism, TNFRSF21 is involved in T-cell activation and immune regulation [61].
Scenario two: Monoacylglycerols and immune-related transcripts
Since whole blood transcriptomics measurements should mainly reflect the immune system, we have chosen the association between the metabolic class of “monoacylglycerols” and the GO-term “immune system process” as a second scenario (Fig 4C). The corresponding subnetwork contained 11 nodes (3 metabolites, 8 transcripts) and 14 edges (2 positive, 12 negative). The monoacylglycerols included 1-oleoylglycerol, 1-linoleoylglycerol and 1-palmitoylglycerol, which only differ in the attached fatty acid residues. It has been shown that monoacylglycerols are not merely intermediate lipid substances, but may also act as signaling molecules. For example, 2-arachidonoylglycerol is a known ligand of cannabinoid receptors, which are involved in the regulation of several biological processes including inhibition of pro-inflammatory and other immune system related processes [62,63]. Among the genes summarized by the term “immune system process”, GATA2, Endothelial PAS Domain Protein 1 (EPAS1) and Notch1 are key regulators of hematopoiesis and as such are involved in the differentiation process of immune cells [53,64,65]. Moreover, EPAS1 and thioredoxin (TXN) are associated to the response to oxidative stress [64], whereas Membrane-Spanning 4-Domains, Subfamily A, Member 2 (MS4A2) and Ectonucleotide Pyrophosphatase/Phosphodiesterase 3 (ENPP3) are involved in allergic responses mediated via the IgE receptor [66]. The two remaining genes, SEC61G and PRSS8, are involved in the immune processes of antigen presentation and inflammation [67].
Regulatory signatures captured by the integrated network
The BMTI contains a prominent “flower-like” network topology, i.e. many transcripts associated to a single metabolite. We therefore asked whether these coordinated changes around a metabolite and also the network topology can be explained by common transcriptional regulatory processes through transcription factors (TFs, Fig 1D). For the following analysis, we only considered metabolites linked to at least 3 transcripts. We analyzed the promoter regions of all connected genes for an enrichment of known transcription factor binding sites (TFBS) derived from the Jaspar database [68]. This resulted in significantly enriched transcription factor binding motifs for 46 single metabolites, 24 subpathways and 7 superpathways. The Methods section provides a detailed explanation of the process. A summary of all enriched TFBS can be found in S7 Table.
In total, out of the 205 binding motif matrices used in the analysis, 189 reached a significant enrichment in at least one of the metabolite-derived gene sets, indicating a generally prevalent common regulation. Across all lists of enriched TFBS identified from our network, the motifs that occurred most frequently were Sterol Regulatory Element Binding Transcription Factor 2 (SREBF2), Peroxisome Proliferator-Activated Receptor Gamma (PPARG; Jaspar motifs PPARG and PPARG::RXRA) and Nuclear Factor, Interleukin 3 Regulated (NFIL3). SREBF2 is a major regulator of cholesterol metabolism [69] while PPARG is known to be activated by fatty acid ligands, thereby regulating fatty acid ß-oxidation and other processes [70]. NFIL3 is a regulator specifically found in activated T cells, natural killer (NK) cells, and mast cells, involved in the regulation of the immune response and the circadian rhythm [71].
Branched-chain amino acids were among the metabolites most strongly connected to SREBF2 targets. Specifically, the transcripts correlating with isoleucine and valine show high enrichment of SREBF2 binding sites (p-value = 5.83 × 10⁻⁸ and p-value = 2.36 × 10⁻¹⁰, respectively; S7 Table). Moreover, considering all 172 genes associated to at least one metabolite from the entire branched-chain amino acid pathway (“Valine, leucine and isoleucine metabolism”) yielded significantly enriched binding sites for SREBF1 and SREBF2 (p-values 6.78 × 10⁻¹⁰ and 9.11 × 10⁻¹⁰, respectively; S7 Table). Both SREBs are important regulators in lipid homeostasis, including cholesterol and fatty acid biosynthesis, further indicating a regulatory cross-link between HDL-C, TG and BCAA metabolism.
The highly interlinked network topologies of both the blood metabolome-transcriptome interface and the pathway interaction network suggest a strong coregulation between the different metabolites, processes, and pathways. As a second step of coregulation analysis, we inferred the number of pairwise shared significant TFBS to determine the extent of coregulation between single metabolites and metabolic pathways (S8 Table). At the single metabolite level, we found a maximum number of 27 shared TFs between histidine and X-03094 (S7 Fig). Moreover, this highly connected unknown metabolite shared 14 TFs with another unknown metabolite (X-12442) and with a peptide (HWESASXX). For the metabolic subpathways, we observed an overlap between “histidine metabolism” and the group of “long chain fatty acids” and between “glycolysis, gluconeogenesis, and pyruvate metabolism” and the group of “fibrinogen cleavage peptides” (11 shared TFs each; Fig 5A). On the level of superpathways, the highest number of shared TFBS was 4, identified between “carbohydrate” and “peptide metabolism” (S8 Fig). Overall, we found that TF binding sites are shared to a large extent, indicating a complex coregulation not only within but also between different processes and pathways.

To gain further insight into this coregulation, we determined transcription factors which also occur as transcripts in the BMTI. 165 out of the 189 transcription factors with available binding motif were contained in the filtered data set. Only 12 of these transcription factors displayed a significant correlation to any metabolite and are thus included in the BMTI. This observation is not completely unexpected given that TFs are regulated to a large extend at a post-transcriptional level [72]. Interestingly, for two out of these 12 TFs, we also observe enriched binding sites in the promoter region of the other genes connected to the same metabolite, i.e. a “triad” network motif consisting of a metabolite, a transcription factor and its target genes (Fig 1D, S7 Table).
The first transcription factor is B-cell CLL/Lymphoma 6 (BCL6), a transcriptional repressor involved in the STAT-dependent interleukin 4 response of B-cells [73]. BCL6 is negatively correlated with methionine and tyrosine in our network (Fig 5B). The TFBS enrichment analysis using all 15 genes connected to methionine within the BMTI resulted in a significant overrepresentation of the BCL6 binding motif (p-value = 5.71 × 10−09, 82% of the 15 promoter sequences contained at least one occurrence of the motif), while no significant enrichment was observable for the genes connected to tyrosine. The second motif was identified around Nuclear Receptor Subfamily 4, Group A, Member 2 (NR4A2), which was associated to 7 metabolites in our network. The 22 neighboring genes of one of those metabolites, kynurenine, showed significantly enriched binding sites for this transcription factor (p-value = 3.79 × 10−09, 73% of the 22 promoter sequences contained at least one occurrence of the motif; see Fig 5C and S7 Table).
Integration of clinical phenotypes identifies active modules
As a final analysis step, we sought to use the BMTI and the PIN to infer novel insights into the molecular mechanisms and pathways underlying complex traits. To this end, we associated the nodes of both networks with intermediate clinical phenotypes (Fig 1E, Table 2). As already stated earlier, we chose the levels of HDL-C and LDL-C, as well as concentrations of blood triglycerides (TG), known risk factors for a variety of diseases. We performed multiple linear regression analyses with HDL-C, LDL-C and TG blood parameters as response variables and all 440 metabolites and 16,780 transcripts as explanatory variables. All models were corrected for sex and age. Statistical significance was defined by a Bonferroni adjusted p-value cutoff at 2.9 × 10⁻⁶ (α = 0.05). We then projected the −log10 transformed p-values from this regression as colors onto the corresponding nodes in the two networks. Similarly, the analysis was performed using aggZ-scores of pathways / GO terms as explanatory variables and mapped to the PIN (Fig 6 and S1 Dataset). Note that we presented similar approaches in the past for metabolomics-only networks [24,74].


In total, regression analyses yielded 233 (54 metabolites, 179 mRNAs), 28 (28 metabolites, 0 mRNAs) and 1,124 (49 metabolites, 1,075 mRNAs) statistically significant associations for HDL-C, LDL-C and TG, respectively. Of those associations, 64%, 28% and 25%, were contained in the BMTI, respectively (see S9 Table for a complete list of associations). We only observed few LDL-C metabolite associations, which can be mainly summarized in the “Glycerolipid metabolism” and “Carnitine metabolism”, while none were observable for the transcripts (Fig 6E and 6F, S9 Table). We will therefore focus on network associations for HDL-C and TG in the following.
Examination of the networks for HDL-C and TG revealed localized regions of similar associations, which reflect potentially co-regulated modules (Fig 6A and 6C). Interestingly, when compared to each other, there appeared to be an antagonistic pattern of associations for HDL-C and TG, which is in accordance with an overall negative correlation of the two traits (ρ = −0.53). This opposing pattern also holds for the categorical networks (Fig 6A–6D and S10 Table). To confirm this observation statistically, we utilized an approach to compare the different networks suggested by Floegel et al. [74]. Basically, we calculated the Spearman correlation of the association measures between the different clinical traits. This resulted in a strong negative correlation between the BMTI-HDL-C and the BMTI-TG network (ρ = −0.84) which was even more pronounced between the PIN-HDL-C and PIN-TG networks (ρ = −0.94, S9 and S10 Figs). A similar pattern of opposing associations between HDL-C and TG phenotypic traits was already described in previous studies, which suggested a pleiotropic, heritable relation between the two lipid and lipoprotein measures, potentially regulated by a common, complementary mechanism [13,75].
In the following, we will discuss exemplary pathway mechanisms identified in the phenotype networks. ABCG1 and ABCA1, known constituents of the reverse cholesterol transport necessary for the proper formation of plasma HDL-C [55], were positively correlated with HDL-C (p-value = 4.37 × 10⁻¹² and p-value = 2.92 × 10⁻⁸, respectively). At the pathway level, processes like “generation of precursor metabolites and energy” or “catabolic process” are negatively associated with HDL-C, while “nucleic acid binding transcription factor activity” and “signal transducer activity” are positively associated (Fig 6D). An inverse pattern can be seen for TG, where positive associations predominate and processes like “generation of precursor metabolites and energy” or “catabolic process” are strongly positively associated (Fig 6A and 6B).
Given the known association between HDL/TGs and branched-chain amino acids [57,76], we investigated the phenotypic networks to further examine this metabolic class. First, we examined the edge between isoleucine and ABCG1 within the BMTI-HDL-C network. As already mentioned, ABCG1 was strongly positively associated to HDL-C levels, while we found that isoleucine was significantly negatively associated to the concentration of HDL-C (β = −4.30, p-value = 5.80 × 10⁻¹⁹). Moreover, gamma-glutamyl variants of BCAAs belonging to “gamma-glutamyl metabolism” (β = −4.84, p-value = 3.15 × 10⁻¹⁴) and “Valine, leucine and isoleucine metabolism” (β = −4.66, p-value = 9.17 × 10⁻¹¹) displayed profound negative associations to HDL-C (Fig 6D and S10 Table), further validating a connection between HDL-C and BCAA metabolism. For triglycerides, we observed an inverse relationship with BCAAs and BCAA-related pathways (Fig 6B, S9 and S10 Tables).
Discussion
We constructed a global network model across two levels of biological information by integrating cross-sectional omics data from a large-scale population cohort. The dataset was based on circulating metabolites from plasma and transcriptional variation derived from whole blood. This analysis exploited the naturally-occurring variation caused by genetic variation, environmental and behavioral influences from a natural population over multiple layers of organization. Such an approach was recently referred to as ‘systems genetics’, enabling the systematic exploration of information flow between the different biological scales [32].
As mentioned in the introduction, blood is a heterogeneous tissue containing a series of distinct cell-types. In this study, we utilized whole blood transcriptomics data from unsorted cells, leading to a complex mixture of transcriptional signals in the transcriptome dataset [36]. Similarly, the levels of circulating metabolites are strongly influenced by metabolically active organs [31], but also by metabolites from blood cells and those taken up from the environment. The comparison to known cell-type specific markers further suggested that a substantial amount of the signals are derived from specific blood cells. However, the analysis also showed that the majority of the BMTI contained transcripts are not assigned to any cell-type. Thus, we assume that the metabolite-mRNA associations captured in the BMTI mainly reflect cell-type unspecific processes involved in the fundamental maintenance of cellular function, besides some processes specifically related to immune functions.
Independent replication of the BMTI edges was investigated using data from the DILGOM study. Out of 211 possible associations, we were able to replicate 29% at a nominal significance and 18% after multiple testing correction (FDR<0.05). This relatively low number of replicated associations might have various reasons. For example, 1) The DILGOM study used an NMR-based metabolomics platform in contrast to the mass spectrometry-based methodology used in KORA. 2) The smaller sample size of the DILGOM study might limit the power to detect existing associations between metabolites and transcripts. 3) Differences in laboratory procedures and protocols or the population structure can affect replication across cohorts. Future high-powered studies with more similar measurement platforms can further address the stability of metabolite-transcript correlations across studies.
A comprehensive analysis of the strongest associations between transcripts and metabolites clearly revealed biologically reasonable relationships, such as signaling and transport mechanisms. Many identified associations, e.g. between cortisol and DDIT4 or between SLC25A20 and multiple long chain fatty acids, were in consent with known signaling or metabolic pathways. Others support and extend results from previous studies. As one example, nearly all transcripts included in the lipid-leukocyte (LL) module identified by Inouye et al [29] were among the top scoring association pairs. For instance, we were able to confirm associations between CP3A, FCER1A, GATA2, HDC, MS4A2, and SLC45A3, core genes of the LL module, and leucine, isoleucine, and several lipids (see S1 Table). In addition, we found associations which, to the best of our knowledge, have not been described before. These include associations between 1-monoolein and GATA2, a key regulator of hematopoiesis, or SLC45A3, a known diagnostic marker for prostate cancer [77]. The identified associations extend the current knowledge about the connection between system-wide metabolism and immunity-related pathways.
Causal inference of the metabolite-mRNA associations using Mendelian randomization yielded no statistically significant results. There are various possible reasons for this negative outcome. First, there might be no causal effect in either direction between the investigated transcripts and metabolites. Besides that, the lack of significant findings could also be caused by the limitations of Mendelian randomization. For instance, MR is known to require large numbers of samples to detect true causal relationships, and the power in our study (n = 712) might have been too low [58]. We therefore decided to leave a more detailed discussion and analysis of causal effects to future, high-powered studies.
Comparison of the blood metabolome-transcriptome interface with the most recent human genome-scale metabolic reconstruction [33] allowed to assess whether transcript-metabolite correlations also recapitulate known biochemical reactions at a systematic level. We were able to show that strong associations between enzymes (represented by their respective transcripts) and metabolites are significantly accumulated at shorter pathway distances (Fig 3B and 3C), which is consistent with previous studies [60,78,79]. Further functional characterization identified transport, energy, lipid and amino acid subsystems to be predominately present at short pathway distances (Fig 3D and S5 Fig). This observation may reflect metabolic proximity through the uptake of metabolic nutrients by metabolically active blood cells. For instance, in our analysis we found signatures for all three major sources for energy production: lipids, proteins (in terms of amino acids) and carbohydrates indicating an active use of fuel molecules for energy generation by the blood cells.
Our model-based analysis has several limitations. Obviously, any such analysis is heavily dependent on the quality of the underlying metabolic reconstructions, which are still far from being complete [80]. This incompleteness, together with a prevalent inconsistent nomenclature of metabolites allowed us to map only 121 out of 254 measured metabolites onto the metabolic network model. Another limitation is the incomplete coverage of the metabolome, which is owed to the capabilities of currently available technologies. In this study we used measurements of 440 metabolites, which corresponds to just ~10% of the estimated human serum metabolome [81]. Nevertheless, we believe that despite incomplete pathway mappings, our observations further indicate that combined metabolomics and transcriptomics data from human blood reflect reaction signatures of system-wide biological processes.
To further functionally characterize the blood metabolome-transcriptome interface at a global level, we developed a network approach based on functional annotations. To this end, we aggregated z-score transformed measurements of metabolites and transcripts into their corresponding metabolic pathways and gene ontology categories, respectively. This approach allowed us to calculate correlation values between different functional categories, rather than between single metabolites and transcripts only. From these associations, we generated a pathway interaction network (PIN) of associated metabolic pathways and Gene Ontology terms, substantially reducing the complexity of the original network and thus facilitating functional interpretations. Detailed inspection of the PIN revealed that correlating nodes resembled not only signatures of well-known biological processes, like the carnitine shuttle, but also suggested novel interactions such as a crosstalk between monoacylglycerols and immune system processes. Taken together, the pathway interaction network enabled us to verify and elevate observations from the single reaction level (see model-based analysis) onto a pathway level. Moreover, we are now able to explore associations between biological processes/pathways across different biological scales including those that are not necessarily covered by metabolism, such as signaling or transcriptional processes.
Given the high interconnectivity of the BMTI and the PIN, we asked whether these associations contain information about regulatory interactions across the different metabolite classes and pathways. Enrichment analysis of transcription factor binding sites in the promoter regions of the genes contained in our network identified regulatory signatures for transcripts associated to the same metabolite, which are additionally largely shared between metabolites belonging to different metabolic pathways (Fig 5, S7 and S8 Figs). There is a series of possible explanations for this observation. On the one hand, our findings could indicate that single metabolites/transcripts are fulfilling multiple roles, thus sharing several biochemical pathways. On the other hand, it might reflect regulatory interactions operationally linking different metabolic pathways. In depth investigation of 12 transcription factors included in the BMTI additionally revealed two “triad” network motifs between transcription factors BCL6 and NR4A2, their target genes and the metabolites methionine and kynurenine, respectively. Remarkably, in a study conducted on mice fed a methionine and choline deficient diet, a significant reduction in the expression of BCL6 was observed [82]. It is widely known that metabolites can act as intermediates in cellular signaling, thereby also regulating gene expression, and together with our findings we suggest that characteristics of metabolic regulation are captured in the BMTI. However, from a correlation network, the detection of an association between a metabolite and a transcript does not necessarily imply a regulatory relationship nor can a conclusion be drawn about the directionality of the relationship. Yet, a combined analysis might offer the opportunity to identify novel molecular mechanisms behind cellular regulation that need to be validated further by experimental evidence.
Besides transcriptional regulation mediated by TFs, a substantial fraction of transcripts are expected to be regulated by epigenetic processes [83]. Comparing 1,350 reported methylation-metabolite associations from a recent epigenome-wide association study [31] with our results surprisingly revealed only a single overlapping hit: X-03094 and the MAN2A2 transcript correlated in our study and also displayed a comparable methylation-metabolite association in the EWAS study. This sparse overlap could be explained by a phenomenon termed “phenotypic buffering” [32], where effects in one organizational layer (e.g. epigenetics) are not detectable anymore on the next layer (e.g. transcriptomics). A detailed explanation of this observation is beyond the scope of the present paper and needs further investigation.
Further following the scheme of a systems genetics approach, we integrated the two identified networks with intermediate clinical trait data. To this end, we investigated the relationships between changing levels of HDL-C, LDL-C and TG and all measured metabolites and transcripts, metabolic pathways and GO terms (Fig 6). A similar study already described an association between a gene-module derived from whole blood transcriptomics data and circulating lipid parameters including apolipoprotein B (APOB), HDL-C and triglycerides (TG) from a Finnish population cohort [29]. Our systematic analysis identified a large number of metabolites, transcripts, metabolic pathways, and functional GO categories that are all associated with the levels of circulating lipids. These findings further strengthen the assumption of a close link between system-wide metabolism, reflected by circulating metabolites and clinical lipid markers, and intracellular gene regulatory processes of blood cells. In addition, an opposite pattern between HDL-C and TG associations (Fig 6A–6F) was observed from the phenotype networks which supports a previously suggested antagonistic regulation of both clinical traits [75,84]. However, the precise molecular mechanism behind this regulation is not entirely known, and our results might provide a basis for future studies to gain novel insights into the regulatory mechanisms of intermediate physiological phenotypes.
Combining results from all analysis steps allows for novel hypothesis generation. For example, for the well-known interactions between HDL-C, TG and BCAAs [57,76], we discovered a potential regulatory pattern on different biological scales. In our first analysis step, we identified a strong negative association between the branched-chain amino acid isoleucine and ABCG1, a major constituent of lipid homeostasis and cholesterol metabolism [55,85]. Second, at a more global level, the phenotype networks revealed an inverse association between HDL-C and TG, and also between HDL-C, TG and BCAAs (BCAAs are positively associated to TG, negatively to HDL-C, see S9 Table). Third, in the TFBS enrichment analysis we were able to identify a clear regulatory signature of SREBPs in the vicinity of BCAAs, which are known to regulate cholesterol metabolism, indicating a potential coregulation between BCAAs and cholesterol metabolism at the transcriptional level. Interestingly, a combined study using cultured hepatocytes in a branched-chain amino acid-rich medium and obese mice showed that BCAAs directly induce the expression of SREBP1C which leads to hypertriglyceridemia, further supporting the suggested regulatory cross-link between HDL-C, TG and BCAAs [76]. This link is of particular interest since all three molecular traits have been associated to various diseases such as coronary artery disease, obesity and diabetes type II [86–88] and our observations might contribute to further decipher their underlying mechanisms.
In summary, our study highlights the potential of a systems genetics approach for understanding interactions across multiple biological scales – in this case circulating metabolites and blood cellular gene expression—and how those insights can be used to generate novel hypothesis on mechanisms underlying common diseases.
Materials and Methods
Population cohort and data acquisition
The Cooperative Health Research in the Region of Augsburg (KORA) study is a series of independent population-based epidemiological surveys and follow-up studies of participants living in the region of Augsburg, southern Germany [89,90]. In this paper, cross-sectional data from 712 participants of the KORA F4 population cohort was used for whom metabolite concentration, gene expression data and genotyping information were available. This subpopulation contains combined fasting serum metabolomics and whole blood transcriptomics measurements of 354 males and 358 females aged 62–77 years (mean 68.82 ± 4.31). All participants are residents of German nationality identified through the registration office and written informed consent was obtained from each participant. The study was approved by the local ethics committee (Bayerische Landesärztekammer). Detailed descriptions of blood sample acquisition and experimental procedures for the metabolomics and transcriptomics data, and clinical trait measurements can be found in [59,91–93]. Briefly, metabolic profiling was performed by Metabolon, Inc. using ultrahigh-performance liquid-phase chromatography and gas-chromatography separation, coupled with tandem mass spectrometry. In total, 517 serum metabolites were measured, thereof 293 with known chemical identity and 224 unidentified metabolites (“unknowns”). All identified metabolites were assigned to one out of eight superpathways and one out of 61 subpathways by Metabolon, Inc., representing two different levels in the metabolic pathway classification hierarchy (see S5 Table for a full list of annotations). Gene expression profiling was performed using total RNA extracts from whole blood samples on Illumina Human HT-12 v3 Expression BeadChips. Genotyping was carried out using the Affymetrix GeneChip array 6.0. A detailed description of the experimental procedures and preprocessing of the genetic data can be found in [92].
Replication of the significant metabolite - mRNA associations identified in the KORA dataset was carried out with the Finish DILGOM cohort dataset which included whole blood NMR metabolomics data as well as transcriptomics data for 518 individuals. A detailed description of the sample acquisition as well as data preparation can be found in [13,29].
Data preprocessing and quality control
To ensure data quality, metabolites with more than 50% missing values were excluded, leaving 440 metabolites (254 knowns and 186 unknowns) for further analysis. The remaining metabolite concentrations were log-transformed, since testing for normality indicated that for most cases the log-transformed concentrations were closer to a normal distribution than the untransformed values [23]. For gene expression arrays, quality control and imputation of missing values of the raw intensities was performed as described in [94]. Briefly, the initial preprocessing of the raw intensity data was done with GenomeStudio V2010.1. Raw probe level data was then imported to R and further preprocessed by log transformation and quantile normalization using the ‘lumi’ package [95] from the Bioconductor open source software (http://www.bioconductor.org). To account for technical variation, gene expression intensities data were adjusted for RNA amplification batch, RNA integrity number and sample storage time. Only probes with the annotation flag QC_COMMENT “good” as provided in the updated Illumina Human HT-12 v3 BeadChip annotation file were considered for analysis [94]. In addition, probes mapping to gonosomal chromosomes were removed. Out of 48,803 probes on the Illumina Human HT-12 v3 array, 24,818 passed these filtering criteria.
Correlation network generation
The metabolite-transcript interface was constructed based on Spearman’s correlation coefficients between the concentrations of all possible metabolite-transcript pairs (24,818x440) across the individuals of the study cohort. Correlation calculation was performed separately for each variable pair, only considering samples without missing values for the metabolites. Statistical significance of correlations was determined at an FDR of 0.01 [96], corresponding to an absolute correlation value of 0.1816 and an adjusted significance level of 1.07 × 10−06. To get a unique network node per gene, redundant probes matching the same gene were removed. One representative probe per gene was chosen based on the maximum correlation strength to any metabolite, leaving 16,781 unique probes for subsequent analysis. It has to be noted that the applied significance level was still calculated on the whole dataset (including multiple matching probes per gene) to properly account for multiple testing. Network density was calculated as described in [35]. More precisely, for a stepwise increasing correlation threshold, the ratio between the total number of observed edges and all possible edges was calculated. Significant correlations between metabolites and transcripts were visualized as a bipartite graph using yEd graph editor (yWorks GmbH, Tuebingen; http://www.yworks.com).
Tissue/cell-type specificity
BMTI genes were mapped to three published lists of tissue - and cell-specificity based on gene expression microarrays from purified cells or tissues. The first two marker gene lists were taken from Palmer et al. [36], who defined markers for B-cells, CD4+ T-cells and CD8+ T-cells, lymphocytes and granulocytes, and from the HaemAtlas as generated by Watkins et al. [37], who reported markers for CD19+ B-cells, CD4+ T-cells and CD8+ T-cells, CD14+ monocytes, CD56+ NK cells, CD66b+ granulocytes, erythroblasts and megakaryocytes. The third marker list was downloaded from the CTen website: http://www.influenza-x.org/~jshoemaker/cten/db_info.php and comprised markers for 84 different human tissues/cell types [38]. The three lists together with the analysis results are provided in S3 Table.
Mendelian randomization
Estimation of causal effects within the BMTI was performed using a Mendelian randomization (MR) approach [58]. A total of 224 candidate SNPs reported as lead association signals at genome-wide significance in two recent GWAS studies for 16 metabolites and 186 mRNAs (BMTI contained) were preselected as instrumental variables[23,59]. To ensure the validity of the instrumental variables, only candidate SNPs that showed a significant association with a trait (metabolite or gene expression level) at an FDR of 0.05 in our data were considered for further analysis (32 SNPs were removed). Associations between SNPs and traits were assessed using linear regressions with age and sex as covariates. To further avoid potential confounding, all candidate SNPs were checked for pairwise linkage disequilibrium using the SNiPA tool [97]. None of the remaining 192 SNPs were in LD. Based on the metabolite-mRNA edges in the BMTI, 550 SNP-metabolite(Met)-mRNA and SNP-mRNA-Met sets were defined, covering 44% of all edges contained in the BMTI. Causal relationships SNP→Met→mRNA and SNP→mRNA→Met were estimated, i.e. whether changes in the metabolite level cause changes in the transcript level and vice versa. Causal effects of both models were calculated using the Wald ratio method [98]:

Metabolic pathway model and distance calculation
Metabolic reactions were extracted from the consensus metabolic reconstruction “Recon 2”, v. 02 available at http://humanmetabolism.org as of October 2013 [33]. Compartmental information was removed by merging shared nodes and reactions between different compartments. To avoid potential biologically meaningless shortcuts between network nodes, co-factors and currency metabolites were excluded from the metabolic network prior to the distance calculation (see S5 Table for a full list of removed metabolites). Measured metabolites and transcripts were mapped onto the corresponding network nodes based on KEGG IDs or HMDB identifier for metabolites, and Entrez Gene IDs for transcripts. Distances between all mapped pairs of metabolites and transcripts were defined as the shortest path in the network, i.e. the minimal number of reaction steps between them. For instance, a distance of zero between a transcript and metabolite indicates that the metabolite is a direct reactant of the reaction catalyzed by the particular enzyme encoded by the transcript. A distance of one indicates that the enzyme-encoding transcript catalyzes a directly connected reaction, which takes a product of the particular metabolite as input, and so on. A distance of infinity (Inf) was assigned if the respective metabolite and transcript were disconnected in the pathway network. Moreover, a “not mapped” (NM) distance was assigned if either the metabolite or the transcript could not be mapped to Recon 2. Note that the network was treated as undirected, i.e. all reaction directions were ignored.
Annotations, aggregated z-scores and construction of pathway interaction network
Functional annotations were retrieved from two different sources. For transcripts, the generic GO Slim catalogue was downloaded from Gene Ontology (GO, http://www.geneontology.org/GO.slims.shtml). Generic GO Slim is a broad and non-redundant subset of all Gene Ontology terms consisting of 148 unique terms covering all three GO domains (cellular component, molecular function and biological process; [99]). The three root terms cellular component, molecular function and biological process and terms with no annotations for any of the 16,781 transcripts were removed, resulting in 140 terms for further analysis. For metabolites, the subpathway annotations were used (see above). Metabolic pathways (MP) with less than two metabolites were excluded from the analysis, leaving 48 metabolic pathways.
To aggregate the components belonging to a specific annotation term and to derive a score for each of these functional categories, the average of the associated z-score normalized gene expression profiles or metabolite concentrations was calculated according to

Phenotype analysis
Linear regression analysis was performed with age and sex as covariates:

Promoter analysis
To investigate regulatory signatures in the BMTI, an enrichment analysis of transcription factor binding sites was performed. Sets of input sequences were created from the neighbors of each metabolite with a degree ≥ 3 (at least 3 connected genes). Analogously, the pathway interaction network was used to construct sequence sets based on the neighborhood of a metabolic pathway node. For each set of input sequences, a separate search for overrepresented TFBS was performed with the sequences of all remaining genes as background model. Promoter regions (-2,000 bp to +200 bp relative to the TSS) and TSS positions of all genes were extracted from the UCSC database using the R package BSgenome.Hsapiens.UCSC.hg19 version 1.3.1. Position-specific weight matrices of the transcription factor binding motifs were taken from the vertebrate collection of the Jaspar database version 5.0 alpha [68]. Enrichment analysis was performed with the TFM-Explorer command line tool [100]. The p-value threshold to determine significance of the motifs in all input sets was set to 1.0 × 10⁻⁷ which lies in the recommended optimal range given the numbers of input sequences we used in this study (mean number of input sequences: 62) [101]. The authors showed that for a fixed false positive rate of 10%, the optimal p-value threshold was 1.0 × 10⁻⁷ for a dataset of 100 input sequences.
Supporting Information
Zdroje
1. Liew C-C, Ma J, Tang H-C, Zheng R, Dempsey AA. The peripheral blood transcriptome dynamically reflects system wide biology: a potential diagnostic tool. J Lab Clin Med. 2006;147 : 126–132. doi: 10.1016/j.lab.2005.10.005 16503242
2. Herder C, Karakas M, Koenig W. Biomarkers for the Prediction of Type 2 Diabetes and Cardiovascular Disease. Clin Pharmacol Ther. 2011;90 : 52–66. doi: 10.1038/clpt.2011.93 21654741
3. Segal E, Shapira M, Regev A, Pe’er D, Botstein D, Koller D, et al. Module networks: identifying regulatory modules and their condition-specific regulators from gene expression data. Nat Genet. 2003;34 : 166–176. doi: 10.1038/ng1165 12740579
4. Stuart JM, Segal E, Koller D, Kim SK. A gene-coexpression network for global discovery of conserved genetic modules. Science. 2003;302 : 249–255. doi: 10.1126/science.1087447 12934013
5. Bergmann S, Ihmels J, Barkai N. Similarities and Differences in Genome-Wide Expression Data of Six Organisms. PLoS Biol. 2003;2: e9. doi: 10.1371/journal.pbio.0020009 14737187
6. Mabbott NA, Baillie JK, Brown H, Freeman TC, Hume DA. An expression atlas of human primary cells: inference of gene function from coexpression networks. BMC Genomics. 2013;14 : 632. doi: 10.1186/1471-2164-14-632 24053356
7. Basso K, Margolin AA, Stolovitzky G, Klein U, Dalla-Favera R, Califano A. Reverse engineering of regulatory networks in human B cells. Nat Genet. 2005;37 : 382–390. doi: 10.1038/ng1532 15778709
8. Lefebvre C, Rajbhandari P, Alvarez MJ, Bandaru P, Lim WK, Sato M, et al. A human B-cell interactome identifies MYB and FOXM1 as master regulators of proliferation in germinal centers. Mol Syst Biol. 2010;6 : 377. doi: 10.1038/msb.2010.31 20531406
9. Nayak RR, Kearns M, Spielman RS, Cheung VG. Coexpression network based on natural variation in human gene expression reveals gene interactions and functions. Genome Res. 2009;19 : 1953–1962. doi: 10.1101/gr.097600.109 19797678
10. Doering TA, Crawford A, Angelosanto JM, Paley MA, Ziegler CG, Wherry EJ. Network Analysis Reveals Centrally Connected Genes and Pathways Involved in CD8+ T Cell Exhaustion versus Memory. Immunity. 2012;37 : 1130–1144. doi: 10.1016/j.immuni.2012.08.021 23159438
11. He F, Chen H, Probst-Kepper M, Geffers R, Eifes S, del Sol A, et al. PLAU inferred from a correlation network is critical for suppressor function of regulatory T cells. Molecular Systems Biology. 2012;8. doi: 10.1038/msb.2012.56
12. Saris CG, Horvath S, Vught PW van, Es MA van, Blauw HM, Fuller TF, et al. Weighted gene co-expression network analysis of the peripheral blood from Amyotrophic Lateral Sclerosis patients. BMC Genomics. 2009;10 : 405. doi: 10.1186/1471-2164-10-405 19712483
13. Inouye M, Silander K, Hamalainen E, Salomaa V, Harald K, Jousilahti P, et al. An Immune Response Network Associated with Blood Lipid Levels. PLoS Genet. 2010;6: e1001113. doi: 10.1371/journal.pgen.1001113 20844574
14. Li S, Rouphael N, Duraisingham S, Romero-Steiner S, Presnell S, Davis C, et al. Molecular signatures of antibody responses derived from a systems biology study of five human vaccines. Nat Immunol. 2014;15 : 195–204. doi: 10.1038/ni.2789 24336226
15. Steuer R, Kurths J, Fiehn O, Weckwerth W. Observing and interpreting correlations in metabolomic networks. Bioinformatics. 2003;19 : 1019–1026. doi: 10.1093/bioinformatics/btg120 12761066
16. Camacho D, de la Fuente A, Mendes P. The origin of correlations in metabolomics data. Metabolomics. 2005;1 : 53–63. doi: 10.1007/s11306-005-1107-3
17. Morgenthal K, Weckwerth W, Steuer R. Metabolomic networks in plants: Transitions from pattern recognition to biological interpretation. BioSystems. 2006;83 : 108–117. doi: 10.1016/j.biosystems.2005.05.017 16303239
18. Orešič M, Tang J, Seppänen-Laakso T, Mattila I, Saarni SE, Saarni SI, et al. Metabolome in schizophrenia and other psychotic disorders: a general population-based study. Genome Medicine. 2011;3 : 19. doi: 10.1186/gm233 21429189
19. Kujala UM, Mäkinen V-P, Heinonen I, Soininen P, Kangas AJ, Leskinen TH, et al. Long-term Leisure-time Physical Activity and Serum Metabolome. Circulation. 2013;127 : 340–348. doi: 10.1161/CIRCULATIONAHA.112.105551 23258601
20. Valcarcel B, Ebbels TMD, Kangas AJ, Soininen P, Elliot P, Ala-Korpela M, et al. Genome metabolome integrated network analysis to uncover connections between genetic variants and complex traits: an application to obesity. J R Soc Interface. 2014;11. doi: 10.1098/rsif.2013.0908
21. Shin S-Y, Fauman EB, Petersen A-K, Krumsiek J, Santos R, Huang J, et al. An atlas of genetic influences on human blood metabolites. Nat Genet. 2014;advance online publication. doi: 10.1038/ng.2982
22. Krumsiek J, Suhre K, Illig T, Adamski J, Theis F. Gaussian graphical modeling reconstructs pathway reactions from high-throughput metabolomics data. BMC Systems Biology. 2011;5 : 21. doi: 10.1186/1752-0509-5-21 21281499
23. Krumsiek J, Suhre K, Evans AM, Mitchell MW, Mohney RP, Milburn MV, et al. Mining the Unknown: A Systems Approach to Metabolite Identification Combining Genetic and Metabolic Information. PLoS Genet. 2012;8: e1003005. doi: 10.1371/journal.pgen.1003005 23093944
24. Mittelstrass K, Ried JS, Yu Z, Krumsiek J, Gieger C, Prehn C, et al. Discovery of sexual dimorphisms in metabolic and genetic biomarkers. PLoS Genet. 2011;7: e1002215. doi: 10.1371/journal.pgen.1002215 21852955
25. Hirai MY, Yano M, Goodenowe DB, Kanaya S, Kimura T, Awazuhara M, et al. Integration of transcriptomics and metabolomics for understanding of global responses to nutritional stresses in Arabidopsis thaliana. PNAS. 2004;101 : 10205–10210. doi: 10.1073/pnas.0403218101 15199185
26. Bylesjö M, Eriksson D, Kusano M, Moritz T, Trygg J. Data integration in plant biology: the O2PLS method for combined modeling of transcript and metabolite data. The Plant Journal. 2007;52 : 1181–1191. doi: 10.1111/j.1365-313X.2007.03293.x 17931352
27. Ferrara CT, Wang P, Neto EC, Stevens RD, Bain JR, Wenner BR, et al. Genetic Networks of Liver Metabolism Revealed by Integration of Metabolic and Transcriptional Profiling. PLoS Genet. 2008;4: e1000034. doi: 10.1371/journal.pgen.1000034 18369453
28. Zhu J, Sova P, Xu Q, Dombek KM, Xu EY, Vu H, et al. Stitching together Multiple Data Dimensions Reveals Interacting Metabolomic and Transcriptomic Networks That Modulate Cell Regulation. PLoS Biol. 2012;10: e1001301. doi: 10.1371/journal.pbio.1001301 22509135
29. Inouye M, Kettunen J, Soininen P, Silander K, Ripatti S, Kumpula LS, et al. Metabonomic, transcriptomic, and genomic variation of a population cohort. Molecular Systems Biology. 2010;6. doi: 10.1038/msb.2010.93
30. Homuth G, Teumer A, Völker U, Nauck M. A description of large-scale metabolomics studies: increasing value by combining metabolomics with genome-wide SNP genotyping and transcriptional profiling. J Endocrinol. 2012;215 : 17–28. doi: 10.1530/JOE-12-0144 22782382
31. Petersen A-K, Zeilinger S, Kastenmüller G, Römisch-Margl W, Brugger M, Peters A, et al. Epigenetics meets metabolomics: An epigenome-wide association study with blood serum metabolic traits. Hum Mol Genet. 2013; ddt430. doi: 10.1093/hmg/ddt430
32. Civelek M, Lusis AJ. Systems genetics approaches to understand complex traits. Nature Reviews Genetics. 2013;15 : 34–48. doi: 10.1038/nrg3575 24296534
33. Thiele I, Swainston N, Fleming RMT, Hoppe A, Sahoo S, Aurich MK, et al. A community-driven global reconstruction of human metabolism. Nat Biotech. 2013;31 : 419–425. doi: 10.1038/nbt.2488
34. Arsenault BJ, Boekholdt SM, Kastelein JJP. Lipid parameters for measuring risk of cardiovascular disease. Nat Rev Cardiol. 2011;8 : 197–206. doi: 10.1038/nrcardio.2010.223 21283149
35. Aoki K, Ogata Y, Shibata D. Approaches for Extracting Practical Information from Gene Co-expression Networks in Plant Biology. Plant and Cell Physiology. 2007;48 : 381–390. doi: 10.1093/pcp/pcm013 17251202
36. Palmer C, Diehn M, Alizadeh AA, Brown PO. Cell-type specific gene expression profiles of leukocytes in human peripheral blood. BMC Genomics. 2006;7 : 115. doi: 10.1186/1471-2164-7-115 16704732
37. Watkins NA, Gusnanto A, de Bono B, De S, Miranda-Saavedra D, Hardie DL, et al. A HaemAtlas: characterizing gene expression in differentiated human blood cells. Blood. 2009;113: e1–e9. doi: 10.1182/blood-2008-06-162958 19228925
38. Shoemaker JE, Lopes TJ, Ghosh S, Matsuoka Y, Kawaoka Y, Kitano H. CTen: a web-based platform for identifying enriched cell types from heterogeneous microarray data. BMC genomics. 2012;13 : 460. doi: 10.1186/1471-2164-13-460 22953731
39. Sinclair D, Fillman SG, Webster MJ, Weickert CS. Dysregulation of glucocorticoid receptor co-factors FKBP5, BAG1 and PTGES3 in prefrontal cortex in psychotic illness. Sci Rep. 2013;3. doi: 10.1038/srep03539
40. Schoneveld OJLM, Gaemers IC, Lamers WH. Mechanisms of glucocorticoid signalling. Biochimica et Biophysica Acta (BBA)—Gene Structure and Expression. 2004;1680 : 114–128. doi: 10.1016/j.bbaexp.2004.09.004
41. Wong S, Tan K, Carey KT, Fukushima A, Tiganis T, Cole TJ. Glucocorticoids stimulate hepatic and renal catecholamine inactivation by direct rapid induction of the dopamine sulfotransferase Sult1d1. Endocrinology. 2010;151 : 185–194. doi: 10.1210/en.2009-0590 19966186
42. Polman JAE, Hunter RG, Speksnijder N, van den Oever JME, Korobko OB, McEwen BS, et al. Glucocorticoids modulate the mTOR pathway in the hippocampus: differential effects depending on stress history. Endocrinology. 2012;153 : 4317–4327. doi: 10.1210/en.2012-1255 22778218
43. Schmidt S. Identification of glucocorticoid-response genes in children with acute lymphoblastic leukemia. Blood. 2006;107 : 2061–2069. doi: 10.1182/blood-2005-07-2853 16293608
44. Philip AM, Daniel Kim S, Vijayan MM. Cortisol modulates the expression of cytokines and suppressors of cytokine signaling (SOCS) in rainbow trout hepatocytes. Dev Comp Immunol. 2012;38 : 360–367. doi: 10.1016/j.dci.2012.07.005 22878426
45. Pei H, Yao Y, Yang Y, Liao K, Wu J-R. Krüppel-like factor KLF9 regulates PPARγ transactivation at the middle stage of adipogenesis. Cell Death Differ. 2011;18 : 315–327. doi: 10.1038/cdd.2010.100 20725087
46. Liu Y-X, Wang J, Guo J, Wu J, Lieberman HB, Yin Y. DUSP1 Is Controlled by p53 during the Cellular Response to Oxidative Stress. Mol Cancer Res. 2008;6 : 624–633. doi: 10.1158/1541-7786.MCR-07-2019 18403641
47. Spörl F, Korge S, Jürchott K, Wunderskirchner M, Schellenberg K, Heins S, et al. Krüppel-like factor 9 is a circadian transcription factor in human epidermis that controls proliferation of keratinocytes. PNAS. 2012;109 : 10903–10908. doi: 10.1073/pnas.1118641109 22711835
48. Charmandari E, Chrousos GP, Lambrou GI, Pavlaki A, Koide H, Ng SSM, et al. Peripheral CLOCK regulates target-tissue glucocorticoid receptor transcriptional activity in a circadian fashion in man. PLoS ONE. 2011;6: e25612. doi: 10.1371/journal.pone.0025612 21980503
49. Zechner R, Zimmermann R, Eichmann TO, Kohlwein SD, Haemmerle G, Lass A, et al. FAT SIGNALS—Lipases and Lipolysis in Lipid Metabolism and Signaling. Cell Metabolism. 2012;15 : 279–291. doi: 10.1016/j.cmet.2011.12.018 22405066
50. Fonseca BM, Costa MA, Almada M, Correia-da-Silva G, Teixeira NA. Endogenous cannabinoids revisited: A biochemistry perspective. Prostaglandins & Other Lipid Mediators. 2013;102–103 : 13–30. doi: 10.1016/j.prostaglandins.2013.02.002
51. Kondo H, Hase T, Murase T, Tokimitsu I. Digestion and assimilation features of dietary DAG in the rat small intestine. Lipids. 2003;38 : 25–30. 12669816
52. Schneider E, Leite-de-Moraes M, Dy M. Histamine, Immune Cells and Autoimmunity. In: Thurmond RL, editor. Histamine in Inflammation. Springer US; 2010. pp. 81–94. Available: http://link.springer.com/chapter/10.1007/978-1-4419-8056-4_9
53. Bresnick EH, Katsumura KR, Lee H-Y, Johnson KD, Perkins AS. Master regulatory GATA transcription factors: mechanistic principles and emerging links to hematologic malignancies. Nucl Acids Res. 2012; gks281. doi: 10.1093/nar/gks281
54. Zhang Y, Guo K, LeBlanc RE, Loh D, Schwartz GJ, Yu Y-H. Increasing Dietary Leucine Intake Reduces Diet-Induced Obesity and Improves Glucose and Cholesterol Metabolism in Mice via Multimechanisms. Diabetes. 2007;56 : 1647–1654. doi: 10.2337/db07-0123 17360978
55. Kennedy MA, Barrera GC, Nakamura K, Baldán Á, Tarr P, Fishbein MC, et al. ABCG1 has a critical role in mediating cholesterol efflux to HDL and preventing cellular lipid accumulation. Cell Metabolism. 2005;1 : 121–131. doi: 10.1016/j.cmet.2005.01.002 16054053
56. Cheng S, Rhee EP, Larson MG, Lewis GD, McCabe EL, Shen D, et al. Metabolite profiling identifies pathways associated with metabolic risk in humans. Circulation. 2012;125 : 2222–2231. doi: 10.1161/CIRCULATIONAHA.111.067827 22496159
57. Krumsiek J, Suhre K, Illig T, Adamski J, Theis FJ. Bayesian Independent Component Analysis Recovers Pathway Signatures from Blood Metabolomics Data. J Proteome Res. 2012;11 : 4120–4131. doi: 10.1021/pr300231n 22713116
58. Davey Smith G, Hemani G. Mendelian randomization: genetic anchors for causal inference in epidemiological studies. Human Molecular Genetics. 2014;23: R89–R98. doi: 10.1093/hmg/ddu328 25064373
59. Schramm K, Marzi C, Schurmann C, Carstensen M, Reinmaa E, Biffar R, et al. Mapping the Genetic Architecture of Gene Regulation in Whole Blood. PLoS ONE. 2014;9: e93844. doi: 10.1371/journal.pone.0093844 24740359
60. Walther D, Strassburg K, Durek P, Kopka J. Metabolic Pathway Relationships Revealed by an Integrative Analysis of the Transcriptional and Metabolic Temperature Stress-Response Dynamics in Yeast. OMICS: A Journal of Integrative Biology. 2010;14 : 261–274. doi: 10.1089/omi.2010.0010 20455750
61. Klíma M, Broučková A, Koc M, Anděra L. T-cell activation triggers death receptor-6 expression in a NF-κB and NF-AT dependent manner. Molecular Immunology. 2011;48 : 1439–1447. doi: 10.1016/j.molimm.2011.03.021 21501873
62. Kendall AC, Nicolaou A. Bioactive lipid mediators in skin inflammation and immunity. Progress in Lipid Research. 2013;52 : 141–164. doi: 10.1016/j.plipres.2012.10.003 23124022
63. Alhouayek M, Masquelier J, Muccioli GG. Controlling 2-arachidonoylglycerol metabolism as an anti-inflammatory strategy. Drug Discovery Today. 2014;19 : 295–304. doi: 10.1016/j.drudis.2013.07.009 23891880
64. Scortegagna M. The HIF family member EPAS1/HIF-2 is required for normal hematopoiesis in mice. Blood. 2003;102 : 1634–1640. doi: 10.1182/blood-2003-02-0448 12750163
65. Radtke F, Fasnacht N, MacDonald HR. Notch Signaling in the Immune System. Immunity. 2010;32 : 14–27. doi: 10.1016/j.immuni.2010.01.004 20152168
66. Bühring H-J, Streble A, Valent P. The Basophil-Specific Ectoenzyme E-NPP3 (CD203c) as a Marker for Cell Activation and Allergy Diagnosis. International Archives of Allergy and Immunology. 2004;133 : 317–329. doi: 10.1159/000077351 15031605
67. Frateschi S, Camerer E, Crisante G, Rieser S, Membrez M, Charles R-P, et al. PAR2 absence completely rescues inflammation and ichthyosis caused by altered CAP1/Prss8 expression in mouse skin. Nat Commun. 2011; 161. doi: 10.1038/ncomms1162
68. Mathelier A, Zhao X, Zhang AW, Parcy F, Worsley-Hunt R, Arenillas DJ, et al. JASPAR 2014: an extensively expanded and updated open-access database of transcription factor binding profiles. Nucl Acids Res. 2013; gkt997. doi: 10.1093/nar/gkt997
69. Zeng L, Liao H, Liu Y, Lee T-S, Zhu M, Wang X, et al. Sterol-responsive element-binding protein (SREBP) 2 down-regulates ATP-binding cassette transporter A1 in vascular endothelial cells: a novel role of SREBP in regulating cholesterol metabolism. J Biol Chem. 2004;279 : 48801–48807. doi: 10.1074/jbc.M407817200 15358760
70. Tontonoz P, Nagy L, Alvarez JG, Thomazy VA, Evans RM. PPARgamma promotes monocyte/macrophage differentiation and uptake of oxidized LDL. Cell. 1998;93 : 241–252. 9568716
71. Cowell IG. E4BP4/NFIL3, a PAR-related bZIP factor with many roles. Bioessays. 2002;24 : 1023–1029. doi: 10.1002/bies.10176 12386933
72. Everett L, Hansen M, Hannenhalli S. Regulating the regulators: modulators of transcription factor activity. Methods Mol Biol. 2010;674 : 297–312. doi: 10.1007/978-1-60761-854-6_19 20827600
73. Tsuruoka N, Arima M, Arguni E, Saito T, Kitayama D, Sakamoto A, et al. Bcl6 is required for the IL-4-mediated rescue of the B cells from apoptosis induced by IL-21. Immunology Letters. 2007;110 : 145–151. doi: 10.1016/j.imlet.2007.04.009 17532053
74. Floegel A, Wientzek A, Bachlechner U, Jacobs S, Drogan D, Prehn C, et al. Linking diet, physical activity, cardiorespiratory fitness and obesity to serum metabolite networks: findings from a population-based study. Int J Obes (Lond). 2014; doi: 10.1038/ijo.2014.39
75. Mahaney MC, Blangero J, Comuzzie AG, VandeBerg JL, Stern MP, MacCluer JW. Plasma HDL Cholesterol, Triglycerides, and Adiposity A Quantitative Genetic Test of the Conjoint Trait Hypothesis in the San Antonio Family Heart Study. Circulation. 1995;92 : 3240–3248. doi: 10.1161/01.CIR.92.11.3240 7586310
76. Li S, Ogawa W, Emi A, Hayashi K, Senga Y, Nomura K, et al. Role of S6K1 in regulation of SREBP1c expression in the liver. Biochem Biophys Res Commun. 2011;412 : 197–202. doi: 10.1016/j.bbrc.2011.07.038 21806970
77. Perner S, Rupp NJ, Braun M, Rubin MA, Moch H, Dietel M, et al. Loss of SLC45A3 protein (prostein) expression in prostate cancer is associated with SLC45A3-ERG gene rearrangement and an unfavorable clinical course. Int J Cancer. 2013;132 : 807–812. doi: 10.1002/ijc.27733 22821757
78. Hancock T, Wicker N, Takigawa I, Mamitsuka H. Identifying Neighborhoods of Coordinated Gene Expression and Metabolite Profiles. Schönbach C, editor. PLoS ONE. 2012;7: e31345. doi: 10.1371/journal.pone.0031345 22355360
79. Zelezniak A, Sheridan S, Patil KR. Contribution of Network Connectivity in Determining the Relationship between Gene Expression and Metabolite Concentration Changes. PLoS Comput Biol. 2014;10: e1003572. doi: 10.1371/journal.pcbi.1003572 24762675
80. Stobbe MD, Houten SM, Jansen GA, van Kampen AHC, Moerland PD. Critical assessment of human metabolic pathway databases: a stepping stone for future integration. BMC systems biology. 2011;5 : 165. doi: 10.1186/1752-0509-5-165 21999653
81. Psychogios N, Hau DD, Peng J, Guo AC, Mandal R, Bouatra S, et al. The Human Serum Metabolome. PLoS ONE. 2011;6: e16957. doi: 10.1371/journal.pone.0016957 21359215
82. Greene MW, Burrington CM, Lynch DT, Davenport SK, Johnson AK, Horsman MJ, et al. Lipid Metabolism, Oxidative Stress and Cell Death Are Regulated by PKC Delta in a Dietary Model of Nonalcoholic Steatohepatitis. Alisi A, editor. PLoS ONE. 2014;9: e85848. doi: 10.1371/journal.pone.0085848 24454937
83. The ENCODE Project Consortium TEP. An integrated encyclopedia of DNA elements in the human genome. Nature. 2012;489 : 57–74. doi: 10.1038/nature11247 22955616
84. Calkin AC, Tontonoz P. Transcriptional integration of metabolism by the nuclear sterol-activated receptors LXR and FXR. Nat Rev Mol Cell Biol. 2012;13 : 213–224. doi: 10.1038/nrm3312 22414897
85. Yvan-Charvet L, Wang N, Tall AR. The role of HDL, ABCA1 and ABCG1 transporters in cholesterol efflux and immune responses. Arterioscler Thromb Vasc Biol. 2010;30 : 139–143. doi: 10.1161/ATVBAHA.108.179283 19797709
86. Newgard CB, An J, Bain JR, Muehlbauer MJ, Stevens RD, Lien LF, et al. A Branched-Chain Amino Acid-Related Metabolic Signature that Differentiates Obese and Lean Humans and Contributes to Insulin Resistance. Cell Metabolism. 2009;9 : 311–326. doi: 10.1016/j.cmet.2009.02.002 19356713
87. Wang TJ, Larson MG, Vasan RS, Cheng S, Rhee EP, McCabe E, et al. Metabolite profiles and the risk of developing diabetes. Nat Med. 2011;17 : 448–453. doi: 10.1038/nm.2307 21423183
88. O’Connell TM. The Complex Role of Branched Chain Amino Acids in Diabetes and Cancer. Metabolites. 2013;3 : 931–945. doi: 10.3390/metabo3040931 24958258
89. Holle R, Happich M, Löwel H, Wichmann HE, MONICA/KORA Study Group. KORA—a research platform for population based health research. Gesundheitswesen. 2005;67 Suppl 1: S19–25. doi: 10.1055/s-2005-858235 16032513
90. Wichmann H-E, Gieger C, Illig T, MONICA/KORA Study Group. KORA-gen—resource for population genetics, controls and a broad spectrum of disease phenotypes. Gesundheitswesen. 2005;67 Suppl 1: S26–30. doi: 10.1055/s-2005-858226 16032514
91. Rathmann W, Strassburger K, Heier M, Holle R, Thorand B, Giani G, et al. Incidence of Type 2 diabetes in the elderly German population and the effect of clinical and lifestyle risk factors: KORA S4/F4 cohort study. Diabetic Medicine. 2009;26 : 1212–1219. doi: 10.1111/j.1464-5491.2009.02863.x 20002472
92. Suhre K, Shin S-Y, Petersen A-K, Mohney RP, Meredith D, Wägele B, et al. Human metabolic individuality in biomedical and pharmaceutical research. Nature. 2011;477 : 54–60. doi: 10.1038/nature10354 21886157
93. Mehta D, Heim K, Herder C, Carstensen M, Eckstein G, Schurmann C, et al. Impact of common regulatory single-nucleotide variants on gene expression profiles in whole blood. European Journal of Human Genetics. 2012; Available: http://www.nature.com/ejhg/journal/vaop/ncurrent/full/ejhg2012106a.html
94. Schurmann C, Heim K, Schillert A, Blankenberg S, Carstensen M, Dörr M, et al. Analyzing Illumina Gene Expression Microarray Data from Different Tissues: Methodological Aspects of Data Analysis in the MetaXpress Consortium. Shomron N, editor. PLoS ONE. 2012;7: e50938. doi: 10.1371/journal.pone.0050938 23236413
95. Du P, Kibbe WA, Lin SM. lumi: a pipeline for processing Illumina microarray. Bioinformatics. 2008;24 : 1547–1548. doi: 10.1093/bioinformatics/btn224 18467348
96. Benjamini Y, Hochberg Y. Controlling the False Discovery Rate: A Practical and Powerful Approach to Multiple Testing. Journal of the Royal Statistical Society Series B (Methodological). 1995;57 : 289–300. doi: 10.2307/2346101
97. Arnold M, Raffler J, Pfeufer A, Suhre K, Kastenmuller G. SNiPA: an interactive, genetic variant-centered annotation browser. Bioinformatics. 2014; doi: 10.1093/bioinformatics/btu779
98. Lawlor DA, Harbord RM, Sterne JAC, Timpson N, Davey Smith G. Mendelian randomization: Using genes as instruments for making causal inferences in epidemiology. Statistics in Medicine. 2008;27 : 1133–1163. doi: 10.1002/sim.3034 17886233
99. Ashburner M, Ball CA, Blake JA, Botstein D, Butler H, Cherry JM, et al. Gene ontology: tool for the unification of biology. The Gene Ontology Consortium. Nat Genet. 2000;25 : 25–29. doi: 10.1038/75556 10802651
100. Tonon L, Touzet H, Varré J-S. TFM-Explorer: mining cis-regulatory regions in genomes. Nucl Acids Res. 2010;38: W286–W292. doi: 10.1093/nar/gkq473 20522509
101. Defrance M, Touzet H. Predicting transcription factor binding sites using local over-representation and comparative genomics. BMC Bioinformatics. 2006;7 : 396. doi: 10.1186/1471-2105-7-396 16945132
Štítky
Genetika Reprodukční medicínaČlánek vyšel v časopise
PLOS Genetics
2015 Číslo 6
- Kazuistika – Perspektivy využití precizované medicíny v rámci personalizované specifické terapie onkologických pacientů
- Nobelova cena za chemii pro genetické nůžky: Objev, který změní naši budoucnost?
- Technologie na bázi RNA v klinické praxi: od přebarvených petúnií k terapii vzácných a dosud jen obtížně léčitelných chorob u lidí
- „Nepředstavovali jsme si, že náš výzkum povede přímo ke vzniku nových léků, dokonce ještě za našeho života“
- Bezplatné služby pro diagnostiku ATTRv amyloidózy pro kardiology
Nejčtenější v tomto čísle
- Non-reciprocal Interspecies Hybridization Barriers in the Capsella Genus Are Established in the Endosperm
- Translational Upregulation of an Individual p21 Transcript Variant by GCN2 Regulates Cell Proliferation and Survival under Nutrient Stress
- Exome Sequencing of Phenotypic Extremes Identifies and as Interacting Modifiers of Chronic Infection in Cystic Fibrosis
- The Human Blood Metabolome-Transcriptome Interface
Zvyšte si kvalifikaci online z pohodlí domova
Mazová zátka a její řešení
nový kurzVšechny kurzy