
A Novel Feedback Loop That Controls Bimodal Expression of Genetic Competence
Gene expression can be highly heterogeneous in clonal cell populations. An extreme type of heterogeneity is the so-called bistable or bimodal expression, whereby a cell can differentiate into two alternative expression states, and consequently a population will be composed of cells that are ‘ON’ and cells that are ‘OFF’. Stochastic fluctuations of protein levels, also referred to as noise, provide the necessary source of heterogeneity that must be amplified by autostimulatory feedback regulation to obtain the bimodal response. A classical model of bistable differentiation is the development of genetic competence in Bacillus subtilis. Noise in expression of the transcription factor ComK ultimately determines the fraction of cells that enter the competent state. Due to its intrinsic random nature, noise is difficult to investigate. We adapted an artificial autostimulatory loop that bypasses all known ComK regulators, to screen for possible factors that affect noise in the bimodal regulation of ComK. This led to the discovery of Kre, a novel factor that controls the bimodal expression of ComK. Kre appears to affect the stability of comK mRNA. Interestingly, ComK itself represses the expression of kre, adding a new double negative feedback loop to the intricate ComK regulation circuit. Our data emphasize that mRNA stability is an important factor in bimodal regulation.
Published in the journal:
. PLoS Genet 11(6): e32767. doi:10.1371/journal.pgen.1005047
Category:
Research Article
doi:
https://doi.org/10.1371/journal.pgen.1005047
Summary
Gene expression can be highly heterogeneous in clonal cell populations. An extreme type of heterogeneity is the so-called bistable or bimodal expression, whereby a cell can differentiate into two alternative expression states, and consequently a population will be composed of cells that are ‘ON’ and cells that are ‘OFF’. Stochastic fluctuations of protein levels, also referred to as noise, provide the necessary source of heterogeneity that must be amplified by autostimulatory feedback regulation to obtain the bimodal response. A classical model of bistable differentiation is the development of genetic competence in Bacillus subtilis. Noise in expression of the transcription factor ComK ultimately determines the fraction of cells that enter the competent state. Due to its intrinsic random nature, noise is difficult to investigate. We adapted an artificial autostimulatory loop that bypasses all known ComK regulators, to screen for possible factors that affect noise in the bimodal regulation of ComK. This led to the discovery of Kre, a novel factor that controls the bimodal expression of ComK. Kre appears to affect the stability of comK mRNA. Interestingly, ComK itself represses the expression of kre, adding a new double negative feedback loop to the intricate ComK regulation circuit. Our data emphasize that mRNA stability is an important factor in bimodal regulation.
Introduction
Cellular differentiation is guided by complex gene regulatory networks that integrate different intra - and extracellular signals. This deterministic view has been challenged by the discovery of so-called bistable or bimodal regulation, whereby the decision to differentiate is stochastic. A classic example is the development of genetic competence in Bacillus subtilis [1]. Despite the fact that all cells are genetically identical, and are exposed to the same environmental conditions, only a minor fraction of a B. subtilis culture will develop into genetically transformable cells. Thus, a competent culture is composed of two different cell types. In essence, this bimodal distribution is the result of the positive feedback loop that regulates expression of the competence transcription factor ComK (Fig 1A) [2]. ComK is responsible for the expression of proteins required for DNA uptake and integration, but it also activates its own transcription [3–6]. If the cellular levels of ComK exceed a certain threshold, the auto-stimulatory loop is triggered and this leads to a rapid accumulation of ComK, which causes entry into the competent state [7–9]. Stochastic fluctuations or ‘noise’ in gene expression ultimately determines which cells accumulate sufficient ComK to reach the threshold level for autoactivation [10].

In recent years it has become apparent that bimodal gene regulation processes are common and occur both in prokaryotic as well as in eukaryotic cells [11,12]. For example, in B. subtilis the induction of motility, expression of extracellular proteases, and sporulation are bimodal differentiation processes that use positive feedback regulation loops [13–15]. The evolutionary reason for heterogenic differentiation in isogenic cell populations is often explained as a bet-hedging strategy, since bacteria cannot predict how and when environmental conditions will change. However, there are also examples of bimodal differentiation where both cell types benefit from each other. For example, during infection, Salmonella typhimurium differentiates into a slow-growing subpopulation expressing virulence genes and a fast-growing subpopulation that is avirulent. However, the latter subpopulation is required to maintain the infection [16]. Bimodal differentiation also occurs in multicellular systems, such as the development of alternative colour vision photoreceptors in Drosophila melanogaster [17]. Because of their important role in development, bimodal regulatory feedback loops have been extensively studied and modelled. An intriguing and often debated issue is the role of expression noise in bimodal regulation. The origin of protein expression noise resides in the omnipresent stochastic fluctuations in basic biochemical processes, including transcription, translation, mRNA and protein stability. This noise leads to slight cell-to-cell variations in protein levels [18]. Expression noise is a key prerequisite for bimodal gene expression, and yet noise is an intrinsically stochastic and non-deterministic process. Here, we describe a novel genetic screen that was developed to identify possible cellular factors influencing this noise.
The competence transcription factor ComK is induced in response to nutrient starvation and high cell densities. Entry into the competent state causes severe changes in the physiology of the cell, including a block in growth, cell division and DNA replication [19,20]. An intricate regulatory network ensures that activation of ComK is tightly controlled, and transcription from the comK promoter is regulated by five other transcription factors: Rok, AbrB, CodY, DegU and Spo0A [21–25] (Fig 1A). These transcription factors are involved in the regulation of several other differentiation pathways such as sporulation and motility, and they are part of extensive and intertwined regulatory networks [26]. ComK is able to activate comK transcription without the necessity to replace the repressors CodY and Rok [27]. Binding of ComK to its own promoter is stimulated by the pleiotropic response regulator DegU [25,28]. Phosphorylated Spo0A also binds to the comK promoter region and transiently induces expression by antagonizing Rok [24]. However, increased concentrations of Spo0A repress comK transcription, and this master regulator imposes temporal limitations to the onset of competence [24]. Despite the presence of multiple repressors, comK is still transcribed at a basal level, and ComK is actively removed by the adaptor protein MecA, which targets it for degradation by the ClpCP protease complex [29]. This proteolytic control is alleviated by a small protein ComS that binds to MecA and prevents ComK degradation [30]. ComS synthesis depends on the production of quorum-sensing pheromones and is therefore cell-density dependent [31,32].
Due to the complexity of comK regulation, it seems logical that fluctuations in the different regulation pathways will result in a heterogenic development of competence. However, we have previously shown that only the autostimulation of comK expression is sufficient for bimodal expression [7]. This was illustrated by constructing a simplified ComK feedback loop, whereby the comK promoter was substituted with the promoter of the comG operon (Fig 1B). This operon encodes proteins required for DNA uptake. The comG promoter is directly induced by ComK and is not controlled by any other known ComK regulator [33]. Subsequent deletion of mecA created an autostimulatory ComK loop that bypasses all known transcriptional and post-translational regulation (Fig 1B). Interestingly, expression of ComK by this artificial ComK feedback loop is comparable to the bimodal ComK expression in a wild type culture (Fig 1B) [7].
The B. subtilis competence regulation pathway is one of the best studied and modelled natural bimodal developmental systems and is therefore a good model system to study noise in bimodal regulation. We reasoned that the simplified positive feedback loop depicted in Fig 1B provides a way to identify possible unknown cellular factors that influence noise in comK expression. If none such factor can be found then we must assume that the bimodal distribution of Fig 1B is solely determined by noise. We developed a mutagenesis screen using the artificial ComK feedback loop of Fig 1B coupled with a reporter construct to visualize its activity. Interestingly, we were able to find transposon mutants that affected the expression of this minimalistic bistable positive feedback loop. Localization of the transposon insertions revealed an unknown gene, ykyB, which influences the bimodal induction of ComK. Inactivation of this gene increases the fraction of ComK expressing cells and the gene was therefore renamed kre for ComK repressor. Kre has no homology with any other protein. Further analyses indicated that Kre influences the stability of comK mRNA. Interestingly, the activity of Kre appears to be more general and is not limited to comK, however, the expression of kre is specifically downregulated by ComK itself. Kre is only present in species that contain ComK homologues. This co-evolution raises some intriguing questions concerning the balance between benefits and fitness drawbacks of genetic competence in B. subtilis. Finally, we discuss the importance of regulated RNA degradation in ComK expression and conclude that mRNA stability requires more attention in the research of bimodal gene expression.
Results
Identification of Kre (YkyB)
Previously, we have shown that an artificial autostimulatory ComK feedback loop shows a bimodal expression pattern that closely resembles the wild-type pattern of ComK expression (Fig 1) [7]. Theoretical modelling has shown that a simple positive feedback loop can produce a bimodal response if there is sufficient noise in the expression of the activator and a threshold level for activation [11]. Binding of ComK to DNA is highly cooperative and presumably this non-linear reaction determines the hypersensitive response of the positive feedback loop to small fluctuations of ComK levels [34]. This leaves expression noise as an important determinant of the fraction of ComK expressing cells and therefore of the bimodal distribution. To identify possible factors that influence the bimodal outcome of this artificial feedback loop, we constructed a lacZ-gfp operon that is driven by the comG promoter. This reporter enables the screening of mutants on plate as well as by fluorescence light microscopy, which makes it possible to distinguish differences in cellular ComK levels from differences in the frequency of ComK expressing cells. The PcomG-lacZ-gfp reporter was integrated at the ectopic amyE locus and combined with the artificial ComK feedback loop resulting in strain PG401 (PcomG-comK, ΔmecA, PcomG-lacZ-gfp). On nutrient agar plates containing X-gal, PG401 colonies developed a faint blue colour after 2 days of incubation. However, PG401 colonies develop a clear blue colour after overnight incubation on competence medium plates (Fig 2), indicating that medium composition still influences the artificial ComK feedback loop. This is surprising since this loop was constructed in such way that none of the known competence regulators are able to influence its activity (Fig 1). Nevertheless, the effect on nutrient agar plates could be used to our advantage since it facilitates the selection of mutants with different lacZ, thus ComK, activities.

Strain PG401 was mutagenized using the mariner transposon TnYLB-1 [35], and a library of ~30,000 transposons was plated on nutrient agar plates supplemented with X-gal. Colonies that were blue after one day of incubation were checked for heterogenic GFP expression by microscopy. Four independent insertions were found that mapped in the coding sequence of ykyB, a gene of unknown function. Strains with transposon insertions in ykyB grew as blue colonies of normal size on nutrient agar plates, and formed dark blue and small colonies when streaked on competence medium plates (Fig 2B). Microscopic visualization revealed that inactivation of ykyB causes a strong activation of the artificial ComK feedback loop, with GFP-expressing cells appearing on nutrient agar plates, and developing with more than 4 fold higher frequency on competence medium plates. (Figs 2, S1A and S1B). To confirm that the inactivation of YkyB was responsible for this effect, a complete deletion of ykyB was constructed and introduced into the artificial ComK feedback loop strain. When the resulting strain PG539 (PcomG-comK, ΔmecA, ΔykyB, PcomG-lacZ-gfp) was streaked onto competence medium X-gal plates, again dark blue colonies where formed in which more than 80% of cells expressed GFP. A strong activation of the artificial ComK loop was also observed in liquid rich medium (S1C Fig). Since inactivation of ykyB causes increased activation of ComK, the gene was renamed Kre for ComK repressor.
Kre influences competence development
To test whether inactivation of kre also influences ComK induction in wild type cells, both the kre:Tn mutation as well as the Δkre deletion were introduced into a wild-type background containing the PcomG-lacZ-gfp reporter fusion (strains PG433 (amyE::PcomG-lacZ-gfp, kre:Tn) and PG488 (amyE::PcomG-lacZ-gfp, Δkre)). The resulting strains showed an approximately 3 fold increase in the number of GFP expressing cells when grown overnight on competence medium plates (Fig 3A), indicating that the effect of a kre mutation is observable in wild type cells, and is not limited to strains containing the artificial ComK feedback loop. Similar results were obtained when the GFP reporter was fused to promoters of the competence genes comC, comF, addAB and nucA (S2 Fig). This shows that the sensitivity for Kre is not a unique property of the comG promoter, and that Kre affects ComK activity. To test the effect of a kre deletion in liquid cultures, we made use of the sensitive luciferase reporter fusion [36]. As shown in Fig 3B, a clear induction of the PcomG-luc reporter fusion is observed when kre is deleted. ComK levels were then checked by Western blotting and, as shown in Fig 3C, a strong increase in the intensity of ComK bands was detected for the kre mutant compared to the wild type strain. Consistently, when tested under the same growth conditions, an approximately 30-fold increase in transformation frequency of a kre mutant was observed at 0, 1 and 2 hours after the transition to stationary phase (Fig 3D).
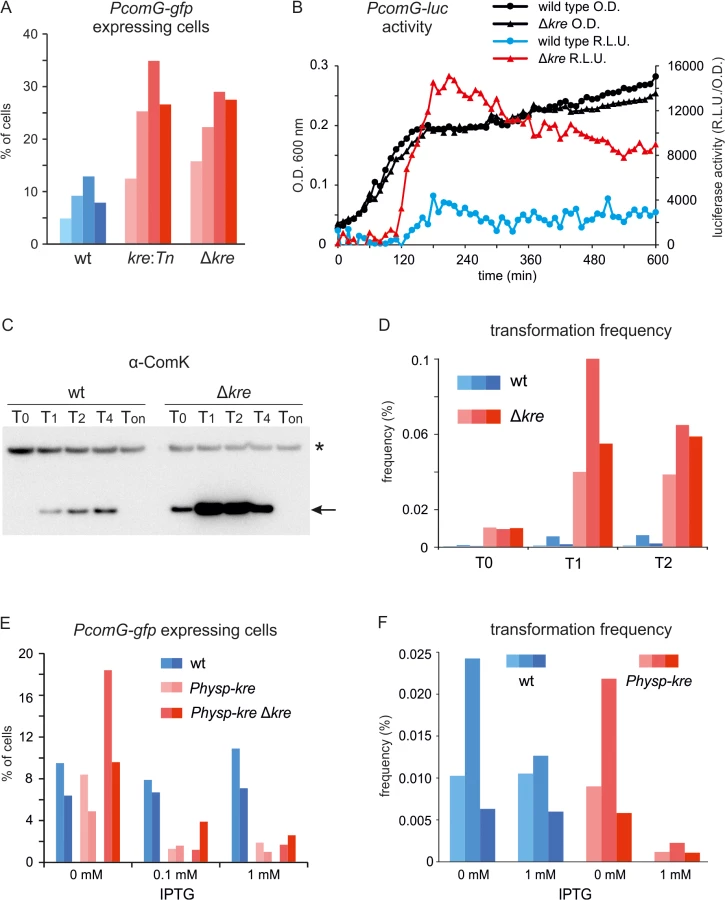
The results so far suggest that kre encodes a negative regulator of ComK. To confirm this, kre was placed under control of the strong IPTG-inducible Phyper-spank promoter at the ectopic amyE locus [37]. Indeed, overexpression of Kre reduced the fraction of PcomG-gfp expressing cells approximately 5 fold, and a strong repression was observed even when the wild type kre allele was deleted (Fig 3E). Overexpression of Kre also reduced the transformation efficiency (Fig 3F). To confirm that the effect was due to the Kre protein, a frame-shift mutation in the start codon of kre was introduced. The resulting strain (PG548) was unaffected by the addition of IPTG and showed normal transformation efficiencies (S3 Fig).
Kre is a cytosolic protein of unknown function
kre encodes a hypothetical protein of 154 amino acids with no homology to any known protein. A recent comprehensive transcriptome analysis revealed that kre is expressed as a monocistronic mRNA (S4 Fig) at moderate levels in different growth conditions [38]. In this analysis, slightly higher expression levels were observed in M9 medium, as well as under salt, ethanol, and heat stress, and no major difference were observed between exponential growth and stationary growth, at least in rich medium [38].
Possibly, Kre functions as a transcription factor and regulates ComK expression, although no DNA binding or any other conserved motifs are apparent from its amino acid sequence. Many transcription factors bind to the nucleoid, owing to their DNA binding property [39]. To examine whether Kre co-localizes with the nucleoid, GFP fusions to the N - and C-terminal ends of the protein were constructed (S5 Fig). Overexpression of both GFP-fusions reduced the fraction of PcomG expressing cells, indicating that the fusions are at least partially functional (S6 Fig). However, both fusions showed a diffuse cytoplasmic GFP signal (S5 Fig), suggesting that the protein does not function as a simple DNA binding transcription factor.
Kre activity is not comK locus dependent
Recent transcriptome experiments revealed the presence of a counter transcript, S365 RNA, which overlaps with the comK gene and is transcribed from the downstream located yhxD gene [38] (S7 Fig). YhxD is strongly upregulated under stress conditions such as the presence of high salt, ethanol or high temperatures, conditions that also result in some increase in kre expression [38]. Possibly, the induction of yhxD is regulated by Kre and the anti-sense S365 transcript interferes with comK expression. To test this, the PcomG-comK construct was relocated from the comK locus to the ectopic aprE locus, and the wild type comK gene was replaced with a phleomycin resistance cassette. The resulting strain (PG461; aprE::PcomG-comK, ΔmecA, ΔcomK, amyE::PcomG-lacZ-gfp) showed GFP expression comparable to PG401 (S7 Fig). Introduction of the kre mutation into PG461 resulted in an increase in GFP expressing cells very similar to what was observed in previous experiments with strains that contain the PcomG-comK construct at the wild-type comK locus (Figs 2 and S7). Thus, the activity of Kre is not based on the induction of the S365 anti-sense transcript.
Post-transcriptional control
So far, we have tested the effect of a kre mutation in the presence of ComK autostimulation. To further dissect at which level Kre controls the bimodal induction of ComK, we uncoupled ComK expression from its autostimulatory transcription by removing the native comK gene and by placing a copy under control of the xylose inducible Pxyl promoter at the ectopic amyE locus. To monitor the effect on ComK, the protein was N-terminally fused to GFP. The mecA gene was also deleted to prevent possible proteolytic regulation effects. Since the GFP-ComK translational fusion is partially active and binds to DNA, a clear fluorescent nucleoid signal is observed (Fig 4A). Interestingly, when a kre mutation was introduced into the strain, the fluorescence signal increased significantly (Fig 4A and 4B). The increase in GFP-ComK expression also resulted in a further reduction in growth rate (Fig 4C). Since the kre deletion has an effect on GFP-ComK accumulation even in the absence of a comK promoter, we conclude that Kre is not directly regulating the capacity of ComK to activate its own promoter.

Kre activity is not restricted to comK
As a negative control for the experiments of Fig 4, the fluorescence levels in a strain that expresses GFP instead of ComK-GFP were measured. Surprisingly, it appeared that the introduction of a kre deletion in this strain also resulted in increased GFP expression levels (Fig 5A). To examine whether this effect might be linked to the Pxyl promoter or to the mecA comK double mutant background that was used, the kre mutation was introduced into a wild type background strain containing an IPTG inducible Physp-gfp reporter fusion (strain PG820). As shown in Fig 5B, also this promoter produced higher levels of GFP when kre was mutated. Finally, to determine whether the Kre activity might be specific for GFP, we tested another reporter and used the β-galactosidase expressing lacZ-gfp operon. This time the reporter was driven by the Pveg promoter, which is assumed to be unregulated during logarithmic growth [40]. When the Pveg-lacZ fusion was measured in a kre mutant background (strain PG512), a modest but significant increase in β-galactosidase levels was detected (Fig 5C). Another promoter, PpksA, which also seemed to be unregulated according to a recent comprehensive transcriptome study [38], was tested as well and gave a similar increase in expression (Fig 5C). These results suggest that Kre functions as a more general repressor of gene expression.

Kre transcriptome
To determine the genome wide expression effect of a kre mutation, a micro-array experiment was performed. The transcriptome analysis was executed with samples taken from logarithmic growing cultures in rich LB medium. These conditions repress competence development [26], and were chosen to prevent induction of competence genes that might mask indicative gene regulation events. A table of the 68 most relevant affected genes, i.e. genes whose expression difference was more than 4-fold with an adjusted P-value <0.05, is presented in Table 1. The list comprises a mixture of metabolic genes, genes involved in iron uptake, as well as several genes with unknown activities. Two of the genes (ssbB and dprA) are part of the ComK regulon. However, the list of genes does not reveal a clear regulation pathway that could explain the mechanism of Kre activity.

Kre affects comK mRNA stability
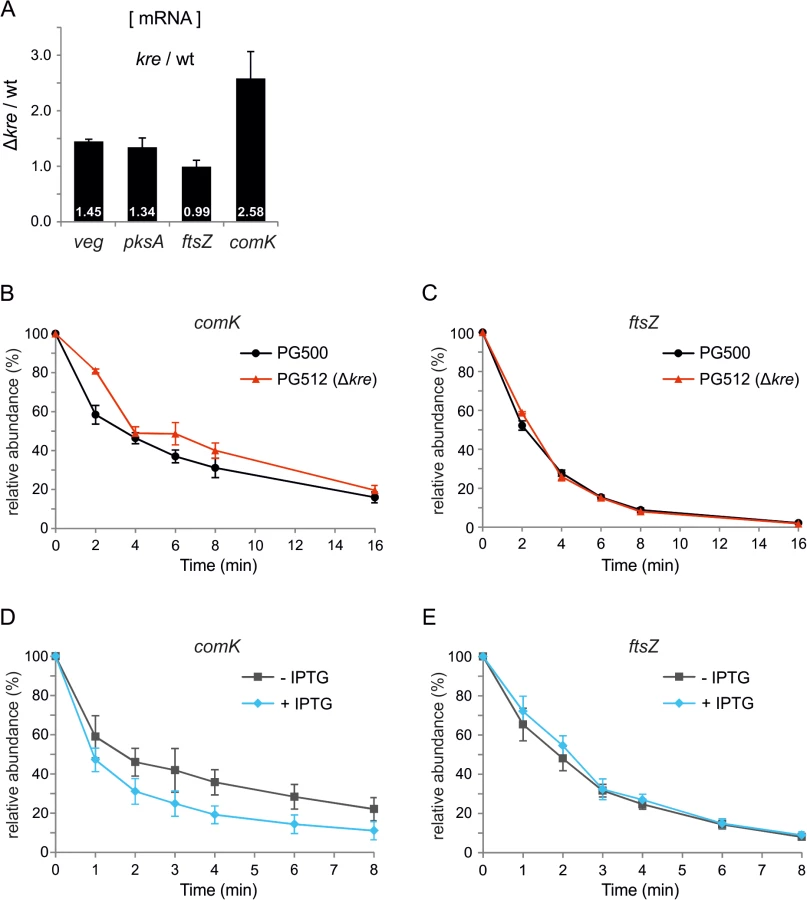
Kre reduces the expression of different unrelated genes but it is unclear whether this control occurs at the transcriptional or translational level. Therefore, we determined the levels of the veg, pksA and comK transcripts using qPCR. As shown in Fig 6A, the veg and pksA mRNA levels are higher in a kre mutant background, associated with p-values of 0.002 and 0.06, respectively. The effect on comK mRNA is the strongest (Fig 6A, p-value 0.013), which is presumably a consequence of the autostimulatory transcription of this gene. Not all genes are upregulated when Kre is deleted, as is apparent from the transcriptome data (Table 1), and a qPCR experiment showed that the mRNA levels of the cell division gene ftsZ are unaffected in a kre mutant strain (Fig 6A, p-value 0.88). These and previous data suggest that Kre is not a general inhibitor of RNA polymerase or protein translation, but that the protein affects mRNA levels and possibly influences mRNA stability. To test this, comK mRNA levels were measured after addition of the RNA polymerase inhibitor rifampicin. In the absence of Kre, an increase in stability was detected, with the half-life increasing on average from 3.9 min (SE = 0.4 min) to 5.4 min (SE = 0.6 min). Such increase was consistently observed in three biological replicates (Fig 6B and S1 Table). Comparing these 3 independent replicate measurements at each time point using a statistical test, showed that the increase in stability was significant (false discovery rate corrected p-value ≤ 0.05, S1 Table). As a control, we measured the stability of ftsZ mRNA, but there was no apparent effect when Kre was absent (Fig 6C, mRNA half-life of ~2.2 min in both strains, and S1 Table). We then measured the stability of the same transcripts upon Kre overexpression by using a strain containing an extra copy of kre under control of the strong IPTG inducible Phyperspank promoter. As shown in Fig 6D, a significant decrease in stability was detected for comK mRNA (false discovery rate corrected p-value ≤ 0.05, S1 Table) while, again, the stability of ftsZ mRNA was unaffected (Fig 6E). The half-life of comK mRNA was ~2.6 min in the absence, and ~1.3 min in the presence of IPTG, respectively (S1 Table). We note that, even in the absence of inducer, the half-life of comK mRNA was shorter compared to a wild type background. This might be due to leakiness of the Phyperspank promoter, and suggests that small variations of Kre levels may be sufficient to alter comK levels. Under the same conditions, the half-life of the ftsZ transcript was ~1.9 min and ~2.1 min, respectively. Based on these data, we conclude that Kre controls the bimodal response of ComK induction by affecting the stability of comK mRNA. The effect of Kre appears modest. However, the autostimulatory feedback will amplify small variations.
kre is repressed in competent cells
Kre affects the expression of many genes, yet there is a significant ‘presence-absence’ correlation between kre and comK in different bacterial genomes (Fig 7). A closer inspection of the kre promoter revealed the presence of at least 3 potential ComK dimer binding sites (Fig 8A). These so-called AT-boxes are spaced by 8 nucleotides, which is the correct distance to allow for the strong binding of a ComK tetramer [34]. Thus the kre promoter contains at least two ComK binding sites, one of which overlaps with the RNA polymerase binding site (-35 region). To examine whether ComK influences kre promoter activity, a Pkre-lacZ-gfp reporter fusion was cloned into a mecA deletion strain, which overproduces ComK due to the absence of the regulatory proteolytic control of ComK [41]. As shown in Fig 8B, deletion of mecA decreases the β-galactosidase activity by half, and this reduction was ComK dependent. The fact that overproduction of ComK suppresses this promoter implies a new negative feedback loop in the control of ComK expression in B. subtilis (Fig 8C). To examine whether this feedback control occurs in wild type cells expressing normal levels of ComK, we measured the activity of both the kre and comG promoters in single cells. The latter promoter was used as a reporter for ComK expression. The promoter of kre was fused to GFP by means of a Campbell-type integration (kre:Pkre-gfp), and the comG promoter was fused to mCherry and cloned into the amyE locus (amyE::PcomG-mcherry). Fluorescence light microscopy images of cells from a competent culture showed a clear reciprocal staining in the green and red channels (Fig 8D). Quantification of the fluorescent signals indicated that comG expressing cells show on average a 60% reduction in the Pkre-GFP signal (Fig 8E). The heterogenic expression of Pkre-GFP disappeared in a comK mutant strain (S8 Fig). Thus, the negative feedback control of kre is active in wild type cells. When kre was placed under control of the PcomG promoter, and therefore activated by ComK instead of repressed, a strong reduction in transformation efficiency was observed (S9 Fig). We conclude that, even though Kre affects the expression of many genes, its activity is closely intertwined with the development of genetic competence in B. subtilis.


Discussion
Novel ComK control pathway
Stochastic fluctuations in protein expression are a key prerequisite for the bimodal activation of positive feedback regulation systems. These random fluctuations in gene regulation pathways are often compared to the ‘noise’ in electronic circuits. The way electrical noise in circuits can be dampened, so can random spikes in protein levels be dampened too. This has consequences for bimodal processes, since a decrease in the amplitude or frequency of these spikes will reduce the chance that an activator reaches the threshold level necessary for auto-activation. Peaks in stochastic protein expression can be moderated by (i) suppressing the chance of transcription, (ii) reducing the life time (stability) of the mRNA, (iii) suppressing the chance of translation, and (iv) reducing the life time of the protein. The first and fourth mechanism are well known control pathways in the bimodal induction of ComK: Transcription from the comK promoter is repressed by 4 different transcription factors (Rok, AbrB, CodY and Spo0A), and the adaptor protein MecA stimulates degradation of ComK by the ClpCP protease complex. The identification of Kre reveals the presence of a third mechanism: control of comK mRNA stability.
Evolution of noise control
The complexity of ComK regulation remains puzzling, especially since bimodal expression can be obtained without the necessity of an intricate regulation network (Fig 1B). However, there are two main reasons why additional regulation is required, the timing of competence development and the escape from the competence state [26]. The latter is achieved by proteolytic degradation of ComK due to the reactivation of MecA as a consequence of dwindling ComS levels late in stationary phase [29,42]. Proper timing of ComK expression is essential since competent cells do not grow. Therefore, this developmental process should only be induced when nutrients become limiting. This explains for example the control of comK by the metabolic regulator CodY and the transition state regulator AbrB [22,23]. Competence induction should also not occur when cells are sporulating, therefore the control by the key sporulation activator Spo0A [24]. However, the reasons for the regulation by Rok and Kre are not immediately apparent. What is interesting is that these proteins were acquired relatively recently in evolutionary terms (Fig 7). Possibly, the origin of Rok and Kre regulation resides in a high fitness burden of the competence state (competent cells do not grow) relative to fitness benefits. In fact, there is only a remote chance that a genetic competent cell will acquire genetic material from which it can immediately benefit. In this respect, it is important to realize that most wild B. subtilis isolates are poorly competent, at least under laboratory conditions, and only the domesticated and mutagenized B. subtilis 168 strain shows high levels of competence [43]. Presumably, most of the time it is better for cells to circumvent the induction of competence, and acquiring new repressors that reduce the fraction of competent cell, like Rok and Kre, might therefore be beneficial. However, in the long term, the capacity to obtain new genetic material benefits the species, and this might explain why the negative feedback regulation of kre by ComK has evolved. Related to this, it is maybe interesting to note that the expression of rok is also repressed by ComK [21]. Of course, we cannot rule out that the main function of Kre is to restrict the time cells stay in the dormant genetic competent state.
RNA regulation
Our data suggests that Kre regulates mRNA stability. The protein does not have a known RNA or nucleotide binding pocket and its activity seems to be more general and not restricted to comK transcripts. It is unclear by which mechanism Kre influences mRNA decay. Within the ComK regulation cascade there is one other pathway that is affected by RNA modification. The conserved exoribonuclease PnpA, which is involved in cellular RNA homeostasis [44], is required for the expression of ComS [45]. The small comS gene is embedded within a very long (~26kb) mRNA encoding the synthetase subunits for the lipopeptide antibiotic surfactin [31,32]. Why PnpA is required for the expression of ComS is not known. Interestingly, in our screen we found two mutations that repressed the artificial ComK autostimulatory loop. These mutants contained transposon insertions into pnpA and cshA. The latter gene encodes a conserved RNA helicase which is also involved in cellular RNA homeostasis [46]. Thus, it seems there are more factors influencing comK mRNA stability. In a recent study it was shown that in Halobacterium salinarum and Escherichia coli there are specific RNases that control transcriptional positive autoregulation loops involved in certain energy-related processes [47]. Clearly, regulation of mRNA life-time is an efficient and presumably common mechanism to control transcriptional positive feedback loops.
Growth and medium regulation
Two features of the artificial bimodal ComK loop remain unexplained. Even when kre is deleted, the induction of ComK is still growth phase and medium dependent (Figs 2 and 3). One explanation for the growth phase dependent expression is that ComK expressing cells are unable to divide. However, preliminary time lapse microscopy experiments showed a strong induction in the number of ComK expressing cells after the logarithmic growth phase has ceased. A more plausible explanation is that the exponential increase in cell volume during logarithmic growth dilutes any ComK that is expressed, and only when growth slows down will ComK accumulate to levels necessary to pass the threshold level required for auto-activation [48].
Optimal induction of competence in B. subtilis occurs in minimal medium with glucose as energy source. In contrast to this, in rich Luria Broth (LB) medium almost no competent cells can be detected [49]. Surprisingly, activation of the artificial ComK feedback loop is still medium dependent and clearly more efficient in minimal competence medium rather than in rich medium, even when kre is absent (Fig 2). One key difference between LB and minimal competence medium is the presence of glucose. Interestingly, when glucose was added to LB medium, there was a substantial increase in cells activating the artificial bimodal ComK loop (S2 Table). There is an intriguing link between glycolysis and the cellular RNA processing and degradation machinery [50,51]. The core of the RNA degradosome in B. subtilis exists of the essential endoribonuclease RNase Y that forms a complex with other RNases, including PnpA, and the RNA helicase CshA. Importantly, the glycolytic enzymes enolase and phosphofructokinase are also part of this large protein complex [52]. This interaction is found in many other bacterial species [53]. It is as yet unknown how these glycolytic enzymes influence the RNA degradosome activity, but it might provide a clue for the glucose dependent regulation of competence.
Here, we have described a new level of regulation of a well-known bimodal developmental pathway. Further research is required to elucidate the molecular mechanism of action of Kre and to identify its functional partners. However, it is clear that the role of mRNA stability in noise control may play a more significant role than previously appreciated.
Materials and Methods
Bacterial strains and growth conditions
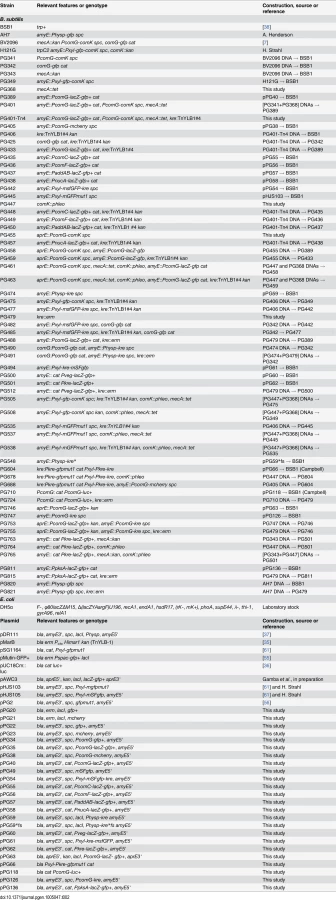
Strains and plasmids used in this study are listed in Table 2. All the B. subtilis strains were derivatives of BSB1, a tryptophan-prototrophic (trp+) derivative of the 168 trpC2 strain [38]. B. subtilis strains were grown at 30°C or 37°C on Nutrient agar plates (Oxoid), or in liquid LB or competence medium (78 mM K2HPO4, 42.8 mM KH2PO4, 14.7 mM (NH4)2SO4, 6.6 mM MgSO4, 3.3 mM Na3-citrate, 26.9 mM glucose, 95 μM tryptophan, 4.2 μM ferric ammonium citrate, 0.02% Casamino acids). Solid competence medium was prepared with 1.5% Purified Agar (Oxoid) and was supplemented with a mixture of 13 amino acids (Gly, Asn, Val, Glu, Leu, Asp, Ile, Pro, Phe, Ser, Ala, Thr, Gln) at a final concentration of 10 μg/ml each to improve growth. To relieve catabolite repression of the Pxyl promoter in competence medium, glucose was replaced by fructose [54]. For selection, nutrient agar plates were supplemented with 10 μg/ml tetracycline, 5 μg/ml chloramphenicol, 50 μg/ml spectinomycin, 5 μg/ml kanamycin, 1 μg/ml phleomycin or 0.5 μg/ml erythromycin together with 25 μg/ml lincomycin. Xylose and IPTG were used as inducers at concentrations of 0.05–0.1% and 50 μM-1 mM respectively. E. coli was used as cloning intermediate.
Construction of plasmids
Molecular cloning, PCRs and E. coli transformations were carried out using standard techniques. Oligonucleotides used in this study are listed in S3 Table. Plasmids pPG22 and pPG23 were used to construct promoter-gfp and promoter-mcherry fusions, respectively, at the amyE locus. Plasmid pMutin-GFP+ [55] contains a gfp reporter with three terminators (t1, t2, t0 from the rrnB operon of E. coli) upstream the multiple cloning site in front of gfp and a trpA terminator downstream of gfp. pMutin-GFP+ was amplified with primers PG187 and PG188 in order to remove the Pspac promoter and to introduce 5 unique restriction sites in the multiple cloning site (AgeI, BglII, PmlI, BlnI, SacII). Digestion with PmlI and subsequent self-ligation resulted in plasmid pPG20. The gfp region with terminators was amplified from pPG20 with primers PG195 and PG196, digested with ApaI and NotI and ligated into a similarly cut amyE-integration vector pPG2 [56], obtaining plasmid pPG22. To construct plasmid pPG23, the mcherry gene from plasmid pHM232 [57], was amplified with primers PG189 and PG190, digested with EagI and SpeI and inserted into pPG20, obtaining pPG21. The mcherry region with terminators was amplified from pPG21 with primers PG195 and PG196 and, after digestion, ligated into pPG2, obtaining pPG23.
comG promoter reporters were constructed by amplifying the comG promoter region with primers PG201 and PG202 and genomic DNA of strain 168 as template. PCR fragments were digested with BglII and BlnI and ligated into digested pPG22 or pPG23, resulting in plasmids pPG34 and pPG38, respectively. To construct the lacZ-gfp+ operon reporter for transposon screening, the lacZ sequence was amplified from pMutin4 [58] with primers PG203 and PG204, digested with SacII and KpnI and ligated to a similarly cut pPG34, resulting in plasmid pPG35. Plasmid pPG40 was derived from pPG35 by replacing the spectinomycin resistance marker with the chloramphenicol resistance cassette cat from pSG1186 [59], which was amplified with primers PG209 and PG210, digested with SphI and XmaI and ligated to pPG35. To integrate a PcomG-lacZ-gfp+ reporter at the aprE genomic locus, plasmid pPG63 was constructed by amplifying the comG promoter with primers PG330 and PG202, and ligating it to pAWC3, a plasmid based on pAPNC213 [60] that carries the lacZ-gfp+ operon (Gamba et al., in preparation), after digestion with XbaI and BlnI. For the luciferase reporter fusion (PcomG-luc+), plasmid pPG118 was constructed by amplifying the comG promoter with primers PG418 and PG419, subsequent digestion with HindIII and BamHI and ligation into pUC18Cm::luc [36].
Inducible GFP fusions of Kre to msfGFP (monomeric superfolder GFP) were made at the N-terminal or C-terminal end of the protein by cloning the coding sequence of kre into plasmids pHJS105 and pPG49, respectively. To make an N-terminal fusion, kre was amplified with primers PG287 and PG288, digested with BamHI and EcoRI, and ligated to pHJS105, resulting in plasmid pPG54. To make a C-terminal fusion, plasmid pPG49 was first constructed by amplifying mSFgfp from pHJS105 with primers PG279 and PG280, digesting the fragment with SacII and SpeI, and ligating it to the gel-extracted backbone of pPG22. Then, Pxyl promoter and kre coding sequences were introduced at the same time into pPG49 with a double ligation step. Pxyl was amplified with primers PG320 and PG321 from pSG1729 and digested with BglII-BlnI, while the kre gene was amplified with primers PG319 and PG282 and digested BlnI-SacII. The two fragments were ligated to a BglII-SacII cut pPG49, obtaining plasmid pPG61.
Reporter fusions with the promoters of other competence genes were made by amplifying the promoter regions of comC, comF, addAB and nucA with primer pairs PG289-PG290, PG291-PG292, PG293-PG294, PG295-PG296, respectively. After digestion with BglII and BlnI the promoter regions were ligated into pPG40, resulting in plasmids pPG55, pPG56, pPG57 and pPG58 respectively.
For overexpression of Kre, kre was cloned behind the strong IPTG inducible hyperspank promoter (Physp). The kre coding sequence was amplified with primers PG299 and PG300, digested with SalI and SphI and ligated into pDR111 [37], resulting in plasmid pPG59. Plasmid pPG59*fs is a variant of pPG59 with a mutation in the ATG start codon of the kre coding sequence, which becomes ATAG. This plasmid was obtained by amplifying plasmid pPG59 with oligonucleotides PG332-PG333, which carry the desired mutation. To create a Pkre-lacZ-gfp reporter fusion, the promoter region of kre was amplified with primers PG322 and PG323 and, after digestion with AgeI and BlnI, ligated into pPG40 from which the PcomG promoter region had been removed by extraction of the cut plasmid form agarose gel, resulting in plasmid pPG62. Plasmid pPG66 was made to create a Pkre-gfp promoter fusion at the kre locus by means of homologous Campbell-type integration. The plasmid was constructed by amplifying the promoter region of kre and its ribosome binding site with primers PG334 and PG336, digested with KpnI and PstI and ligation into pSG1164 [61]. To create a kre gene under expression of PcomG, plasmid pPG34 was digested with BlnI and SpeI and gel extracted to remove the gfp fragment. The plasmid backbone was then ligated with the kre gene that was amplified with PG319 and PG438 from genomic template DNA, resulting in plasmid pPG126.
lacZ-reporter fusions with veg and pksA promoters were made as follow. The promoter region of veg, was amplified using primers PG317 and PG318 and, after digestion with BglII and BglI, ligated into pPG40 from which the PcomG promoter fragment was removed by extraction of the cut plasmid form agarose gel. The resulting plasmid was labelled pPG60. The promoter region of pksA was amplified with primers PG509 and PG510, digested with BglII and BglI and ligated into pPG60 from which the Pveg promoter fragment was removed by extraction of the cut plasmid form agarose gel. The resulting plasmid was named pPG136.
Construction of B. subtilis strains
To construct strain PG368 (mecA::tet), 2.5 kb regions upstream and downstream of mecA were amplified with primer pairs PG223-PG224 and PG225-PG226, and subsequently digested with BlnI or XhoI respectively. A tetracycline resistance cassette was amplified from pBEST309 [62] with primer pairs PG221-PG222, digested with BlnI and XhoI and ligated to the digested upstream and downstream amplified fragments. Competent B. subtilis cells were transformed directly with the ligation products and mutants were verified with PCR. To construct strain PG447 (comK::phleo), regions upstream and downstream of comK were amplified with primer pairs PG211-PG212 and PG213-PG214, and subsequently digested with NcoI or BamHI, respectively. A phleomycin resistance cassette was amplified from plasmid pIC22 [63] with primers PG215 and PG216, and digested with the corresponding restriction enzymes prior to ligation. Mutants were verified by PCR and by checking the loss of transformability. To construct strain PG455 (aprE::spc PcomG-comK), the PcomG-comK region, including the spc resistance cassette, was amplified from chromosomal DNA of strain PG401 with primers PG269 and PG270. Next, 2 kb fragments comprising the 5’ or 3’ half of the aprE gene were amplified with primer pairs PG271-PG272 and PG273-PG274, respectively. The three fragments were digested with BamHI, ligated and transformed to strain BSB1. Integration was verified with PCR and by sequencing. To construct strain PG479 (kre::erm), regions upstream and downstream of kre were amplified with primer pairs PG306-PG307 and PG308-PG309, and subsequently digested with BamHI and NcoI, respectively. An erythromycin resistance cassette was amplified from pMutin4 [58] with primer pair PG312-PG313, and digested with the corresponding enzymes prior to ligation.
Transposon mutagenesis screen
Random transposon mutagenesis of strain PG401 (PcomG-comK, ΔmecA, PcomG-lacZ-gfp) was carried out using the mariner transposable element TnYLB-1 [35]. PG401 is not transformable, therefore plasmid pMarB was introduced by protoplast transformation using standard protocols. Individual colonies carrying the transposon plasmid were picked and grown in LB at 30°C for 6 h. Aliquots were frozen and stored at -80°C. Serial dilutions of each culture were plated on Nutrient agar plates containing kanamycin or erythromycin and incubated at 50°C overnight to induce transposition. The following day, the clone with the highest ratio of kanR/ermR colonies, indicative of efficient transposition [35], was chosen for further experiments. An aliquote of the selected clone was diluted and plated on Nutrient agar plates, and incubated at 50°C to construct a library of approximately 45,000 transposon colonies. The colonies were then scraped off the plates, aliquoted and frozen. About 30,000 clones of the library were plated on Nutrient agar plates supplemented with 160 μg/ml X-gal and incubated at 37°C for 24 hours. Colonies showing an intense blue colour were reisolated, checked for integration of the transposon (kanR) and loss of the plasmid (ermS), and inspected by fluorescence microscopy to assess the frequency of GFP-expressing cells. Two rounds of backcrosses were performed: First, chromosomal DNA of the selected mutant strains was transformed into strain PG389 (PcomG-lacZ-gfp). The resulting strains were transformed with chromosomal DNA of PG401 so to introduce simultaneously the PcomG-comK and ΔmecA mutations and reconstitute the artificial ComK feedback loop. Chromosomal DNA from colonies that still showed an increase frequency of competent cells on nutrient agar was then re-introduced into PG401 by SPP1 phage transduction [64]. Transposon insertions were located by arbitrary PCR followed by sequencing.
Microscopic imaging and GFP measurements
Cells were mounted on microscope slides coated with a thin layer of 1.2% agarose. Images were acquired with a Zeiss Axiovert 200M or a Nikon T1 microscope coupled to a Sony Cool-Snap HQ cooled CCD camera (Roper Scientific), and using Metamorph imaging software (Universal Imaging). Images were analysed and prepared for publication with ImageJ [65].
Initially (S2 Table and Figs 3, 8, S1, S2, and S6), GFP intensities of individual cells were measured manually with ImageJ [65], and subtracted by background GFP intensity levels, measured for each image. In later experiments (Figs 4 and 5), an in house developed ImageJ plugin (NucTracer (Syvertsson and Hamoen)) was used to semi-automatically determine cellular GFP levels. NucTracer, which uses nucleoids as region of interest (ROI) to measure GFP intensities, was employed to determine the GFP-ComK signals in Fig 4B. NucTracer was also used in Fig 5A and 5B, but here nucleoids were outlined with DAPI staining. To this end, the Pxyl-gfp and Physp-gfp reporter containing cells were grown in LB at 37°C in the presence or absence of 0.1% xylose or 50 μM IPTG, respectively. When cultures reached O.D.600 of ~0.2, aliquots were concentrated 4 times in PBS supplemented with 2 μg/ml DAPI and transferred onto microscope slides.
To determine the fraction of ComK expressing cells using the PcomG-GFP reporter, a threshold value, generally 100 or 200 A.U., was used to separate cells in expressing and non-expressing categories. This threshold value is well above (~ 3 to 5 times) the fluorescent level of wild type (non GFP-expressing) cells.
Luciferase assay
Overnight cultures in competence medium were diluted 20 fold in fresh medium and grown at 37°C until OD600 0.1, then diluted 10 fold and 150 μl distributed into a black 96-well plate. Beetle Luciferin (Potassium salt, Promega) was added to a final concentration of 1.5 mg/ml (4.7 mM), and the cultures were incubated at 37°C in a FluoStar Optima plate reader (BMG-LabTech). Relative luminescence units (R.L.U.) and OD600 were measured with 10 min time intervals.
Transformation of competent B. subtilis strains
Transformation of competent B. subtilis cells was performed using a two-step starvation procedure [4,49]. Briefly, overnight cultures were diluted 10 fold in 10 ml competence medium and incubated at 37°C under vigorous shaking. After 3 hours of growth, an equal volume of prewarmed “starvation medium” (competence medium lacking tryptophan, Cas aminoacids and ferric ammonium citrate) was added and incubation was continued for another 2 hours, prior to DNA addition. DNA was added to 400 μl aliquots, and incubation was prolonged for 1 hour at 37°C prior to plating onto selective nutrient agar plates.
DNA transformation frequency assay
Transformation frequency was determined by transforming competent cultures with genomic DNA carrying an antibiotic resistance marker. To test the transformation frequency of a kre mutant compared to the wild type strain BSB1, exponentially growing cultures were diluted to OD600 ~ 0.01 in warm competence medium and grown at 37°C. The optical density of the cultures was measured at regular intervals. At the time of transition to stationary phase (T0), as well as 1 and 2 hours afterwards, DNA was added to 400 μl aliquots to a final concentration of 2.5 μg/ml, and incubation was prolonged for 1 hour at 37°C. Serial dilutions were plated on selective and unselective LB plates respectively. Transformation frequencies were calculated as 100 x (transformants/ml / CFU/ml). Relative transformation frequencies were normalized to the frequency of wild type strain. To test the transformation frequency upon kre overexpression, overnight cultures were diluted 10 fold in the presence or in the absence of 1 mM IPTG and the protocol used for routine transformations was followed as described in the previous section. DNA was added at a final concentration of 2 μg/ml.
Western blotting
Exponentially growing cultures were diluted to OD600 ~ 0.01 in warm competence medium and incubated at 37°C. Optical density was measured at regular intervals and 1 ml samples were collected, spun down and flash frozen in liquid nitrogen at the time of transition to stationary phase (T0) and 1, 2, 4 hours after that time point. Incubation was prolonged overnight and one last sample (Ton) was collected the following morning. Cell pellets were resuspended in 100 μl of lysis buffer (100 mM Tris-Cl pH 7.5, 2 mM EDTA, supplemented with Roche Complete mini protease inhibitor) containing 10 μg/ml lysozyme, incubated 10 min at 37°C and then sonicated. Cell debris were removed by centrifugation. Relative protein concentrations were estimated with a Bio-Rad protein assay and equal amount of proteins were loaded on NuPAGE 4–12% Bis-Tris gradient gels which were run in MES buffer (Life Technologies). Proteins were transferred onto a Hybond-P PVDF membrane (GE Healthcare) by using a wet procedure and western blotting was performed according to standard methods. A 1 : 5,000 dilution of rabbit polyclonal anti-ComK serum was used. Anti-rabbit horseradish peroxidase-linked antiserum (Sigma) was used as secondary antibody at a dilution of 1 : 10,000. Protein bands were detected using an ImageQuant LAS 4000 mini digital imaging system (GE Healthcare).
Flow cytometry
Overnight cultures grown at 37°C in fructose-based competence medium were washed in 0.2 μM filtered starvation medium, stained with the red-fluorescent membrane dye FM5-95, diluted 300 fold in filtered starvation medium and directly analyzed on a CyFlow Space flow cytometer (Partec). Cell particles were selected based on the red-fluorescent signal. For each sample, 200,000 cells were analyzed and GFP signals were collected. Data were captured using FlowMax software (Quantum Analysis GmbH) and further analyzed using Cyflogic software (http://www.cyflogic.com), which was also used for graph preparation.
β-galactosidase activity assay
β-galactosidase assays were performed in exponentially growing cultures as described by Daniel et al. [66] and the units of enzymatic activity calculated as described by Miller [67].
Transcriptome experiment
To analyse the differences in transcriptome expression between wild-type B. subtilis (strain 168) and the kre mutant (PG479), microarray analyses were performed using an 8x15k Custom Agilent microarray. The NCBI annotation BSU41030 B. subtilis subsp. subtilis str. 168, complete genome, 2006-05-02 GenBank, containing information for 4105 transcripts, was used to design three probes per transcript. To isolate RNA, cell pellets were flash frozen in liquid nitrogen immediately after harvesting and stored at -80°C. Frozen pellets were grounded and subjected to RNA extraction as described previously [68], yielding RIN values of ≥ 9.6. Labeling was performed by reverse transcription using random octamers, incorporating Cy3 for the test samples and Cy5 for the common reference, as described [69]. The common reference was a pool of equal amounts of total RNA taken from all test samples. Hybridization, washing, and scanning was performed as described in the Two-Color Microarray-Based Gene Expression Analysis manual (Version 6.6, Agilent Technologies). Briefly, hybridization mixtures were made by combining 300 ng test (Cy3) and 300 ng common reference (Cy5) material and were subsequently hybridized to the Agilent SurePrint Custom 8x15k microarrays G2509F (Agilent Technologies). Two biological replicates were used for strain 168, while three biological replicates were used for strain PG479. The raw and normalized data from all arrays were subjected to various quality control checks [68]. Normalized expression values were calculated by using the robust multi-array average (RMA) algorithm [70], collecting and summarizing the intensity values of probes associated with a specific BSU locus tag. Differences in gene expression between wild-type and the kre mutant strain (PG479) were statistically analysed using the Limma package in R 2.14.1 (http://cran.r-project.org/). Empirical Bayes test statistics were used for calculating P-values [71], and for calculating false discovery rate corrected P-values [72]. Gene expression data and array design have been deposited at the public repository Gene Expression Omnibus, accession number GSE61757.
Quantitative real-time PCR (qPCR)
Cultures were grown in LB at 37°C and, at O.D.600 ~0.25, 5 ml volumes were spun at 6,000 rpm for 4 min and flash frozen in liquid nitrogen. Samples were processed with FastRNA Pro kit (MP Biomedicals), cell disruption was achieved by shaking samples 4 times per 20 seconds at 6,000 rpm in a Precellys24 Tissue homogenizer (Bertin technologies). RNA was further purified with Qiagen RNeasy kit. Total RNA (0.2 μg) was retro-transcribed using Multiscribe reverse transcriptase and a High-Capacity cDNA reverse transcription kit (Applied Biosystems). cDNA samples were diluted 1 : 24 and 6 μl was added to 10 μl GoTaq qPCR Master Mix (Promega) and 2 μl of each primer stock (final concentration of 0.5 μM for each primer). qPCR was performed on a Rotor-Gene Q cycler (QIAGEN) with 40 cycles of 5 s at 95°C and 10 s at 60°C. Cycle threshold (CT) values were obtained according to the software instructions. Relative quantification was performed with the 2-ΔΔCT method [73]. pfkA mRNA levels were used as normalizer in Fig 6A. Changes in expression given are the average of 3 biological replicates, and the differences were statistically tested using an ANOVA model with coefficients for strain and replicate batch [74]. Oligonucleotides pairs used for qPCR were PG475-PG476 (pfkA), PG456-PG474 (veg), PG466-PG486 (pksA), PG495-PG496 (ftsZ), PG489-PG490 (comK) and PG471-PG472 (kre), and their sequences are listed in S3 Table.
mRNA stability assay
Strains PG500 (amyE::Pveg-lacZ-gfp), PG512 (amyE::Pveg-lacZ-gfp, Δkre) and PG474 (amyE::Physp-kre) were grown in LB at 37°C. At O.D.600 of ~0.2, T0 samples were collected (1 ml) and rifampicin added to a final concentration of 150 μg/ml. Samples were taken at time intervals (minutes) after rifampicin addition, and immediately stabilized by mixing them with equal volumes of RNAlater solution (Ambion). RNA was isolated and quantified using qPCR. Abundance of comK and ftsZ transcripts relative to the T0 sample was calculated with the 2ΔCT equation, and average values and standard deviations were calculated from 3 biological replicates. mRNA half-lives were determined from an exponential fit to a plot of relative mRNA abundance versus time. The logit transformed relative mRNA abundances were subjected to an ANOVA, to test for differences at each time point. The p-values were corrected for false discoveries using Benjamini-Hochberg correction. Calculations were carried out using Microsoft Excel and R statistical software (http://cran.r-project.org/).
Supporting Information
Zdroje
1. Lopez D, Kolter R (2010) Extracellular signals that define distinct and coexisting cell fates in Bacillus subtilis. FEMS Microbiol Rev 34 : 134–149. doi: 10.1111/j.1574-6976.2009.00199.x 20030732
2. Veening JW, Smits WK, Kuipers OP (2008) Bistability, epigenetics, and bet-hedging in bacteria. Annu Rev Microbiol 62 : 193–210. doi: 10.1146/annurev.micro.62.081307.163002 18537474
3. van Sinderen D, Luttinger A, Kong L, Dubnau D, Venema G, et al. (1995) comK encodes the competence transcription factor, the key regulatory protein for competence development in Bacillus subtilis. Mol Microbiol 15 : 455–462. 7783616
4. Hamoen LW, Smits WK, de Jong A, Holsappel S, Kuipers OP (2002) Improving the predictive value of the competence transcription factor (ComK) binding site in Bacillus subtilis using a genomic approach. Nucleic Acids Res 30 : 5517–5528. 12490720
5. Ogura M, Yamaguchi H, Kobayashi K, Ogasawara N, Fujita Y, et al. (2002) Whole-genome analysis of genes regulated by the Bacillus subtilis competence transcription factor ComK. J Bacteriol 184 : 2344–2351. 11948146
6. Berka RM, Hahn J, Albano M, Draskovic I, Persuh M, et al. (2002) Microarray analysis of the Bacillus subtilis K-state: genome-wide expression changes dependent on ComK. Mol Microbiol 43 : 1331–1345. 11918817
7. Smits WK, Eschevins CC, Susanna KA, Bron S, Kuipers OP, et al. (2005) Stripping Bacillus: ComK auto-stimulation is responsible for the bistable response in competence development. Mol Microbiol 56 : 604–614. 15819618
8. Maamar H, Dubnau D (2005) Bistability in the Bacillus subtilis K-state (competence) system requires a positive feedback loop. Mol Microbiol 56 : 615–624. 15819619
9. Leisner M, Stingl K, Radler JO, Maier B (2007) Basal expression rate of comK sets a 'switching-window' into the K-state of Bacillus subtilis. Mol Microbiol 63 : 1806–1816. 17367397
10. Maamar H, Raj A, Dubnau D (2007) Noise in gene expression determines cell fate in Bacillus subtilis. Science 317 : 526–529. 17569828
11. Ferrell JE Jr. (2002) Self-perpetuating states in signal transduction: positive feedback, double-negative feedback and bistability. Curr Opin Cell Biol 14 : 140–148. 11891111
12. Losick R, Desplan C (2008) Stochasticity and cell fate. Science 320 : 65–68. doi: 10.1126/science.1147888 18388284
13. Kearns DB, Losick R (2005) Cell population heterogeneity during growth of Bacillus subtilis. Genes Dev 19 : 3083–3094. 16357223
14. Veening JW, Igoshin OA, Eijlander RT, Nijland R, Hamoen LW, et al. (2008) Transient heterogeneity in extracellular protease production by Bacillus subtilis. Mol Syst Biol 4 : 184. doi: 10.1038/msb.2008.18 18414485
15. Veening JW, Stewart EJ, Berngruber TW, Taddei F, Kuipers OP, et al. (2008) Bet-hedging and epigenetic inheritance in bacterial cell development. Proc Natl Acad Sci U S A 105 : 4393–4398. doi: 10.1073/pnas.0700463105 18326026
16. Diard M, Garcia V, Maier L, Remus-Emsermann MN, Regoes RR, et al. (2013) Stabilization of cooperative virulence by the expression of an avirulent phenotype. Nature 494 : 353–356. doi: 10.1038/nature11913 23426324
17. Mikeladze-Dvali T, Wernet MF, Pistillo D, Mazzoni EO, Teleman AA, et al. (2005) The growth regulators warts/lats and melted interact in a bistable loop to specify opposite fates in Drosophila R8 photoreceptors. Cell 122 : 775–787. 16143107
18. Elowitz MB, Levine AJ, Siggia ED, Swain PS (2002) Stochastic gene expression in a single cell. Science 297 : 1183–1186. 12183631
19. Haijema BJ, Hahn J, Haynes J, Dubnau D (2001) A ComGA-dependent checkpoint limits growth during the escape from competence. Mol Microbiol 40 : 52–64. 11298275
20. Briley K Jr., Prepiak P, Dias MJ, Hahn J, Dubnau D (2011) Maf acts downstream of ComGA to arrest cell division in competent cells of B. subtilis. Mol Microbiol 81 : 23–39. doi: 10.1111/j.1365-2958.2011.07695.x 21564336
21. Hoa TT, Tortosa P, Albano M, Dubnau D (2002) Rok (YkuW) regulates genetic competence in Bacillus subtilis by directly repressing comK. Mol Microbiol 43 : 15–26. 11849533
22. Hamoen LW, Kausche D, Marahiel MA, van Sinderen D, Venema G, et al. (2003) The Bacillus subtilis transition state regulator AbrB binds to the -35 promoter region of comK. FEMS Microbiol Lett 218 : 299–304. 12586407
23. Serror P, Sonenshein AL (1996) CodY is required for nutritional repression of Bacillus subtilis genetic competence. J Bacteriol 178 : 5910–5915. 8830686
24. Mirouze N, Desai Y, Raj A, Dubnau D (2012) Spo0A~P imposes a temporal gate for the bimodal expression of competence in Bacillus subtilis. PLoS Genet 8: e1002586. doi: 10.1371/journal.pgen.1002586 22412392
25. Hamoen LW, Van Werkhoven AF, Venema G, Dubnau D (2000) The pleiotropic response regulator DegU functions as a priming protein in competence development in Bacillus subtilis. Proc Natl Acad Sci U S A 97 : 9246–9251. 10908654
26. Hamoen LW, Venema G, Kuipers OP (2003) Controlling competence in Bacillus subtilis: shared use of regulators. Microbiology 149 : 9–17. 12576575
27. Smits WK, Hoa TT, Hamoen LW, Kuipers OP, Dubnau D (2007) Antirepression as a second mechanism of transcriptional activation by a minor groove binding protein. Mol Microbiol 64 : 368–381. 17493123
28. Ogura M, Tanaka T (1996) Bacillus subtilis DegU acts as a positive regulator for comK expression. FEBS Lett 397 : 173–176. 8955341
29. Turgay K, Hahn J, Burghoorn J, Dubnau D (1998) Competence in Bacillus subtilis is controlled by regulated proteolysis of a transcription factor. Embo J 17 : 6730–6738. 9890793
30. Turgay K, Hamoen LW, Venema G, Dubnau D (1997) Biochemical characterization of a molecular switch involving the heat shock protein ClpC, which controls the activity of ComK, the competence transcription factor of Bacillus subtilis. Genes Dev 11 : 119–128. 9000055
31. D'Souza C, Nakano MM, Zuber P (1994) Identification of comS, a gene of the srfA operon that regulates the establishment of genetic competence in Bacillus subtilis. Proc Natl Acad Sci U S A 91 : 9397–9401. 7937777
32. Hamoen LW, Eshuis H, Jongbloed J, Venema G, van Sinderen D (1995) A small gene, designated comS, located within the coding region of the fourth amino acid-activation domain of srfA, is required for competence development in Bacillus subtilis. Mol Microbiol 15 : 55–63. 7752896
33. van Sinderen D, Venema G (1994) comK acts as an autoregulatory control switch in the signal transduction route to competence in Bacillus subtilis. J Bacteriol 176 : 5762–5770. 8083168
34. Hamoen LW, Van Werkhoven AF, Bijlsma JJ, Dubnau D, Venema G (1998) The competence transcription factor of Bacillus subtilis recognizes short A/T-rich sequences arranged in a unique, flexible pattern along the DNA helix. Genes Dev 12 : 1539–1550. 9585513
35. Le Breton Y, Mohapatra NP, Haldenwang WG (2006) In vivo random mutagenesis of Bacillus subtilis by use of TnYLB-1, a mariner-based transposon. Appl Environ Microbiol 72 : 327–333. 16391061
36. Mirouze N, Prepiak P, Dubnau D (2011) Fluctuations in spo0A transcription control rare developmental transitions in Bacillus subtilis. PLoS Genet 7: e1002048. doi: 10.1371/journal.pgen.1002048 21552330
37. Ben-Yehuda S, Rudner DZ, Losick R (2003) RacA, a bacterial protein that anchors chromosomes to the cell poles. Science 299 : 532–536. 12493822
38. Nicolas P, Mader U, Dervyn E, Rochat T, Leduc A, et al. (2012) Condition-dependent transcriptome reveals high-level regulatory architecture in Bacillus subtilis. Science 335 : 1103–1106. doi: 10.1126/science.1206848 22383849
39. Charoensawan V, Wilson D, Teichmann SA (2010) Genomic repertoires of DNA-binding transcription factors across the tree of life. Nucleic Acids Res 38 : 7364–7377. doi: 10.1093/nar/gkq617 20675356
40. Fukushima T, Ishikawa S, Yamamoto H, Ogasawara N, Sekiguchi J (2003) Transcriptional, functional and cytochemical analyses of the veg gene in Bacillus subtilis. J Biochem 133 : 475–483. 12761295
41. Hahn J, Bylund J, Haines M, Higgins M, Dubnau D (1995) Inactivation of mecA prevents recovery from the competent state and interferes with cell division and the partitioning of nucleoids in Bacillus subtilis. Mol Microbiol 18 : 755–767. 8817496
42. Suel GM, Garcia-Ojalvo J, Liberman LM, Elowitz MB (2006) An excitable gene regulatory circuit induces transient cellular differentiation. Nature 440 : 545–550. 16554821
43. Konkol MA, Blair KM, Kearns DB (2013) Plasmid-encoded ComI inhibits competence in the ancestral 3610 strain of Bacillus subtilis. J Bacteriol 195 : 4085–4093. doi: 10.1128/JB.00696-13 23836866
44. Oussenko IA, Abe T, Ujiie H, Muto A, Bechhofer DH (2005) Participation of 3'-to-5' exoribonucleases in the turnover of Bacillus subtilis mRNA. J Bacteriol 187 : 2758–2767. 15805522
45. Luttinger A, Hahn J, Dubnau D (1996) Polynucleotide phosphorylase is necessary for competence development in Bacillus subtilis. Mol Microbiol 19 : 343–356. 8825779
46. Lehnik-Habrink M, Pfortner H, Rempeters L, Pietack N, Herzberg C, et al. (2010) The RNA degradosome in Bacillus subtilis: identification of CshA as the major RNA helicase in the multiprotein complex. Mol Microbiol 77 : 958–971. doi: 10.1111/j.1365-2958.2010.07264.x 20572937
47. Wurtmann EJ, Ratushny AV, Pan M, Beer KD, Aitchison JD, et al. (2014) An evolutionarily conserved RNase-based mechanism for repression of transcriptional positive autoregulation. Mol Microbiol 92 : 369–382. doi: 10.1111/mmi.12564 24612392
48. Klumpp S, Zhang Z, Hwa T (2009) Growth rate-dependent global effects on gene expression in bacteria. Cell 139 : 1366–1375. doi: 10.1016/j.cell.2009.12.001 20064380
49. Anagnostopoulos C, Spizizen J (1961) Requirements for Transformation in Bacillus subtilis. J Bacteriol 81 : 741–746. 16561900
50. Commichau FM, Rothe FM, Herzberg C, Wagner E, Hellwig D, et al. (2009) Novel activities of glycolytic enzymes in Bacillus subtilis: interactions with essential proteins involved in mRNA processing. Mol Cell Proteomics 8 : 1350–1360. doi: 10.1074/mcp.M800546-MCP200 19193632
51. Newman JA, Hewitt L, Rodrigues C, Solovyova AS, Harwood CR, et al. (2012) Dissection of the network of interactions that links RNA processing with glycolysis in the Bacillus subtilis degradosome. J Mol Biol 416 : 121–136. doi: 10.1016/j.jmb.2011.12.024 22198292
52. Lehnik-Habrink M, Lewis RJ, Mader U, Stulke J (2012) RNA degradation in Bacillus subtilis: an interplay of essential endo - and exoribonucleases. Mol Microbiol 84 : 1005–1017. doi: 10.1111/j.1365-2958.2012.08072.x 22568516
53. Nurmohamed S, McKay AR, Robinson CV, Luisi BF (2010) Molecular recognition between Escherichia coli enolase and ribonuclease E. Acta Crystallogr D Biol Crystallogr 66 : 1036–1040. doi: 10.1107/S0907444910030015 20823555
54. Hahn J, Luttinger A, Dubnau D (1996) Regulatory inputs for the synthesis of ComK, the competence transcription factor of Bacillus subtilis. Mol Microbiol 21 : 763–775. 8878039
55. Kaltwasser M, Wiegert T, Schumann W (2002) Construction and application of epitope - and green fluorescent protein-tagging integration vectors for Bacillus subtilis. Appl Environ Microbiol 68 : 2624–2628. 11976148
56. Gamba P, Veening JW, Saunders NJ, Hamoen LW, Daniel RA (2009) Two-step assembly dynamics of the Bacillus subtilis divisome. J Bacteriol 191 : 4186–4194. doi: 10.1128/JB.01758-08 19429628
57. Murray H, Errington J (2008) Dynamic control of the DNA replication initiation protein DnaA by Soj/ParA. Cell 135 : 74–84. doi: 10.1016/j.cell.2008.07.044 18854156
58. Vagner V, Dervyn E, Ehrlich SD (1998) A vector for systematic gene inactivation in Bacillus subtilis. Microbiology 144 (Pt 11): 3097–3104. 9846745
59. Feucht A, Lewis PJ (2001) Improved plasmid vectors for the production of multiple fluorescent protein fusions in Bacillus subtilis. Gene 264 : 289–297. 11250085
60. Morimoto T, Loh PC, Hirai T, Asai K, Kobayashi K, et al. (2002) Six GTP-binding proteins of the Era/Obg family are essential for cell growth in Bacillus subtilis. Microbiology 148 : 3539–3552. 12427945
61. Lewis PJ, Marston AL (1999) GFP vectors for controlled expression and dual labelling of protein fusions in Bacillus subtilis. Gene 227 : 101–110. 9931458
62. Itaya M (1992) Construction of a novel tetracycline resistance gene cassette useful as a marker on the Bacillus subtilis chromosome. Biosci Biotechnol Biochem 56 : 685–686. 1368214
63. Steinmetz M, Richter R (1994) Plasmids designed to alter the antibiotic resistance expressed by insertion mutations in Bacillus subtilis, through in vivo recombination. Gene 142 : 79–83. 8181761
64. Kearns DB, Chu F, Branda SS, Kolter R, Losick R (2005) A master regulator for biofilm formation by Bacillus subtilis. Mol Microbiol 55 : 739–749. 15661000
65. Schneider CA, Rasband WS, Eliceiri KW (2012) NIH Image to ImageJ: 25 years of image analysis. Nat Methods 9 : 671–675. 22930834
66. Daniel RA, Williams AM, Errington J (1996) A complex four-gene operon containing essential cell division gene pbpB in Bacillus subtilis. J Bacteriol 178 : 2343–2350. 8636036
67. Miller JH (1972) Experiments in molecular genetics. Cold Spring Harbor Laboratory Press, Cold Spring Harbor, NY.
68. Surdova K, Gamba P, Claessen D, Siersma T, Jonker MJ, et al. (2013) The conserved DNA-binding protein WhiA is involved in cell division in Bacillus subtilis. J Bacteriol 195 : 5450–5460. doi: 10.1128/JB.00507-13 24097947
69. de Knegt GJ, Bruning O, ten Kate MT, de Jong M, van Belkum A, et al. (2013) Rifampicin-induced transcriptome response in rifampicin-resistant Mycobacterium tuberculosis. Tuberculosis (Edinb) 93 : 96–101.
70. Irizarry RA, Hobbs B, Collin F, Beazer-Barclay YD, Antonellis KJ, et al. (2003) Exploration, normalization, and summaries of high density oligonucleotide array probe level data. Biostatistics 4 : 249–264. 12925520
71. Smyth GK (2004) Linear models and empirical bayes methods for assessing differential expression in microarray experiments. Stat Appl Genet Mol Biol 3: Article3.
72. Benjamini Y, Hochberg Y (1995) Controlling the false discovery rate: a practical and powerful approach to multiple testing. Journal of the Royal Statistical Society Series B 57 : 289–300.
73. Livak KJ, Schmittgen TD (2001) Analysis of relative gene expression data using real-time quantitative PCR and the 2(-Delta Delta C(T)) Method. Methods 25 : 402–408. 11846609
74. Yuan JS, Reed A, Chen F, Stewart CN Jr. (2006) Statistical analysis of real-time PCR data. BMC Bioinformatics 7 : 85. 16504059
75. Szklarczyk D, Franceschini A, Kuhn M, Simonovic M, Roth A, et al. (2011) The STRING database in 2011: functional interaction networks of proteins, globally integrated and scored. Nucleic Acids Res 39: D561–568. doi: 10.1093/nar/gkq973 21045058
Štítky
Genetika Reprodukční medicínaČlánek vyšel v časopise
PLOS Genetics
2015 Číslo 6
- Kazuistika – Perspektivy využití precizované medicíny v rámci personalizované specifické terapie onkologických pacientů
- Nobelova cena za chemii pro genetické nůžky: Objev, který změní naši budoucnost?
- Technologie na bázi RNA v klinické praxi: od přebarvených petúnií k terapii vzácných a dosud jen obtížně léčitelných chorob u lidí
- „Nepředstavovali jsme si, že náš výzkum povede přímo ke vzniku nových léků, dokonce ještě za našeho života“
- Bezplatné služby pro diagnostiku ATTRv amyloidózy pro kardiology
Nejčtenější v tomto čísle
- Non-reciprocal Interspecies Hybridization Barriers in the Capsella Genus Are Established in the Endosperm
- Translational Upregulation of an Individual p21 Transcript Variant by GCN2 Regulates Cell Proliferation and Survival under Nutrient Stress
- Exome Sequencing of Phenotypic Extremes Identifies and as Interacting Modifiers of Chronic Infection in Cystic Fibrosis
- The Human Blood Metabolome-Transcriptome Interface
Zvyšte si kvalifikaci online z pohodlí domova
Mazová zátka a její řešení
nový kurzVšechny kurzy