
Obesity-Linked Homologues and Establish Meal Frequency in
The size of individual meals and feeding frequency are important for homeostatic control. Due to the complex neuroendocrine system regulating human food intake it is difficult to uncover the mechanisms underlying eating disorders. The genetically tractable model system Drosophila melanogaster has a comparatively simple brain; yet, similar to humans, its eating behavior can adapt to respond to nutritional needs. Our study describes how the obesity-linked homologues TfAP-2 (human TFAP2B) and Tiwaz (human KCTD15) regulate a unique feedback system involving noradrenalin-like octopamine and the CCK homolog Dsk, that exert positive and negative effects on Drosophila feeding behavior. Our findings provide insight into how two conserved obesity-linked genes regulate feeding behavior in order to maintain metabolic balance.
Published in the journal:
. PLoS Genet 10(9): e32767. doi:10.1371/journal.pgen.1004499
Category:
Research Article
doi:
https://doi.org/10.1371/journal.pgen.1004499
Summary
The size of individual meals and feeding frequency are important for homeostatic control. Due to the complex neuroendocrine system regulating human food intake it is difficult to uncover the mechanisms underlying eating disorders. The genetically tractable model system Drosophila melanogaster has a comparatively simple brain; yet, similar to humans, its eating behavior can adapt to respond to nutritional needs. Our study describes how the obesity-linked homologues TfAP-2 (human TFAP2B) and Tiwaz (human KCTD15) regulate a unique feedback system involving noradrenalin-like octopamine and the CCK homolog Dsk, that exert positive and negative effects on Drosophila feeding behavior. Our findings provide insight into how two conserved obesity-linked genes regulate feeding behavior in order to maintain metabolic balance.
Introduction
The human genes TFAP2B (encoding AP-2β) and KCTD15 were strongly linked to obesity in multiple genome-wide association studies (GWAS) [1]–[4], though it is still not understood how they regulate obesity. In the fruit fly Drosophila melanogaster, TFAP2B and KCTD15 are both highly conserved, encoded by TfAP-2 and Tiwaz (Twz), respectively [5]–[7]. Recently, it was shown in zebrafish embryos that Kctd15 interacts directly with AP-2α (Tfap2a) to inhibit AP-2α function, and in Drosophila there is evidence for an association between TfAP-2 and Twz [6], [8], [9]. TfAP-2 and Twz had a strong interaction in a large scale yeast two-hybrid screen using almost the entire Drosophila proteome [9]. Moreover, we have shown in adult males that TfAP-2 and Twz genetically interact to control aggressive behavior by regulating octopamine production and secretion, which in turn regulates the expression of the Drosophila cholecystokinin (CCK) homolog Drosulfakinin (Dsk) [6]. Interestingly, we demonstrated that overexpression of Dsk was sufficient to induce aggressive behavior in males.
CCK, a mammalian gastrointestinal hormone, is secreted by the gut when nutrients enter the lumen. After being released CCK binds to the cholecystokinin A receptor (CCKAR) located on vagal sensory terminals, this pathway delivers satiation signals to the nucleus of the solitary tract (NTS) to inhibit feeding [10], [11]. Similar to mammalian CCK, in Drosophila adults Dsk is necessary to inhibit overeating after starvation [12]. Furthermore, it was reported that Dsk is necessary in larvae and adult Drosophila to determine food palatability [12]. More recently, it was determined that octopamine also has an important role in determining the palatability of food [13]. These results led us to ask the following questions: Are TfAP-2 and Twz involved in regulating Drosophila adult feeding behavior? Does Dsk regulate normal ab lib feeding behavior? Do octopamine and Dsk interact to regulate feeding in adult flies?
Here, using genetic tools to manipulate their expression, we have investigated the function of TfAP-2 and Twz in the regulation of feeding behavior. Our data suggest that TfAP-2 and Twz control feeding through octopamine signaling. Furthermore, we demonstrate that octopamine and Dsk interact in a negative feedback loop to control the frequency of meals. Moreover, this function may be conserved in mammals, as we discovered that mouse AP-2β and Kctd15 proteins directly interact in a mouse hypothalamic cell line and co-localize in areas of the mouse brain involved in modulating feeding behavior. Finally, we demonstrate that similar to other members of their protein families both AP-2β and Kctd15 interact directly with the sumoylation enzyme Ube2i.
Results
Starvation and diet affect TfAP-2 and Twz transcription
Previously, we demonstrated that TfAP-2 and Twz function in octopaminergic neurons to regulate the expression of the Drosophila cholecystokinin (CCK) homologue Drosulfakinin (Dsk), via octopamine signaling [6]. It was reported that Dsk is involved in regulating consummatory behavior [12], to understand if TfAP-2 and Twz could also be involved in commsumatory behavior we performed qPCR to determine their transcript levels after different dietary regiments. Intriguingly, compared to flies fed ab lib, starving males for 24 h significantly increased TfAP-2 expression (1.66-fold, SE ±0.07, P<0.005) (Figure 1A), but not Twz expression. Starving the males for 48 h significantly increased the expression of both genes (Figure 1A). Next, we determined if macronutrient content influenced TfAP-2 and Twz expression. The transcript levels of TfAP-2 and Twz in males fed a normal diet (10 g·dl−1∶10 g·dl−1 sucrose∶brewer's yeast S:Y) were set as 100%, represented as 1 on the graph (Figure 1B). Keeping males for 5 days on a the low calorie diet (2.5 g·dl−1∶2.5 g·dl−1 S:Y) increased the expression of TfAP-2, but not significantly (1.56-fold, SE ±0.23, P = 0.056). Feeding males a high calorie diet (40 g·dl−1∶40 g·dl−1 S:Y) or just a high protein diet (10 g·dl−1∶40 g·dl−1 S:Y) significantly reduced the expression of TfAP-2 (high calorie diet: 0.66-fold SE ±0.07, P<0.05; high protein diet: 0.37-fold, SE ±0.05, P<0.005). The high sugar diet (40 g·dl−1∶10 g·dl−1 S:Y) also decreased TfAP-2 expression, but not significantly (0.60-fold, SE ±1.26, P = 0.059) (Figure 1B). None of the diets had a considerable effect on Twz expression (Figure 1B). From these results it is evident that TfAP-2 transcript levels are up-regulated under conditions of dietary restriction and down-regulated when flies are fed a high calorie diet; while Twz transcription is only influenced by severe starvation.

We already established that Twz was necessary for TfAP-2 expression in octopaminergic neurons (Text S1, Figure S1A) [6]. To understand if Twz was necessary for the increase observed in TfAP-2 expression when flies were starved or raised on a low calorie diet, we knocked down Twz in octopaminergic neurons and performed qPCR analysis. The transcript levels of TfAP-2 in males fed ab lib on a normal diet (10 g·dl−1∶10 g·dl−1 S:Y) was set as 100%, represented as 1 on the graph (Figure 1C). As seen previously, starving control males (Tdc2-GAL4+/−) for 24 h significantly increased TfAP-2 expression (1.72-fold, SE ±0.07, P<0.005), whereas keeping them for 5 days on a low calorie diet (2.5 g·dl−1∶2.5 g·dl−1 S:Y) also increased TfAP-2 levels, but not significantly (Figure 1C). Interestingly, knocking down Twz expression in octopaminergic neurons was sufficient to significantly inhibit TfAP-2 expression in starved flies, as well as flies raised on a low calorie diet (Figure 1C).
Previously we have reported that overexpression of TfAP-2 in octopaminergic neurons is sufficient to induce the expression of two gene necessary for octopamine production and secretion, Tyramine β hydroxylase (Tbh) and Vesicular monoamine transporter (Vmat) [6]. Since starvation had a significant effect on TfAP-2 transcription, to understand if starvation influenced Tbh and Vmat transcriptional levels we performed qPCR analysis on adult males starved for 24 h or 48 h. Intriguingly, compared to flies fed ab lib, starving males for 24 h significantly increased Vmat expression (1.59-fold, SE ±0.11, P<0.05) (Figure 1D). By 48 h of starvation Vmat expression was back to control levels. Starving males for 48 h significantly decreased Tbh expression levels (0.48-fold, SE ±0.03, P<0.05) compared to controls. Next, we determined if macronutrient content influenced Tbh or Vmat expression. While none of the diets had a considerable effect on Vmat expression, a slight increase in Tbh expression was observed in flies fed a low calorie diet, and a significant decrease was observed in flies fed a high calorie diet (0.79, SE ±0.05, P<0.05) (Figure 1E). From these results it appears that starvation conditions regulate both Tbh and Vmat transcription, but only Tbh is regulated by macronutrient content.
TfAP-2 and Twz regulate feeding after starvation
The Drosophila CCK homologue Dsk is necessary to limit meal size after starvation [12], and we saw that both TfAP-2 and Twz transcript levels were increased under starvation conditions (Figure 1A). To discover if TfAP-2 and Twz could be involved in regulating consummatory behavior after starvation we performed a re-feeding assay. Normally flies re-introduced to food after overnight starvation will eat for ∼20 minutes [14]. We allowed starved flies to feed on normal food for 20 minutes before letting them feed for a further 10 minutes on normal food containing blue food dye. Overeaters were determined as those males having blue food in their guts when observed under a stereomicroscope [12], [14] (Figure 2A). Only 3% (SE ±2) of Tdc2-GAL4+/− control flies ate the colored food, indicating that most control flies were satiated after 20 minutes, while 25% (SE ±7.7, P<0.05) of TfAP-2RNAi1 and 22% (SE ±6.5, P<0.05) of TfAP-2RNAi2 flies overate; 21% (SE ±5.3, P<0.05) of TwzRNAi1 and 19% (SE ±4.8, P<0.05) of TwzRNAi2 males overate (Figure 2B). Intriguingly, 50% (SE ±4.8, P<0.005) of TfAP-2OE males overate after being starved for 16 h, while only 10% (SE ±4.2, P<0.05) of the TfAP-2OE;TwzRNAi1 flies continued to eat beyond the initial 20 minutes (Figure 2B). Similar results were obtained using green food dye; to exclude any possible effects caused by the blue food coloring (Figure 2C). Interestingly, similar to loss of Dsk in the insulin-producing cells, knocking down Tfap-2 or Twz in octopaminergic neurons causes them to overeat after starvation, indicating they may be upstream of Dsk in regulating consummatory behavior. Of note, when Tfap-2 was overexpressed in octopaminergic neurons an even stronger overeating phenotype was observed than with loss of Tfap-2.

TfAP-2 and Twz are necessary for proper consummatory behavior
To understand if TfAP-2 and Twz were involved in regulating normal consummatory behavior in adults, a CAFE assay was performed to measure how much food flies fed ad lib consumed during a 24 h period [15]. While Tdc2-GAL4+/− control flies ate 270 nl (SE ±60.9), TfAP-2RNAi1 and TfAP2RNAi2 knockdown flies ate significantly more, 511.8 nl (SE ±76.7, P<0.005) and 499.3 nl (SE ±61.1, P<0.05), respectively (Figure 3A). Similar results were obtained when we knocked down Twz (TwzRNAi1: 460.2 nl, SE ±61.1, P<0.005; TwzRNAi2: 472 nl, SE ±43.3, P<0.005). Of note, overexpressing TfAP-2 specifically in octopaminergic neurons also induced flies to eat significantly more than controls (490 nl, SE ±73, P<0.005) (Figure 3A). The increase in meal size due to TfAP-2 overexpression was rescued by simultaneously knocking down Twz (TfAP2OE;TwzRNAi1: 290 nl, SE ±63.3, P = 0.86).

To observe each genotype's consummatory behavior, individual CAFE assays were videoed, allowing us to determine both the number of feeding bouts (fb) and the average meal size. Controls had 9 fb per fly (SE ±1.1) over a 24 h period, while flies overexpressing TfAP-2 in octopaminergic neurons had 28 fb (SE ±5.1, P<0.005) (Figure 3B). Compared to TfAP-2OE males, TfAP-2OE;TwzRNAi1 males had significantly fewer feeding bouts per fly (14 fb, SE ±3.2, P<0.005). Meal size was also affected by the various genotypes. Control flies ate on average 29 nl per meal (SE ±3.0), while TfAP-2RNAi1 and TfAP-2RNAi2 knockdown males ate significantly larger meals, 43 nl (SE ±6.0, P<0.05) and 48.2 nl (SE ±4.5, P<0.05), respectively. TwzRNAi1 and TwzRNAi2 males ate slightly, but not significantly, larger meals (TwzRNAi1: 36.8 nl, SE ±6.7, P = 0.3; TwzRNAi2: 35.9 nl, SE ±5.5) (Figure 3C). Overexpression of TfAP-2 in octopaminergic neurons induced a significant reduction in average meal size (18 nl, SE ±2.0, P<0.005) (Figure 3C), which was rescued by simultaneously knocking down Twz (TfAP2OE;TwzRNAi1: 26 nl, SE ±6.0, P = 0.68). The increase in feeding bouts observed when TfAP-2 was overexpressed in octopaminergic neurons might explain overeating after starvation, since overexpression of TfAP-2 induced flies to feed.
TfAP-2 and Twz regulate feeding through octopamine signaling
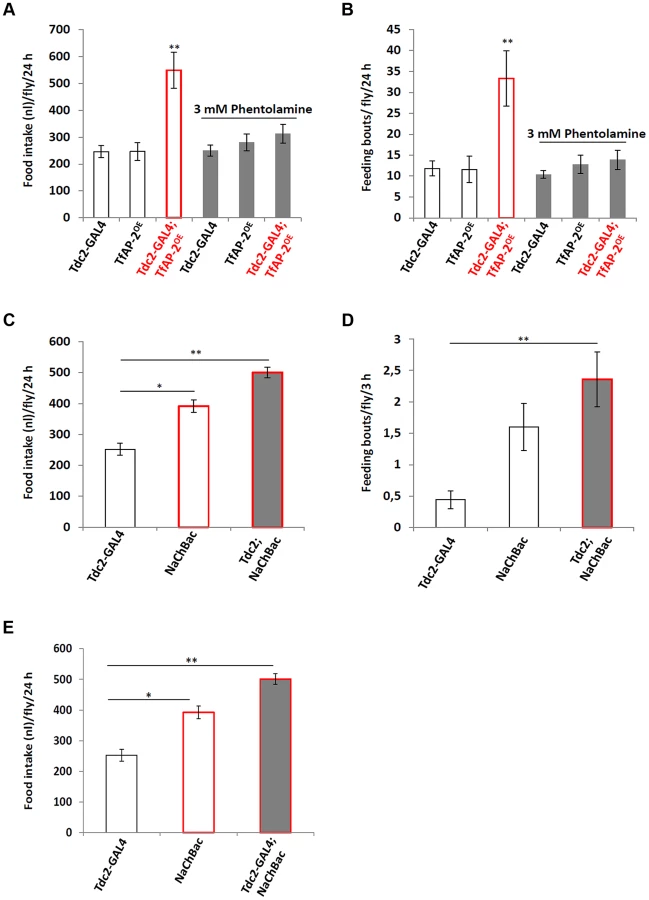
To determine if TfAP-2 and Twz were regulating feeding through octopamine signaling, we fed flies 3 mM of the octopamine antagonist phentolamine, a concentration known to reduce TfAP-2OE induced hyperactivity to control levels, while not reducing the activity of controls [6]. A CAFE assay was performed to determine the total food intake and the average number of feeding bouts per fly over 24 h. While Tdc2-GAL4+/− and TfAP-2OE+/− control flies ate 246.4 nl (SE ±22.2) and 246.8 nl (SE ±32.9) respectively, similar to before, overexpressing TfAP-2 in octopaminergic neurons significantly increased the total food intake to 548.8 nl (SE ±66.3, P<0.005). Feeding 3 mM phentolamine had no significant affect on the total food intake of control flies, but significantly reduced the total intake of TfAP-2OE males to control levels (312.5 nl, SE ±34.7, P = 0.573) (Figure 4A). Overexpressing TfAP-2 in octopaminergic neurons significantly increased the number of feeding bouts (33.3 fb, SE ±6.6, P<0.005), while TfAP-2OE flies fed 3 mM phentolamine only had 13.9 fb (SE ±2.3, P = 0.642 compared to Tdc2-GAL4+/− controls) (Figure 4B). Interestingly, feeding control flies 3 mM phentolamine had no significant affect on the number of feeding bouts. Finally, in order to determine if octopamine had a direct effect on consummatory behavior, we expressed a UAS-transgene for the voltage-activated, bacterial sodium channel NaChBac [16] in octopaminergic neurons using the Tdc2-GAL4 driver and then performed a CAFE assay as before. Of notable interest, overexpressing NaChBac in octopaminergic neurons significantly increased total food intake over a 24 h period (501.1 nl, SE ±16.9, P<0.005) compared to the Tdc2-GAL4+/− control males (252.3 nl, SE ±18.9) (Figure 4C). We noticed that flies usually feed within the first 3 h after lights on, so we videoed the flies during this time and counted the number of feeding bouts. Overexpressing NaChBac in octopaminergic neurons also significantly increased the number of feeding bouts over a 3 h period (2.36 fb, SE ±0.43, P<0.05) compared to the Tdc2-GAL4+/− control males (0.44 feeding bouts, SE ±0.14) (Figure 4D). In the CAFE assay the UAS-NaChBac control line increased both total food intake and feeding bouts, indicating that this line has low levels of expression even without the GAL4 driver. These results indicate that TfAP-2 induced feeding behavior requires octopamine signaling. Furthermore, increasing octopamine signaling is sufficient to induce consummatory behavior in adult males.
Next to ascertain if octopamine signaling was directly influencing Dsk transcript levels we expressed the voltage-activated, bacterial sodium channel NaChBac [16] in octopaminergic neurons using the Tdc2-GAL4 driver and performed qPCR to observe Dsk levels (Figure 4E). The Dsk transcript levels of Tdc2-GAL4+/− males was set as 100%, represented as 1 on the graph. Compared to Tdc2-GAL4+/− controls (SE ±0.06), males where NaChBac was overexpressed in octopaminergic neurons had significantly more Dsk transcript (1.75-fold, SE ±0.04, P<0.005) (Figure 4E). From this result we conclude that activating octopaminergic neurons is sufficient to induce Dsk expression in the CNS.
Dsk inhibits feeding behavior
Overexpression of Dsk in the insulin-producing cells (IPCs) is sufficient to mimic TfAP-2OE induced male aggression phenotypes [6]. To discover if overexpression of Dsk could mimic TfAP-2OE feeding phenotypes we performed a CAFE assay on flies fed ab lib. Dsk was overexpressed in the IPCs (Dilp2-GAL4), as well as pan-neuronally (elav-GAL4), and the feeding behavior phenotype was compared to males where TfAP-2 was either knocked down (TfAP-2RNAi) or overexpressed (TfAP-2OE) in octopaminergic neurons. Similar to what was observed before knocking down or overexpressing TfAP-2 increased total food intake. However, overexpressing Dsk pan-neuronally or specifically in the IPCs had no affect on the amount of food adult males consumed (Figure 5A). Also, flies overexpressing Dsk in either the IPCs (11.2 fb, SE ±2.3, P = 0.93) or pan-neuronally (6.2 fb, SE ±1.4, P = 0.23) had no significant change in the number of feeding bouts, when compared to controls (8.7 fb, SE ±1.4) (Figure 5B). Unlike TfAP-2OE males, which had an average meal size of 18.4 nl (SE ±1.7, P<0.005), control flies ate on average 28.5 nl per meal (SE ±3.1) and males overexpressing Dsk in IPCs or pan-neuronally ate normal size meals, 32.1 nl (SE ±4.8, P = 0.56) and 37.8 nl (SE ±5.4, P = 0.16), respectively (Figure 5C).

Starvation had a significant effect on TfAP-2 transcription and to a lesser degree on Twz expression (Figure 1A). To understand if starvation influenced Dsk transcriptional levels we performed qPCR analysis on adult males starved for 24 h or 48 h. Compared to flies fed ab lib, starving males for 24 h significantly increased Dsk expression (1.42-fold, SE ±0.10, P<0.05 compared to controls), yet after 48 h of starvation Dsk expression was back to control levels (Figure 5D). Finally, we determined if macronutrient content influenced Dsk expression, but none of the diets had a considerable affect, though a slight increase in Dsk expression was observed in flies fed a low calorie diet, and a decrease in expression was observed in flies fed a high proteins diet (Figure 5E). From these results is appears dietary conditions regulate Dsk transcription in a manner similar to Vmat.
Octopamine and Dsk signal in a negative feedback-loop
Overexpressing Dsk pan-neuronally (elav-GAL4) induced a slight, albeit not significant, decrease in the number of feeding bouts compared to controls (Figure 5B). This, along with the earlier study that determined loss of Dsk caused starved flies to overeat, could mean Dsk actually signals to inhibit feeding behavior [12]. In order to understand if TfAP-2 was regulating feeding behavior through Dsk in a negative feedback loop, we fed control (Tdc2-GAL4+/−) and TfAP-2OE males the mammalian CCK antagonist SR 27897 before performing a CAFE assay [17], [18]. The CCK antagonist significantly increased total food intake in adult males (507.3 nl, SE ±68.2, P<0.005), compared to controls fed normal food (124.7 nl, SE ±55.4). Similar to what was observed previously, TfAP-2OE males ate significantly more food (258.3 nl, SE ±1.4, P<0.005) than controls (Figure 6A). Feeding these males the CCK antagonist had an additive effect, causing a drastic increase in total food intake (786.1 nl, SE ±88, P<0.005). The CCK antagonist also significantly increased the number of feeding bouts in Tdc-GAL4+/− controls (38.6 fb, SE ±5.2, P<0.005), which was more similar to TfAP-2OE males (28 fb, SE ±4.7, P<0.005 compared to controls) and significantly higher than controls (8.7 fb, SE ±1.4) (Figure 6B). Feeding the antagonist to TfAP-2OE males increased the number of feeding bouts even further to 76 (SE ±7.9, P<0.005). The antagonist SR 27897 had no effect on the meal size of either control or TfAP-2OE males (Figure 6C).

To verify Dsk function in feeding behavior, as well as determine if the mammalian CCK antagonist SR 27897 was actually inhibiting Drosophila Dsk signaling, we fed flies 1 mM SR 27897 where Dsk was knocked down in either the IPCs using the Dilp2-GAL4 driver or in all Dsk expressing cells using the Dsk-GAL4 driver [19], [20] and performed a CAFE assay. Dilp2-GAL4, Dsk-GAL4 and UAS-DskRNAi heterozygous controls ate 137.5 nl (SE ±12.3), 125.5 nl (SE ±15.3) and 187.5 nl (SE ±15) respectively, feeding these controls 1 mM SR 27897 significantly increased their total food intake over a 24 h period (Dilp2-GAL4, 232.8 nl, SE±18.7, P<0.05; Dsk-GAL4, 254.2 nl, SE ±20.3, P<0.05; UAS-DskRNAi, 292.9 nl, SE ±23.4, P<0.05). Knocking down Dsk in the IPCs (Dilp2-GAL4) or in all Dsk expressing cells (Dsk-GAL4) significantly increased the total food intake over a 24 h period, but feeding these flies the CCK antagonist SR 27897 did not further increase total intake (Figure 6D). The heterozygous controls Dilp2-GAL4, Dsk-GAL4 and UAS-DskRNAi had 10 (SE ±1.1), 11.8 (SE ±1.8) and 15 (SE ±1.4) feeding bouts over a 24 h period, respectively (Figure 6E). Feeding these controls 1 mM SR 27897 significantly increased the number of feeding bouts (Dilp2-GAL4+/−: 24.4 fb, SE ± 2.1, P<0.005; Dsk-GAL4+/−: 29.2 fb, SE ±3.4, P<0.005; UAS-DskRNAi+/−: 28.1, SE ±1.6, P<0.005). Knocking down Dsk in the IPCs or in all Dsk expressing cells significantly increased the number of feeding bouts (Dilp2-GAL4; DskRNAi: 32 fb, SE ±3.6, P<0.005; Dsk-GAL4;DskRNAi: 30.3 fb, SE ±3.4, P<0.005), but feeding these flies the CCK antagonist did not further increase feeding bouts (Dilp2-GAL4;DskRNAi: 32.7 fb, SE ±3.2, P = 0.885; Dsk-GAL4;DskRNAi: 33.8 fb, SE ±3.8, P<0.861) (Figure 6E). From the above data we present the following model: TfAP-2 and Twz regulate the production and secretion of octopamine, which in turn initiates feeding, while at the same time, in a negative feedback loop, octopamine induces the expression of Dsk to inhibit feeding frequency (Figure 6F).
Co-localization of the neuronally expressed AP-2β and Kctd15 in the mouse brain
To ascertain if, similar to Drosophila, the mammalian Tfap2b (encoding AP-2β) and Kctd15 genes could be involved in regulating feeding behavior, immunohistochemistry was performed to investigate if AP-2β and Kctd15 co-localized in the mouse brain, and known markers for neurons and glial cells were used to investigate in what cell type they were expressed, see Figure 7. AP-2β and Kctd15 had similar expression patterns with high and exclusive expression in parts of cerebral cortex, cerebellum and hypothalamus. Overlapping expression was seen for AP-2β and Kctd15 in the arcuate hypothalamic nucleus (Arc) and the ventromedial hypothalamic nucleus (VMH) (Figure 7A). Co-localization of AP-2β and Kctd15 immunoreactivity was also seen in the core of the accumbens nucleus (AcbC) in ventral striatum (Figure 7B). These are all areas that are known to be involved in the regulation of food intake [21], [22]. The neuron-specific enolase (NSE) was used to visualize the neuronal expression of AP-2β and Kctd15. Interestingly, overlapping expression was seen for AP-2β and the neuronal marker NSE [23] in cerebral cortex (Figure 7C). Kctd15 showed a similar pattern with strong co-localization with NSE in cerebral cortex (Figure 7D). The expression of the astrocyte marker glial fibrillary acidic protein (GFAP) [24] did not overlap with neither AP-2β nor Kctd15 in the brain (Figure 7E and 7F, respectively). To conclude, AP-2β and Kctd15 immunoreactivity co-localize in specific areas of the mouse brain and are localized to neurons.

Regulation of Tfap2b and Kctd15 by food intake in mouse hypothalamus
To study how the dietary status influenced the mRNA expression of Kctd15 and Tfap2b in the hypothalamus, mice were assigned to different food restrictions; 1) fed normal chow-, 2) fed normal chow, but food-deprived for 24 h - and 3) fed high fat diet to induce obesity before analyses. The expression levels of Tfap2b and Kctd15 in normal chow fed mice were sat at 100%, represented as 1 in the graphs (Figure 8A and 8B). Both genes were up-regulated by fasting, but only Tfap2b was significantly changed, with relative expression at 3.22 (SD ±0.50, P>0.05) for Tfap2b and 1.38 (SD ±0.06) for Kctd15 (Figure 8A). Further, Tfap2b was also affected by the high-fat diet with up-regulated relative expression levels at 4.78 (SD ±0.67, P>0.01), while Kctd15 was unaffected by obesity (0.99±0.09 (±SD) (Figure 8B). Mice fed a high-fat diet for 6–8 weeks had significantly higher weight than mice fed normal chow (Figure 8C). Hence dietary status affects the expression of Tfap2b and to a much lesser extent Kctd15, in the hypothalamus in mice, this is similar to what was observed for the Drosophila homologues TfAP-2 and Twz (Figure 1A and 1B)

AP-2β and KCTD15 directly interact in hypothalamus cells
To ascertain if AP-2β and Kctd15 can directly interact in vivo, a proximity ligation assay (PLA) was performed using mHypoE-N25/2 cells. PLA can readily detect and localize proteins with single molecule resolution, allowing for the determination of directly interacting proteins [25]. Using this method, PLA signals were observed evenly distributed throughout the mHypoE-N25/2 cells, where both AP-2β and Kctd15 primary antibodies were added (Figure 9A, red dots), while no signals were observed in the control cells lacking primary antibodies (Figure 9A1). All cells were counter stained with DAPI to highlight the nuclei (blue staining).

In mice AP-2β interacts with the sumoylation enzyme Ube2i [26] and in Drosophila Twz interacts directly with the Drosophila Ube2i homologue Lesswright (Lwr) [9]. Furthermore, mouse AP2γ is sumoylated [26] and we have evidence that mouse AP-2β is also sumoylated (Figure 9D). Western blot analysis of mouse proteins recovered from the entire brain was performed using an anti-AP-2β antibody. Two bands were visible on the gel, the lower band corresponded to the predicted size of AP-2β (48 kDa), the upper band corresponded to sumoylated AP-2β (∼60 kDa) (Figure 9D). This result led us to perform a proximity ligation assay (PLA) using mHypoE-N25/2 cells to understand if Kctd15 and AP-2β directly interact with Ube2i. Using this method PLA signals were observed in punctate points throughout the mHypoE-N25/2 cells, when either AP-2β or Kctd15 primary antibodies were added together with Ube2i antibodies (Figure 9B and 9C respectively, red dots), while no signals were observed in cells lacking primary antibodies (Figure 9B1 and 9C1 respectively).
Discussion
Previously we have shown that the obesity-linked homologues TfAP-2 and Twz interact genetically to positively regulate TfAP-2 activity [6]. This interaction could be regulated by orexigenic signals, including starvation or low macronutrient meal content (see figures 1A–C). In order to increase octopamine signaling, TfAP-2 overexpression induces the expression of genes involved in producing and secreting octopamine, for example Tyramine β hydroxylase (Tbh) and Vesicular monoamine transporter (Vmat) [6]. Octopamine signaling initiates consummatory behavior, and in a negative feedback loop to prevent overeating, signals to induce the expression of Dsk; the Dsk anorexigenic signal then inhibits feeding. Intriguingly, we demonstrate that loss of TfAP-2 or overexpression of TfAP-2 in octopaminergic neurons induces an overeating phenotype, but by different mechanisms. Knocking down TfAP-2 caused flies to eat larger meals, but did not influence the number of meals per day; while ovexpressing TfAP-2 significantly increased the number of meals taken per day. The overexpression phenotype can be explained by our model (see figure 6F). Increased octopamine signaling would induce flies to eat, but at the same time increase Dsk signaling to inhibit feeding. This feedback loop would lead to an increase number of feeding bouts, due to octopamine signaling, but premature cessation of food intake due to increased Dsk expression. The increased meal size due to loss of TfAP-2 is harder to explain, but points to parallel pathways involved on regulating meal size. It was recently reported that similar to Dsk, another neuropeptide Crustacean cardioactive peptide (Ccap), Drosophila vasopressin/oxytocin homologue, is also expressed in the insulin-producing cells [27]. Intriguingly we have evidence that Ccap is involved regulating meal size in adult Drosophila (M. Williams, unpublished observations), both vasopressin and oxytocin have been shown to regulate meal size in mammals [28]–[30]
A recent paper demonstrated that the Drosophila noradrenalin analogue octopamine was involved in regulating consummatory behavior in larvae [13]. In that particular study it was determined that octopamine drives the response for continual eating of palatable food, unlike the NPY-like system that was shown to initiate eating of less palatable food under adverse conditions [31], [32]. Of note, chronic infusion of the mammalian octopamine analogue noradrenalin into the ventromedial hypothalamic nucleus (VMH) of rats induces obesity, most likely due to hyperphagia and increased levels of circulating insulin and triglycerides [33], [34]. Furthermore, dietary amino acid deficiency inhibited noradrenalin release within the VMH, probably stimulated by an aversion response to inhibit consummatory behavior [35]. Interestingly, we found that in the Drosophila CNS or mouse hypothalamus starvation and low macronutrient meal content induced the expression of TfAP-2 (see figure 1A and 1B) or Tfap2b (see figure 8A and 8B). Furthermore, when we stained mouse brains to look for possible Tfap2b (encoding AP-2β) and Kctd15 interactions, we observed a strong co-localization of AP-2β and Kctd15 within neurons located in the VMH. Moreover, overexpressing TfAP-2 in Drosophila octopaminergic neurons induces hyperphagia, which could be rescued by an octopamine antagonist. Finally, hyperactivating octopaminergic neurons is sufficient to induce hyperphagia in adult male Drosophila. These findings suggest that in flies and mammals the initiation and cessation of consummatory behavior is controlled by a conserved signaling system.
CCK, a mammalian gastrointestinal hormone secreted by the gut when nutrients enter the lumen, binds to the cholecystokinin A receptor (CCKAR) located on vagus sensory terminals. The vagus nerve then delivers satiation signals to the nucleus of the solitary tract (NTS) [10], [11]. Under some experimental conditions exogenous CCK signaling elicits satiety and reduces meal size in several species [36]–[41]. Interestingly, our experiments show that although feeding wild-type flies a CCK antagonist has no affect on meal size, there is a significant increase in the number of feeding bouts (see figure 6B). Moreover, feeding TfAP-2 overexpressing males, which already undergo significantly more feeding bouts than controls, a CCK antagonist had an additive effect. Finally, knocking down the Drosophila CCK homologue in the insulin-producing cells (IPCs) was sufficient to induce hyperphagia (see figure 6D and 6E). This differs somewhat to what is observed in mammals, where inhibition of CCK increases meal size. Although there have been no studies reporting the effect of noradrenalin on CCK transcription or signaling, it has been shown that CCK signaling to the VMH can inhibit noradrenalin release [42]. It could be that CCK released from the gut inhibits meal size, while CCK functions within the hypothalamus to block noradrenalin release, thus inhibiting the number of feeding bouts.
Previously, we reported that overexpression of TfAP-2 or feeding Drosophila the octopamine analogue chlordimeform is sufficient to induce Dsk transcription, and that Dsk induction by TfAP-2 overexpression could be blocked by feeding these flies an octopamine antagonist [6]. Here we demonstrate that specifically activating octopaminergic neurons using a bacterial sodium channel is sufficient to induce hyperphagia (see figure 4C and 4D). Also, a recent study demonstrated that octopamine signaling induced fervent feeding behavior when larvae were presented with palatable food [13]. Furthermore, it was shown that Dsk is necessary to inhibit well-fed larvae or adults from eating less palatable foods [12]. In both flies and mammals it is possible that there exists a conserved negative feedback loop to inhibit overeating, as well as allow for the differentiation between palatable or non-palatable foods.
Our results indicate that there is an epistatic interaction between TfAP-2 and Twz. In all the assays performed, where TfAP-2 was overexpressed, loss of Twz was able to rescue the TfAP-2 overexpression phenotypes. Also, we have previously reported, and again shown here that Twz is necessary for proper TfAP-2 transcription [6]. Furthermore, in mHypoE-N25/2 cells, which are derived from the mouse hypothalamus, a proximity ligation assay showed that throughout the cytoplasm mouse AP-2β and Kctd15 interact directly (see figure 9A). The question is what is the function of this interaction? In a yeast two-hybrid screen, using a human brain cDNA library, KCTD1 was identified as a binding partner for AP-2α, a paralogous protein to AP-2β. Transient transfection assays, using AP-2-binding site containing promoters, established that KCTD1 actively repressed AP-2α-mediated transactivation, demonstrating that the function of KCTD1 was to inhibit TFAP2α activity. This is not what we observed for Drosophila TfAP-2 and Twz, where Twz was required for TfAP-2 activity. Mouse AP-2β interacts with Ube2i [26], a sumoylation enzyme, and in Drosophila Twz interacted directly with the Drosophila Ube2i homologue Lesswright (Lwr) in a large-scale yeast two-hybrid screen [9]. We show that in mHypoE-N25/2 cells mouse AP-2β and Kctd15, both directly interact with the sumoylation enzyme Ube2i. It is possible that Twz/Kctd15 acts like a scaffold where TfAP-2/AP-2β is either sumoylated or ubiquitinated, as many KCTD family members also interact with the ubiquitination apparatus [43], [44]. This post-translational modification might be required for TfAP-2/AP-2β activation. In both Drosophila CNS and mouse hypothalamus TfAP-2 and Tfap2b transcription levels went up after starvation. In Drosophila this increase in transcription required Twz. It could be that satiation levels regulate TfAP-2/Tfap2b and Twz/Kctd15 interactions, which in turn regulates TfAP-2/Tfap2b post-translational modification to increase TfAP-2/Tfap2b activity. During starvation or in conditions of dietary restriction TfAP-2 and Twz could interact to activate TfAP-2 and thus induce TfAP-2 expression (see figure 1A and 1C). Furthermore under extreme conditions, more Twz may be needed, this is supported by the fact that Twz was transcriptionally induced only after 48 h of starvation. We have demonstrated previously that Twz expression does not require TfAP-2 [6]. Although we have not demonstrated it, in the mouse hypothalamus under low nutritive conditions Tfap2b and Kctd15 could interact to initiate sumoylation and activation of Tfap2b, which could in turn induce consummatory behavior.
In conclusion, our data suggests that the human obesity-linked genes TFAP2B and KCTD15 could directly interact in regions of the brain known to regulate feeding behavior. We demonstrated that not only do the Drosophila homologues genetically interact, but in a mouse hypothalamic cell line the mouse homologues physically interact. Furthermore, AP-2β and Kctd15 co-localize in regions of the mouse hypothalamus known to regulate feeding behavior. In this model Kctd15 could act like a scaffold where AP-2β would bind to be either sumoylated, in a fashion similar to the Kctd1 and AP-2α, or possibly ubiquitinated. This post-translational modification would then change AP-2β function and allow it to induce noradrenalin signaling to induce consummatory behavior.
Materials and Methods
Fly stocks and maintenance
w*, P{w[+mW.hs] = GawB}elav[C155], w*; P{w[+mC] = Tdc2-GAL4.C}2, y1 w[*]; P{w[+mC] = UAS-AP-2.PB}a4-2, y1 w*; P{w[+mC] = UAS-NaChBac-EGFP}4 and the RNAi lines y1 v1; P{TRiP.JF01908}attP2 Dsk, y1 v1; P{TRiP.JF03500}attP2 Tfap-2 (referred to as TfAP2RNAi2) and y1 v1; P{TRiP.JF01867}attP2 Twz (referred to as TwzRNAi2) were received from the Bloomington Stock Center (Table 1). TfAP-2 (y1w3; P{KK109052}VIE-260B, referred to as TfAP-2RNAi1) and Twz (y1w3; P{KK107922}VIE-260B, referred to as TwzRNAi1) RNAi flies were obtained from the Vienna Drosophila RNAi Centre (VDRC, Vienna, Austria) (Table 1). w; Dilp2-GAL4 was a gift from Dr. Eric Rulifson [45]; w; Dsk-GAL4 and w; UAS-Dsk line were a gift from Dr. Barry Ganetzky [19], [20]. All flies, unless otherwise stated, were maintained on enriched Jazz mix standard fly food (Fisher Scientific). Flies were maintained at 25°C in an incubator at 60% humidity on a 12∶12 light∶dark cycle. Flies crossed to GAL4 drivers and controls were raised at 18°C until the adults emerged; once collected adults were raised at 29°C for the appropriate times. In all assays, the GAL4 drivers and UAS transgenic flies were crossed to w1118 flies and their F1 progeny used as controls.

Capillary feeding (CAFE) and antagonist assay
This method was modified from Ja et al. 2007 [15]. A vial, 9 cm by 2 cm (height×diameter), containing 1% agarose (5 cm high) to provide moisture and humidity for the flies, was used for this assay. A calibrated capillary glass tube (5 µl, VWR International) was filled with liquid food which contains 5% sucrose, 5% yeast extract and 0.5% food-coloring dye. Mineral oil was used to prevent the liquid food from evaporating. The vial was covered with paraffin; a capillary tube was inserted from the top through the paraffin. The experimental set up was kept at 25°C and activity was recorded for 24 h using a HD camera (Panasonic SDS90). The initial and final food level in the capillary tube was marked to determine total food intake. Number of feeding bouts per fly was counted from the recording; average meal size was calculated by dividing the total food intake by the number of feeding bouts. Five 5–7 day old males per vial were used for this assay.
Feeding after starvation
Twenty 5–7 day old males were maintained in a vial containing 1% agarose for 16 h. They were then transferred to normal food vials (5% sucrose, 5% yeast extract and 1% agarose) and allowed to feed for 20 minutes, then transferred to a second food vial containing normal food (5% sucrose, 5% yeast extract and 1% agarose) and 2% blue or green food-coloring dye (Dr. Oetker) and allowed to feed for 15 minutes. After this time the abdomen of each fly was observed using dissecting microscope (DV4, Zeiss) and the color of the gut was scored. The percentage of overeaters was calculated by dividing those with blue colored guts by the total number of flies observed.
Antagonist assays
Newly eclosed TfAP-2 overexpressing male flies were collected and isolated on normal food for 3 days. After this time they were fed by CAFE assay method [15]. Calibrated capillary glass tubes (5 µl, VWR) were filled with either 1 mM SR 27897 [17], [18] or 3 mM of Phentolamine [46], prepared in liquid food (5% of sucrose and 5% yeast extract), a layer of mineral oil was used to prevent the liquid food evaporation from the capillary tube. These tubes were inserted from the top through paraffin film into the chambers. After 2–3 days of feeding the flies were used for the various assays performed.
RNA purification
The phenol-chloroform method was used for RNA extraction from tissue samples [47]. Fifty fly heads were homogenized with 800 µl TRIzol (Invitrogen, USA), 200 µl Chloroform (Sigma-Aldrich) was added and samples were centrifuged at 12000 rpm for 15 minutes at 4°C. The aqueous layer, which contained RNA, was separated and 500 µl isopropanol (Solvaco AB, Sweden) was added.The RNA was precipitated by storing the samples at −32°C for 2 h. Samples were centrifuged at 12000 rpm for 10 minutes at 4°C, to collect the RNA pellets, which were then washed with 75% ethanol (Solvaco AB, Sweden) to remove the organic impurities. Samples were allowed to air dry to remove any traces of ethanol. Dried RNA pellets were dissolved in 21.4 µl of RNAse free water (Qiagen GmBH, Germany) and 2.6 µl of DNAse incubation buffer (Roche GmBH, Germany). The samples were incubated at 75°C for 15 minutes to ensure complete dissolution of RNA-pellets. 2 µl of DNAse I (10 U/µl, Roche GmBH, Germany) was added to each sample, and incubated at 37°C for 3 hr to remove DNA contamination. DNAse was deactivated by incubating the samples at 75°C for 15 minutes. Removal of DNA was confirmed by PCR using Taq polymerase (5 U/µl, Biotools B & M Labs, Spain), followed by agarose gel electrophoresis. The RNA concentration was measured using a nanodrop ND 1000 spectrophotometer (Saveen Werner).
cDNA synthesis
cDNA was synthesized from RNA template using dNTP 20 mM (Fermentas Life Science), random hexamer primers and M-MLV Reverse Transcriptase (200 U/µl, Invitrogen, USA) by following manufactures instructions. cDNA synthesis was confirmed by PCR followed by agarose gel electrophoresis.
qRT-PCR
Relative expression levels of three housekeeping genes (EF-1, Rp49 & RpL11) and of the genes of interest were determined with quantitative RT-PCR (qPCR). Each reaction, with a total volume of 20 µl, contained 20 mM Tris/HCl pH 9.0, 50 mM KCl, 4 mM MgCl2, 0.2 mM dNTP, DMSO (1∶20) and SYBR Green (1∶50000). Template concentration was 5 ng/µl and the concentration of each primer was 2 pmol/µl. Primers were designed with Beacon Designer (Premier Biosoft) using the SYBR Green settings. All qPCR experiments were performed in duplicates; for each primer pair a negative control with water and a positive control with 5 ng/µl of genomic DNA were included on each plate. Amplifications were performed with 0.02 µg/ml Taq DNA polymerase (Biotools, Sweden) under the following conditions: initial denaturation at 95°C for 3 min, 50 cycles of denaturing at 95°C for 15 sec, annealing at 52.8–60.1°C for 15 sec and extension at 72°C for 30 sec. Analysis of qPCR data was performed using MyIQ 1.0 software (Bio-Rad) as previously reported [48]. Primer efficiencies were calculated using LinRegPCR [49] and samples were corrected for differences in primer efficiencies. The GeNorm protocol described by Vandesompele et al. [50] was used to calculate normalization factors from the expression levels of the housekeeping genes. Grubbs' test was performed to remove outliers. Differences in gene expression between groups were analyzed with ANOVA followed by Fisher's PLSD test where appropriate. P<0.05 was used as the criterion of statistical significance. The following primers were used: EF-1 F: 5′-GCGTGGGTTTGTGATCAGTT-3′, R: 5′-GATCTTCTCCTTGCCCATCC-3′; Rp49 F: 5′-CACACCAAATCTTACAAAATGTGTGA-3′, R: 5′-AATCCGGCCTTGCACATG-3′; RpL11 F: 5′-CCATCGGTATCTATGGTCTGGA-3′, R: 5′-CATCGTATTTCTGCTGGAACCA-3′, TfAP-2 F: 5′-CTAAGAGCAAGAACGGAG-3′, R: 5′-AACCAAGGATGTCAGTAG-3′; Tiwaz F: 5′-GCCACATTCTGAACTTTATG-3′, R: 5′-CACCAAATAGTTGCCATT-3′; Dsk F: 5′-CCGATCCCAGCGCAGACGAC-3′, R: 5′-TGGCACTCTGCGACCGAAGC-3′
Mouse experimental procedures
Ethical statement
All animal procedures were approved by the local ethical committee in Uppsala and followed the guidelines of European Communities Council Directive (86/609/EEC).
Tissue collection and sectioning - Adult, male C57BL/6J mice (Taconic M&B, Denmark) were anesthetized with an intraperitoneally injection of sodium pentobarbital (90 mg/kg IP; Apoteksbolaget, Sweden). Transcardial perfusion was performed through the left ventricle with phosphate-buffered saline (PBS), followed by 4% formaldehyde (HistoLab, Sweden), and brains were excised. Tissues were stored in 4% formaldehyde over night and sections were made by fixation in zinc-formalin (Richard-Allan Scientific, USA) for 18–24 h at 40°C, before dehydration and paraffin infusion with a Tissue-Tek vacuum infiltration processor (Miles Scientific, USA). Sections were cut (7 µm) using a Microm 355S STS cool cut microtome, mounted on Superfrost Plus slides (Menzel-Gläser, Germany), dried over night at 37°C and stored at 4°C.
Fresh tissue collection
17 adult male C57BL/6J mice (Taconic M&B, Denmark) were used for fresh dissection of the hypothalamus. The animals were maintained in a temperature-controlled room on a 12-h light-dark cycle where they had free access to food and water at all times unless anything else stated. Six mice were fed normal chow until dissection; additional six mice were given chow, but were food deprived for 24 h before dissection to study starvation effects on gene expression. For diet-induced obesity, five mice were fed high fat western diet (R638, Lantmännen, Sweden) during eight weeks prior dissection. The diet-induced obesity mice weight was monitored weakly and compared with normal chow fed mice. Two-way ANOVA with P<0.05 was calculated to ensure that the obese mice were significantly heavier than the controls at the day of dissection. Mice were sacrificed by cervical dislocation during the light period and all dissections were performed on ice. A coronal brain matrix (Alto, 1 mm) was used to facilitate the excised of the hypothalamus. Tissues were placed in RNA-later (Invitrogen) for 2 h at RT before frozen at −80°C.
RNA extraction
Tissue collected from mice on the same diet was pooled before RNA extraction. RNA was extracted using Absolutely RNA Miniprep Kit (Agilent Technologies, USA). Briefly, the tissue was mixed with Lysis Buffer, β-mercaptoethanol and 1 mm RNAse free glass beads before homogenized using a Bullet blender (Averill Park, USA). The homogenate was spun through a prefilter spin cup in a Heraesus Fresco 21 centrifuge at maximum speed at RT, before mixed with 70% ethanol (Solveco, Sweden) in a 1∶1 ratio to precipitate the RNA. The solution was centrifuged through a RNA binding spin cup, followed by salt buffer washes. DNase Digestion buffer and RNase-Free DNase 1 were then added to the RNA binding spin cup and allowed to incubate for 15 min at 37°C followed by additional washes in salt buffer prior to RNA elution. Concentration was measured using a nanodrop ND-1000 spectrophotometer.
cDNA synthesis
Extracted RNA was used as template for cDNA synthesis. 2 µg RNA was added to a 2×RT buffer and 20×RT enzyme master mix (High Capacity RNA-to-cDNA Kit, Applied Biosystem, USA), final volume was adjusted to 20 µL with DEPC-treated water. Samples were incubated for 37°C for 60 min followed by 95°C for 5 min. The cDNA was diluted to 5 ng/µl template in sterile water.
Primer design and qPCR
All primers were designed using Beacon primer design 8 (Premier Biosoft). For sample amplification following primers were used KCTD15 F: 5′-CACCAAGTACCCTGACTC-3′, R 5′-AATAATGTTGCTTGAGACTGT-3′ and Tfap2b: F 5′-TTACAGTCCTATACTCTCC-3′, R 5′-CTACGCTTCAGTCTTTAG-3′. Three different reference genes were run: GADPH: F 5′-GCCTTCCGTGTTCCTACC-3′, R 5′-GCCTGCTTCACCACCTTC-3′, mRPL19: F 5′-AATCGCCAATGCCAACTC-3′, R 5′-GGAATGGACAGTCACAGG-3′ and histone H3b: F 5′-CCTTGTGGGTCTGTTTGA-3′, R 5′-CAGTTGGATGTCCTTGGG-3′.
For each qPCR reaction iQ SYBR Green supermix (Bio-rad, Sweden) was used, to which 5 µl cDNA (5 ng/µl template) and 100 pmol/µl of each primer was added. Final volume was adjusted to 20 µL with water. Each sample was run in triplicate, a negative control for each primer pair and a positive control was included on each plate. All experiments were repeated twice. iCycler real-time detection instrument (Bio-Rad Laboratories) were used and the reaction followed these conditions: initial denaturation for 30 sec at 94°C followed by 45 cycles of 10 sec at 94°C, 30 sec at 53–63°C (optimal temperature for each primer pair) and 30 sec at 72°C. Thereafter a melting curve was performed by 81 cycles of 10 sec intervals where the temperature increased 0.5°C per cycle, starting from at 55°C.
Analyses were performed as previously described under the qRT-PCR section. MyIQ 1.0 software was used to analyse the qPCR data and primer efficiency was calculated using LinRegPCR. Grubbs test was performed to remove outliers in the primer efficiency calculations before correcting the samples for primers efficiency. A normalization factor was obtained by using the expression levels of the housekeeping genes for calculations in GeNorm. The normalization factor was then used to calculate the relative mRNA expression in the samples. Differences in gene expression between the diets were analysed with one-way ANOVA, where Bonferroni's multiple comparison test was used for post-hoc analysis. P>0.05 was used as significance.
Fluorescent immunohistochemistry on paraffin embedded sections
Sections were deparaffinized in X-trasolv (Medite histotechnik, Germany), rehydrated through a series of ethanol solutions ending up in water, followed by PBS washes. Antigen retrieval was performed by heating the sections to 100°C in 0.01 M citric acid pH 6.0 (Sigma-Aldrich, USA). After PBS washes, sections were incubated with 1° antibodies overnight at 4°C. After PBS rinsing, sections were incubated for two h in 2° diluted in supermix. Sections were washed in PBS, stained with DAPI (1∶1250, Sigma-Aldrich, USA) and mounted in DTG media with antifade (diazabicyclo(2.2.2)octane in glycerol). Pictures were taken using a fluorescent microscope (Zeiss Axioplan2 imaging) connected to a camera (AxioCam HRm) with the Carl Zeiss AxioVision version 4.7 software.
Antibodies for immunohistochemistry
Primary antibodies
Rabbit-anti-AP2β (1∶100, Abcam, England), mouse-anti-KCTD15 (1∶100, Abcam, England), chicken-anti-NSE (1∶200, Abcam, England) or chicken-α-GFAP (1∶800, Abcam, England) antibodies diluted in supermix (Tris-buffered saline, 0.25% gelatin, 0.5% Triton X-100).
Secondary antibodies
Goat-anti-mouse-594, goat-anti-chicken-488, goat-anti-rabbit-594 or goat-anti-mouse-488 antibodies (1∶200, Invitrogen, USA).
Proximity ligation assay (PLA)
The immortalized embryonic mouse hypothalamus cell line N 25/2 were grown (Detailed methods on cell culture maintenance can be found in SI Experimental procedures) on glass slides (coated with 10 µg/ml poly-L-lycine) were fixed in 4% paraformaldehyde (Sigma-Aldrich, USA) for 15 min and rinsed with PBS. The Duolink II fluorescence kit (orange detection reagents, Olink Biosciences, Sweden) was used to run in situ proximity assay (PLA) on the fixed cells according to manufacturer's instruction. Primary rabbit-anti-AP2β, mouse-anti-KCTD15, goat-anti-UBC9 antibodies (Abcam, England) were diluted 1∶100, 1∶100, 1∶200 correspondently in Antibody Diluent supplied by the kit. Negative controls were run without primary antibodies. Protein interactions were detected with PLA probes in combination anti-rabbit PLUS and anti-mouse MINUS, anti-rabbit PLUS and anti-goat MINUS or anti-mouse PLUS and anti-goat MINUS. Slides were mounted using Duolink in situ Mounting Medium with DAPI. Pictures were taken using a fluorescent microscope (Zeiss Axioplan2) connected to a camera (AxioCam HRm) with the Carl Zeiss AxioVision version 4.7 software (Carl Zeiss, Germany).
Cell culture
The immortalized embryonic mouse hypothalamus cell line N 25/2 (mHypoE-N25/2, Cellutions Biosystems Inc., Canada) was cultured in DMEM cell culture medium (Invitrogen) with 10% Fetal Bovine Serum (Invitrogen), 1% Penicillin Streptomycin (Invitrogen), 1× Amphotericin B (Invitrogen) in a humidified atmosphere with 5% CO2 in air at 37°C. Growth medium was changed every 2 days and cells were split with trypsin regularly with a ratio of 1∶2–1∶3 usually every 3 days.
Western analysis
We performed a western blot analysis of AP-2β in brain tissue from adult, male C57Bl6/J mice (Taconic M&B, Denmark). Briefly, the tissue was homogenized in homogenization buffer (50 mM Tris, 150 mM NaCl, 4 mM MgCl, 0.5 mM EDTA, 2% Triton X-100 and 1 mM Protease inhibitor PMSF (Sigma-Aldrich, USA) diluted in isopropanol). Protein concentrations were determined by protein assay DC (Bio-Rad, Hercules, USA) according to the manufacturer's instructions. Equal amounts of protein (200 µg or 13 µg/µl) were separated, together with PageRuler prestained protein ladder (Fermentas, Canada), on a Mini-Protean TGX gel (4–10%, Bio-Rad, Hercules, USA) in running buffer (0.1% SDS, 0.025 Tris base and 0.192 M glycine) by gel electrophoresis. The proteins were transferred to a Immobilon-P polyvinylidene fluoride (PVDF) membrane (Millipore, Billerica, USA) in transfer buffer (0.025 Tris base, 0.192 M glycine and 20% methanol) and pre-blocked for 1 h in blocking buffer (5% non-fat dry milk (Bio-RAD, Hercules, USA) diluted in 1.5 M NaCl, 0.1 M Tris, 0.05% Tween-20, pH 8.0). The membrane was cut in the middle, giving two membranes with equally loaded protein samples. One half of the membrane was hybridized with the primary antibody against AP-2β (diluted 1∶200, rabbit-anti-AP2β, Abcam, England). The other half of the membrane was hybridized with AP-2β primary antibody that was pre-blocked with excess of the same synthetic peptide (sequence (NH2-) MHSPPRDQAA IMLWKLVENV KYEDIYEDRH DGVPSHSSRL SQLGSVSQGP (-CONH2), Abcam, England) that was used to generate the antibody. The hybridization was then performed overnight at 4°C. After washes in water, the membranes were incubated for 1 h with horseradish peroxidase conjugated secondary antibody (diluted 1∶10000, goat-anti-rabbit, Invitrogen, USA) followed by detection with the enhanced chemiluminescent (ECL) method. The membranes were incubated for 3 min in a 1∶1 mixture of luminol/enhancer and peroxidase buffer solutions (Immun-Star HRP, Bio-Rad, Hercules, USA) and developed on High performance chemiluminescence film (GE healthcare, Waukesha, USA).
Statistical analysis
Mean and standard error from all replicates of each experiment was calculated. All analysis was performed with GraphPad Prism 4, and used ANOVA with appropriate post hoc analysis for multiple comparisons. The type of analysis performed for each assay is specified in the appropriate Figure legend.
Supporting Information
Zdroje
1. ZhaoJ, BradfieldJP, LiM, WangK, ZhangH, et al. (2009) The role of obesity-associated loci identified in genome-wide association studies in the determination of pediatric BMI. Obesity 17 : 2254–2257.
2. WillerCJ, SpeliotesEK, LoosRJ, LiS, LindgrenCM, et al. (2009) Six new loci associated with body mass index highlight a neuronal influence on body weight regulation. Nat Genet 41 : 25–34.
3. RenstromF, PayneF, NordstromA, BritoEC, RolandssonO, et al. (2009) Replication and extension of genome-wide association study results for obesity in 4923 adults from northern Sweden. Hum Mol Genet 18 : 1489–1496.
4. BauerF, ElbersCC, AdanRA, LoosRJ, Onland-MoretNC, et al. (2009) Obesity genes identified in genome-wide association studies are associated with adiposity measures and potentially with nutrient-specific food preference. Am J Clin Nutr 90 : 951–959.
5. MongeI, KrishnamurthyR, SimsD, HirtF, SpenglerM, et al. (2001) Drosophila transcription factor AP-2 in proboscis, leg and brain central complex development. Development 128 : 1239–1252.
6. WilliamsMJ, GoergenP, RajendranJ, KlockarsA, KasagiannisA, et al. (2014) Regulation of aggression by obesity-linked genes TfAP-2 and Twz through octopamine signaling in Drosophila. Genetics 196 : 349–362.
7. WilliamsM, AlménM, FredrikssonR, SchiöthH (2012) What model organisms and interactomics can reveal about the genetics of human obesity. Cell Mol Life Sci 69 : 3819–3834.
8. ZarelliVE, DawidIB (2013) Inhibition of neural crest formation by Kctd15 involves regulation of transcription factor AP-2. Proc Natl Acad Sci U S A 110 : 2870–2875.
9. GiotL, BaderJS, BrouwerC, ChaudhuriA, KuangB, et al. (2003) A protein interaction map of Drosophila melanogaster. Science 302 : 1727–1736.
10. WankS, PisegnaJ, de WeerthA (1994) Cholecystokinin receptor family. Molecular cloning, structure, and functional expression in rat, guinea pig, and human. Ann N Y Acad Sci 713 : 49–66.
11. MönnikesH, LauerG, ArnoldR (1997) Peripheral administration of cholecystokinin activates c-fos expression in the locus coeruleus/subcoeruleus nucleus, dorsal vagal complex and paraventricular nucleus via capsaicin-sensitive vagal afferents and CCK-A receptors in the rat. Brain Res 770 : 277–288.
12. SöderbergJ, CarlssonM, NässelD (2012) Insulin-Producing Cells in the Drosophila Brain also Express Satiety-Inducing Cholecystokinin-Like Peptide, Drosulfakinin. Front Endocrinol 3 : 109.
13. ZhangT, BranchA, ShenP (2013) Octopamine-mediated circuit mechanism underlying controlled appetite for palatable food in Drosophila. Proc Natl Acad Sci U S A 110 : 15431–15436.
14. Al-AnziB, ArmandE, NagameiP, OlszewskiM, SapinV, et al. (2010) The Leucokinin Pathway and Its Neurons Regulate Meal Size in Drosophila. Curr Biol 20 : 969–978.
15. JaWW, CarvalhoGB, MakEM, de la RosaNN, FangAY, et al. (2007) Prandiology of Drosophila and the CAFE assay. Proc Natl Acad Sci U S A 104 : 8253–8256.
16. LuanH, LemonWC, PeabodyNC, PohlJB, ZelenskyPK, et al. (2006) Functional dissection of a neuronal network required for cuticle tanning and wing expansion in Drosophila. J Neurosci 26 : 573–584.
17. PonceletM, ArnoneM, HeaulmeM, GonalonsN, GueudetC, et al. (1993) Neurobehavioral effects of SR 27897, a selective cholecystokinin type A (CCK-A) receptor antagonist. Naunyn Schmiedebergs Arch Pharmacol 348 : 102–107.
18. GullyD, FrehelD, MarcyC, SpinazzeA, LespyL, et al. (1993) Peripheral biological activity of SR 27897: a new potent non-peptide antagonist of CCKA receptors. Eur J Pharmacol 232 : 13–19.
19. ChenX, PetersonJ, NachmanR, GanetzkyB (2012) Drosulfakinin activates CCKLR-17D1 and promotes larval locomotion and escape response in Drosophila. Fly 6 : 290–297.
20. ChenX, GanetzkyB (2012) A neuropeptide signaling pathway regulates synaptic growth in Drosophila. J Cell Biol 196 : 529–543.
21. GoodmanA (2008) Neurobiology of addiction. An integrative review. Biochem Pharmacol 75 : 266–322.
22. NarayananN, GuarnieriD, DiLeoneR (2010) Metabolic hormones, dopamine circuits, and feeding. Frontier Neuroendocrinol 31 : 104–112.
23. GuJ, PolakJ, TapiaF, MarangosP, PearseA (1981) Neuron-specific enolase in the Merkel cells of mammalian skin. The use of specific antibody as a simple and reliable histologic marker. Am J Pathol 104 : 63–68.
24. ReevesS, HelmanL, AllisonA, IsraelM (1989) Molecular cloning and primary structure of human glial fibrillary acidic protein. Proc Natl Acad Sci U S A 86 : 5178–5182.
25. SöderbergO, GullbergM, JarviusM, RidderstråleK, LeuchowiusK-J, et al. (2006) Direct observation of individual endogenous protein complexes in situ by proximity ligation. Nat Methods 3 : 995–1995.
26. ElorantaJJ, HurstHC (2002) Transcription factor AP-2 interacts with the SUMO-conjugating enzyme UBC9 and is sumolated in vivo. J Biol Chem 277 : 30798–30804.
27. CaoJ, NiJ, MaW, ShiuV, MillaLA, et al. (2014) Insight into Insulin Secretion from Transcriptome and Genetic Analysis of Insulin-Producing Cells of Drosophila. Genetics 197 : 175–192.
28. MeyerAH, LanghansW, ScharrerE (1989) Vasopressin reduces food intake in goats. Q J Exp Physiol 74 : 465–473.
29. MortonGJ, ThatcherBS, ReidelbergerRD, OgimotoK, Wolden-HansonT, et al. (2012) Peripheral oxytocin suppresses food intake and causes weight loss in diet-induced obese rats. Am J Physiol Endocrinol Metab 302: E134–144.
30. BlevinsJE, HoJM (2013) Role of oxytocin signaling in the regulation of body weight. Rev Endocr Metab Disord 14 : 311–329.
31. WuQ, ZhaoZ, ShenP (2005) Regulation of aversion to noxious food by Drosophila neuropeptide Y - and insulin-like systems. Nat Neurosci 8 : 1350–1355.
32. WangY, PuY, ShenP (2013) Neuropeptide-gated perception of appetitive olfactory inputs in Drosophila larvae. Cell Rep 3 : 820–830.
33. ShimazuT, NomaM, SaitoM (1986) Chronic infusion of norepinephrine into the ventromedial hypothalamus induces obesity in rats. Brain Res 369 : 215–223.
34. CincottaAH, LuoS, ZhangY, LiangY, BinaKG, et al. (2000) Chronic infusion of norepinephrine into the VMH of normal rats induces the obese glucose-intolerant state. Am J Physiol Regul Integr Comp Physiol 278: R435–444.
35. WangCX, YangH, PerrottCJ, GietzenDW (1999) Inhibition of norepinephrine release in the rat ventromedial hypothalamic nucleus in essential amino acid deficiency. Neurosci Lett 259 : 53–55.
36. BerghC, SjöstedtS, HellersG, ZandianM, SöderstenP (2003) Meal size, satiety and cholecystokinin in gastrectomized humans. Physiol Behav 78 : 143–147.
37. RitterR, CovasaM, MatsonC (1999) Cholecystokinin: proofs and prospects for involvement in control of food intake and body weight. Neuropeptides 33 : 387–399.
38. Burton-FreemanB, GietzenD, SchneemanB (1999) Cholecystokinin and serotonin receptors in the regulation of fat-induced satiety in rats. Am J Physiol 276 : 34.
39. MoranT, KatzL, Plata-SalamanC, SchwartzG (1998) Disordered food intake and obesity in rats lacking cholecystokinin A receptors. Am J Physiol 274 : 25.
40. VoigtJ, FinkH, MarsdenC (1995) Evidence for the involvement of the 5-HT1A receptor in CCK induced satiety in rats. Naunyn Schmiedebergs Arch Pharmacol 351 : 217–220.
41. GreenbergD (1993) Is cholecystokinin the peptide that controls fat intake? Nutr Rev 51 : 181–183.
42. MyersRD, SwartzwelderHS, PeinadoJM, LeeTF, HeplerJR, et al. (1986) CCK and other peptides modulate hypothalamic norepinephrine release in the rat: dependence on hunger or satiety. Brain Res Bull 17 : 583–597.
43. BayonY, TrinidadAG, de la PuertaML, Del Carmen RodriguezM, BogetzJ, et al. (2008) KCTD5, a putative substrate adaptor for cullin3 ubiquitin ligases. FEBS J 275 : 3900–3910.
44. CorrealeS, PironeL, Di MarcotullioL, De SmaeleE, GrecoA, et al. (2011) Molecular organization of the cullin E3 ligase adaptor KCTD11. Biochimie 93 : 715–724.
45. WangS, TulinaN, CarlinDL, RulifsonEJ (2007) The origin of islet-like cells in Drosophila identifies parallels to the vertebrate endocrine axis. Proc Natl Acad Sci U S A 104 : 19873–19878.
46. DudaiY (1982) High-affinity octopamine receptors revealed in Drosophila by binding or [3H]octopamine. Neurosci Lett 28 : 163–170.
47. ChomczynskiP, SacchiN (1987) Single-step method of RNA isolation by acid guanidinium thiocyanate-phenol-chloroform extraction. Anal Biochem 162 : 156–159.
48. LindblomJ, JohanssonA, HolmgrenA, GrandinE, NedergårdC, et al. (2006) Increased mRNA levels of tyrosine hydroxylase and dopamine transporter in the VTA of male rats after chronic food restriction. Eur J Neurosci 23 : 180–186.
49. RamakersC, RuijterJ, DeprezR, MoormanA (2003) Assumption-free analysis of quantitative real-time polymerase chain reaction (PCR) data. Neurosci Lett 339 : 62–66.
50. VandesompeleJ, De PreterK, PattynF, PoppeB, Van RoyN, et al. (2002) Accurate normalization of real-time quantitative RT-PCR data by geometric averaging of multiple internal control genes. Genome Biol 3: RESEARCH0034.
Štítky
Genetika Reprodukční medicínaČlánek vyšel v časopise
PLOS Genetics
2014 Číslo 9
- Kazuistika – Perspektivy využití precizované medicíny v rámci personalizované specifické terapie onkologických pacientů
- Nobelova cena za chemii pro genetické nůžky: Objev, který změní naši budoucnost?
- Technologie na bázi RNA v klinické praxi: od přebarvených petúnií k terapii vzácných a dosud jen obtížně léčitelných chorob u lidí
- „Nepředstavovali jsme si, že náš výzkum povede přímo ke vzniku nových léků, dokonce ještě za našeho života“
- Bezplatné služby pro diagnostiku ATTRv amyloidózy pro kardiology
Nejčtenější v tomto čísle
- Admixture in Latin America: Geographic Structure, Phenotypic Diversity and Self-Perception of Ancestry Based on 7,342 Individuals
- Nipbl and Mediator Cooperatively Regulate Gene Expression to Control Limb Development
- Genome Wide Association Studies Using a New Nonparametric Model Reveal the Genetic Architecture of 17 Agronomic Traits in an Enlarged Maize Association Panel
- Histone Methyltransferase MMSET/NSD2 Alters EZH2 Binding and Reprograms the Myeloma Epigenome through Global and Focal Changes in H3K36 and H3K27 Methylation
Zvyšte si kvalifikaci online z pohodlí domova
Mazová zátka a její řešení
nový kurzVšechny kurzy