
Causal Variation in Yeast Sporulation Tends to Reside in a Pathway Bottleneck
Distinguishing the small number of genetic variants that impact phenotypes from the huge number of innocuous variants within an individual's genome is a difficult problem. Several hypotheses concerning the location of causal variants have been put forward based on the fact that genes are often organized into signaling cascades where the activation of a gene at the top of a pathway in turn activates large numbers of downstream genes. One hypothesis states that causal variations are more likely to reside in the genes at the top of these pathways because their effects are amplified by the signaling cascade. Here we provide support for this hypothesis by showing that causal genetic variants in yeast sporulation cluster around a gene at the top of the sporulation signaling cascade. Our result suggests a way to focus the search for causal genetic variants, including those that cause disease, on a smaller number of genes that are more likely to harbor important variations.
Published in the journal:
. PLoS Genet 10(9): e32767. doi:10.1371/journal.pgen.1004634
Category:
Research Article
doi:
https://doi.org/10.1371/journal.pgen.1004634
Summary
Distinguishing the small number of genetic variants that impact phenotypes from the huge number of innocuous variants within an individual's genome is a difficult problem. Several hypotheses concerning the location of causal variants have been put forward based on the fact that genes are often organized into signaling cascades where the activation of a gene at the top of a pathway in turn activates large numbers of downstream genes. One hypothesis states that causal variations are more likely to reside in the genes at the top of these pathways because their effects are amplified by the signaling cascade. Here we provide support for this hypothesis by showing that causal genetic variants in yeast sporulation cluster around a gene at the top of the sporulation signaling cascade. Our result suggests a way to focus the search for causal genetic variants, including those that cause disease, on a smaller number of genes that are more likely to harbor important variations.
Introduction
Understanding the genetic architecture of complex traits is a major challenge in quantitative genetics. This includes determining what types of genes and causal variants underlie quantitative trait loci (QTL), as well as how variants interact with each other. Whether causal variants share characteristics is a topic of great debate in the quantitative genetics community. These characteristics include whether variants are located in coding or non-coding genomic regions [1], [2], in specific hotspot genes or spread throughout the genome [3], [4], and whether certain classes of genes are more likely to harbor hotspots than others [5]–[7]. One class of genes which has been suggested as natural harbors for causal variation are ‘input/output’ genes that sit at regulatory bottlenecks in genetic pathways [4], [8].
Input/output genes “integrate an extensive array of inputs, the regulatory state, and they produce an on or off transcriptional output” whose expression drives differentiation of a specific cell fate [3]. This gives the signaling pathway a characteristic hourglass shape. Many developmental pathways have this structure, with the canonical examples being trichome and bristle development in Drosophila melanogaster, with shavenbaby and scute as the respective input/output genes in each pathway [9], [10]. Input/output genes are more likely to be essential to organism survival, indicating they play important roles in developmental pathways [11], [12]. Location in the genetic pathway is thought to be crucial in determining the effect of variation on phenotype; if a gene affects too many traits, negative pleiotropy may select against the accumulation of causal variants [13]. On the other hand, a gene that resides towards the end of a signaling cascade may tolerate more variation, but will also affect many fewer aspects of the output response and so be less likely to have a strong effect on the phenotype. Input/output genes are positioned centrally and as such are hypothesized to be likely locations for the accumulation of causal variation, as their variants should provide strong, but specific effects on the traits they regulate.
Another pathway which conforms to this hourglass shape is the Saccharomyces cerevisiae sporulation signaling pathway, with the transcription factor IME1 acting as the input/output gene [14], [15]. Sporulation includes both meiosis and spore formation, and over 300 genes have been found to be essential to the process of sporulation in laboratory strains [16]. The expression of IME1 is influenced by many factors, including ploidy, cell cycle status, nutritional environment, respiration, and pH [14], [17]–[20]. These multiple inputs form the top bulb of the hourglass. These signals all funnel into IME1, and once IME1 is expressed, it activates expression of a cascade of genes that irreversibly initiates sporulation [15]. The initiation of sporulation causes changes in the expression levels of more than 1000 genes [21], which form the bottom bulb of the hourglass.
If input/output genes harbor causal natural variation, we would expect IME1 to contain quantitative trait nucleotides (QTNs) causing differences in sporulation. Our previous study identified four natural causal variants responsible for 80% of the difference in sporulation efficiency between a high sporulating oak tree isolate and a low sporulating vineyard strain: two in IME1; one in RME1, which directly binds the IME1 promoter in response to ploidy; and one in RSF1, which regulates respiration, a process essential for sporulation [22]. These results support the hypothesis that genes surrounding the IME1 signaling bottleneck contain causal natural variation, in addition to the input/output gene itself. However, these are results from a single pair of strains chosen to have the most extreme phenotypic differences, and it is possible that natural variation in strains with more moderate phenotypes resides in genes outside of the sporulation bottleneck. Other efforts to identify the genetic basis of differences in sporulation efficiency among yeast strains have used the laboratory strains SK1 and S288c, and have identified several genes outside of the sporulation pathway [23], [24]. However, since these two strains have been propagated in the lab for thousands of generations, and since two of the genes identified in these studies have highly pleiotropic effects [25]–[29], we do not expect the variation found in the S288c×SK1 cross to be representative of naturally occurring variation.
A meta-analysis of causal variation found that input/output genes were more likely to be hotspots, but was based on a single QTL identified per trait [7]. It is possible that the strongest QTL affecting a trait is located in the input/output gene and other QTL are more evenly distributed across other parts of the pathway. To test the hypothesis that genes surrounding the sporulation pathway bottleneck are more likely to contain natural causal variation, we performed crosses with two additional vineyard isolates to identify additional causal variants responsible for differences in sporulation efficiency. We again identified RME1 and IME1 as repositories of causal variation, but in addition we found two more genes that contain causal natural variation for sporulation efficiency: RIM101 and RIM15. Both genes are upstream regulators of IME1. Our finding that the causal variation underlying differences in sporulation efficiency among vineyard isolates is clustered in genes that regulate IME1 supports the hypothesis that bottlenecks in regulatory pathways are likely repositories of causal natural variation.
Results
Previously we identified 4 QTN in 3 genes, IME1, RME1, and RSF1, which explain 80% of the difference in sporulation efficiency between YPS606, an oak tree isolate and BC187, a vineyard isolate. As these genes reside at the bottleneck in the sporulation pathway, we asked whether causal variants in other strains would also reside in bottleneck genes. In this study, we identify QTL responsible for approximately two thirds of the variation in sporulation efficiency between two new vineyard isolates, UCD51 and M5, and the same oak isolate, YPS606. We chose to use the same oak strain as in previous studies because we had previously shown very limited variation in sporulation efficiency among oak isolates [30]. The vineyard strains were chosen because while they contain the causal RME1 vineyard variant, as all vineyard strains do, they do not contain any of the other three identified causal SNPs [22]. Though vineyard strains have been shown to have similar levels of genomic diversity compared to the oak populations [31], [32], they show differences in the sporulation phenotype. While YPS606 sporulates at 99% [30], UCD51 sporulates at 25.8% and M5 sporulates at 35.2%. We sought to identify polymorphisms that contribute to low sporulation efficiency in these two vineyard strains.
Monosporic vineyard isolates of UCD51 and M5 containing the SPS2::GFP sporulation marker were independently crossed to the previously described YPS606 oak isolate. For simplicity, the UCD51×YPS606 cross will be referred to as cross 1, and the M5×YPS606 cross will be referred to as cross 2. We phenotyped 449 doubled haploid offspring for cross 1 and 468 for cross 2 for sporulation efficiency (Figure 1). From these phenotype distributions, we calculated broad sense heritabilities of H2 = 95.7% for cross 1 and H2 = 99.7% for cross 2, which confirm that most of the variation in these crosses is genetic in nature. We also note that both crosses exhibit transgressive segregation, with offspring sporulating both higher and lower than the parental strains, which suggests the presence of one or more transgressive alleles.

To identify QTL responsible for differences in sporulation efficiency in each cross, we used composite interval mapping (see methods). We found seven QTL in cross 1, on chromosomes 2, 4, 6, 7, 8, 10, and 15. In cross 2 we identify five QTL, two on chromosome 7, and one each on chromosomes 8, 10, and 13. LOD traces for each cross are found in Figure 2. Effect directions and genomic coordinates of the marker nearest to each QTL apex are found in Table 1.


As expected based on the transgressive segregation seen among the offspring of both crosses (Figure 1), there are a mixture of allele effects in each cross. The BC248 oak parent mostly contributes alleles that increase sporulation efficiency: five alleles in cross 1 (on chromosomes 4, 6, 7, 8, and 15) and four alleles in cross 2 (both QTL on chromosome 7 as well as those on chromosomes 8 and 13). The oak parent also contributes alleles in each cross that decrease sporulation efficiency (on chromosomes 2 and 10 in cross 1 and chromosome 10 in cross 2). Based on genomic position and effect direction, three QTL were shared across both crosses. The first QTL on chromosome 7 and the chromosome 8 QTL both map to the same marker in each cross while the QTL on chromosome 10 map to markers less than 30 kb apart (Table 1), suggesting these three QTL represent shared variation between these two vineyard isolates.
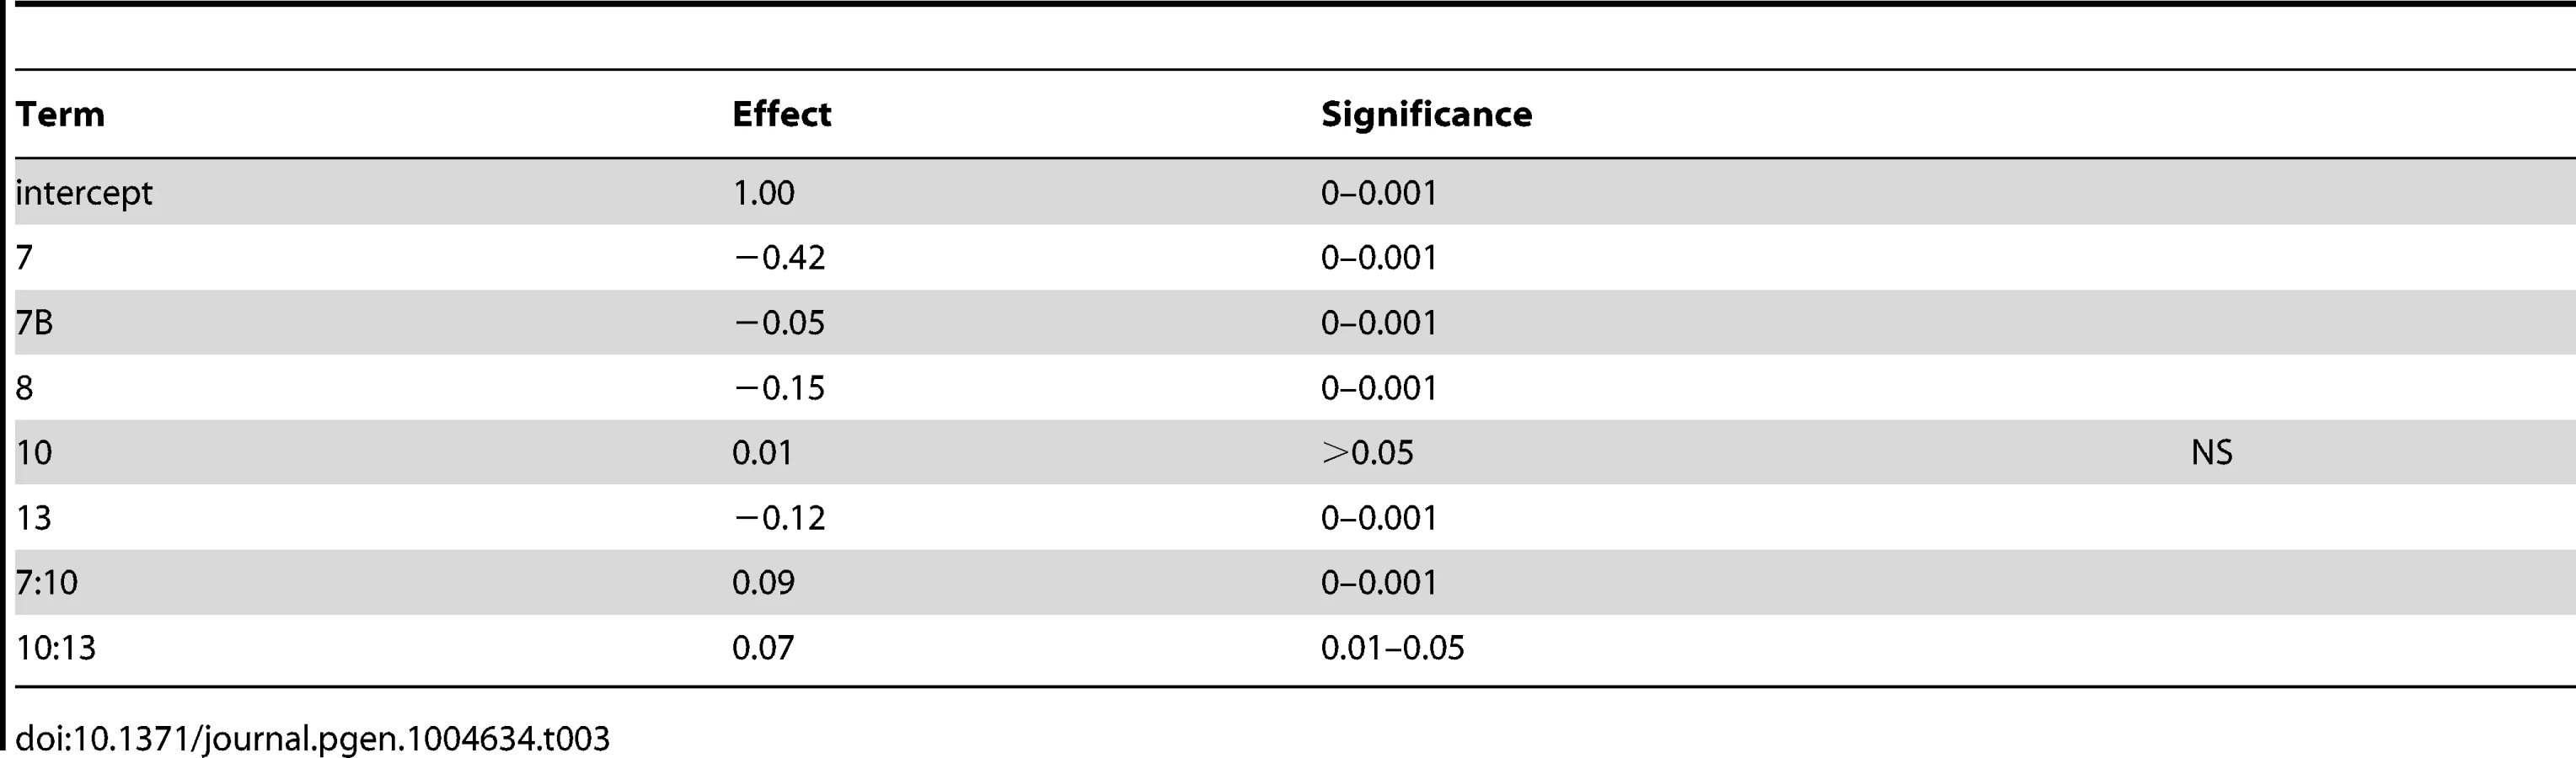
To determine the contribution of each QTL to variation in sporulation efficiency, we created linear models describing their effects. Using the markers nearest to each QTL apex, we applied a forward and backward stepwise regression using Bayesian information criterion (BIC) to select significant terms to create a linear model describing each cross (coefficients for cross 1 model are found in Table 2; for cross 2 model see Table 3). The model for cross 1 indicates a high amount of epistasis among QTL. All two-way interactions between the QTL on chromosomes 6, 7, and 10 contribute significantly to the model. Additionally, the interaction between the QTL on chromosomes 4 and 6 suggests the chromosome 4 QTL is entirely epistatic to the chromosome 6 QTL, as the additive term for the chromosome 4 QTL is non-significant when the two-way interaction is included in the model. The model for cross 2 identifies two two-way interactions, where the QTL on chromosome 10 interacts both with the first QTL on chromosome 7 as well as the chromosome 13 QTL. These interactions again suggest a purely epistatic QTL, where the chromosome 10 QTL acts entirely through the chromosome 7 and 13 loci. The R2 for the cross 1 model is 0.67; for the cross 2 model it is 0.74, indicating we have captured between two thirds and three quarters of the variation in sporulation efficiency in each cross with these QTL.

To identify QTL for further analysis, we first eliminated those found in previous studies. The QTL on chromosome 7 found at 558 kb are located over the previously identified sporulation gene RME1, and both parental vineyard isolates contain the polymorphism previously shown to decrease sporulation [22]. The QTL regions found on chromosome 10 in both crosses and 13 in cross 2 were identified and explored in a previous study [33]. As these loci had been already been examined in detail, we chose to focus on other QTL for further analysis. The QTL located on chromosomes 2, 4, and 15 in cross 1 and on chromosome 7 at 838 kb in cross 2 have small effect sizes and large genomic intervals, so we did not attempt to identify QTG. Instead we used these intervals to confirm that SNP rates in sporulation genes were similar to those of genes not in the sporulation pathway. These QTL contain a total of 27 genes found to affect sporulation in a survey of the yeast deletion collection [16], which we compared with an equal number of genes from the same intervals that do not affect sporulation. We find the polymorphism rate in these sporulation genes is indistinguishable from that of the non-sporulation genes (Wilcoxian test, P = 0.67).
We therefore sought to identify QTG under the QTL on chromosomes 6 (cross 1) and 8 (both crosses). In addition to being in previously untested genomic regions, each of these QTL have reasonable effect sizes in our linear models and good candidate genes in their 99% confidence interval (approximated as a 2 LOD drop from the apex of the QTL). We tested candidate quantitative trait genes RIM15 located on chromosome 6 and RIM101 located on chromosome 8 in each QTL using reciprocal hemizygosity tests [29]. Since the QTL on chromosome 8 was identified in both crosses, both vineyard parents were used to create two sets of reciprocal hemizygotes; for RIM15 only UCD51 was used to create reciprocal hemizygotes. Figure 3 shows the results for the three sets of reciprocal hemizygotes tested; all three show significant differences between alleles (t-test, P<0.01). As expected based on the effect directions predicted by our linear model, the hybrid strains containing the oak alleles of RIM15 and RIM101 have increased sporulation efficiency while the hybrid strains containing only the vineyard allele have reduced sporulation efficiency. These results indicate that RIM15 underlies the chromosome 6 QTL in cross 1 while RIM101 underlies the chromosome 8 QTL in both crosses.

We began our search for causal polymorphisms with RIM101, as it was identified in both crosses. Most of the variation in RIM101 is shared between the vineyard isolates, and there are no obvious candidate causal polymorphisms. As compared to the oak sequence, RIM101 contains 27 SNPs and 3 insertion/deletions (indels) which are common to both UCD51 and M5. Ten of the SNPs cause non-synonymous coding changes and there is a polyQ expansion in YPS606. A conserved domain structure predictor identifies zinc finger regions covering 75% of the coding sequence [34] and encompassing most polymorphisms. Since we could not take the candidate approach to identify the causal polymorphism(s) in RIM101, we used a random replacement approach to identify regions of interest within the gene (see methods). Only one region showed a significant phenotypic difference between oak and vineyard alleles, (t-test, P = 5×10⁻⁴). This region contains the coding portion of RIM101 between nucleotide positions 576 and 940, including 6 SNPs and the polyQ indel, all of which are present in both vineyard isolates used in our crosses. Two of the SNPs are synonymous and another two are in the same codon, resulting in a total of four protein differences to assay. We replaced each of these four alleles individually in the oak background and then backcrossed the single allele swap strains to the oak parent to remove any transformation induced mutations. We also backcrossed one of the complete locus replacements created during the random replacement to obtain an oak strain homozygous for the entire M5 suite of polymorphisms in RIM101. The phenotypes of the allele replacements tested are shown in Figure 4A. Only the G746T SNP shows a significant difference from the unaltered oak isolate (t-test, P = 5.5×10⁻⁹). This SNP results in a W249L amino acid substitution, with the oak T allele changing a tryptophan into a leucine.

We also identified a causal polymorphism in RIM15. Since RIM15 was identified only in cross 1, using UCD51, and not in cross 2 or previous crosses using BC187 [22], [33], we reasoned that it was likely that the causal allele was unique to UCD51. While there are 80 SNPs and 8 indels between the vineyard UCD51 isolate and the oak YPS606 isolate, only 5 SNPs and 1 indel are not also found in BC187. RIM15 is a glucose repressible protein kinase which regulates the formation of the IME1-UME6 complex necessary for sporulation [35], [36]. One of these SNPs, C3812A, results in a P1271H substitution and is located in a predicted kinase extension domain [34]. This proline residue is also conserved in S. paradoxus, S bayanus, S. mikatae, and S. castellii, further suggesting that this residue is a good candidate causal variant [37]. We tested this hypothesis by creating the allele replacement for C3812A in the oak background and found that its sporulation efficiency was significantly different from the unmodified oak isolate (Figure 4B, t-test, P = 2.6×10⁻²³). Since we did not test all of the polymorphisms in RIM15, it is possible there are additional causal alleles in the gene.
To determine how common the identified causal SNPs are, we assayed a panel of oak and vineyard isolates for both alleles (Table 4). We found that while RIM101 W249L segregates based on oak or vineyard classification, RIM15 P1271H was not present in any other isolate we assayed, regardless of oak or vineyard background, including the 23 strain sequences available on the Saccharomyces Genome Database [37]. This suggests that the RIM101 W249L allele was fixed early in the divergence of vineyard yeasts, while the RIM15 P1271H variant is a more recent change that is unique to the UCD51 vineyard isolate.

To investigate how our newly identified sporulation QTN interact with previously identified QTN, we crossed the RIM101 and RIM15 vineyard polymorphisms into a previously created YPS606 oak strain background allele replacement panel containing the RME1, RSF1, IME1-coding, and IME1-noncoding polymorphisms [22]. These panels provide sets of nearly isogenic strains containing all possible combinations of causative alleles in a constant background, and are powerful tools for assessing epistasis between causal variants. We used these new RIM101 and RIM15 allele replacement panels to create backwards regression linear models to identify interactions among QTN. We found that the RIM101 QTN interacts with the both the RME1 and IME1-coding QTN, but that the interaction with the RME1 QTN is only significant when the IME1-coding QTN is considered (Table 5). RIM15 on the other hand, shows extensive interactions with all previously identified QTN, again with the RME1 interaction only contributing significantly when one of the other three QTN are taken into account (Table 6). These results provide further evidence that interactions between QTN are common, even between QTN that are not co-segregating in natural populations.


Discussion
All of the quantitative trait genes for sporulation efficiency we have thus far identified in natural strains act at the bottleneck of the sporulation decision pathway at IME1 (Figure 5; only a subset of sporulation genes shown, see [14], [15], [17], [38]–[40] for more detail). Previously, we identified three transcription factors at this bottleneck, RME1, IME1, and RSF1 [22]. With this study we add another transcription factor, RIM101, and a kinase, RIM15. RIM15 is responsive to glucose and helps IME1 activate downstream sporulation genes [35], [41]. Specifically, Rim15 removes Sin3 and Rpd3 from Ume6, which allows Ime1 to bind and activate early meiotic genes [36]. IME1 and RIM15 work together to create the proper set of sporulation signals in response to a given nutritional environment, and the vineyard alleles in RIM15 appear to slow that response. In this context, the genetic interactions we observe between RIM15 and other genes in the sporulation pathway seem likely to have some basis in physical interactions between the genes involved.

RIM101's contribution to the regulation of sporulation efficiency is more complex. It was initially identified as a zinc finger containing transcriptional activator of IME1 [42], placing it upstream of the initial sporulation decision, likely through SMP1 regulation of IME1 [43]. Its expression and cleavage into an active form are stimulated by alkaline growth conditions, however Rim101 cleavage has also been observed prior to detectable pH increases [19], [44]. Cleaved Rim101 has been shown to regulate the mid to late sporulation genes DIT1 and DIT2 as well as RIM8, one of the early sporulation genes required for Rim101 cleavage [43], [45], [46], suggesting that RIM101 regulates various processes throughout the sporulation signaling cascade in addition to IME1. Finally, cells which are rim101Δ cannot respond to pH based cell-cell signaling during sporulation, which normally controls efficiency and patterning in solid colonies [18], suggesting that RIM101 may also be involved in intercellular communication. It remains to be seen what subset of these functions the W249L allele of RIM101 affects during sporulation in vineyard and oak yeast isolates.
Overall, we identified nine different genomic regions in crosses with two new vineyard isolates that contain sporulation efficiency QTL. Of these regions, five were found in previous studies [22], [33]. We expected to find at least one QTL in common with our previous work, as the RME1 allele we identified in BC187 is fixed across all vineyard isolates we assayed [22]. The causal alleles we identified in RIM101 also segregate perfectly between oak and vineyard isolates, suggesting they too are fixed across these two populations. The four QTL identified in this study which had not been identified in previous crosses suggest that many variants involved in changes in sporulation efficiency are specific to individual vineyard isolates. We mapped one of these QTL to the QTG RIM15 and identified a causal SNP. This polymorphism is present in only UCD51 and not in any of the other 48 isolates assessed. While without causal polymorphisms we cannot assess the prevalence of the other three newly identified QTL, the absence of QTL in two of the three vineyard isolates we have so far assayed suggests that they are not fixed alleles in the vineyard strains. We also confirmed that polymorphism rates are not significantly different between sporulation and non-sporulation genes in these other QTL.
In a previous study, a QTL was found over RIM101 when the four large effect QTN were fixed as oak alleles in a cross between the same YPS606 oak strain and vineyard strain BC187. No QTL was identified in the reciprocal cross fixing the large effect alleles as the vineyard variants [33]. This indicates there is strong epistasis between one of the oak large effect QTN and what we now know to be RIM101. By adding the RIM101 QTN to our allele replacement panel, we have identified significant interactions between the RIM101 QTN, IME1-coding QTN, and RME1 QTN. These interactions were enough to mask the effect of the RIM101 QTN in the initial BC187×YPS606 cross. These sorts of epistatic masking interactions, also known as compositional epistasis, have been proposed to be at least partially responsible for the ‘missing heritability’ problem commonly encountered in human GWAS studies [47]–[49], and they do not appear to be an infrequent occurrence. We previously identified a QTL in the same region of chromosome 10 in the BC187×YPS606 fixed cross containing the large effect vineyard variants [33]. Both chromosome 10 QTL identified in this study exhibit epistatic interactions with the chromosome 7 QTL over RME1, suggesting that the chromosome 10 QTL effect present in all three crosses depends on the RME1 allele present in all vineyard strains. Both the RIM101 QTN and the chromosome 10 QTL are excellent examples of how epistatic interactions can camouflage causal variants underlying complex traits.
In this study we have identified two new QTGs: RIM101 and RIM15. We determined the causal SNP in RIM101 is a W249L substitution that is conserved among vineyard isolates, and that a causal SNP in RIM15 that results in a P1271H substitution is unique to the UCD51 vineyard isolate. We note that all of the QTGs we identified are known sporulation genes involved in the sporulation initiation regulatory decision at IME1. Our results support the hypothesis that causal variation in complex traits clusters around pathway bottlenecks, not just at input/output genes.
Materials and Methods
Strains
Parental oak isolate BC248 was derived from YPS606 and was described previously [30]. Parental vineyard isolate UCD51 was originally collected from Burgundy, France in 1948 and is available from the Phaff yeast culture collection at the University of California, Davis. Parental vineyard isolate M5 was originally collected from an Italian vineyard in 1993; both vineyard isolates were provided to us by Justin Fay [31]. UCD51 and M5 were transformed with a GFP reporter fused to the SPS2 ORF and marked by the kanMX4 resistance cassette, conferring resistance to G418 [50], then sporulated to create monosporic isolates BC812 (UCD51) and BC815 (M5) containing the SPS2::GFP fusion marked by the kanMX4 cassette. BC248 contains the SPS2::GFP fusion marked by the hygMX4 cassette, which confers resistance to hygromycin [51]. BC812 (UCD51)×BC248 (YPS606) is called cross 1 throughout this manuscript, while BC815 (M5)×BC248 (YPS606) is called cross 2. For each cross, double haploid offspring were collected as tetrads. For cross 1, 476 offspring were collected, 449 were phenotyped, and 308 were genotyped. Of the cross 1 offspring genotyped, 292 had reliable phenotypes and were used for QTL mapping analysis. For cross 2, 468 offspring were collected and phenotyped; 338 of these were genotyped and used for QTL mapping.
Genotyping and QTL Analysis
DNA was extracted using the ZR-96 Fungal/Bacterial DNA Kit (Zymo Research, Orange, CA). Markers were chosen and genotyped using a modified RAD-tag approach described previously [33]. Briefly, extracted DNA was digested using MfeI and MboI (NEB), then ligated to barcoded Illumina sequencing adapters (IDT, sequences available in table S1 of reference 33). Ligated samples were then pooled in groups of 48 (44 offspring and 2 each parental strain replicates), prepared for sequencing and sequenced using standard primers. Cross 1 pools A-G and cross 2 pools A, B, E and F were sequenced using the Illumina GAIIx platform; cross 2 pools C, D, I and J were sequenced using the Illumina HiSeq platform. Any reads longer than 36 bp were trimmed to 36 bp for analysis purposes. Raw sequencing reads for both crosses can be found in the sequence read archive (SRA) at SRP036836.
To select markers, reads were binned by barcode, barcodes were removed and reads were consolidated into unique sequences within barcode groups. Due to differences in reads per sequencing run, different thresholds were used to screen sequences prior to analysis. For cross 1, reads were required to be present 3 or more times per barcode to be analyzed further. For cross 2, GAIIx reads were required to be present 7 or more times, while reads sequenced on the HiSeq were required to occur 10 or more times. Sequences were then compared between parental samples to identify differential markers—either by sequenced polymorphism or presence/absence [33], and differential markers were mapped to the reference S. cerevisiae genome using Bowtie version 0.12.7 [52]. Only reads which mapped uniquely were considered as markers. Genomic markers were selected to be at least 10 kilobases away from the next nearest marker. For cross 1, 452 markers were identified and used for QTL mapping. For cross 2, 441 markers were identified and used for QTL mapping. Marker positions, sequences, and average read number per marker can be found in Table S1. All marker positions provided refer to the beginning of the read when mapped to the reference genome. For cross 1, average read number for presence/absence markers was 60, for sequence polymorphism markers it was 66. For cross 2, average read number for presence/absence markers was 157, for sequence polymorphism markers it was 145.
Final genotyping data can be found in Tables S2 (cross 1) and S3 (cross 2). A genetic map for each cross was created using Mapmaker/EXP version 3.0 (Whitehead Institute, Cambridge, MA). WinQTL Cartographer version 2.5 [53] was used to map QTL via composite interval mapping (CIM) as described previously [22], [33]. Thresholds for significance were set using 1000 permutations of each dataset.
Growth and Sporulation Measurement
Yeast were grown in standard Yeast-Peptone-Dextrose media (YPD, 1% yeast extract, 2% peptone, 2% dextrose). Hybridization during crossing was selected for by supplementing with G418 (200 mg/L, Invitrogen) and hygromycin (300 mg/L, Roche) and selecting for resistance to both drugs. Offspring tetrads were checked to confirm 2∶2 segregation for drug resistances. Gene knockout during reciprocal hemizygosity analysis was selected for by supplementing with nourseothricin (100 mg/G, Werner BioAgents).
The sporulation phenotype was assessed using flow cytometry to read out the SPS2::GFP marker as described previously [33]. Briefly, strains were grown at 400 rpm in 500 µL 96 well plate cultures in YPD for 15 hours, then 8 µL of the overnights were transferred to 400 µL 1% potassium acetate. After 30 hours, strains were frozen at −80°C prior to analysis by flow cytometry. Ideally, greater than 14,000 cell counts were used per offspring, per replicate. For cross 1, offspring were required to have at least 2000 counts for the trial to be recorded, and at least 2 trials for an average to be calculated. These limits were necessary as UCD51 and offspring have low cell viability during sporulation. Replicates were averaged to produce the final phenotyping data found in Tables S2 (cross 1) and S3 (cross 2). While the offspring phenotypes have a non-normal distribution, we have found that transformations do not normalize the phenotypes, affect the amount of epistasis we observe, or have an effect on QTL mapping [22], [30], so we performed our mapping analysis using untransformed phenotype values.
Broad sense heritability (H2) was calculated as described previously [30].
Polymorphism Rate Analysis
QTL located on chromosomes 2, 4, and 15 in cross 1 and chromosome 7 (at 838 kb) in cross 2 were assessed as follows. We identified sporulation genes found in the 99% confidence interval (approximated as a 2-LOD drop from the peak apex) of each QTL and selected an equal number of non-sporulation control genes. Sporulation genes were defined as those which had reduced sporulation in a survey of the yeast deletion collection, while genes whose deletion did not affect sporulation we considered to be non-sporulation genes [16]. These criteria identified 27 sporulation genes: 9 on chromosome 2, 11 on chromosome 4, 5 on chromosome 7, and 2 on chromosome 15. An equal number of non-sporulation genes from each interval were selected as a control group. Coding region sequences for these genes were identified in assemblies from oak (YPS606) for all genes, UCD51 for genes in QTL found from cross 1 (chromosomes 2, 4, and 15) and M5 for genes on chromosome 7 (838 kb QTL). Selected genes, sequences, and polymorphism counts can be found in Table S4. In cases where our sequencing did not completely cover the coding region, gene fragments were aligned to the reference sequence before comparing oak and vineyard SNPs. We aligned oak and vineyard sequences using CLUSTAL W [54] to identify polymorphisms. Using the number of polymorphisms per aligned kb we performed a Wilcox test in R to determine if the two groups of genes had different polymorphism rates. Draft whole genome assemblies for UCD51 (BC106) and M5 (BC242) were deposited as Whole Genome Shotgun projects at DDBJ/EMBL/GenBank under the accession numbers JPXA00000000 and JPXB00000000.
Reciprocal Hemizygosity Analysis
Reciprocal hemizygosity analysis of putative causal genes underlying QTL was performed as described previously [29], [33] with the following modifications. Genes to be tested were knocked out with the natMX4 cassette, which confers resistance to nourseothricin [51]. For RIM15, 6 knockouts of the UCD51 allele and 5 knockouts of the YPS606 allele were used. For RIM101, 5 knockouts of the UCD51 allele, 6 knockouts of the YPS606 allele, and 6 knockouts of the M5 allele were used. In all cases, each hemizygous hybrid strain was phenotyped at least 5 times, and the results of these technical replicates were averaged.
Causal SNP Identification
Identifying the causal change in RIM101 was accomplished by random replacement of the BC593 (YPS606, ho-, ura3-) RIM101 gene with the BC815 sequence as described previously for the identification of the RSF1 causal polymorphism [22]. Random crossing-over among the 29 strains assayed created 10 subsets of potential changes across the gene. Phenotyping was performed without supplementing YPD with uracil (as was done in the case of RSF1) as supplementation caused all strains to sporulate above 90%, which made differentiating between polymorphism groups challenging. T-tests were performed on each subset region to determine if strains containing oak and vineyard alleles in that region were significantly different from each other.
Once we identified a region with a significant difference, we tested each SNP in that region for causality by replacing each oak allele with the vineyard allele. To create these single allele swaps, we again started with the ho-, ura3 - YPS606 oak strain BC593 and replaced the region of RIM101 containing all 4 alleles with the pCORE cassette [55], then used stitching PCR to create 4 replacement constructs, each replacing a single allele. Once each construct was integrated to replace pCORE, transformants were Sanger sequenced to confirm a single allele change. Two sequenced allele replacements for each position were backcrossed to the BC248 parent isolate. Additionally, two complete locus (coding and noncoding) replacements created during the initial random crossing over phase were backcrossed to BC248 to create a full locus swap strain. Multiple replicates of diploid, ura3+ progeny containing each vineyard allele were phenotyped for sporulation efficiency as described previously, except that sporulation was assayed at 8 hours rather than 30 hours. To control for timing variability during flow cytometry at such an early timepoint, each plate was frozen twice and run on the cytometer in both forward and reverse order, then these numbers were averaged.
For RIM15, only the polymorphism causing the P1271H substitution was tested. Again, the region containing the polymorphism was replaced using pCORE in BC593. Then pCORE was replaced with a construct containing the single nucleotide swap. This replacement was confirmed by Sanger sequencing. Two correct alleles were backcrossed to BC248, and replicates of diploid, ura3+ progeny containing the allele replacement were phenotyped as described for the RIM101 swaps.
RIM101 and RIM15 Allele Replacement Panels
Each causal SNP swap from above (RIM101 G746T and RIM15 C3812A) was crossed into our existing oak background allele replacement panel of 16 strains containing all combinations of the 4 polymorphisms previously identified [22]. Since the two polymorphisms in IME1 are only 1521 bp apart and are unlikely to be separated by crossing over, three crosses were needed to obtain the complete panel. For each polymorphism, one RIM101 or RIM15 SNP replacement oak strain created above (each containing the SPS2::GFP fusion marked by the hygMX4 cassette) was crossed to the (in order, RME1, RSF1, IME1-coding, IME1-noncoding) VVVV, VVOV, and VVVO strains (which contain the SPS2::GFP fusion marked by the kanMX4 cassette) from the oak background allele replacement panel. Hybridization was selected for as described previously and resulting hybrids were sporulated and dissected to produce homozygous offspring.
Offspring were screened via RFLP to assemble two new panels of 16 oak stains containing all combinations of the oak and vineyard alleles of RME1, RSF1, IME1-NC, and IME1-C but only the vineyard allele of RIM101 or RIM15. Each of these were combined with the original panel of 16 strains containing the oak alleles or RIM101 and RIM15 to create two new allele replacement panels, consisting of all combinations of RIM101, RME1, RSF1, IME1-NC, IME1-C (designated RIM101 AR panel) and all combinations of RIM15, RME1, RSF1, IME1-NC, IME1-C (designated RIM15 AR panel). Each panel was phenotyped 24 times for sporulation efficiency as described previously and the phenotypes were used to build backwards regression linear models using BIC to calculate coefficient significance in R to explore interactions among alleles. Percent variance explained was calculated using a sum of squares method on the residuals by dropping each coefficient independently and recalculating the model predictions without refitting the remaining coefficients.
Supporting Information
Zdroje
1. CarrollSB (2005) Evolution at two levels: on genes and form. PLoS Biol 3: e245 doi:10.1371/journal.pbio.0030245
2. HoekstraHE, CoyneJA (2007) The locus of evolution: evo devo and the genetics of adaptation. Evolution 61 : 995–1016 doi:10.1111/j.1558-5646.2007.00105.x
3. SternDL, OrgogozoV (2008) The loci of evolution: how predictable is genetic evolution? Evolution 62 : 2155–2177 doi:10.1111/j.1558-5646.2008.00450.x
4. SternDL, OrgogozoV (2009) Is genetic evolution predictable? Science 323 : 746–751 doi:10.1126/science.1158997
5. GompelN, Prud'hommeB (2009) The causes of repeated genetic evolution. Dev Biol 332 : 36–47 doi:10.1016/j.ydbio.2009.04.040
6. ConteGL, ArnegardME, PeichelCL, SchluterD (2012) The probability of genetic parallelism and convergence in natural populations. Proc Biol Sci 279 : 5039–5047 doi:10.1098/rspb.2012.2146
7. MartinA, OrgogozoV (2013) The Loci of repeated evolution: a catalog of genetic hotspots of phenotypic variation. Evolution 67 : 1235–1250 doi:10.1111/evo.12081
8. DavidsonEH, RastJP, OliveriP, RansickA, CalestaniC, et al. (2002) A genomic regulatory network for development. Science 295 : 1669–1678 doi:10.1126/science.1069883
9. MarcelliniS, SimpsonP (2006) Two or four bristles: functional evolution of an enhancer of scute in Drosophilidae. PLoS Biol 4: e386 doi:10.1371/journal.pbio.0040386
10. Chanut-DelalandeH, FerrerP, PayreF, PlazaS (2012) Effectors of tridimensional cell morphogenesis and their evolution. Semin Cell Dev Biol 23 : 341–349 doi:10.1016/j.semcdb.2012.03.002
11. YuH, KimPM, SprecherE, TrifonovV, GersteinM (2007) The importance of bottlenecks in protein networks: correlation with gene essentiality and expression dynamics. PLoS Comput Biol 3: e59 doi:10.1371/journal.pcbi.0030059
12. HahnMW, KernAD (2005) Comparative genomics of centrality and essentiality in three eukaryotic protein-interaction networks. Mol Biol Evol 22 : 803–806 doi:10.1093/molbev/msi072
13. KoppA (2009) Metamodels and phylogenetic replication: a systematic approach to the evolution of developmental pathways. Evolution 63 : 2771–2789 doi:10.1111/j.1558-5646.2009.00761.x
14. MitchellAP (1994) Control of meiotic gene expression in Saccharomyces cerevisiae. Microbiol Rev 58 : 56–70.
15. NeimanAM (2011) Sporulation in the budding yeast Saccharomyces cerevisiae. Genetics 189 : 737–765 doi:10.1534/genetics.111.127126
16. EnyenihiAH, SaundersWS (2003) Large-scale functional genomic analysis of sporulation and meiosis in Saccharomyces cerevisiae. Genetics 163 : 47–54.
17. HonigbergSM, PurnapatreK (2003) Signal pathway integration in the switch from the mitotic cell cycle to meiosis in yeast. J Cell Sci 116 : 2137–2147 doi:10.1242/jcs.00460
18. PiccirilloS, WhiteMG, MurphyJC, LawDJ, HonigbergSM (2010) The Rim101p/PacC pathway and alkaline pH regulate pattern formation in yeast colonies. Genetics 184 : 707–716 doi:10.1534/genetics.109.113480
19. JambhekarA, AmonA (2008) Control of meiosis by respiration. Curr Biol 18 : 969–975 doi:10.1016/j.cub.2008.05.047
20. ColominaN, GaríE, GallegoC, HerreroE, AldeaM (1999) G1 cyclins block the Ime1 pathway to make mitosis and meiosis incompatible in budding yeast. EMBO J 18 : 320–329 doi:10.1093/emboj/18.2.320
21. ChuS, DeRisiJ, EisenM, MulhollandJ, BotsteinD, et al. (1998) The transcriptional program of sporulation in budding yeast. Science 282 : 699–705 doi:10.1126/science.282.5389.699
22. GerkeJ, LorenzK, CohenB (2009) Genetic interactions between transcription factors cause natural variation in yeast. Science 323 : 498–501 doi:10.1126/science.1166426
23. DeutschbauerAM, DavisRW (2005) Quantitative trait loci mapped to single-nucleotide resolution in yeast. Nat Genet 37 : 1333–1340 doi:10.1038/ng1674
24. Ben-AriG, ZenvirthD, ShermanA, DavidL, KlutsteinM, et al. (2006) Four linked genes participate in controlling sporulation efficiency in budding yeast. PLoS Genet 2: e195 doi:10.1371/journal.pgen.0020195
25. BaruffiniE, LodiT, DallabonaC, FouryF (2007) A single nucleotide polymorphism in the DNA polymerase gamma gene of Saccharomyces cerevisiae laboratory strains is responsible for increased mitochondrial DNA mutability. Genetics 177 : 1227–1231 doi:10.1534/genetics.107.079293
26. GaisneM, BécamAM, VerdièreJ, HerbertCJ (1999) A “natural” mutation in Saccharomyces cerevisiae strains derived from S288c affects the complex regulatory gene HAP1 (CYP1). Curr Genet 36 : 195–200.
27. LiuH, StylesCA, FinkGR (1996) Saccharomyces cerevisiae S288C has a mutation in FLO8, a gene required for filamentous growth. Genetics 144 : 967–978.
28. DemoginesA, SmithE, KruglyakL, AlaniE (2008) Identification and dissection of a complex DNA repair sensitivity phenotype in Baker's yeast. PLoS Genet 4: e1000123 doi:10.1371/journal.pgen.1000123
29. SteinmetzLM, SinhaH, RichardsDR, SpiegelmanJI, OefnerPJ, et al. (2002) Dissecting the architecture of a quantitative trait locus in yeast. Nature 416 : 326–330 doi:10.1038/416326a
30. GerkeJP, ChenCTL, CohenBA (2006) Natural isolates of Saccharomyces cerevisiae display complex genetic variation in sporulation efficiency. Genetics 174 : 985–997 doi:10.1534/genetics.106.058453
31. FayJC, BenavidesJA (2005) Evidence for Domesticated and Wild Populations of Saccharomyces cerevisiae. PLoS Genet 1 : 1–6 doi:10.1371/journal.pgen.0010005
32. LitiG, CarterDM, MosesAM, WarringerJ, PartsL, et al. (2009) Population genomics of domestic and wild yeasts. Nature 458 : 337–341 doi:10.1038/nature07743
33. LorenzK, CohenBA (2012) Small - and large-effect quantitative trait locus interactions underlie variation in yeast sporulation efficiency. Genetics 192 : 1123–1132 doi:10.1534/genetics.112.143107
34. Marchler-BauerA, BryantSH (2004) CD-Search: protein domain annotations on the fly. Nucleic Acids Res 32: W327–31 doi:10.1093/nar/gkh454
35. VidanS, MitchellAP (1997) Stimulation of yeast meiotic gene expression by the glucose-repressible protein kinase Rim15p. Mol Cell Biol 17 : 2688–2697.
36. PnueliL, EdryI, CohenM, KassirY (2004) Glucose and nitrogen regulate the switch from histone deacetylation to acetylation for expression of early meiosis-specific genes in budding yeast. Mol Cell Biol 24 : 5197–5208 doi:10.1128/MCB.24.12.5197-5208.2004
37. CherryJM, HongEL, AmundsenC, BalakrishnanR, BinkleyG, et al. (2012) Saccharomyces Genome Database: the genomics resource of budding yeast. Nucleic Acids Res 40: D700–5 doi:10.1093/nar/gkr1029
38. HoltLJ, HuttiJE, CantleyLC, MorganDO (2007) Evolution of Ime2 phosphorylation sites on Cdk1 substrates provides a mechanism to limit the effects of the phosphatase Cdc14 in meiosis. Mol Cell 25 : 689–702 doi:10.1016/j.molcel.2007.02.012
39. TevzadzeGG, PierceJV, EspositoRE (2007) Genetic evidence for a SPO1-dependent signaling pathway controlling meiotic progression in yeast. Genetics 175 : 1213–1227 doi:10.1534/genetics.106.069252
40. PiekarskaI, RytkaJ, RempolaB (2010) Regulation of sporulation in the yeast Saccharomyces cerevisiae. Acta Biochim Pol 57 : 241–250.
41. SmithHE, MitchellAP (1989) A transcriptional cascade governs entry into meiosis in Saccharomyces cerevisiae. Mol Cell Biol 9 : 2142–2152 doi:10.1128/MCB.9.5.2142.Updated
42. SuSS, MitchellAP (1993) Molecular characterization of the yeast meiotic regulatory gene RIM1. Nucleic Acids Res 21 : 3789–3797.
43. LambTM, MitchellAP (2003) The transcription factor Rim101p governs ion tolerance and cell differentiation by direct repression of the regulatory genes NRG1 and SMP1 in Saccharomyces cerevisiae. Mol Cell Biol 23 : 677–686 doi:10.1128/MCB.23.2.677
44. LiW, MitchellAP (1997) Proteolytic activation of Rim1p, a positive regulator of yeast sporulation and invasive growth. Genetics 145 : 63–73.
45. BogengruberE, EichbergerT, BrizaP, DawesIW, BreitenbachM, et al. (1998) Sporulation-specific expression of the yeast DIT1/DIT2 promoter is controlled by a newly identified repressor element and the short form of Rim101p. Eur J Biochem 258 : 430–436.
46. RothfelsK, TannyJC, MolnarE, FriesenH, CommissoC, et al. (2005) Components of the ESCRT pathway, DFG16, and YGR122w are required for Rim101 to act as a corepressor with Nrg1 at the negative regulatory element of the DIT1 gene of Saccharomyces cerevisiae. Mol Cell Biol 25 : 6772–6788 doi:10.1128/MCB.25.15.6772-6788.2005
47. ManolioTA, CollinsFS, CoxNJ, GoldsteinDB, HindorffLA, et al. (2009) Finding the missing heritability of complex diseases. Nature 461 : 747–753 doi:10.1038/nature08494
48. ZukO, HechterE, SunyaevSR, LanderES (2012) The mystery of missing heritability: Genetic interactions create phantom heritability. Proc Natl Acad Sci U S A 109 : 1193–1198 doi:10.1073/pnas.1119675109
49. HemaniG, KnottS, HaleyC (2013) An evolutionary perspective on epistasis and the missing heritability. PLoS Genet 9: e1003295 doi:10.1371/journal.pgen.1003295
50. WachA, BrachatA, PöhlmannR, PhilippsenP (1994) New heterologous modules for classical or PCR-based gene disruptions in Saccharomyces cerevisiae. Yeast 10 : 1793–1808.
51. GoldsteinAL, McCuskerJH (1999) Three new dominant drug resistance cassettes for gene disruption in Saccharomyces cerevisiae. Yeast 15 : 1541–1553 doi:;10.1002/(SICI)1097-0061(199910)15 : 14<1541::AID-YEA476>3.0.CO;2-K
52. LangmeadB, TrapnellC, PopM, SalzbergSL (2009) Ultrafast and memory-efficient alignment of short DNA sequences to the human genome. Genome Biol 10: R25 doi:10.1186/gb-2009-10-3-r25
53. Wang S, Basten CJ, Zeng Z-B (2011) Windows QTL Cartographer 2.5.
54. ThompsonJD, HigginsDG, GibsonTJ (1994) CLUSTAL W: improving the sensitivity of progressive multiple sequence alignment through sequence weighting, position-specific gap penalties and weight matrix choice. Nucleic Acids Res 22 : 4673–4680.
55. StoriciF, LewisLK, ResnickMA (2001) In vivo site-directed mutagenesis using oligonucleotides. Nat Biotechnol 19 : 773–776 doi:10.1038/90837
Štítky
Genetika Reprodukční medicínaČlánek vyšel v časopise
PLOS Genetics
2014 Číslo 9
- Kazuistika – Perspektivy využití precizované medicíny v rámci personalizované specifické terapie onkologických pacientů
- Nobelova cena za chemii pro genetické nůžky: Objev, který změní naši budoucnost?
- Technologie na bázi RNA v klinické praxi: od přebarvených petúnií k terapii vzácných a dosud jen obtížně léčitelných chorob u lidí
- „Nepředstavovali jsme si, že náš výzkum povede přímo ke vzniku nových léků, dokonce ještě za našeho života“
- Bezplatné služby pro diagnostiku ATTRv amyloidózy pro kardiology
Nejčtenější v tomto čísle
- Admixture in Latin America: Geographic Structure, Phenotypic Diversity and Self-Perception of Ancestry Based on 7,342 Individuals
- Nipbl and Mediator Cooperatively Regulate Gene Expression to Control Limb Development
- Genome Wide Association Studies Using a New Nonparametric Model Reveal the Genetic Architecture of 17 Agronomic Traits in an Enlarged Maize Association Panel
- Histone Methyltransferase MMSET/NSD2 Alters EZH2 Binding and Reprograms the Myeloma Epigenome through Global and Focal Changes in H3K36 and H3K27 Methylation
Zvyšte si kvalifikaci online z pohodlí domova
Mazová zátka a její řešení
nový kurzVšechny kurzy