
Genomic Analysis of Natural Selection and Phenotypic Variation in High-Altitude Mongolians
Deedu (DU) Mongolians, who migrated from the Mongolian steppes to the Qinghai-Tibetan Plateau approximately 500 years ago, are challenged by environmental conditions similar to native Tibetan highlanders. Identification of adaptive genetic factors in this population could provide insight into coordinated physiological responses to this environment. Here we examine genomic and phenotypic variation in this unique population and present the first complete analysis of a Mongolian whole-genome sequence. High-density SNP array data demonstrate that DU Mongolians share genetic ancestry with other Mongolian as well as Tibetan populations, specifically in genomic regions related with adaptation to high altitude. Several selection candidate genes identified in DU Mongolians are shared with other Asian groups (e.g., EDAR), neighboring Tibetan populations (including high-altitude candidates EPAS1, PKLR, and CYP2E1), as well as genes previously hypothesized to be associated with metabolic adaptation (e.g., PPARG). Hemoglobin concentration, a trait associated with high-altitude adaptation in Tibetans, is at an intermediate level in DU Mongolians compared to Tibetans and Han Chinese at comparable altitude. Whole-genome sequence from a DU Mongolian (Tianjiao1) shows that about 2% of the genomic variants, including more than 300 protein-coding changes, are specific to this individual. Our analyses of DU Mongolians and the first Mongolian genome provide valuable insight into genetic adaptation to extreme environments.
Published in the journal:
. PLoS Genet 9(7): e32767. doi:10.1371/journal.pgen.1003634
Category:
Research Article
doi:
https://doi.org/10.1371/journal.pgen.1003634
Summary
Deedu (DU) Mongolians, who migrated from the Mongolian steppes to the Qinghai-Tibetan Plateau approximately 500 years ago, are challenged by environmental conditions similar to native Tibetan highlanders. Identification of adaptive genetic factors in this population could provide insight into coordinated physiological responses to this environment. Here we examine genomic and phenotypic variation in this unique population and present the first complete analysis of a Mongolian whole-genome sequence. High-density SNP array data demonstrate that DU Mongolians share genetic ancestry with other Mongolian as well as Tibetan populations, specifically in genomic regions related with adaptation to high altitude. Several selection candidate genes identified in DU Mongolians are shared with other Asian groups (e.g., EDAR), neighboring Tibetan populations (including high-altitude candidates EPAS1, PKLR, and CYP2E1), as well as genes previously hypothesized to be associated with metabolic adaptation (e.g., PPARG). Hemoglobin concentration, a trait associated with high-altitude adaptation in Tibetans, is at an intermediate level in DU Mongolians compared to Tibetans and Han Chinese at comparable altitude. Whole-genome sequence from a DU Mongolian (Tianjiao1) shows that about 2% of the genomic variants, including more than 300 protein-coding changes, are specific to this individual. Our analyses of DU Mongolians and the first Mongolian genome provide valuable insight into genetic adaptation to extreme environments.
Introduction
Prehistoric Mongolian ancestry can be traced to the Gobi and Mongolian steppes in Northeastern Asia, yet Mongolian lineages are found among present-day inhabitants of regions as far west as Eastern Europe [1]–[3]. This vast genetic signature is largely attributed to population movements during the time of Genghis Khan [3], [4], whose efforts to unite Eurasian tribes during the 13th century helped to establish one of the largest contiguous empires in human history (12 million square miles) [5], [6]. Assimilation with resident inhabitants throughout this vast and varied region has resulted in a complex mixture of genetic variation and cultural practices in Mongolians that may promote survival in novel environments [7], [8]. A better understanding of Mongolian genetic diversity will provide important insights into genetic variation throughout northern Eurasia and genetic adaptation in highly variable environments.
Through much of their history, Mongolians have survived the harsh conditions of northern latitudes, including seasonal cold and drought and a highly restricted diet, and they might have genetically adapted to these conditions. More than 500 years ago, the nomadic Deedu (“at high altitude”) Mongolians (referred to as “DU Mongolians” hereafter) migrated from the Mongol steppes to the northeastern section of the Qinghai-Tibetan Plateau [5], [6], [9]. In this new environment (∼3000 meters above sea level), they have been further challenged by hypoxic conditions. Adaptations to the challenge imposed by hypoxia have been studied in highland Tibetan populations, and putatively adaptive genetic factors that are associated with both hypoxia and metabolic factors have been reported [10]. In addition, adaptations to hypoxia and cold have also been reported in high-altitude deer mice, highlighting regulatory shifts in energy utilization and thermogenic capacity [11]. In humans, putatively adaptive genetic factors in highland Tibetans are also associated with metabolic factors that may be linked with cold tolerance [10]. While it is unlikely that genome-wide selection analyses would identify selective events that occurred since their arrival into the Qinghai-Tibetan Plateau about 25 generations ago, we hypothesize that shared ancestry and recent genetic admixture from neighboring long-term highland residents play a crucial role in the adaptation of DU Mongolians to this region.
By examining genome-wide SNPs in a DU Mongolian population and whole-genome sequence data from a DU Mongolian individual, we are able to explore Mongolian genetic variation at an unprecedented level of detail. Our analysis identifies hypoxia, antimicrobial, and metabolic selection candidates and reveals novel variation in the genomes of this unique population.
Results
Population Genetic Analysis
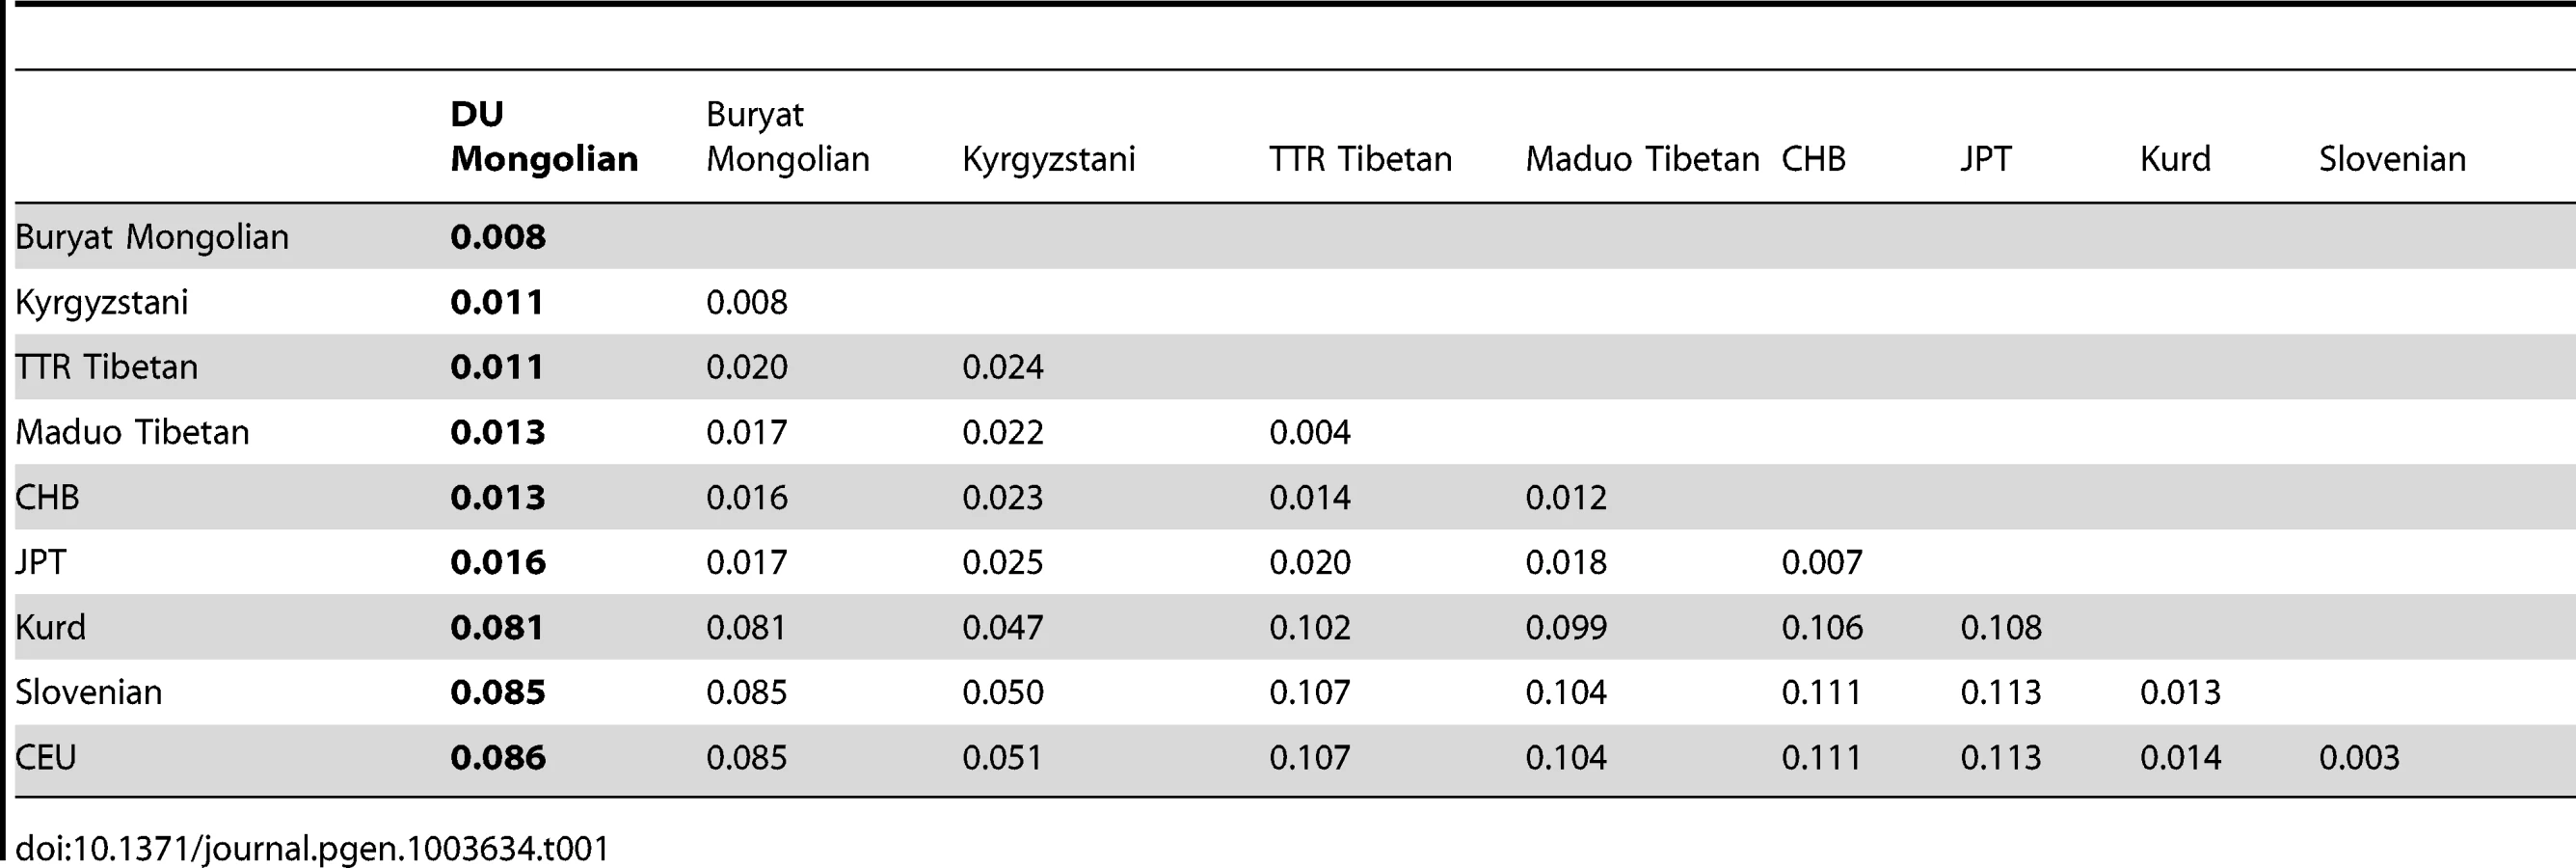
To assess the population structure of DU Mongolians and their relationship with surrounding populations, we examined ∼860,000 SNPs genotyped in 369 individuals from 10 Eurasian populations (Figure 1A). A pairwise FST analysis (Table 1) indicates the DU Mongolians are most closely related to the Buryat Mongolians (FST = 0.0075), followed by the Kyrgyzstani population and the Tibetan population from the Tuo Tuo River (TTR) area of the Qinghai-Tibetan Plateau (FST = 0.0105 and 0.0114, respectively). A neighbor-joining tree from the pairwise FST values showed similar patterns, with DU Mongolians positioned outside of the clade that includes Tibetans, Han Chinese and Japanese (Figure 1B).

To further examine the relationships among individuals, we performed principal components analysis (PCA) using pairwise genetic distances among all individuals. Two-thirds (67.8%) of the variance in the dataset can be explained by the first principal component (PC1), separating populations from Europe and West Asia from populations from East and Central Asia (Figure 2A). PC2 only accounts for <1% of the variance, separating Mongolians, Tibetans, HapMap CHB and JPT individuals, and Kyrgyzstanis. When only East Asian populations were examined, DU Mongolians are most closely related to Buryat Mongolians (Figure 2B). Two Tibetan populations (from the TTR and Maduo regions), HapMap CHB, and HapMap JPT are all clearly separated from the Mongolian populations. Although the majority of the DU Mongolian individuals form a relatively distinct cluster, several individuals show more similarity to other East Asian populations, such as Tibetans and Han Chinese, suggesting possible gene flow among these populations.

Next we used the program ADMIXTURE to assess the genetic composition of DU Mongolians and neighboring populations. The ADMIXTURE analysis estimates the ancestry of each individual, assuming 3–6 ancestral populations (K) (Figure 3). At K = 3, ancestral components corresponding to European/West Asian, Tibetan/DU Mongolian, and East Asian/Buryat Mongolians are recognized. At K = 4, a Mongolian component including DU and Buryat Mongolians is recognized. DU Mongolian genomes appear to be mixtures of ancestral Mongolian and Tibetan components. These two components are closely related and separate from other East Asians (HapMap CHB/JPT). On average, DU Mongolian genomes are composed of 44% of the Mongolian component (standard deviation [sd] 11%), 52% of the Tibetan components (sd 6%), and 3% East Asian component (sd 8%). In contrast, the Buryat Mongolian genomes are composed primarily of Mongolian (75%, sd 10%) and East Asian (25%, sd 9%) components. This result suggests that unlike Buryat Mongolians, DU Mongolians share substantial genetic components with Tibetans, either due to recent admixture or more ancient shared ancestry. At K = 6, Maduo and TTR Tibetans were recognized as two separate groups, and DU Mongolian genomes appear as mixtures of TTR Tibetan and Mongolian components. Some of the DU Mongolian individuals also contain more than 5% East Asian components. The Kyrgyzstanis from Central Asia have the most genetic admixture, and about half of their ancestry is accounted by the ancestral Mongolian component at K = 4 to 6.

Selection Analysis
We performed iHS and XP-EHH analyses to identify candidate regions targeted by positive selection in the DU and Buryat Mongolian populations. In total, 96 regions (68 containing genes; 28 non-genic regions) comprising 162 candidate genes were identified in both DU and Buryat Mongolian populations in at least one of the two selection analyses (Table S1).
We hypothesize that selection candidates identified in both Mongolian populations would be associated with factors common to ancestral Mongolian groups at northern latitudes (see [12] for review) such as metabolic adaptations to temperature and diet. Indeed, a number of metabolic genes are identified in the overlapping candidate gene sets (e.g., ADRA2A, MYOF, and CYP26A1/C1). In addition, we identified a gene cluster containing six beta-defensin genes (DEFB125, DEFB126, DEFB127, DEFB128, DEFB129, and DEFB132) among the selection candidates. It is known that genes related to immune system and microbial defense are highly variable [13]. In particular, this defensin gene cluster varies in copy number in humans and might have undergone copy number expansion in East Asian populations [14].
Considering the geographic proximity of Mongolians and Tibetans, as well as their shared cultural practices and environmental conditions, we also examined the overlap of selection targets among these populations. A total of 153 selection regions containing 399 genes were identified as significant (p<0.02) in at least one Mongolian and one Tibetan population (Table S2). Among the top selection candidates is PPARG (peroxisome proliferator-activated receptor gamma), which has been hypothesized as a “thrifty” gene for dietary adaptation [15], [16]. PPARG may also be associated with metabolism-related traits involving cold tolerance and energy utilization, such as thermogenesis and brown adipose tissue [17]. A number of selection candidate genes reported in previous studies of Asian populations were also found in the Mongolian-Tibetan overlapping candidates. For example, EDAR (the ectodysplasin A receptor gene is significant in both the DU Mongolians and the TTR Tibetans (iHS, p = 0.004 and 0.016, respectively). EDAR is involved in the development of hair, teeth, and exocrine glands [7] and has been highlighted as a strong selection candidate in several Asian populations [18], [19].
A total of six regions (15 total candidate genes) identified in our analyses are significant in all four Mongolian and Tibetan populations (Table S2). The number of shared regions is significantly higher than the expected number (∼0.3, p = 0) under a null hypothesis of independence. This highly refined list of selection candidates, which contains genes related to muscle metabolism and angiogenesis (MYOF, MAP2K5) and tumor suppression (MCC), yields valuable insight for future examination of adaptation in both Mongolian and Tibetan ethnic groups.
We next compared putatively selected regions (p<0.02) in DU Mongolians with genes that have been previously associated with high-altitude adaptation in Tibetans [20]–[25]. Three Tibetan high-altitude selection candidates are also highly significant in DU Mongolians, including the hypoxia inducible pathway gene EPAS1 [20]–[22], [24]–[27] (Figure 4); the PKLR gene [20]–[22], which encodes liver - and erythrocyte-expressed pyruvate kinase; and the cytochrome P450 family member CYP2E1 [20]. These hypoxia-related genes are also associated with metabolic processes [17], [23] that may be involved in orchestrating important physiological responses at high altitude. To control for the effect of admixture among the DU Mongolians, we also performed two SNP-based selection scans in addition to the haplotype based selection analysis. Results from the population branch statistic (PBS) and multiple regression analysis (MR) are shown in Tables S3 and S4, respectively. Among the high-altitude candidate genes examined, EPAS1 showed significant signal (p<0.005) in the PBS analysis. PPARG, a selection candidate identified among the top 2% of iHS selection candidates in Tibetans and DU Mongolians, is also significant in the DU Mongolian PBS analysis (p<0.005).

Hemoglobin Concentration in DU Mongolians
Before DU Mongolians migrated to the Qinghai-Tibetan plateau, Tibetans had lived on the plateau for thousands of years and had adapted genetically to high altitude [28], [29]. On average, Tibetans exhibit relatively lower hemoglobin concentration ([Hb]) compared to other groups at comparable high altitude [30], [31], and this unique characteristic is associated with adaptive genetic factors [20]–[22].
The ADMIXTURE results support shared ancestry and possible gene flow from Tibetans to DU Mongolians (Figure 3), which in turn suggests the hypothesis that Tibetan high-altitude adaptive genes have been transferred to the DU Mongolian population. To test this hypothesis, we measured [Hb] in DU Mongolians and compared the results to those of Tibetans and Han Chinese from a previous study [32] (Table 2). The [Hb] of the Tibetan and Han Chinese samples were collected at an altitude (2664+/−258 m), comparable to the region where the DU Mongolian samples were collected (∼3000 m). When the individuals are divided into two age groups, the average [Hb] of DU Mongolian females is similar to Tibetans and significantly lower than Han Chinese in the 16–40 year age group (p<0.006), but is similar to Han Chinese and significantly higher than Tibetans in the 41–60 year age group (p<0.007). Previously reported haplotypes that have undergone selection in Tibetans [20] are not associated with [Hb] in this sample (Table S5).
![[Hb] comparisons among DU Mongolians, Tibetans, and Han Chinese.](https://pl-master.mdcdn.cz/media/cache/media_object_image_large/media/image/89579aa50846be1596b9ffcb3e7aef6b.png)
Whole-Genome Sequence of a DU Mongolian
To identify potential functional variants in DU Mongolians, and to compare patterns of genetic variation from whole-genome sequencing with those based on SNP microarrays, we performed whole-genome sequencing on a DU Mongolian male (Tianjiao1) who was born and raised on the Qinghai-Tibetan Plateau. Relative to the reference sequence, a total of 3,803,076 variants were identified in Tianjiao1, including 3,353,824 single nucleotide variations (SNVs), 198,230 deletions, 180,121 insertions (a total of 378,351 indels), and 70,901 complex substitutions and multiple nucleotide polymorphisms (Table 3). In addition, 170 copy number variations (CNV) and 1439 high-confidence structural variants (SV) were identified.

Using whole-genome data, we determined the mitochondrial and Y haplogroups of Tianjiao1 (Table S6). The Tianjiao1 mtDNA sequence is assigned to clade H18 [33], which has been previously reported in Europeans [34], [35] and is also present in the Arabian Peninsula and Caucasus regions. H18 is estimated to have originated ∼13,500 years ago [36]. The Tianjiao1 Y chromosome produced 1,897 variant calls and can be assigned to haplogroup Q1a1 based on the current Y-DNA haplotype tree [37]. The Q1a1 (M120) Y-chromosome lineage has been reported previously at low frequencies in populations from Mongolia, central and northern Asia, the Lhasa region of Tibet, and in Han Chinese [38], [39].
We compared the Tianjiao1 genome to whole genome sequences of 54 unrelated individuals sequenced using the same sequencing platform and variant discovery pipeline. These 54 individuals (referred to as “CGI54 panel” hereafter) were selected from 11 populations across the world and are a good representation of overall genomic diversity in humans. The total number of variants in the Tianjiao1 genome is similar to that of other Eurasian individuals and is lower than African individuals in the CGI54 panel (Figure S1). Tianjiao1 shared most variants with CHB individuals and least with LWK (Luhya in Webuye, Kenya) individuals (Figure 5A). A neighbor-joining tree based on pairwise genetic distances demonstrates the affinity of Tianjiao1 to other East Asian individuals (Figure 5B). This whole-genome comparison result is consistent with our PCA results (Figure 2). In our ADMIXTURE analysis (K = 4), the Tianjiao1 genome appears to be a mixture of three ancestral components and is estimated to contain 26%, 56%, and 17% Mongolian, Tibetan, and HapMap CHB/JPT ancestry, respectively.

Novel Variants with Potential Functional Impact
To assess the functional impact of variants in this sequence, we annotated the effects of the variants using the terms defined in Sequence Ontology [40]. The number of variants in each category is shown in Table 4. We found there are 1,467,962 genic variants, including 19,964 coding sequence variants. Among the coding variants, 9,216 are non-synonymous substitutions. There are also 62 stop-gain and 28 stop-lost SNVs. Among indels, 160 are in-frame and 134 are frame-shifting. Within introns, 61 mutations are located at the splice donor sites and 45 are located at splice acceptor sites (Table 4). We compared these functional variants with the Human Gene Mutation Database (HGMD) to identify variants that are previously known to be associated with disease phenotypes. A total of 43 HGMD mutations are present in the Tianjiao1 genome, including 9 homozygous autosomal mutations and one hemizygous mutation on chromosome X. All but one of these variants are known SNVs that are present in samples from the 1000 Genomes project. The only nonsense mutation (chr17 : 15142830C->G) that is specific to Tianjiao1 is located in the PMP22 gene (peripheral myelin protein 22 [HGNC 9118]) and has been associated with Charcot-Marie-Tooth disease (CMT1A, [MIM 118220]) [41]. Previous studies of DNA sequences from apparently healthy individuals have yielded similar results [42]–[45].

A comparison of the variants found in Tianjiao1 with those of the CGI54 panel and the 1000 Genomes Project shows that 31,216 variants are specific to Tianjiao1. Of these, 449 are present in the coding regions, including 139 synonymous SNVs, 255 non-synonymous SNVs, 5 nonsense SNVs, 34 frame-shifting indels, and 17 in-frame indels (Table 4). Using the program SIFT [46], we predicted the functional impact of non-synonymous SNVs and coding indels specific to Tianjiao1. In addition to the 5 stop-gain SNVs, 77 non-synonymous SNVs were predicted to be “Damaging” or “Possibly damaging” (Table S7). Among the 51 coding indels, 8 are within the first 10% of the transcript and 23 were predicted to cause nonsense-mediated decay of the transcript (Table S8).
Coding Variants in the Candidate Regions Under Natural Selection
Finally, we examined Tianjiao1-specific coding variants in the putatively selected regions that are shared by Mongolians (Table S1) and between Mongolians and Tibetans (Table S2). Among all regions, two Tianjiao1-specific heterozygous nonsynonymous SNVs were identified in genes PAOX and EPHB6, respectively. The mutation in the PAOX gene (p.D274G) was predicted to be “Damaging” while the mutation in EPHB6 (R413L) was predicted to be “Tolerated” by SIFT (Table S7). Within these regions, no coding indels, CNVs, or SVs were identified in the Tianjiao1 genome.
Discussion
Our results show that DU Mongolians form a distinct population compared to other Eurasian populations and, among our samples, have closest genetic similarity to Buryat Mongolians. The ADMIXTURE analysis suggests that DU Mongolians share appreciable amounts of ancestry with neighboring Tibetan populations. This ancestral component is distinct from other East Asian populations. Genetic and archaeological evidence indicates that regions of the southern portion of the Tibetan Plateau were first occupied during the Late Pleistocene (∼30,000 years ago) [25], [47], [48]. Approximately 3,750–6,500 years ago, additional populations migrated from the east into the northeastern section of present-day Qinghai Province and the easternmost regions of Tibet [47]. The ancestry shared among Qinghai Mongolian and Tibetan populations examined here may be attributed to the latter more recent migration into the northeastern section of the Qinghai-Tibetan Plateau.
Because of the shared ancestry and possible gene flow between DU Mongolians and Tibetans, one intriguing question is whether high-altitude adaptive alleles have been transferred to the DU Mongolians after their migration to the Qinghai-Tibetan plateau. DU Mongolians specifically exhibit strong signals of selection for genes previously reported as candidates for high-altitude adaptation in neighboring Tibetan populations, including EPAS1, PKLR, and CYP2E1 (p<0.02 in DU Mongolian and Tibetan populations). The endothelin receptor type A (EDNRA) selection candidate gene reported by Simonson et al. [20] is significant in Buryat but not DU Mongolians, suggesting an adaptive role that may not be strictly hypoxia-specific.
Our comparison of selection candidate genes among Buryat and DU Mongolians and two Tibetan populations yields candidate genes that may be related to metabolic factors involved in adaptation to cold, arid conditions and a relatively restricted diet (Table S2). Notably, the PPARG gene, previously hypothesized to be associated with metabolic adaptation in human populations [12], [15], [16], exhibits a strong signal of selection in Mongolian and Tibetan populations and warrants further investigation. The individual variant-based selection scans, PBS and MR, showed some overlap in selection candidate regions with our haplotype based scan, although the top regions are largely different. For example, the EPAS1 gene was identified as a strong selection candidate gene in DU Mongolians by the XP-EHH and PBS tests but not in the iHS and MR tests, reflecting differences in these approaches.
Because of the shared recent ancestry of these populations, it is unclear if these selection targets are the outcome of more ancient selective events common to ancestors of these groups or whether Mongolians and Tibetans exchanged favorable genes in more recent history. While we did not detect an association between putative selected Tibetan haplotypes and [Hb] in DU Mongolians, the difference between DU Mongolian and Han Chinese [Hb] phenotypes at an altitude of 3000 m suggests that DU Mongolians might share Tibetans' phenotype of decreased [Hb] in a hypoxic environment.
Our whole-genome sequence and genome-wide SNP analyses provide the first genomic-level insight into a Mongolian population, augmenting our current understanding of human genetic variation. Further studies of this unique population will elucidate the evolutionary underpinnings of adaptive signals shared among other Mongolian populations in addition to neighboring Tibetan groups. Efforts focused on Mongolian genomics beyond the single genome analysis presented here will also provide greater insight into direct targets of selection that are likely associated with important physiological and metabolic traits.
Materials and Methods
Sample Collection
Blood samples from all DU Mongolian subjects were drawn at an altitude of 3000 meters (m). All the subjects are nomads who permanently live at an altitude of 3000 m–4300 m in the Qinghai Keke Xili area. DNA was extracted from whole blood samples using the Qiagen Gentra Puregene Blood Kit (Qiagen Inc., Valencia, California, USA). Informed consent was obtained for all participants according to guidelines approved by the Institutional Review Board at the High Altitude Medical Research Institute, Qinghai Medical College (Xining, Qinghai, China).
A healthy, 58-year-old DU Mongolian male who was born and raised at an altitude of 3250 m on the Qinghai-Tibetan Plateau provided a blood sample from which DNA was extracted for whole-genome sequencing. The sample collection was carried out in Salt Lake City, Utah, and whole-genome sequencing was undertaken at Complete Genomics, Inc. Both procedures were performed with Institutional Review Board approval under the University of Utah's Clinical Genetics Research Program (IRB #7551).
SNP Genotyping and Quality Control
Forty-nine individual DNA samples were genotyped using Affymetrix 6.0 SNP Array technology (>900,000 SNPs) at Capital Bio Corporation (Beijing, China). We used default parameters for the Birdseed algorithm (version 2) to determine genotypes for all samples (Affymetrix, Santa Clara, CA, USA) and the ERSA program to detect cryptic relatedness between subjects [49]. When a pair of individuals was estimated to be more closely related than first cousin, one member of the pair was excluded from the analyses. Based on these criteria, seven individuals were removed, leaving a total of 42 individuals for subsequent analysis. The genotype data were then combined with data from other Northern Eurasian individuals who were previously genotyped using the same platform [10], [20], [50]. The final dataset contains ∼860,000 SNPs that were genotyped in 369 individuals from 10 Northern Eurasian populations. SNP genotypes of the final dataset are available on our website (http://jorde-lab.genetics.utah.edu/) under Published Data.
Population Genetic Analysis
Between-population FST estimates, neighbor-joining tree construction, pairwise allele-sharing genetic distance calculation, and principal components analysis (PCA) were performed using MATLAB (ver. r2011b) as previously described [50], [51]. Genome-wide admixture estimates were obtained with the ADMIXTURE algorithm (version 1.02) [52]. To eliminate the effects of SNPs that are in linkage disequilibrium, we first filtered out SNPs that had pairwise r2>0.2 within 50 SNP windows using PLINK [53] as recommended by the authors of ADMIXTURE. The pruned data set contains 142,888 SNPs.
Selection Analyses
The XP-EHH (cross-population extended haplotype homozygosity) [19], iHS (integrated haplotype score) [54], and PBS (population branch statistic) selection scans were performed as previously described [20], [21]. For XP-EHH and PBS selection scans, our test statistic was the maximum score in each 200 kb region [19]. For XPEHH, we used the HapMap CHB and JPT populations as reference populations and calculated XP-EHH at each site using default settings (http://hgdp.uchicago.edu/Software/). For PBS, we used the HapMap CHB and JPT as the first reference population and HapMap CEU as the second. We determined statistical significance for each region from the empirical distribution of the test statistic and selected regions that are significant at the 0.02 level as our candidates. To identify selected loci at intermediate frequencies, we employed the iHS statistic. We summed the integrated EHH in both directions from each SNP until EHH was less than or equal to 0.10 and calculated the iHS score as the log ratio of iHH single-site scores standardized by the population-derived allele frequency. After excluding regions with <5 SNPs, we determined the iHS test statistic for each 200 kb region as the fraction of SNPs in which the absolute value of iHS was >2.0. The expected number of overlapping regions in Mongolian and Tibetan populations was determined using simulation assuming independence of the regions, and the significance level of the observation was determined using the empirical distribution from the simulation.
The multiple regression (MR) analysis was performed as described in Alkorta-Aranburu et al. [55] to identify unusually divergent SNP loci in the DU Mongolian population. Specifically, the observed allele frequencies at all genotyped SNPs in six populations (excluding the Buryat Mongolians and two Tibetan groups) were used to predict the allele frequencies at those loci in DU Mongolians as a linear combination of frequencies in the six populations. The MR Score of a SNP is defined as the Studentized (scaled) residual of the observed vs. predicted allele frequency for the SNP. For each gene, we computed an MR Factor as the proportion of SNPs within its transcribed region plus 10 kb on either side that are in the tail of the MR Score distribution divided by the proportion of tail SNPs for all such gene regions. As in Alkorta-Aranburu et al. [55], we considered three tails of the MR Score distribution (5%, 1% and 0.5%) and computed MR Factors for each level. The MR Factors and empirical p-values (transformed rank statistics) for the top 2% of gene regions with at least 10 genotyped SNPs are shown in Table S4.
To control for potential batch effect in genotype calling, we combined our samples and HapMap samples and performed genotype calling on whole dataset. SNPs that showed less than 50% concordance rate in any given population between the original genotypes and the recalled genotypes were excluded from the PBS and MR analyses.
Phenotype Collection and Genotype-Phenotype Association Test
[Hb] and hematocrit were determined from venous blood samples using the Mindray Hematology Analyzer (BC-2300, Shenzhen, China). Of the 42 unrelated samples, we were able to obtain [Hb] from 30 non-smoking, healthy individuals. The [Hb] values of 326 Tibetan and 335 Han Chinese female individuals (between ages 16 and 60) collected at a comparable altitude (2664 m) were obtained from a previous study [32].
To determine if [Hb] in DU Mongolians is associated with haplotypes that have undergone selection in Tibetans, we first defined the selected Tibetan haplotypes using three core SNPs in each region as previously described [20] and estimated the copy number of each haplotype in each DU Mongolian individual. We then used a stepwise linear regression model (MATLAB ver. r2011b) to determine the association between [Hb] and the inferred Tibetan haplotype copies of each genic region in DU Mongolians.
Whole-Genome Sequencing
Whole-genome sequencing was performed by Complete Genomics, Inc. (CGI). The whole-genome sequencing yielded ∼1.6×10¹¹ bp of total sequence, with an average coverage of 51.7× for the entire genome. The raw sequences were mapped to the NCBI reference human genome build 37 (hg19), and variant calling was performed by CGI using their variant-calling pipeline (Software version 1.11.0.18). Overall, both alleles were determined for 96.2% of the genome, one of the two alleles for 0.7% of the genome, and neither allele for 3.2% of the genome. The whole-genome variant calls of individuals in the CGI54 panel were obtained from the CGI website (ftp://ftp2.completegenomics.com/). This panel contains 54 unrelated individuals, including all members of the CGI diversity panel (46 individuals), parents in the YRI and the PUR trios (four individuals), and four grandparents in CEU Pedigree_1463. The 1000 Genomes phase 1 variant calls were downloaded from the 1000 Genomes website (ftp://ftp.1000genomes.ebi.ac.uk/vol1/ftp/phase1/).
To validate the mtDNA variants in the Tianjiao1 genome, we performed Sanger sequencing on the HVS1 region and resequenced the entire mitochondrial genome using the Ion Torrent platform. All methods produced identical variant calls and confirmed the whole-genome sequencing results.
The functional impact of the genomic variants was assessed using the Variant Annotation Tool (VAT) in the Variant Annotation, Analysis and Search Tool (VAAST) package [56]. Tianjiao1 variants that are present in the CGI54 panel individuals were excluded using the Variant Selection Tool (VST) in the VAAST package, and variants that overlap the 1000 Genomes phase 1 variants were excluded using tabix (http://samtools.sourceforge.net) [57]. The functional significance of coding SNVs and indels was assessed using SIFT [46] (SIFT Human Coding SNPs: http://sift.jcvi.org/www/SIFT_chr_coords_submit.html; SIFT Human Coding indels: http://sift.jcvi.org/www/SIFT_chr_coords_indels_submit.html).
Supporting Information
Zdroje
1. Keyser-TracquiC, CrubezyE, PamzsavH, VargaT, LudesB (2006) Population origins in Mongolia: genetic structure analysis of ancient and modern DNA. Am J Phys Anthropol 131 : 272–281.
2. NasidzeI, QuinqueD, DupanloupI, CordauxR, KokshunovaL, et al. (2005) Genetic evidence for the Mongolian ancestry of Kalmyks. Am J Phys Anthropol 128 : 846–854.
3. ZerjalT, XueY, BertorelleG, WellsRS, BaoW, et al. (2003) The genetic legacy of the Mongols. Am J Hum Genet 72 : 717–721.
4. DulikMC, OsipovaLP, SchurrTG (2011) Y-chromosome variation in Altaian Kazakhs reveals a common paternal gene pool for Kazakhs and the influence of Mongolian expansions. PLoS One 6: e17548.
5. Hei L, Tie Z (2011) Shine Nairuulsan Mongol Undusten-ne dobch tuuh (Mongolian History): Inner Mongolian People Publishing Agency.
6. Nima B (2011) Mingan on ne dunji huun (Great Man of the Millennium): Inner Mongolian people publishing agency.
7. BotchkarevVA, FessingMY (2005) Edar signaling in the control of hair follicle development. J Investig Dermatol Symp Proc 10 : 247–251.
8. YaoYG, KongQP, WangCY, ZhuCL, ZhangYP (2004) Different matrilineal contributions to genetic structure of ethnic groups in the silk road region in china. Mol Biol Evol 21 : 2265–2280.
9. Zhang M (1988) khoshuu nutug in temteglel (Mongolian Nomadic History). Beijing: Nationality Press.
10. GeRL, SimonsonTS, CookseyRC, TannaU, QinG, et al. (2012) Metabolic insight into mechanisms of high-altitude adaptation in Tibetans. Mol Genet Metab 106 : 244–247.
11. ChevironZA, BachmanGC, ConnatyAD, McClellandGB, StorzJF (2012) Regulatory changes contribute to the adaptive enhancement of thermogenic capacity in high-altitude deer mice. Proc Natl Acad Sci U S A 109 : 8635–8640.
12. BrownEA (2012) Genetic explorations of recent human metabolic adaptations: hypotheses and evidence. Biol Rev Camb Philos Soc 87 : 838–55.
13. SabetiPC, SchaffnerSF, FryB, LohmuellerJ, VarillyP, et al. (2006) Positive natural selection in the human lineage. Science 312 : 1614–1620.
14. HardwickRJ, MachadoLR, ZuccheratoLW, AntolinosS, XueY, et al. (2011) A worldwide analysis of beta-defensin copy number variation suggests recent selection of a high-expressing DEFB103 gene copy in East Asia. Hum Mutat 32 : 743–750.
15. SpiegelmanBM (1997) Peroxisome proliferator-activated receptor gamma: A key regulator of adipogenesis and systemic insulin sensitivity. Eur J Med Res 2 : 457–464.
16. AuwerxJ (1999) PPARgamma, the ultimate thrifty gene. Diabetologia 42 : 1033–1049.
17. KolbleK (1993) Regional mapping of short tandem repeats on human chromosome 10: cytochrome P450 gene CYP2E, D10S196, D10S220, and D10S225. Genomics 18 : 702–704.
18. FujimotoA, KimuraR, OhashiJ, OmiK, YuliwulandariR, et al. (2008) A scan for genetic determinants of human hair morphology: EDAR is associated with Asian hair thickness. Hum Mol Genet 17 : 835–843.
19. SabetiPC, VarillyP, FryB, LohmuellerJ, HostetterE, et al. (2007) Genome-wide detection and characterization of positive selection in human populations. Nature 449 : 913–918.
20. SimonsonTS, YangY, HuffCD, YunH, QinG, et al. (2010) Genetic evidence for high-altitude adaptation in Tibet. Science 329 : 72–75.
21. YiX, LiangY, Huerta-SanchezE, JinX, CuoZ, et al. (2010) Sequencing of 50 human exomes reveals adaptation to high altitude. Science 329 : 75–78.
22. BeallCM, CavalleriGL, DengL, ElstonRC, GaoY, et al. (2010) Natural selection on EPAS1 (HIF2alpha) associated with low hemoglobin concentration in Tibetan highlanders. Proc Natl Acad Sci U S A 107 : 11459–11464.
23. FormentiF, Constantin-TeodosiuD, EmmanuelY, CheesemanJ, DorringtonKL, et al. (2010) Regulation of human metabolism by hypoxia-inducible factor. Proc Natl Acad Sci U S A 107 : 12722–12727.
24. XuS, LiS, YangY, TanJ, LouH, et al. (2011) A genome-wide search for signals of high-altitude adaptation in Tibetans. Mol Biol Evol 28 : 1003–1011.
25. WangB, ZhangYB, ZhangF, LinH, WangX, et al. (2011) On the origin of Tibetans and their genetic basis in adapting high-altitude environments. PLoS One 6: e17002.
26. BighamA, BauchetM, PintoD, MaoX, AkeyJM, et al. (2010) Identifying signatures of natural selection in Tibetan and Andean populations using dense genome scan data. PLoS Genet 6: e1001116.
27. PengY, YangZ, ZhangH, CuiC, QiX, et al. (2011) Genetic variations in Tibetan populations and high-altitude adaptation at the Himalayas. Mol Biol Evol 28 : 1075–1081.
28. SimonsonTS, McClainDA, JordeLB, PrchalJT (2012) Genetic determinants of Tibetan high-altitude adaptation. Hum Genet 131 : 527–533.
29. BeallCM (2007) Two routes to functional adaptation: Tibetan and Andean high-altitude natives. Proc Natl Acad Sci U S A 104 Suppl 1 : 8655–8660.
30. AdamsWH, StrangLJ (1975) Hemoglobin levels in persons of tibetan ancestry living at high altitude. Proc Soc Exp Biol Med 149 : 1036–1039.
31. BeallCM, ReichsmanAB (1984) Hemoglobin levels in a Himalayan high altitude population. Am J Phys Anthropol 63 : 301–306.
32. WuT, WangX, WeiC, ChengH, LiY, et al. (2005) Hemoglobin levels in Qinghai-Tibet: different effects of gender for Tibetans vs. Han. J Appl Physiol 98 : 598–604.
33. van OvenM, KayserM (2009) Updated comprehensive phylogenetic tree of global human mitochondrial DNA variation. Hum Mutat 30: E386–394.
34. CobleMD, JustRS, O'CallaghanJE, LetmanyiIH, PetersonCT, et al. (2004) Single nucleotide polymorphisms over the entire mtDNA genome that increase the power of forensic testing in Caucasians. Int J Legal Med 118 : 137–146.
35. HerrnstadtC, ElsonJL, FahyE, PrestonG, TurnbullDM, et al. (2002) Reduced-median-network analysis of complete mitochondrial DNA coding-region sequences for the major African, Asian, and European haplogroups. Am J Hum Genet 70 : 1152–1171.
36. RoostaluU, KutuevI, LoogvaliEL, MetspaluE, TambetsK, et al. (2007) Origin and expansion of haplogroup H, the dominant human mitochondrial DNA lineage in West Eurasia: the Near Eastern and Caucasian perspective. Mol Biol Evol 24 : 436–448.
37. International Society of Genetic Genealogy (2012) Y-DNA Haplogroup Tree 2012, Version 7.17. http://www.isogg.org/tree/.
38. HammerMF, KarafetTM, ParkH, OmotoK, HariharaS, et al. (2006) Dual origins of the Japanese: common ground for hunter-gatherer and farmer Y chromosomes. J Hum Genet 51 : 47–58.
39. SuB, XiaoC, DekaR, SeielstadMT, KangwanpongD, et al. (2000) Y chromosome haplotypes reveal prehistorical migrations to the Himalayas. Hum Genet 107 : 582–590.
40. EilbeckK, LewisSE, MungallCJ, YandellM, SteinL, et al. (2005) The Sequence Ontology: a tool for the unification of genome annotations. Genome Biol 6: R44.
41. OhnishiA, YoshimuraT, KanehisaY, FukushimaY (1995) [A case of hereditary motor and sensory neuropathy type I with a new type of peripheral myelin protein (PMP)-22 mutation]. Rinsho Shinkeigaku 35 : 788–792.
42. TennessenJA, BighamAW, O'ConnorTD, FuW, KennyEE, et al. (2012) Evolution and functional impact of rare coding variation from deep sequencing of human exomes. Science 337 : 64–69.
43. LevyS, SuttonG, NgPC, FeukL, HalpernAL, et al. (2007) The diploid genome sequence of an individual human. PLoS Biol 5: e254.
44. WheelerDA, SrinivasanM, EgholmM, ShenY, ChenL, et al. (2008) The complete genome of an individual by massively parallel DNA sequencing. Nature 452 : 872–876.
45. MacArthurDG, BalasubramanianS, FrankishA, HuangN, MorrisJ, et al. (2012) A systematic survey of loss-of-function variants in human protein-coding genes. Science 335 : 823–828.
46. KumarP, HenikoffS, NgPC (2009) Predicting the effects of coding non-synonymous variants on protein function using the SIFT algorithm. Nat Protoc 4 : 1073–1081.
47. AldenderferM (2011) Peopling the Tibetan plateau: insights from archaeology. High Alt Med Biol 12 : 141–147.
48. ZhaoM, KongQP, WangHW, PengMS, XieXD, et al. (2009) Mitochondrial genome evidence reveals successful Late Paleolithic settlement on the Tibetan Plateau. Proc Natl Acad Sci U S A 106 : 21230–21235.
49. HuffCD, WitherspoonDJ, SimonsonTS, XingJ, WatkinsWS, et al. (2011) Maximum-likelihood estimation of recent shared ancestry (ERSA). Genome Res 21(5): 768–74.
50. XingJ, WatkinsWS, ShlienA, WalkerE, HuffCD, et al. (2010) Toward a more uniform sampling of human genetic diversity: A survey of worldwide populations by high-density genotyping. Genomics 96 : 199–210.
51. XingJ, WatkinsWS, WitherspoonDJ, ZhangY, GutherySL, et al. (2009) Fine-scaled human genetic structure revealed by SNP microarrays. Genome Res 19 : 815–825.
52. AlexanderDH, NovembreJ, LangeK (2009) Fast model-based estimation of ancestry in unrelated individuals. Genome Res 19 : 1655–1664.
53. PurcellS, NealeB, Todd-BrownK, ThomasL, FerreiraMA, et al. (2007) PLINK: a tool set for whole-genome association and population-based linkage analyses. Am J Hum Genet 81 : 559–575.
54. VoightBF, KudaravalliS, WenX, PritchardJK (2006) A Map of Recent Positive Selection in the Human Genome. PLoS Biol 4: e72.
55. Alkorta-AranburuG, BeallCM, WitonskyDB, GebremedhinA, PritchardJK, et al. (2012) The genetic architecture of adaptations to high altitude in Ethiopia. PLoS Genet 8: e1003110.
56. YandellM, HuffC, HuH, SingletonM, MooreB, et al. (2011) A probabilistic disease-gene finder for personal genomes. Genome Res 21 : 1529–1542.
57. LiH (2011) Tabix: fast retrieval of sequence features from generic TAB-delimited files. Bioinformatics 27 : 718–719.
Štítky
Genetika Reprodukční medicínaČlánek vyšel v časopise
PLOS Genetics
2013 Číslo 7
- Kazuistika – Perspektivy využití precizované medicíny v rámci personalizované specifické terapie onkologických pacientů
- Nobelova cena za chemii pro genetické nůžky: Objev, který změní naši budoucnost?
- Technologie na bázi RNA v klinické praxi: od přebarvených petúnií k terapii vzácných a dosud jen obtížně léčitelných chorob u lidí
- „Nepředstavovali jsme si, že náš výzkum povede přímo ke vzniku nových léků, dokonce ještě za našeho života“
- Bezplatné služby pro diagnostiku ATTRv amyloidózy pro kardiology
Nejčtenější v tomto čísle
- Bacterial Adaptation through Loss of Function
- SLC26A4 Targeted to the Endolymphatic Sac Rescues Hearing and Balance in Mutant Mice
- The Cohesion Protein SOLO Associates with SMC1 and Is Required for Synapsis, Recombination, Homolog Bias and Cohesion and Pairing of Centromeres in Drosophila Meiosis
- Gene × Physical Activity Interactions in Obesity: Combined Analysis of 111,421 Individuals of European Ancestry
Zvyšte si kvalifikaci online z pohodlí domova
Mazová zátka a její řešení
nový kurzVšechny kurzy