
Gene Set Signature of Reversal Reaction Type I in Leprosy Patients
Leprosy reversal reactions type 1 (T1R) are acute immune episodes that affect a subset of leprosy patients and remain a major cause of nerve damage. Little is known about the relative importance of innate versus environmental factors in the pathogenesis of T1R. In a retrospective design, we evaluated innate differences in response to Mycobacterium leprae between healthy individuals and former leprosy patients affected or free of T1R by analyzing the transcriptome response of whole blood to M. leprae sonicate. Validation of results was conducted in a subsequent prospective study. We observed the differential expression of 581 genes upon exposure of whole blood to M. leprae sonicate in the retrospective study. We defined a 44 T1R gene set signature of differentially regulated genes. The majority of the T1R set genes were represented by three functional groups: i) pro-inflammatory regulators; ii) arachidonic acid metabolism mediators; and iii) regulators of anti-inflammation. The validity of the T1R gene set signature was replicated in the prospective arm of the study. The T1R genetic signature encompasses genes encoding pro - and anti-inflammatory mediators of innate immunity. This suggests an innate defect in the regulation of the inflammatory response to M. leprae antigens. The identified T1R gene set represents a critical first step towards a genetic profile of leprosy patients who are at increased risk of T1R and concomitant nerve damage.
Published in the journal:
. PLoS Genet 9(7): e32767. doi:10.1371/journal.pgen.1003624
Category:
Research Article
doi:
https://doi.org/10.1371/journal.pgen.1003624
Summary
Leprosy reversal reactions type 1 (T1R) are acute immune episodes that affect a subset of leprosy patients and remain a major cause of nerve damage. Little is known about the relative importance of innate versus environmental factors in the pathogenesis of T1R. In a retrospective design, we evaluated innate differences in response to Mycobacterium leprae between healthy individuals and former leprosy patients affected or free of T1R by analyzing the transcriptome response of whole blood to M. leprae sonicate. Validation of results was conducted in a subsequent prospective study. We observed the differential expression of 581 genes upon exposure of whole blood to M. leprae sonicate in the retrospective study. We defined a 44 T1R gene set signature of differentially regulated genes. The majority of the T1R set genes were represented by three functional groups: i) pro-inflammatory regulators; ii) arachidonic acid metabolism mediators; and iii) regulators of anti-inflammation. The validity of the T1R gene set signature was replicated in the prospective arm of the study. The T1R genetic signature encompasses genes encoding pro - and anti-inflammatory mediators of innate immunity. This suggests an innate defect in the regulation of the inflammatory response to M. leprae antigens. The identified T1R gene set represents a critical first step towards a genetic profile of leprosy patients who are at increased risk of T1R and concomitant nerve damage.
Introduction
Leprosy is a chronic human infectious disease caused by Mycobacterium leprae. If left untreated the disease results in pronounced skin deformities and nerve disabilities due to preferential invasion of macrophages and Schwann cells by M. leprae. Efforts by the World Health Organisation (WHO) to eliminate leprosy resulted in a substantial reduction of global disease prevalence from 5.35 million in 1985 to 211,903 by 2010. The number of newly registered cases, however, remained at high rates (244,796 in 2009) [1]. Leprosy displays a wide spectrum of clinical manifestations. Tuberculoid (TT) and lepromatous leprosy (LL), characterized by the presence and absence of specific cellular immune responses, respectively, represent the opposite ends of the clinical spectrum [2], [3]. Based on histopathological, immunological, bacteriological, and clinical criteria, Ridley and Jopling classified three additional intermediate, or “borderline,” types as borderline tuberculoid (BT), mid borderline (BB), and borderline lepromatous (BL) leprosy [4].
Leprosy reactions, acute episodes of dysregulated inflammation, are a major cause of nerve damage in leprosy patients and present as two types [5], [6]. Type-2 reactions remain rather infrequent (<5% of leprosy patients) and occur nearly exclusively in BL and LL patients [7]. In contrast, reversal reactions type-1 (T1R) can occur in any leprosy subtype, although they are most prevalent in the borderline forms (BT-BB-BL) [8]. T1R are characterized by sudden episodes of exacerbated local delayed-type hypersensitivity to M. leprae in skin and/or nerves. Histological assessment of T1R lesions demonstrated an influx of mononuclear cells that lead to skin swelling and neural compression [9], [10]. Immunological analysis of the skin lesions and peripheral blood samples of patients with T1R showed the predominance of CD4+ T cells and Th1-associated cytokines, especially IFN-γ, IL-2, IL-12, and TNF-α [11]–[15]. The clinical care and management of T1R patients is a major challenge of current leprosy control efforts.
In Vietnam, prevalence of T1R is 29% among leprosy patients and approximately one third of T1R cases are detected at the time of leprosy diagnosis [8]. However, the prevalence of T1R differs widely among different geographical and epidemiological settings and ranges from 6% to 67% of all patients with leprosy [7], [16]–[19]. It is not known if this large spread in the occurrence of T1R reflects the variable impact of environmental triggers or an innate predisposition of certain leprosy patients towards T1R. In the absence of acute T1R, we compared the transcriptome response to M. leprae sonicate of leprosy patients that developed T1R with those that did not. In the discovery set we employed a retrospective design (patients who present at leprosy diagnosis with T1R) and we validated the results obtained in a prospective study (patients who present with T1R after diagnosis of leprosy). This design allowed us to identify a T1R gene set signature that captures differences in gene expression of whole blood following exposure to M. leprae antigens that are characteristic for persons with an innate predisposition to undergo T1R.
Results
Study overview
Our study followed a two-step design (Figure 1). First, we enrolled a retrospective sample of 12 former leprosy patients of which half had remained T1R-free while the other six had been diagnosed with T1R at the time of leprosy diagnosis. For these patients, irrespective of T1R, the time from clinical cure to participation in the present study was on average nine years [range 5–13 years]. The patients with simultaneous diagnosis of T1R and leprosy can be considered as early-onset T1R and we hypothesized that genetic effects should be most pronounced in such patients. By comparing M. leprae sonicate triggered gene expression in whole blood between the two groups (i.e. T1R-positive and T1R-free), we derived a gene set that was either over - or under-stimulated among the T1R group (Figure 1). Next, we employed the genes that were differentially induced (the so-called T1R-specific gene set) in a prospective design. We enrolled 43 leprosy patients who were T1R-free at the time of leprosy diagnosis and obtained RNA from whole blood assays stimulated with M. leprae sonicate. We then followed these patients for 3 years and recorded episodes of T1R among 11 patients. At that point, we conducted an analysis that validated the T1R gene set in the prospective arm (Figure 1). Since none of the subjects in the prospective phase had developed clinical signs of T1R at the time of the experiment, this validation showed that the T1R-specific set captured an innate characteristic of T1R susceptibility.

Strong regulation of innate immunity genes by M. leprae antigens
In the retrospective samples, we conducted a careful transcriptional response profile of whole blood to M. leprae sonicate. Independent of the clinical phenotype, a strong transcriptional response to M. leprae antigens was observed in subjects of both groups. Antigen stimulation altered the expression of 581 genes by at least two-fold in at least one group. Of these, 462 genes showed the same direction and strength of regulation (absolute fold-change equal or above 2) in both groups. Even though not all of the remaining 134 genes reached the two-fold regulation cut-off in each patient group, these genes showed identical direction of M. leprae-triggered expression changes in both groups. The comparison of the baseline (unstimulated) and antigen-stimulated expression levels between T1R-free andT1R-affected patients did not detect significant differences in gene induction or suppression (data not shown).
We utilized the DAVID analysis tool to assess the enrichment of particular functional clusters among the 581 regulated genes. Out of 581 genes, 572 were annotated by DAVID for further analysis. The DAVID Functional Annotation Clustering tool assigns each gene to a set of functional groups according to its role in cellular processes [20]–[22]. To avoid listing multiple sources for clustered functional entities we focused on GO terms and KEGG/PANTHER pathways. As significance thresholds we used p-values adjusted by the Benjamini-Hochberg procedure (PBH). For GO terms we selected PBH<10−5 and for pathways PBH<0.05 with the false-discovery rate fixed at 0.05 in each instance. The highest levels of significance were observed for GO terms “Defense response” (PBH = 6.2×10⁻²⁴), “Inflammatory Response” (PBH = 1.6×10⁻²¹) and “Response to wounding” (PBH = 1.44×10⁻²⁰; Table 1). More specific and still highly significant terms highlighted the overabundance of genes involved in innate immunity (e.g. “Vacuole”, “Regulation of immune system process”, “Response to bacterium”, “Cytokine activity”, “Chemotaxis”, “Regulation of cell death”, “Regulation of cell proliferation”; Table 1). Consistent with the observed GO terms, we also detected significant enrichment of three signalling pathways implicated in lysosomal function, cytokine and chemokine signalling cascades (Table 2). Taken together, these data showed a strong innate immune response to M. leprae antigens irrespective of a history of T1R.


T1R gene-set signature: differential intensity of gene expression changes between T1R-affected and T1R-free leprosy patients
Although there were no significant T1R-specific differences in induction or suppression of individual transcripts, we were still interested to evaluate the T1R-specific differences in the intensity of response to M. leprae antigen. To quantitate differences in the intensity of the transcriptional response, we defined the delta fold change (ΔFC) value. This value captured differences in the M. leprae antigen triggered FC of gene expression between the groups of T1R-affected and T1R-free patients.
We considered a gene to be differentially regulated if its ΔFC was greater than 1.3 or smaller than 1/1.3. The justification for this cut-off was derived from the overall distribution of ΔFC values for the probes with a |FC| of ≥2 and captures approximately the 10% of extreme ΔFC values for those probes (Figure 2A). Indeed, ΔFC ≥1.3 or ≤1/1.3 probes represent a reasonable selection of probes in terms of differential intensity of triggered probes (Figure 2B). The 50 probes identified represent a total of 44 genes (Table 3). Since all of these genes belonged to the cluster of transcripts that were up-regulated by the M. leprae sonicate stimulation, the identified genes differed in their intensity of transcriptional up-regulation. Hence, reference to over-stimulated or under-stimulated genes in T1R patients is always relative to T1R-free leprosy patients.

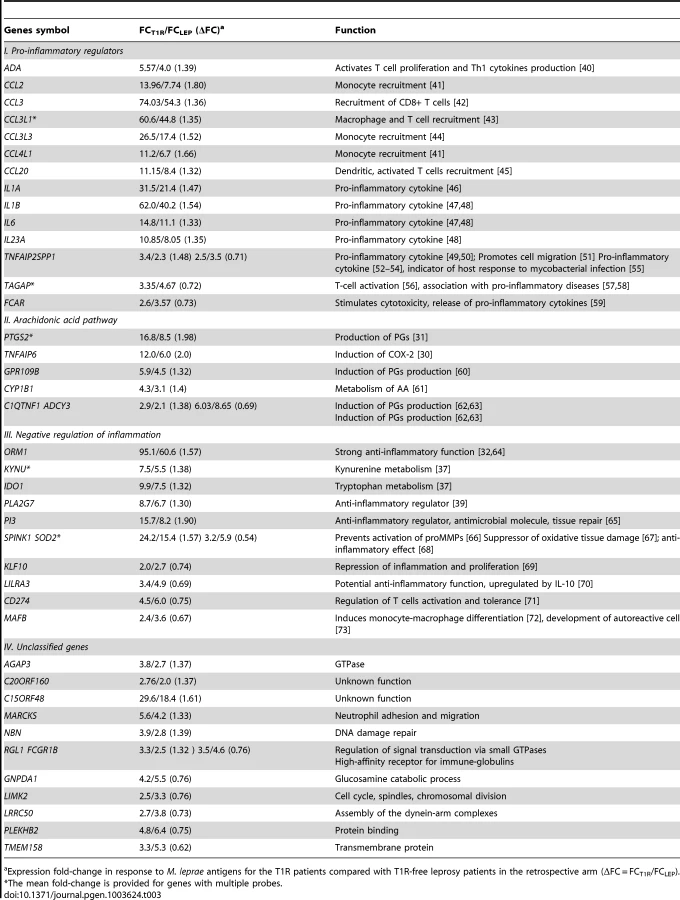
We classified the 44 differentially regulated genes by their functional roles in immunological processes. More specifically, we assigned 32 genes into 3 distinct groups: i) genes promoting a pro-inflammatory response; ii) genes belonging to the arachidonic acid (AA) metabolic pathway, iii) genes involved in down-regulation of the inflammatory response. The remaining 12 genes were not assigned to any specific functional class, i.e. they were regarded as unclassified genes (Table 3). There were larger proportions of under-stimulated genes in the groups of “negative regulation of inflammation” and “unclassified genes” as compared to the groups “pro-inflammatory regulators” and “arachidonic acid pathway” (Table 3). We defined these 44 genes as T1R gene set signature.
Validation of the T1R gene set in a prospective sample
Approximately two-thirds of T1R patients develop clinical symptoms of T1R only after diagnosis of leprosy and initiation of treatment. Such patients can be enrolled in a prospective design. We collected blood samples from 43 recently diagnosed borderline leprosy patients with no signs of T1R at the time of leprosy diagnosis. Blood stimulation with M. leprae sonicate at the time of enrolment was performed by the identical procedure used in the retrospective study. All patients were followed for at least 3 years and a total of 11 individuals with T1R episodes were recorded. After 3 years no additional episodes of T1R are expected to occur [8]. Transcriptome analysis of whole blood assays from the prospective samples detected 752 genes regulated by M. leprae sonicate with ≥2-fold change in T1R-affected and/or T1R-free patients. The gene sets and pathways represented by these genes largely overlapped those detected in the retrospective sample (Table S1).
As in the retrospective discovery arm, no single gene was significantly differentially regulated between T1R-free and T1R-affected leprosy patients in the prospective arm. Therefore, we focused our approach on the systematic analysis of differentially expressed groups of genes with special focus on the T1R-specific gene set. To test for the significance of differential regulation of groups of genes between T1R-affected and T1R-free patients we performed receiver operator characteristic scoring (ROC) analysis [23], [24]). The ROC algorithm, an equivalent of the Wilcoxon rank sum test, performs ranking of genes based on their scores. We used the absolute log2 transformed ΔFC values as gene scores. Subsequently, ROC clusters genes according to GO terms and user-defined gene sets and tests for the overrepresentation of high scoring genes in each gene-set. As the proportion of top ranking genes in a gene set increases, the set becomes more significant. We performed the initial analysis by comparing T1R patients to T1R-free leprosy patients in the retrospective sample, and validated the results in the prospective sample. Contrary to the approach used for the T1R-specific set in the discovery phase, for the ROC analysis we used all available probes without a specified score cut-off point to avoid bias in the results. We restricted the number of genes representing an individual gene set to be between 5 and 100. As the ΔFC value can have two directions we split the probe sets into “over-regulated” (ΔFC≥1) and “under-regulated” (ΔFC<1) groups of genes. Since the direction of differential stimulation is an important replication criterion, groups of over - or under-stimulated genes from the same gene set were analysed separately.
The T1R gene set included 29 genes that were over-regulated and 15 genes that were under-regulated (Table 3). As expected, in the retrospective discovery sample the set of 29 over-regulated genes was very significantly enriched (PBH = 1.07×10−53). Importantly, the same set of genes was very significantly replicated in the prospective validation sample (PBH = 2.33×10⁻⁹; Table 4). Next, we analysed the 10 GO terms most significantly overrepresented among T1R patients in the retrospective sample for replication in the prospective sample. As no gene score cut-off was used for ROC analysis the GO terms included up to 100 genes. Several of these GO terms concerned immune cells activation. For example, 72 genes of the GO term “Regulation of leukocyte activation”, were significantly more up-regulated in T1R patients in both the discovery (PBH = 2.33×10⁻⁶) and the validation sample (PBH = 4.91×10⁻³; Table 4). Likewise, a set of 97 genes of the lymphocyte activation GO term was significantly stronger regulated in T1R patients in both discovery (PBH = 3.28×10⁻⁶) and replication sample (PBH = 3.91×10⁻⁴). In addition, several replicated GO terms related to control of cellular immune response, including “Regulation of cell activation” (Retrospective PBH = 6.88×10⁻⁶ and Prospective PBH = 9.44×10⁻³), “Anti-apoptosis” (Retrospec PBH = 1.00×10⁻⁵ and Prospec PBH = 1.74×10⁻⁴) and “Response to virus” (Retrospec PBH = 1.36×10⁻⁵ and Prospec PBH = 5.74×10⁻⁶; Table 4). Of note, among the ten highly significant GO terms with up-regulated genes in retrospective T1R patients, four did not replicate in the prospective sample (Table 4).

When we analysed the list of 15 genes under-stimulated in the T1R gene set signature in the retrospective arm, we also observed a very significant differential regulation T1R (PBH = 7.7×10⁻³¹) which was expected since the T1R gene set had been derived from the same data. More importantly, this result was replicated in the prospective sample (PBH = 2.36×10⁻³; Table 5). Among the ten most significantly under-stimulated GO terms we observed a preponderance of gene sets related to RNA processing the majority of which was replicated in the prospective sample (Table 5). For example, we detected two large gene sets involved in negative regulation of cellular protein metabolic processes (100 genes) and protein modification processes (82 genes) that were significant under-stimulated in T1R patients in both the retrospective and prospective samples (Retrospec PBH = 5.98×10⁻⁴/Prospec PBH = 3.97×10⁻⁴, and Retrospec PBH = 1.00×10⁻³/Prospec PBH = 1.18×10⁻⁴, respectively; Table 5). Overall, from 20 tested gene sets we successfully replicated thirteen with the combined T1R gene set showing the strongest evidence for replication for any gene set.

Impact of covariates
We evaluated a possible impact of gender and age at diagnosis on the significance of the T1R gene set. In the discovery arm of the study we had equal numbers of males (3) and females (3) among the T1R patients. We tested ΔFC ranking for heterogeneity by gender and found significant over-representation of both over - and under-stimulated genes of the T1R gene set among males (PBH = 9.5×10⁻²⁰ and PBH = 2.1×10⁻¹⁰, respectively). In the prospective arm, only males developed T1R and an impact of gender could not be tested. To test for impact of age, we subdivided subjects into 15 years and younger (n = 3) or older than 15 years (n = 3) and found significantly better ranking of the T1R gene set in older patients for over - but not for under-stimulated genes (PBH = 1×10⁻¹⁴ and PBH = 0.16, respectively). The impact of age on the T1R set was not unexpected since young age (<16 years) is highly protective for T1R in Vietnam [8]. In the prospective sample, only one T1R case was younger than 16 years and no further tests were conducted. While the T1R-gene set ranked significantly in all sub-groups, the data suggested that the T1R gene set might have better characteristics for older male patients. Next, we investigated the impact of time to onset of T1R after leprosy diagnosis on replication of the T1R gene set. First, we compared ΔFC values between four subjects who presented with T1R within one month of leprosy diagnosis and the seven patients that developed T1R more distant to initial diagnosis (2 to 21 months). The ΔFC values for the T1R gene set ranked significantly better among late onset T1R (PBH = 1.89×10⁻¹⁶ and PBH = 1.14×10⁻⁵ for over-and under-stimulated genes, respectively). These results suggest that rapid onset patients already displayed preclinical forms of T1R and that the onset of T1R immune dysregulation in those patients overwhelmed the predictive signature.
Discussion
Despite the effective treatment of T1R by corticosteroids, neurological impairment persists in about 30% to 50% of cases [25]. Thus, the early identification of patients at risk of T1R, and consequently at risk of neurological injury, is a critical challenge in leprosy care [26]. The identity of the factors that commit certain leprosy patients to T1R while others remain free of such complications is unknown. Episodes of T1R are characterized by a highly dysregulated inflammatory response which makes it difficult to discern specific functional indicators of T1R risk in patients with ongoing reactions. To avoid this problem, we enrolled former T1R patients that had undergone an episode of T1R at least seven years earlier and compared their reaction to M. leprae antigens with the one displayed by former leprosy patients that had remained T1R-free. This sample was too small to assess a possible impact of time since cure on the transcriptional response but the spread of time since cure across all subjects was rather narrow suggesting that this would not bias results. As assay we used transcriptional profiling of whole blood cultures stimulated with high doses of M. leprae sonicate. The gene sets that were preferentially regulated in former T1R patients were then validated in a prospective study where we followed newly diagnosed leprosy patients at risk of T1R for three years. Transcriptome responses to M. leprae antigens were compared between patients who developed T1R and those who did not. Hence, our study was not designed to study pathogenic networks of host response during T1R but to evaluate characteristics of the transcriptomic response of T1R patients to M. leprae antigen prior to the onset of any clinical symptoms of T1R. The important result of our study was that we were able to define a T1R gene set signature based on the magnitude of expression differences in the retrospective sample that we replicated very significantly in an independent prospective sample. This T1R gene set now needs to be investigated for its possible predictive value in follow-up studies.
An important aspect of our analysis was the finding that for individual transcripts we failed to detect significant differences in M. leprae antigen triggered gene induction between T1R-affected and T1R-free leprosy patients. The lack of significant differences for individual gene transcripts prompted us to analyse differences of induction in sets of genes involved in the same cellular functions. Gene sets reflect biological pathways or processes and therefore represent a higher level of host responses to stimuli than individual genes. The fact that gene set analyses can identify changes in host responsiveness that cannot be detected through the study of any individual gene is a powerful feature of such analyses. Since our interest was in the difference of gene induction by M. leprae antigen between the two groups of patients, we used the difference in gene induction as a “score” to characterize the transcriptional response of individual genes. These gene scores were then used in the gene set analysis. By considering the scores of all genes on the expression chip we were able to identify gene sets that significantly differed between the two patient groups in a global and unbiased fashion. In addition, the genes that are part of a gene set need to have a strong biological link to the phenotype to which the gene set is assigned. A substantial number of genes in the T1R set signature are strong mediators of a pro-inflammatory response which is driven by monocytes and lymphocytes reflecting the clinical picture of T1R episodes which are characterized by excessive cell-mediated immunity [9], [27]. This is best shown by the large number of chemokine-coding genes that are more strongly upregulated in T1R patients since the encoded molecules mediate the recruitment of monocytes and lymphocytes to the site of inflammation (Table 3). For example, identification of CCL2 as a part of the T1R gene set is not surprising and could be considered as a positive control of the experiment as it is entirely consistent with the reported increase of CCL2 expression in lesions of active T1R patients [28].
The T1R gene set contains a substantial number of genes involved in arachidonic acid metabolism. The release of AA and its derivatives is a crucial step in the regulation of pro - and anti-inflammatory signalling. For example, PTGS2, encoding COX-2, a central gene in the AA pathway, was one of the preferentially upregulated genes in the T1R gene set signature. Clinical detection of increased levels of COX-2 in edemas, vessels and nerves of T1R patients [29] is supported by the drastic upregulation of PTGS2 in T1R patients. In line with this observation, TNFAIP6, which was highly expressed in the early onset T1R samples, encodes TNF-stimulated gene 6 (TSG6), an inducer of COX-2 expression in macrophages [30]. COX-2 oxidizes AA leading to the production of prostaglandins which are powerful mediators of pro - and anti-inflammatory responses [31].
A substantial number of genes in the T1R gene set represent strong mediators of the anti-inflammatory response. For example, alpha-1-acid glycoprotein (AGP), encoded by the ORM1 gene, is a potent inhibitor of neutrophil chemotaxis and superoxide anion generation [32]. The serum level of AGP is used as a biomarker of leprosy type-2 reactions and Crohn's Disease management [33], [34]. Elafin, coded by PI3, can effectively de-activate neutrophil elastase thus preventing excessive tissue damage [35]. Additionally, by inhibiting NF-κB and AP-1 activity elafin controls the extent of the inflammatory response in tissues [36]. IDO1 and KYNU encode the anti-inflammatory regulators indoleamin-2,3-dioxygenase (IDO) and kynureninase (KYNU), respectively, that are involved in the tryptophan metabolic pathway [37]. The metabolites of the tryptophan breakdown represent potent mediators of the anti-inflammatory response [38]. The oxidative action of IDO on tryptophan is dependent on the presence of the superoxide radical anion (O2−) which is utilized by IDO both as a substrate and a cofactor. In a competitive reaction O2− is inactivated by superoxide dismutase (SOD2). Therefore, the observed relative down-regulation of SOD2 in retrospective T1R patients favours the presence of superoxide radical anions providing both substrate and cofactor for IDO. The coordinated up-regulation of IDO1 and KYNU and down-regulation of SOD2 reveals a strong anti-inflammatory response in the retrospective T1R patients. Finally, PLA2G7 encodes a phospholipase A that inactivates the potent pro-inflammatory mediator platelet-activating factor (PAF) [39].
The usefulness and robustness of the T1R gene set was demonstrated by the validation of the T1R set signature in a prospective study. For this, we conducted whole blood assays for newly diagnosed leprosy patients before the onset of clinical symptoms of T1R. The validity of the T1R gene set signature in this design directly demonstrates that T1R patients have an innate predisposition to mount a strong pro-inflammatory response to M. leprae antigens despite the up-regulation of major anti-inflammatory genes. Hence, the apparent breakdown of communication between pro - and anti-inflammatory responses in T1R patients appears as characteristic of T1R susceptibility. However, it is important to realize that the T1R gene set does not capture all aspects of predisposition to T1R nor does it allow conclusions about the effector mechanism at work during ongoing T1R. Hence, while our data point to a primary role of innate immunity in predisposition it is possible that acquired immunity responses missed by our design make an important contribution to T1R predisposition. Nevertheless, the results of our experiments raise two immediate questions. What are the genetic factors that predispose a person to undergo T1R after exposure to M. leprae antigens and is the observed breakdown in the regulation of pro-inflammatory responses specific to T1R patients? The answers to these questions may impact on a multitude of human inflammatory diseases.
Materials and Methods
Ethics statement
The study was conducted according to the principles expressed in the declaration of Helsinki. Informed consent was obtained for all subjects participating in the study. The study was approved by the regulatory authorities and ethics committees in Ho Chi Minh City, Vietnam, and the Research Ethics Board at the Research Institute of the McGill University Health Centre, Montreal, QC, Canada.
Human subjects
For the retrospective study, we recruited 12 unrelated Kinh Vietnamese subjects at the Dermato-Venereology (DV) Hospital in Ho Chi Minh City, Vietnam. These individuals had previously been diagnosed with borderline leprosy (BT: n = 3, BB: n = 7, BL: n = 2) and six of them had presented with T1R at the time of their leprosy diagnosis. At the time of recruitment for the present study, all individuals had been cured and had remained asymptomatic for at least five years. Males (n = 5) and females (n = 7) were approximately equal distributed across both groups. Age at the time of leprosy diagnosis ranged from 9 to 28 years, with a median age of 18 years. For the prospective study, we recruited 43 individuals recently diagnosed with borderline leprosy without T1R. Blood samples were collected from patients within less than 3 months of their leprosy diagnosis and before undergoing T1R. Enrolled individuals presented with five borderline leprosy subtypes (BT: n = 10, BT/BB: n = 6, BB: n = 19, BB/BL: n = 2, BL: n = 6). Among the recruited patients 34 were males and 9 were females; the median age was 27 years (range 9 to 41 years). The recruitment of younger individuals for the retrospective study is explained by age being a risk factor for the occurrence of T1R at the time of diagnosis [8]. The male∶female ratio is representative of the patient hospital turn in. All prospective patients were closely followed for 3 years during which 11 patients developed T1R.
Preparation of Mycobacterium leprae sonicate
M. leprae whole cell sonicate was generated with support from the NIH/NIAID Leprosy Contract N01-AI-25469 at Colorado State University. Inactivated (irradiated) armadillo-derived M. leprae whole cells were probe sonicated with a Sanyo sonicator to >95% breakage to produce whole cell sonicate.
Whole-blood assay
A total of 20 ml of whole blood was obtained from each subject by venipuncture in EDTA vacutainers. Blood samples were split in two aliquots and each aliquot was mixed with RPMI medium containing L-glutamine (300 mg/L) and HEPES (10 mM) at 1∶2. One aliquot was stimulated with M. leprae sonicate at a concentration of 20 µg/ml, which approximately corresponds to an MOI of 50 M. leprae per white blood cell. The second aliquot was left untreated. Each aliquot, the stimulated one and the control, was divided into four 50 ml polystyrene tubes to facilitate better leukocytes adhesion and aeration of blood. Tubes were incubated for 26–32 hours at 37°C, 5% CO2.
RNA extraction
Total RNA from blood samples was extracted employing a modified protocol of the LeukoLOCK RNA extraction kit (Ambion, CA, USA). Briefly, blood aliquots were filtered by gravity through LeukoLOCK filters to isolate leukocytes. Collected cells were rinsed to eliminate red blood cells and lysed directly on the LeukoLOCK filters. Extraction of total RNA was performed according to the manufacturer's instructions. Isolated RNAs were kept under ethanol and ammonium acetate at −80°C. Prior to further experiments, all samples were cleaned with the RNeasy kit (Qiagen, Germany). The quality of 110 RNA samples (stimulated with M. leprae sonicate or not for each of 55 individuals) was assessed by the BioAnalyzer (Agilent). All samples showed RNA Integrity Numbers above 8.5, indicating a good RNA quality, were reverse transcribed, amplified and labelled for hybridization following standard protocol.
Microarray data analysis
The retrospective 24 samples (12 stimulated and 12 non-stimulated) from healthy controls and former leprosy patients were hybridized to Illumina HumanRef_6_v3 BeadChips and screened for expression changes of 48,804 individual probes (representing 37,804 loci). The prospective 86 samples were hybridized to Illumina HumanHT_12_v4 BeadChips and screened for 47,323 probes (34,695 loci). Raw data were collected by BeadStudio v3.3.7 (Illumina Inc., CA). Utilizing FlexArray 1.6.1.1 (http://genomequebec.mcgill.ca/FlexArray) raw data were subjected to variance-stabilization transformation (VST) and quantile normalization. In the retrospective arm, the regulation of transcription was determined by comparing mean expression values for each probe in stimulated and unstimulated samples of each phenotype group. The expression FC was estimated using the formula: To focus on highly M. leprae-regulated transcripts we selected all genes whose expression levels were increased or decreased by a fold-change of 2 or more. To compare the extent of transcription regulation between T1R-affected and T1R-free leprosy patients we looked at the ratio in post-stimulatory expression changes, ΔFC = FCT1R/FCLep. We selected genes that were differentially regulated between two groups with ΔFC≤1/1.3 (termed under-regulated) and ΔFC≥1.30 (termed over-regulated). We employed DAVID version 6.7 (http://david.abcc.ncifcrf.gov/; [20], [21]) to estimate the enrichment of Gene Ontology (GO, [22]) terms and metabolic or signalling pathways within the list of genes regulated by M. leprae sonicate. We selected the GO terms of levels 3 to 5 which assign more specific functional annotation to each gene. Due to involvement in multiple processes some genes are assigned to multiple GO terms. We used Benjamini-Hochberg correction for multiple testing (PBH), controlling the false-discovery rate (FDR) at 0.05. A particular GO term was considered significantly overrepresented in a gene list when its PBH-value was <10−5.
Receiver operator characteristic (ROC) scoring
ROC was performed using ErmineJ software (http://www.chibi.ubc.ca/ermineJ/, [23], [24]). ROC is used as the standard method of evaluating genes scores by their ranking. The algorithm is based exclusively on the order of the underlying values (gene scores). The ROC method tests the null hypothesis that genes represented in gene sets are randomly distributed in their ranking. For each gene set the ROC value is calculated, which reflects the area under the curve, ranging from 0.5 (genes in the set are ranked randomly) to 1.0 (the gene set includes only the highest-scoring genes). Thus, ROC evaluates the probability of high-scoring genes to belong to a specific gene set while accounting for the number of genes in the set. We used absolute values of log2 transformed ΔFC values for the probes as gene scores in the ROC algorithm. All available probes were used for the analyses. For genes represented by multiple probes the mean score was used. For the analysis we only considered biological processes GO terms containing 5–100 genes. In addition to the T1R gene set, the ten most significant differentially regulated GO terms in the retrospective arm were tested for replication in the prospective arm.
Supporting Information
Zdroje
1. WHO (2010) Global leprosy situation, 2010. Wkly Epidemiol Rec 85 : 337–348.
2. BrittonWJ, LockwoodDN (2004) Leprosy. Lancet 363 : 1209–1219.
3. ScollardDM, AdamsLB, GillisTP, KrahenbuhlJL, TrumanRW, et al. (2006) The continuing challenges of leprosy. Clin Microbiol Rev 19 : 338–381.
4. RidleyDS, JoplingWH (1966) Classification of leprosy according to immunity. A five-group system. Int J Lepr Other Mycobact Dis 34 : 255–273.
5. FavaV, OrlovaM, CobatA, AlcaisA, MiraM, et al. (2012) Genetics of leprosy reactions: an overview. Mem Inst Oswaldo Cruz 107 ((Suppl. I)) 132–42.
6. WalkerSL, LockwoodDN (2007) Leprosy. Clin Dermatol 25 : 165–172.
7. KumarB, DograS, KaurI (2004) Epidemiological characteristics of leprosy reactions: 15 years experience from north India. Int J Lepr Other Mycobact Dis 72 : 125–133.
8. RanqueB, NguyenVT, VuHT, NguyenTH, NguyenNB, et al. (2007) Age is an important risk factor for onset and sequelae of reversal reactions in Vietnamese patients with leprosy. Clin Infect Dis 44 : 33–40.
9. LittleD, Khanolkar-YoungS, CoulthartA, SuneethaS, LockwoodDN (2001) Immunohistochemical analysis of cellular infiltrate and gamma interferon, interleukin-12, and inducible nitric oxide synthase expression in leprosy type 1 (reversal) reactions before and during prednisolone treatment. Infect Immun 69 : 3413–3417.
10. RoseP, WatersMF (1991) Reversal reactions in leprosy and their management. Lepr Rev 62 : 113–121.
11. VerhagenCE, WierengaEA, BuffingAA, ChandMA, FaberWR, et al. (1997) Reversal reaction in borderline leprosy is associated with a polarized shift to type 1-like Mycobacterium leprae T cell reactivity in lesional skin: a follow-up study. J Immunol 159 : 4474–4483.
12. StefaniMM, MartelliCM, GillisTP, KrahenbuhlJL (2003) In situ type 1 cytokine gene expression and mechanisms associated with early leprosy progression. J Infect Dis 188 : 1024–1031.
13. MoraesMO, SarnoEN, AlmeidaAS, SaraivaBC, NeryJA, et al. (1999) Cytokine mRNA expression in leprosy: a possible role for interferon-gamma and interleukin-12 in reactions (RR and ENL). Scand J Immunol 50 : 541–549.
14. MoraesMO, SampaioEP, NeryJA, SaraivaBC, AlvarengaFB, et al. (2001) Sequential erythema nodosum leprosum and reversal reaction with similar lesional cytokine mRNA patterns in a borderline leprosy patient. Br J Dermatol 144 : 175–181.
15. Khanolkar-YoungS, RaymentN, BrickellPM, KatzDR, VinayakumarS, et al. (1995) Tumour necrosis factor-alpha (TNF-alpha) synthesis is associated with the skin and peripheral nerve pathology of leprosy reversal reactions. Clin Exp Immunol 99 : 196–202.
16. Becx-BleuminkM, BerheD (1992) Occurrence of reactions, their diagnosis and management in leprosy patients treated with multidrug therapy; experience in the leprosy control program of the All Africa Leprosy and Rehabilitation Training Center (ALERT) in Ethiopia. Int J Lepr Other Mycobact Dis 60 : 173–184.
17. van BrakelWH, KhawasIB, LucasSB (1994) Reactions in leprosy: an epidemiological study of 386 patients in west Nepal. Lepr Rev 65 : 190–203.
18. SchreuderPA (1998) The occurrence of reactions and impairments in leprosy: experience in the leprosy control program of three provinces in northeastern Thailand, 1987–1995 [correction of 1978–1995]. II. Reactions. Int J Lepr Other Mycobact Dis 66 : 159–169.
19. SharmaN, KoranneRV, MendirattaV, SharmaRC (2004) A study of leprosy reactions in a tertiary hospital in Delhi. J Dermatol 31 : 898–903.
20. HuangdW, ShermanBT, LempickiRA (2009) Systematic and integrative analysis of large gene lists using DAVID bioinformatics resources. Nat Protoc 4 : 44–57.
21. DennisGJr, ShermanBT, HosackDA, YangJ, GaoW, et al. (2003) DAVID: Database for Annotation, Visualization, and Integrated Discovery. Genome Biol 4: R60.1–R60.11.
22. AshburnerM, BallCA, BlakeJA, BotsteinD, ButlerH, et al. (2000) Gene ontology: tool for the unification of biology. The Gene Ontology Consortium. Nat Genet 25 : 25–29.
23. LeeHK, BraynenW, KeshavK, PavlidisP (2005) ErmineJ: tool for functional analysis of gene expression data sets. BMC Bioinformatics 6 : 269–276.
24. GillisJ, MistryM, PavlidisP (2010) Gene function analysis in complex data sets using ErmineJ. Nat Protoc 5 : 1148–1159.
25. BrittonWJ (1998) The management of leprosy reversal reactions. Lepr Rev 69 : 225–234.
26. WalkerSL, LockwoodDN (2008) Leprosy type 1 (reversal) reactions and their management. Lepr Rev 79 : 372–386.
27. CooperCL, MuellerC, SinchaisriTA, PirmezC, ChanJ, et al. (1989) Analysis of naturally occurring delayed-type hypersensitivity reactions in leprosy by in situ hybridization. J Exp Med 169 : 1565–1581.
28. KirkaldyAA, MusondaAC, Khanolkhar-YoungS, SuneethaS, LockwoodDN (2003) Expression of CC and CXC chemokines and chemokine receptors in human leprosy skin lesions. Clin Exp Immunol 134 : 447–453.
29. PesceC, GrattarolaM, MeniniS, FialloP (2006) Cyclooxygenase 2 expression in vessels and nerves in reversal reaction leprosy. Am J Trop Med Hyg 74 : 1076–1077.
30. MindrescuC, LeJ, WisniewskiHG, VilcekJ (2005) Up-regulation of cyclooxygenase-2 expression by TSG-6 protein in macrophage cell line. Biochem Biophys Res Commun 330 : 737–745.
31. KozakKR, RowlinsonSW, MarnettLJ (2000) Oxygenation of the endocannabinoid, 2-arachidonylglycerol, to glyceryl prostaglandins by cyclooxygenase-2. J Biol Chem 275 : 33744–33749.
32. FournierT, MedjoubiN, PorquetD (2000) Alpha-1-acid glycoprotein. Biochim Biophys Acta 1482 : 157–171.
33. GuptaN, ShankernarayanNP, DharmalingamK (2010) alpha1-acid glycoprotein as a putative biomarker for monitoring the development of the type II reactional stage of leprosy. J Med Microbiol 59 : 400–407.
34. KupcovaV, TureckyL, DetkovaZ, PrikazskaM, KeleovaA (2003) Changes in acute phase proteins after anti-tumor necrosis factor antibody (infliximab) treatment in patients with Crohn's disease. Physiol Res 52 : 89–93.
35. SallenaveJM (2000) The role of secretory leukocyte proteinase inhibitor and elafin (elastase-specific inhibitor/skin-derived antileukoprotease) as alarm antiproteinases in inflammatory lung disease. Respir Res 1 : 87–92.
36. HenriksenPA, HittM, XingZ, WangJ, HaslettC, et al. (2004) Adenoviral gene delivery of elafin and secretory leukocyte protease inhibitor attenuates NF-kappa B-dependent inflammatory responses of human endothelial cells and macrophages to atherogenic stimuli. J Immunol 172 : 4535–4544.
37. ThomasSR, StockerR (1999) Redox reactions related to indoleamine 2,3-dioxygenase and tryptophan metabolism along the kynurenine pathway. Redox Rep 4 : 199–220.
38. BelladonnaML, GrohmannU, GuidettiP, VolpiC, BianchiR, et al. (2006) Kynurenine pathway enzymes in dendritic cells initiate tolerogenesis in the absence of functional IDO. J Immunol 177 : 130–137.
39. KostopanagiotouG, AvgerinosE, CostopanagiotouC, ArkadopoulosN, AndreadouI, et al. (2008) Acute lung injury in a rat model of intestinal ischemia-reperfusion: the potential time depended role of phospholipases A(2). J Surg Res 147 : 108–116.
40. FrancoR, PachecoR, GatellJM, GallartT, LluisC (2007) Enzymatic and extraenzymatic role of adenosine deaminase 1 in T-cell-dendritic cell contacts and in alterations of the immune function. Crit Rev Immunol 27 : 495–509.
41. FischerJ, WestJ, AgochukwuN, SuireC, Hale-DonzeH (2007) Induction of host chemotactic response by Encephalitozoon spp. Infect Immun 75 : 1619–1625.
42. CastellinoF, HuangAY, Altan-BonnetG, StollS, ScheineckerC, et al. (2006) Chemokines enhance immunity by guiding naive CD8+ T cells to sites of CD4+ T cell-dendritic cell interaction. Nature 440 : 890–895.
43. McKinneyC, MerrimanME, ChapmanPT, GowPJ, HarrisonAA, et al. (2008) Evidence for an influence of chemokine ligand 3-like 1 (CCL3L1) gene copy number on susceptibility to rheumatoid arthritis. Ann Rheum Dis 67 : 409–413.
44. BertiniR, LuiniW, SozzaniS, BottazziB, RuggieroP, et al. (1995) Identification of MIP-1 alpha/LD78 as a monocyte chemoattractant released by the HTLV-I-transformed cell line MT4. AIDS Res Hum Retroviruses 11 : 155–160.
45. ZlotnikA, YoshieO (2000) Chemokines: a new classification system and their role in immunity. Immunity 12 : 121–127.
46. RamadasRA, EwartSL, MedoffBD, LevineAM (2011) Interleukin-1 family member 9 stimulates chemokine production and neutrophil influx in mouse lungs. Am J Respir Cell Mol Biol 44 : 134–145.
47. CavaillonJM (1994) Cytokines and macrophages. Biomed Pharmacother 48 : 445–453.
48. AtzeniF, Sarzi-PuttiniP (2009) Anti-cytokine antibodies for rheumatic diseases. Curr Opin Investig Drugs 10 : 1204–1211.
49. MookherjeeN, BrownKL, BowdishDM, DoriaS, FalsafiR, et al. (2006) Modulation of the TLR-mediated inflammatory response by the endogenous human host defense peptide LL-37. J Immunol 176 : 2455–2464.
50. SabanR, D'AndreaMR, Andrade-GordonP, DerianCK, DozmorovI, et al. (2007) Regulatory network of inflammation downstream of proteinase-activated receptors. BMC Physiol 7 : 3–17.
51. ChenLC, ChenCC, LiangY, TsangNM, ChangYS, et al. (2011) A novel role for TNFAIP2: its correlation with invasion and metastasis in nasopharyngeal carcinoma. Mod Pathol 24 : 175–184.
52. LiuH, ChenA, GuoF, YuanL (2010) A short-hairpin RNA targeting osteopontin downregulates MMP-2 and MMP-9 expressions in prostate cancer PC-3 cells. Cancer Lett 295 : 27–37.
53. RobertsonBW, BonsalL, ChellaiahMA (2010) Regulation of Erk1/2 activation by osteopontin in PC3 human prostate cancer cells. Mol Cancer 9 : 260–269.
54. DelimpouraV, BakakosP, TseliouE, BessaV, HillasG, et al. (2010) Increased levels of osteopontin in sputum supernatant in severe refractory asthma. Thorax 65 : 782–786.
55. NauGJ, ChuppGL, EmileJF, JouanguyE, BermanJS, et al. (2000) Osteopontin expression correlates with clinical outcome in patients with mycobacterial infection. Am J Pathol 157 : 37–42.
56. ChangIF, HsiaoHY (2005) Induction of RhoGAP and pathological changes characteristic of Alzheimer's disease by UAHFEMF discharge in rat brain. Curr Alzheimer Res 2 : 559–569.
57. FestenEA, GoyetteP, GreenT, BoucherG, BeauchampC, et al. (2011) A meta-analysis of genome-wide association scans identifies IL18RAP, PTPN2, TAGAP, and PUS10 as shared risk loci for Crohn's disease and celiac disease. PLoS Genet 7: e1001283.
58. EyreS, HinksA, BowesJ, FlynnE, MartinP, et al. (2010) Overlapping genetic susceptibility variants between three autoimmune disorders: rheumatoid arthritis, type 1 diabetes and coeliac disease. Arthritis Res Ther 12: R175–R180.
59. MonteiroRC, Van De WinkelJG (2003) IgA Fc receptors. Annu Rev Immunol 21 : 177–204.
60. KnowlesHJ, te PoeleRH, WorkmanP, HarrisAL (2006) Niacin induces PPARgamma expression and transcriptional activation in macrophages via HM74 and HM74a-mediated induction of prostaglandin synthesis pathways. Biochem Pharmacol 71 : 646–656.
61. ChoudharyD, JanssonI, StoilovI, SarfaraziM, SchenkmanJB (2004) Metabolism of retinoids and arachidonic acid by human and mouse cytochrome P450 1b1. Drug Metab Dispos 32 : 840–847.
62. BirnbaumerM (2000) Vasopressin receptors. Trends Endocrinol Metab 11 : 406–410.
63. WangXJ, DysonMT, MondilloC, PatrignaniZ, PignataroO, et al. (2002) Interaction between arachidonic acid and cAMP signaling pathways enhances steroidogenesis and StAR gene expression in MA-10 Leydig tumor cells. Mol Cell Endocrinol 188 : 55–63.
64. WilliamsJP, WeiserMR, PechetTT, KobzikL, MooreFDJr, et al. (1997) alpha 1-Acid glycoprotein reduces local and remote injuries after intestinal ischemia in the rat. Am J Physiol 273: G1031–G1035.
65. SallenaveJM, CunninghamGA, JamesRM, McLachlanG, HaslettC (2003) Regulation of pulmonary and systemic bacterial lipopolysaccharide responses in transgenic mice expressing human elafin. Infect Immun 71 : 3766–3774.
66. MoilanenM, SorsaT, StenmanM, NybergP, LindyO, et al. (2003) Tumor-associated trypsinogen-2 (trypsinogen-2) activates procollagenases (MMP-1, -8, -13) and stromelysin-1 (MMP-3) and degrades type I collagen. Biochemistry 42 : 5414–5420.
67. KosakaT, YoshinoJ, InuiK, WakabayashiT, KobayashiT, et al. (2009) Involvement of NAD(P)H:quinone oxidoreductase 1 and superoxide dismutase polymorphisms in ulcerative colitis. DNA Cell Biol 28 : 625–631.
68. GaoB, FloresSC, LeffJA, BoseSK, McCordJM (2003) Synthesis and anti-inflammatory activity of a chimeric recombinant superoxide dismutase: SOD2/3. Am J Physiol Lung Cell Mol Physiol 284: L917–L925.
69. SubramaniamM, HawseJR, RajamannanNM, IngleJN, SpelsbergTC (2010) Functional role of KLF10 in multiple disease processes. Biofactors 36 : 8–18.
70. AnH, ChandraV, PirainoB, BorgesL, GeczyC, et al. (2010) Soluble LILRA3, a potential natural antiinflammatory protein, is increased in patients with rheumatoid arthritis and is tightly regulated by interleukin 10, tumor necrosis factor-alpha, and interferon-gamma. J Rheumatol 37 : 1596–1606.
71. SinghAK, StockP, AkbariO (2011) Role of PD-L1 and PD-L2 in allergic diseases and asthma. Allergy 66 : 155–162.
72. KellyLM, EnglmeierU, LafonI, SiewekeMH, GrafT (2000) MafB is an inducer of monocytic differentiation. EMBO J 19 : 1987–1997.
73. KimH, SeedB (2010) The transcription factor MafB antagonizes antiviral responses by blocking recruitment of coactivators to the transcription factor IRF3. Nat Immunol 11 : 743–750.
Štítky
Genetika Reprodukční medicínaČlánek vyšel v časopise
PLOS Genetics
2013 Číslo 7
- Kazuistika – Perspektivy využití precizované medicíny v rámci personalizované specifické terapie onkologických pacientů
- Nobelova cena za chemii pro genetické nůžky: Objev, který změní naši budoucnost?
- Technologie na bázi RNA v klinické praxi: od přebarvených petúnií k terapii vzácných a dosud jen obtížně léčitelných chorob u lidí
- „Nepředstavovali jsme si, že náš výzkum povede přímo ke vzniku nových léků, dokonce ještě za našeho života“
- Bezplatné služby pro diagnostiku ATTRv amyloidózy pro kardiology
Nejčtenější v tomto čísle
- Bacterial Adaptation through Loss of Function
- SLC26A4 Targeted to the Endolymphatic Sac Rescues Hearing and Balance in Mutant Mice
- The Cohesion Protein SOLO Associates with SMC1 and Is Required for Synapsis, Recombination, Homolog Bias and Cohesion and Pairing of Centromeres in Drosophila Meiosis
- Gene × Physical Activity Interactions in Obesity: Combined Analysis of 111,421 Individuals of European Ancestry
Zvyšte si kvalifikaci online z pohodlí domova
Mazová zátka a její řešení
nový kurzVšechny kurzy