
Noisy Splicing Drives mRNA Isoform Diversity in Human Cells
While the majority of multiexonic human genes show some evidence of alternative splicing, it is unclear what fraction of observed splice forms is functionally relevant. In this study, we examine the extent of alternative splicing in human cells using deep RNA sequencing and de novo identification of splice junctions. We demonstrate the existence of a large class of low abundance isoforms, encompassing approximately 150,000 previously unannotated splice junctions in our data. Newly-identified splice sites show little evidence of evolutionary conservation, suggesting that the majority are due to erroneous splice site choice. We show that sequence motifs involved in the recognition of exons are enriched in the vicinity of unconserved splice sites. We estimate that the average intron has a splicing error rate of approximately 0.7% and show that introns in highly expressed genes are spliced more accurately, likely due to their shorter length. These results implicate noisy splicing as an important property of genome evolution.
Published in the journal:
. PLoS Genet 6(12): e32767. doi:10.1371/journal.pgen.1001236
Category:
Research Article
doi:
https://doi.org/10.1371/journal.pgen.1001236
Summary
While the majority of multiexonic human genes show some evidence of alternative splicing, it is unclear what fraction of observed splice forms is functionally relevant. In this study, we examine the extent of alternative splicing in human cells using deep RNA sequencing and de novo identification of splice junctions. We demonstrate the existence of a large class of low abundance isoforms, encompassing approximately 150,000 previously unannotated splice junctions in our data. Newly-identified splice sites show little evidence of evolutionary conservation, suggesting that the majority are due to erroneous splice site choice. We show that sequence motifs involved in the recognition of exons are enriched in the vicinity of unconserved splice sites. We estimate that the average intron has a splicing error rate of approximately 0.7% and show that introns in highly expressed genes are spliced more accurately, likely due to their shorter length. These results implicate noisy splicing as an important property of genome evolution.
Introduction
Most mammalian mRNAs are processed from much longer precursors in a series of splicing reactions. Regulation of these splicing reactions can lead to alternatively spliced forms of mRNA from the same pre-mRNA [1], and there is considerable interest in cataloguing the functionally important transcripts of all mammalian genes. Towards this end, transcript diversity has been examined using data from full mRNA sequences, expressed sequence tags (ESTs), or high-throughput sequencing of cDNA libraries (RNA-Seq) [2]–[6]. In particular, recent RNA-Seq studies have established that nearly all multiexonic human genes have multiple detectable isoforms [2], [5].
The observation of extensive alternative splicing could indicate that most genes have many functionally-relevant isoforms; alternatively, many transcripts could be nonfunctional “noise” [7]–[10]. The latter explanation is supported by a few pieces of evidence from analyses of EST databases. In particular, a large fraction of exon-skipping events in human genes is not observed in mice (ie. is not conserved) [11]–[13], and the number of observed isoforms of a gene correlates with the number of exons it has (and thus the theoretical number of potential transcripts it could produce) [8]. Additionally, it is hypothesized that short introns in humans (as well as in other eukaryotes) have evolved to preferentially trigger degradation via nonsense-mediated decay (NMD) mechanisms when the spliceosome fails to remove them, suggesting that such errors are common enough to exert a detectable selective pressure [14].
There are also theoretical reasons to expect splicing to be error-prone. First, the binding sites for proteins important in exon recognition comprise a large mutational target; it has been estimated that approximately 30 bases are necessary for fully efficient splicing of an intron [15]. The potential for mutational disruption of these binding sites has been referred to as part of the “intrinsic cost of introns” [16]. Further, the large size of introns relative to exons gives ample opportunity for the mutational creation of new (weak) binding sites. Although mutations which create or disrupt binding sites may be slightly deleterious, the large number of possible such mutations makes it inevitable that some will reach fixation in a population. This is particularly relevant in species, such as humans, with relatively small long-term effective population sizes. It is plausible, then, that the human genome carries a substantial load of suboptimal sequences which cause the generation of aberrant transcript isoforms. In this study, we present direct evidence that this is indeed the case.
Results
We have performed deep sequencing of cDNA libraries generated from mRNA from 75 lymphoblastoid cell lines derived from Nigerian individuals as part of the International HapMap Project (69 from Pickrell et al. [17] and 6 additional ones). In total, we generated 1.4 billion sequencing reads of either 35 or 46 base pairs. 1.2 billion of these sequencing reads mapped to the genome. We used the remainder to identify splice junctions (without reference to known exons) by splitting each sequencing read into two and mapping each end to the genome independently. In total, 48 million additional reads mapped to the genome using this read-splitting procedure, and we identified 392,612 putative splice junctions.
Most previous investigations of splice junctions using RNA-seq data have considered putative splice junctions only between previously annotated or predicted exons [2], [4], [5], [18], [19]. Since our method makes no such restriction, one reasonable concern is that we might identify spurious junctions due to mapping or sequencing errors. However, there is strong evidence that the identified junctions are real outcomes of splicing reactions. First, despite the fact that our mapping approach used no information about the sequence specificity of the splicing reaction, the majority of the putative junctions contain GT-AG dinucleotides (the canonical splice sites) directly intronic of the edges of the predicted splice sites (Figure 1A). If we assume that all putative junctions without intronic matches to the canonical splice sites (or the alternative dinucleotide pair GC-AG) are false positives, we estimate a False Discovery Rate (FDR) of 1.5% for the 306,606 junctions that do contain such matches (Methods). Second, the positions of putative alternative splice sites near protein-coding splice sites follow a periodic pattern, such that splice sites which maintain the coding frame of the exon are observed more often than those which disrupt frame (Figure 1C, 1D). In total, 42% of these alternative splice sites are in frame (; binomial test against the null hypothesis of 33%). This observation recapitulates patterns seen in studies of EST databases [20]–[22]. In the remainder of the paper we analyze only the set of 306,606 junctions which contain intronic matches to GT-AG or GC-AG.

Many identified junctions are novel
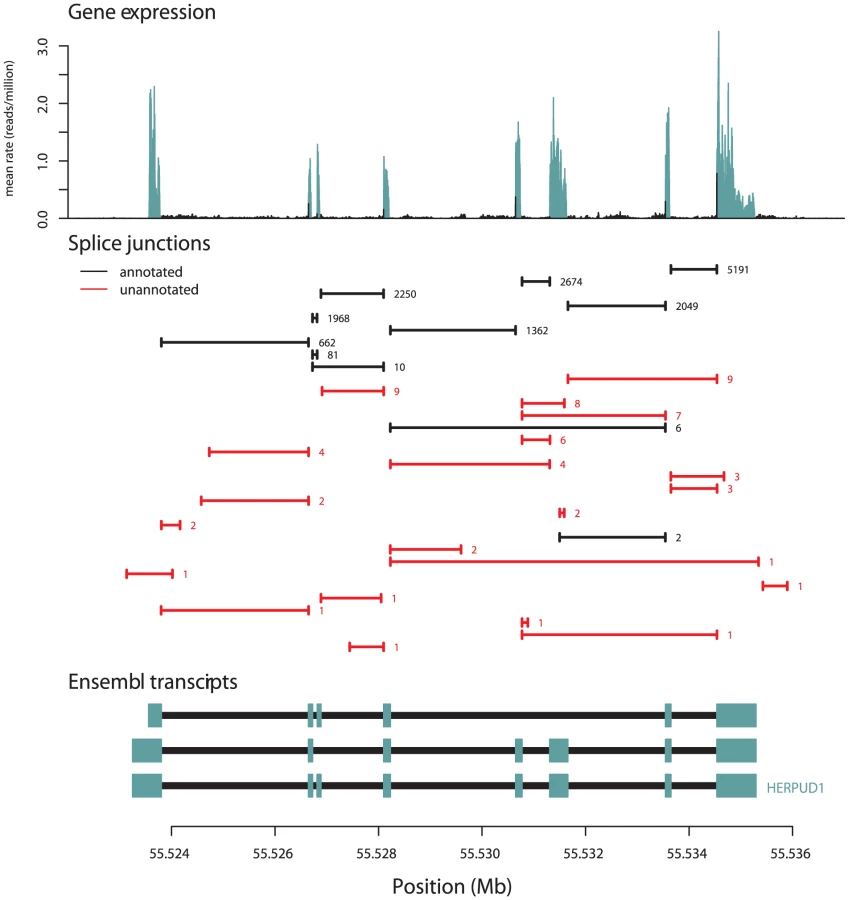
We compared the junctions we identified to gene models from the UCSC, Ensembl, Vega, and RefSeq databases, and to spliced ESTs from Genbank [23]–[27]. Of the 306,606 splice junctions, 154,927 (50.5%) are not annotated as parts of known gene models, and 136,313 (44.5%) are not present in Genbank. For splice junctions not present in gene models, we estimate an FDR of about 2% (Methods). The extensive unannotated splicing we observe is largely due to junctions that are rarely seen in our data (Figure 1B): while 50% of all observed junctions are not present in gene models, these account for only 1.7% of all junction-spanning sequencing reads (Table 1). For example, 21 of the 32 splice junctions observed in the gene HERPUD1 are unannotated, but only around 0.5% of the reads from this gene are derived from these 21 unannotated junctions (Figure 2). We see no sign that our identification of isoforms is near saturation (Figure S1); thus deeper sequencing of transcriptomes will likely continue to identify additional low-abundance isoforms.

Characteristics of identified junctions and splice sites
Next, we quantified overall levels of alternative splicing. To do this, we considered a set of splice sites covered by at least 50 reads in our data (there are 77,754 such 5′ splice sites and 77,733 such 3′ splice sites; of these are annotated in gene model databases). We then counted both the number of different places in the genome to which each site is spliced, as well as the proportions of reads covering each junction. We estimate that the “major” splice form accounts for 98.4% of reactions involving each splice site; in our data the average splice site is involved in 1.8 different splicing reactions. 5′ splice sites in untranslated regions (UTRs) are involved in a mean of 2.6 splicing reactions, versus 1.8 for 5′ splice sites in protein-coding regions; the corresponding numbers are 3.2 and 1.7 for 3′ splice sites.
We then evaluated how the splice junctions correspond to known gene models. We split the junctions into five classes: (i) those where the junction is annotated; (ii) those between splice sites that are both annotated (but not annotated as being spliced together); (iii) those where the 5′ splice site (but not the 3′ splice site) is annotated; (iv) those where the 3′ splice site (but not the 5′ splice site) is annotated; and (v) those where neither splice site is annotated. 80% of the unannotated junctions involve at least one annotated splice site, and though many newly-identified splice sites fall near annotated sites, the majority do not (Table 1). This indicates that a large fraction of the low-abundance isoforms are not modifications of known exons, but instead contain entirely new exons.
Extensive unannotated splicing is present in different human populations and tissues
We next asked whether we could confirm these observations in other cell lines and primary tissues. We first performed the same analysis on RNA-Seq data generated on a different set of human LCLs [28]. We identified 219,322 splice junctions at an FDR of 1.5%, 82,658 of which are unannotated (Figure S1). We then analyzed RNA-Seq data from primary human liver samples (George Perry, unpublished data); we identified 156,905 splice junctions at an FDR of 0.8%, 29,655 of which are unannotated (Figure S1). Finally, we analyzed RNA-Seq data from a set of several primary tissues [2]; we identified 136,499 splice junctions at an FDR of 1.8%, 21,743 of which are unannotated (Figure S1). The numbers of unannotated splice junctions in these studies are roughly consistent with the observed numbers found in the Yoruba data, given the lower sequencing depths of those other studies and hence better sampling of common junctions relative to rare junctions (Figure S1). This confirms that the observation of extensive unannotated splicing is broadly generalizable; for the rest of the paper we focus on the original set of Yoruban LCL data since this is the largest RNA-Seq dataset currently available.
We also considered how much splicing shows evidence of being restricted to particular individuals, rather than shared across the entire population (due to, for example, sequence polymorphisms which influence splicing [17], [28]–[30]). Though it is difficult to estimate this precisely, several analyses suggest that only a couple percent of splice junctions, at maximum, show evidence of being restricted to certain individuals (Text S1).
Most unannotated splice junctions show no evolutionary conservation
We hypothesized that unannotated, rarely-used splice sites are the result of evolutionarily-neutral (or perhaps slightly deleterious) splicing errors. To test this, we compared the sequence conservation across placental mammals (using the phyloP score [31]) between the unannotated and annotated splice sites (we assume that current gene databases are highly enriched for truly functional exons). If the unannotated splice sites are functionally relevant, their sequence conservation should be comparable to that of annotated splice sites. For this analysis, we used the set of splice junctions where one end is an annotated splice site and the other is more than 50 bases away from an annotated splice site.
Annotated splice sites show a striking pattern of sequence conservation–the splice sites themselves are highly conserved, as are the regions exonic of the splice sites (Figure 3A). In contrast, the conservation scores around unannotated splice sites show little, if any, signal of evolutionary constraint (Figure 3B). This same pattern holds in an independent sample of LCLs and in primary human liver samples (Figures S2 and S3). To exclude the possibility that our analysis overlooked splice sites that are conserved in only a subset of placental mammals, we repeated this analysis using phyloP scores calculated using only primates, and saw the same pattern (Figure S4). Further, humans have reduced polymorphism in the annotated splice sites, but no such reduction in the unannotated splice sites (Figure S5). The most parsimonious explanation of these observations is that the majority of rarely-used, unannotated splice sites are simply due to mis-spliced transcripts.

Estimation of splicing error rates
To estimate the fraction of mature mRNAs resulting from mis-splicing, we identified a set of splice junctions where both the 5′ and 3′ splice sites are highly conserved (those with a phyloP score ). We then asked how often the conserved splice sites are spliced to unconserved splice sites (to provide a conservative lower bound on the amount of mis-splicing, we used a relaxed threshold of a phyloP score 0.5 to call a splice site as unconserved for this analysis). Approximately 0.7% of reads involving either end of a conserved junction are to unconserved splice sites. Given that the median gene in the human genome has four exons (and thus three splicing reactions), this suggests that approximately 2% of transcripts from the average gene are mis-spliced. Because mis-spliced transcripts are preferentially removed by NMD mechanisms, this is likely a conservative estimate.
We next tried to identify factors that are predictive of an intron's level of splicing error. The two factors we considered were the intron's length and the expression level of the gene in which the intron falls. Longer introns show higher levels of mis-splicing (Figure 4), while highly expressed genes show somewhat lower levels (Figure S6). These associations may be confounded, however, by the fact that highly expressed genes tend to have shorter introns [32]. Indeed, the association between splicing error rate and gene expression level disappears after correction for intron length (Figure S5), indicating that this association is largely driven by the lower splicing error rate of small introns. The different sequence composition of introns in highly expressed genes [33] may also influence their lower rate of splicing error (Text S1; Figure S7).

“Noise” splice sites are marked by genomic features that define exons
Finally, we considered the mechanism which results in the generation of mis-spliced transcripts. To do so, we looked for hexamers enriched in the vicinity of unconserved, rarely-used splice sites, as compared to nearby “decoy” splice sites (matching GT or AG) which we never observed to be used in our data. 574 hexamers show significant enrichment or depletion exonic of the 5′ SS, and 728 exonic of the 3′ splice site (Figure 5A; ; test). Although the relative enrichments of hexamers near the 5′ and 3′ splice sites are similar, a set of hexamers matching the binding site for the U1 snRNP (which recognizes the 5′ splice site) is strongly depleted in the vicinity of the 5′ splice sites, but shows only limited or no depletion in the vicinity of 3′ splice sites (Figure 5A). This is consistent with the observation that competitive binding of the core splice factors plays an important role in splice site choice [34]. There is a smaller, but still substantial, number of hexamers enriched or depleted intronic of the splice sites (295 and 282 for 5′ and 3′ splice sites, respectively).

We compared our list of hexamers to the list of exonic splicing enhancers (ESEs) identified by Fairbrother et al. [35], some of which were validated experimentally, and found that 79% of the ESEs are enriched exonic of both 3′ and 5′ splice sites in our data (, test). This is evidence that noisy splicing is a result of the binding of the same splice factors used to identify exons more generally. Further support for this possibility comes from the observation that the hexamers identified near noise splice sites demarcate the boundaries of constitutive exons in our data (Figure 5B, 5C).
Discussion
In this study, we have examined the extent of alternative splicing in human cells. We have demonstrated that there is a large number of evolutionarily unconserved (and presumably slightly deleterious) alternative isoforms of most genes, and have presented evidence that this noisy splicing is the result of stochastic binding of sequence-specific factors involved in exon recognition.
Noisy splicing
Two main observations support the contention that the majority of low-abundance isoforms are due to splicing errors. First, rarely-used splice sites are enriched near often-used splice sites, and additionally show a periodic pattern around those sites ([20], [21], Figure 1). Our interpretation of these observations (like that of Dou et al. [20] and Chern et al. [21]) is that the splicing machinery occasionally misses its “intended” splice site, and that the resultant isoforms which disrupt the protein-coding reading frame are preferentially degraded by the NMD machinery. Second, rarely-used, unannotated splice sites (we interpret the fact that a splice site is annotated as evidence that it is relatively highly expressed in at least one tissue) show little evidence of evolutionary conservation across placental mammals (Figure 3) or primates (Figure S3), or of constraint within humans (Figure S4). We conclude, then, that the majority of low-abundance splice forms are indeed “noise”. In fact, because our identification of splice forms is not yet at saturation (Figure S1), we extrapolate that the majority of different mRNA isoforms present in a cell are not functionally relevant, though most copies of a pre-mRNA produce truly functional isoforms. We speculate that this conclusion will hold at the protein level as well.
Mechanisms of noisy splicing
One goal in understanding the mechanism of splicing is the generation of a “splicing code”–a set of rules which the cell uses to convert the information present in a pre-mRNA sequence to a properly spliced mRNA [36]–[38]. This code presumably involves the binding sites for various splice factors [35], [39], [40], as well as local chromatin structure [41]–[46]. The results presented here suggest that, instead of being a deterministic function that maps a pre-mRNA sequence to a spliced transcript, the “splicing code” instead defines a probability distribution for each pre-mRNA on a large number of possible splice forms. That is, the same pre-mRNA sequence will stochastically result in a large number of isoforms, presumably even within the same cell. We suggest that low-probability events may be informative about the parameters of this distribution.
Evolutionary consequences of noisy splicing
The level of splicing error observed in a gene reflects a balance between the continuous input of mutations that disrupt splicing and the ability of selection to remove them [16]. Indeed, selection for proper discrimination between introns and exons has affected genome evolution in a number of ways, by constraining the composition of amino acids coded near splice sites [47] and influencing the sequence composition of introns [14], [48]. We have shown that longer introns are more prone to splicing errors. This is consistent with the increased rate of birth of new, alternatively spliced exons in long introns [49], [50], and supports the contention that long introns are more deleterious than short introns [51], [52]. This may contribute to selection for short introns in highly expressed genes [32].
One implication of the above reasoning is that the level of splicing error observed in an organism should depend on the complexity of the splicing machinery in the species (ie., the number of potential mutations that could affect splicing) and the effective population size of the species (and hence the effectiveness of natural selection in removing those mutations). This is consistent with the observation that levels of alternative splicing vary considerably across eukaryotes [53]. A prediction, then, is that species with larger effective population sizes or simpler splicing mechanisms should have lower rates of splicing error. Progress in RNA-Seq technology will soon allow relatively unbiased exploration of the evolution of splicing noise in a wide variety of species, and allow propositions such as these to be tested.
Methods
Data used
For the main analysis of LCLs, we used RNA-Seq data generated on 75 HapMap cell lines derived from Yoruban individuals. Data from 69 of these were reported in Pickrell et al. [17]. We also generated RNA-Seq data on six additional HapMap Yoruban cell lines, using the same protocol as in Pickrell et al. [17]. Each cell line was sequenced in two lanes on the Illumina GA2 platform, one lane at the Yale sequencing center using 35 base pair sequencing reads, and one at the Argonne sequencing center using 46 base pair sequencing reads. The cell line identifiers and basic quality control metrics are presented in Table 1 in Text S1. All data are available at http://eqtl.uchicago.edu.
For the analysis of an independent set of human LCLs, we obtained RNA-Seq data on a set of 60 HapMap cell lines derived from individuals of European descent [28]. These data consist of paired-end 37 base pair reads generated on the Illumina GA2 platform, obtained from http://jungle.unige.ch/rnaseq_CEU60/. We treated each end of a paired-end read independently, and used the protocol described below to identify splice junctions. For the analysis of primary human liver cell, we used RNA-Seq data from four human liver samples (G. Perry, unpublished). These data consist of paired-end 76 base pair reads generated on the Illumina GA2 platform. RNA-Seq data from multiple other tissues were obtained from Wang et al. [2] and Wu et al. [54]. All data were processed in the same manner, described below.
Identification of splice junctions de novo
Here, we describe our approach for de novo identification of splice junctions, which is similar to previous approaches [17], . Software is available at http://eqtl.uchicago.edu.
-
First, we mapped all the reads to a modified version of hg18, where all chromosomes labeled “random” were removed and the pseudoautosomal region of the Y chromosome was converted to all “N”s. We used bwa v.0.5.7 [61] with the default parameters.
-
All reads that did not map to the genome in the first step were considered as possible junction-spanning reads. We took the first 20 bases and the last 20 bases of each such read and mapped each end to the genome independently using bwa. For reads shorter than 40 bases, these two ends are overlapping.
-
If both ends of a read shorter than 40 bases mapped uniquely to the genome, we discarded the read. If both ends of a longer read mapped uniquely (with a mapping quality score 10) to the same strand of the same chromosome within 20 kb (and greater than 50 bases apart), we considered all possible splice junctions consistent with the positions of the two ends and reported all junctions with the lowest number of mismatches between the read and the genome.
-
If one end of a read mapped uniquely to the genome, we first extended the alignment as far as we could without allowing a mismatch, then searched 20 kb downstream for a perfect match to the rest of the read. If there was only one such perfect match, and there were at least 10 bases mapped on either side of the splice junction, we kept the read.
-
We note that there is ambiguity in the precise splice site covered by a read. This is because the consensus 5′ splice site is AG GTA (where denotes the position of the splice junction, and italics the exonic sequence), and the consensus 3′ splice site is CAG G. So, for example, a read covering that splice junction would also be consistent with a 5′ splice site of A GGTA and a 3′ splice site of CA GG. For each read which we were able to map, we recorded all such possible splice junctions. In the majority of the paper, however, we use only those junctions matching GT-AG or GC-AG.
By doing the mapping in this way, we expect to recover approximately 55% of all the 46 base pair reads that span splice junctions (outside repetitive regions of the genome), and approximately 30% of all the 35 base pair reads that span splice junctions (there are 10 allowable breakpoints in a 35 base pair read, and 26 allowable breakpoints in a 46 base pair read). We note that we are also limiting ourselves to identifying introns with a maximum length of 20 kb; this is sufficient for the majority of introns in humans.
Analysis of lowly-used splice sites near protein-coding sites
In Figure 1, we show the density of splice sites near known protein-coding sites. In this analysis, we used only splice sites annotated as being protein-coding in all the transcripts of the gene in Ensembl and Refseq. To generate this figure for the 3′ splice sites, we identified all the 5′ splice sites covered by at least 20 reads, spliced to at least two 3′ splice sites, and where one of those 3′ splice sites contributed % of all the reads from that 5′ splice site. We will call that 3′ splice site the “major” splice site, and the other the “minor” splice site. We then recorded all the positions of matches to AG in the region surrounding the “major” splice site. For each distance from the “major” splice site, we can then count the number of “minor” splice forms at that distance, as well as the number of AG dinucleotides that would lead to a splice site at that distance. The ratio of those two numbers is plotted in Figure 1. We excluded the positions from −2 to +2 from the splice site due to ambiguity in the read mapping. Analysis for the 5′ splice sites is analogous.
Genome annotations used
We downloaded the Ensembl, UCSC, Vega, and RefSeq gene models from the annotation of hg18 in the UCSC Genome Browser on Dec. 31st, 2009. We downloaded the spliced EST track on March 1st, 2010. Throughout the paper, when we refer to an “annotated” splice junction, we mean one present in at least one of the Ensembl, UCSC, Vega, or RefSeq databases as of that date. In several places in the paper, we use presence of a splice site in these databases as a proxy for function (rather than, for example, read depth in our data). This is supported by our analysis of conservation (Figure 3A); even rarely-used splice sites in LCLs which are present in gene databases show high levels of sequence conservation (Figure S8). This is likely due to that fact that some fraction of rarely-used splice sites in LCLs are abundantly used in some other tissue, and thus are both functionally relevant and annotated in current databases.
Estimation of the False Discovery Rate of splice junctions
We can estimate the FDR for the junctions we identified by considering how often each junction is consistent with a GT-AG intron versus control pairs of dinucleotides (recall that each junction read is usually consistent with several pairs of potential splice sites). Of the 392,612 junctions initially identified, 306,606 are consistent with GT-AG or GC-AG (298,346 are consistent with the former, and 8,260 with the latter). In contrast, 4,230 are consistent with control dinucleotides GT-TC or GC-TC (note that the controls simply contain the complement of the 3′ splice site consensus dinucleotide). If we assume that all of the controls are false positives, this gives an FDR of 1.4% (4,230/306,606). If we restrict ourselves only to the 240,644 splice junctions that have not been previously observed, 154,927 are consistent with GT-AG or GC-AG, and 2,985 are consistent with the control pairs of dinucleotides. This gives an FDR for the set of unannotated junctions which contain intronic matches to GT-AG or GC-AG as 1.9% (2,985/154,927). We saw no evidence of enrichment for AT-AC introns, and so did not consider them.
Conservation analysis
In the analysis of sequence conservation, we used phylop scores generated on the 44-way vertebrate alignment, and downloaded from the UCSC Genome Browser [31]. There are three sets of scores available (representing scores for constraint in all vertebrates, all placental mammals, and all primates); in the analysis presented in the main text, we used scores generated using the placental mammals.
Analysis of correlates of splicing error rate
For each intron with highly conserved splice sites, we counted the fraction of reads from either splice site to an unconserved splice site, as described in the main text. To estimate the expression level of each gene, we used both our RNA-Seq data and that from the different tissues assayed by Wang et al. [2]. For each tissue, we divided the number of reads mapping to exons of each gene by the length of the exons of the gene. We then took the maximum expression level across tissues as the expression level of the gene for this analysis.
Motif finding
To look for hexamers enriched around “noise” splice sites, we used a set of splice junctions where one end of the splice junction is to an annotated splice site, and the other is to an unannotated, unconserved (phyloP score ) splice site. To be conservative, we removed all the unconserved splice sites within 50 bases of an annotated splice site. Then we identified a set of control sites–for each unconserved splice site, we found an unused GT (or AG) dinucloetide between the used splice site and the nearest annotated one. We then extracted 100 bases around both the used splice sites and the control sites, and counted the frequencies of hexamers in each class (for the 3′ splice site, we excluded the 20 bases intronic and 2 bases exonic of the splice site from this analysis; for the 5′ splice site, we excluded 5 bases intronic and 5 bases exonic). We did this separately for 3′ and 5′ splice sites, and for the intronic and exonic regions of both types of site. Significance was assessed by a test.
Supporting Information
Zdroje
1. BlackDL
2003 Mechanisms of alternative pre-messenger RNA splicing. Annu Rev Biochem 72 291 336
2. l WangET
SandbergR
LuoS
KhrebtukovaI
ZhangL
2008 Alternative isoform regulation in human tissue transcriptomes. Nature 456 470 6
3. ZavolanM
KondoS
SchonbachC
AdachiJ
HumeDA
2003 Impact of alternative initiation, splicing, and termination on the diversity of the mRNA transcripts encoded by the mouse transcriptome. Genome Res 13 1290 300
4. MortazaviA
WilliamsBA
McCueK
SchaefferL
WoldB
2008 Mapping and quantifying mammalian transcriptomes by RNA-Seq. Nat Methods 5 621 8
5. PanQ
ShaiO
LeeLJ
FreyBJ
BlencoweBJ
2008 Deep surveying of alternative splicing complexity in the human transcriptome by high-throughput sequencing. Nat Genet 40 1413 5
6. ModrekB
LeeC
2002 A genomic view of alternative splicing. Nat Genet 30 13 9
7. HurstLD
2009 Evolutionary genomics and the reach of selection. J Biol 8 12
8. MelamudE
MoultJ
2009 Stochastic noise in splicing machinery. Nucleic Acids Res 37 4873 86
9. ZhangC
KrainerAR
ZhangMQ
2007 Evolutionary impact of limited splicing fidelity in mammalian genes. Trends Genet 23 484 8
10. BaekD
GreenP
2005 Sequence conservation, relative isoform frequencies, and nonsense-mediated decay in evolutionarily conserved alternative splicing. Proc Natl Acad Sci U S A 102 12813 8
11. SorekR
ShamirR
AstG
2004 How prevalent is functional alternative splicing in the human genome? Trends Genet 20 68 71
12. YeoGW
Van NostrandE
HolsteD
PoggioT
BurgeCB
2005 Identification and analysis of alternative splicing events conserved in human and mouse. Proc Natl Acad Sci U S A 102 2850 5
13. ModrekB
LeeCJ
2003 Alternative splicing in the human, mouse and rat genomes is associated with an increased frequency of exon creation and/or loss. Nat Genet 34 177 80
14. JaillonO
BouhoucheK
GoutJF
AuryJM
NoelB
2008 Translational control of intron splicing in eukaryotes. Nature 451 359 62
15. LynchM
2010 Rate, molecular spectrum, and consequences of human mutation. Proc Natl Acad Sci U S A 107 961 8
16. LynchM
2007 The origins of genome architecture. Mass. Sinauer Associates
17. PickrellJK
MarioniJC
PaiAA
DegnerJF
EngelhardtBE
2010 Understanding mechanisms underlying human gene expression variation with RNA sequencing. Nature 464 768 72
18. SultanM
SchulzMH
RichardH
MagenA
KlingenhoffA
2008 A global view of gene activity and alternative splicing by deep sequencing of the human transcriptome. Science 321 956 60
19. MarioniJC
MasonCE
ManeSM
StephensM
GiladY
2008 RNA-seq: an assessment of technical reproducibility and comparison with gene expression arrays. Genome Res 18 1509 17
20. DouY
Fox-WalshKL
BaldiPF
HertelKJ
2006 Genomic splice-site analysis reveals frequent alternative splicing close to the dominant splice site. RNA 12 2047 56
21. ChernTM
van NimwegenE
KaiC
KawaiJ
CarninciP
2006 A simple physical model predicts small exon length variations. PLoS Genet 2 e45 doi:10.1371/journal.pgen.0020045
22. HillerM
PlatzerM
2008 Widespread and subtle: alternative splicing at short-distance tandem sites. Trends Genet 24 246 55
23. HsuF
KentWJ
ClawsonH
KuhnRM
DiekhansM
2006 The UCSC Known Genes. Bioinformatics 22 1036 46
24. HubbardTJP
AkenBL
AylingS
BallesterB
BealK
2009 Ensembl 2009. Nucleic Acids Res 37 D690 7
25. PruittKD
TatusovaT
MaglottDR
2007 NCBI reference sequences (RefSeq): a curated non-redundant sequence database of genomes, transcripts and proteins. Nucleic Acids Res 35 D61 5
26. PruittKD
HarrowJ
HarteRA
WallinC
DiekhansM
2009 The consensus coding sequence (CCDS) project: Identifying a common protein-coding gene set for the human and mouse genomes. Genome Res 19 1316 23
27. BensonDA
Karsch-MizrachiI
LipmanDJ
OstellJ
SayersEW
2010 GenBank. Nucleic Acids Res 38 D46 51
28. MontgomerySB
SammethM
Gutierrez-ArcelusM
LachRP
IngleC
2010 Transcriptome genetics using second generation sequencing in a caucasian population. Nature 464 773 7
29. KwanT
BenovoyD
DiasC
GurdS
ProvencherC
2008 Genome-wide analysis of transcript isoform variation in humans. Nat Genet 40 225 31
30. FraserHB
XieX
2009 Common polymorphic transcript variation in human disease. Genome Res 19 567 75
31. PollardKS
HubiszMJ
RosenbloomKR
SiepelA
2010 Detection of nonneutral substitution rates on mammalian phylogenies. Genome Res 20 110 21
32. Castillo-DavisCI
MekhedovSL
HartlDL
KooninEV
KondrashovFA
2002 Selection for short introns in highly expressed genes. Nat Genet 31 415 8
33. HurstLD
BruntonCF
SmithNG
1999 Small introns tend to occur in GC-rich regions in some but not all vertebrates. Trends Genet 15 437 9
34. YuY
MaroneyPA
DenkerJA
ZhangXHF
DybkovO
2008 Dynamic regulation of alternative splicing by silencers that modulate 5′ splice site competition. Cell 135 1224 36
35. FairbrotherWG
YehRF
SharpPA
BurgeCB
2002 Predictive identification of exonic splicing enhancers in human genes. Science 297 1007 13
36. WangZ
BurgeCB
2008 Splicing regulation: from a parts list of regulatory elements to an integrated splicing code. RNA 14 802 13
37. MatlinAJ
ClarkF
SmithCWJ
2005 Understanding alternative splicing: towards a cellular code. Nat Rev Mol Cell Biol 6 386 98
38. BarashY
CalarcoJA
GaoW
PanQ
WangX
2010 Deciphering the splicing code. Nature 465 53 9
39. ZhangXHF
ChasinLA
2004 Computational definition of sequence motifs governing constitutive exon splicing. Genes Dev 18 1241 50
40. WangZ
RolishME
YeoG
TungV
MawsonM
2004 Systematic identification and analysis of exonic splicing silencers. Cell 119 831 45
41. LucoRF
PanQ
TominagaK
BlencoweBJ
Pereira-SmithOM
2010 Regulation of alternative splicing by histone modifications. Science 327 996 1000
42. SpiesN
NielsenCB
PadgettRA
BurgeCB
2009 Biased chromatin signatures around polyadenylation sites and exons. Mol Cell 36 245 54
43. SchwartzS
MeshorerE
AstG
2009 Chromatin organization marks exon-intron structure. Nat Struct Mol Biol 16 990 5
44. TilgnerH
NikolaouC
AlthammerS
SammethM
BeatoM
2009 Nucleosome positioning as a determinant of exon recognition. Nat Struct Mol Biol 16 996 1001
45. AnderssonR
EnrothS
Rada-IglesiasA
WadeliusC
KomorowskiJ
2009 Nucleosomes are well positioned in exons and carry characteristic histone modifications. Genome Res 19 1732 41
46. Kolasinska-ZwierzP
DownT
LatorreI
LiuT
LiuXS
2009 Differential chromatin marking of introns and expressed exons by H3K36me3. Nat Genet 41 376 81
47. ParmleyJL
UrrutiaAO
PotrzebowskiL
KaessmannH
HurstLD
2007 Splicing and the evolution of proteins in mammals. PLoS Biol 5 e14 doi:10.1371/journal.pbio.0050014
48. ZhangC
LiWH
KrainerAR
ZhangMQ
2008 Rna landscape of evolution for optimal exon and intron discrimination. Proc Natl Acad Sci U S A 105 5797 802
49. RoyM
KimN
XingY
LeeC
2008 The effect of intron length on exon creation ratios during the evolution of mammalian genomes. RNA 14 2261 73
50. Fox-WalshKL
DouY
LamBJ
HungSP
BaldiPF
2005 The architecture of pre-mrnas affects mechanisms of splice-site pairing. Proc Natl Acad Sci U S A 102 16176 81
51. CarvalhoAB
ClarkAG
1999 Intron size and natural selection. Nature 401 344
52. LynchM
2002 Intron evolution as a population-genetic process. Proc Natl Acad Sci U S A 99 6118 23
53. KimE
MagenA
AstG
2007 Different levels of alternative splicing among eukaryotes. Nucleic Acids Res 35 125 31
54. WuJQ
HabeggerL
NoisaP
SzekelyA
QiuC
2010 Dynamic transcriptomes during neural differentiation of human embryonic stem cells revealed by short, long, and paired-end sequencing. Proc Natl Acad Sci U S A
55. TrapnellC
PachterL
SalzbergSL
2009 Tophat: discovering splice junctions with RNA-Seq. Bioinformatics 25 1105 11
56. TrapnellC
WilliamsBA
PerteaG
MortazaviA
KwanG
2010 Transcript assembly and quantification by RNA-Seq reveals unannotated transcripts and isoform switching during cell differentiation. Nat Biotechnol 28 511 5
57. GuttmanM
GarberM
LevinJZ
DonagheyJ
RobinsonJ
2010 Ab initio reconstruction of cell type-specific transcriptomes in mouse reveals the conserved multi-exonic structure of lincRNAs. Nat Biotechnol 28 503 10
58. AmeurA
WetterbomA
FeukL
GyllenstenU
2010 Global and unbiased detection of splice junctions from RNA-seq data. Genome Biol 11 R34
59. AuKF
JiangH
LinL
XingY
WongWH
2010 Detection of splice junctions from paired-end RNA-seq data by SpliceMap. Nucleic Acids Res 38 4570 8
60. YassourM
KaplanT
FraserHB
LevinJZ
PfiffnerJ
2009 Ab initio construction of a eukaryotic transcriptome by massively parallel mRNA sequencing. Proc Natl Acad Sci U S A 106 3264 9
61. LiH
DurbinR
2009 Fast and accurate short read alignment with Burrows-Wheeler transform. Bioinformatics 25 1754 60
Štítky
Genetika Reprodukční medicínaČlánek vyšel v časopise
PLOS Genetics
2010 Číslo 12
- Kazuistika – Perspektivy využití precizované medicíny v rámci personalizované specifické terapie onkologických pacientů
- Nobelova cena za chemii pro genetické nůžky: Objev, který změní naši budoucnost?
- Technologie na bázi RNA v klinické praxi: od přebarvených petúnií k terapii vzácných a dosud jen obtížně léčitelných chorob u lidí
- „Nepředstavovali jsme si, že náš výzkum povede přímo ke vzniku nových léků, dokonce ještě za našeho života“
- Bezplatné služby pro diagnostiku ATTRv amyloidózy pro kardiology
Nejčtenější v tomto čísle
- Functional Comparison of Innate Immune Signaling Pathways in Primates
- Expression of Linear and Novel Circular Forms of an -Associated Non-Coding RNA Correlates with Atherosclerosis Risk
- Genome-Wide Interrogation of Mammalian Stem Cell Fate Determinants by Nested Chromosome Deletions
- Histone H2A C-Terminus Regulates Chromatin Dynamics, Remodeling, and Histone H1 Binding
Zvyšte si kvalifikaci online z pohodlí domova
Mazová zátka a její řešení
nový kurzVšechny kurzy