
Papillomavirus Genomes Associate with BRD4 to Replicate at Fragile Sites in the Host Genome
Papillomavirus cause persistent, but mostly self-limiting, infections of the host epithelium. However, a subset of oncogenic papillomaviruses is the causative agent of certain human cancers. In persistent infection the viral genomes are tethered to host chromosomes to maintain and partition the extrachromosomal viral genomes to daughter cells. However, in cancers viral DNA is often found integrated close to common fragile sites, regions prone to breakage, amplification and deletion. We show that the viral E2 and cellular BRD4 proteins are associated with fragile regions of the human genome and nucleate viral replication foci at these sites. This is a resourceful strategy for a virus that uses the host DNA damage response to amplify viral DNA. However, the outcome may be increased accidental integration of viral DNA, which in the case of the oncogenic viruses can promote carcinogenesis.
Published in the journal:
. PLoS Pathog 10(5): e32767. doi:10.1371/journal.ppat.1004117
Category:
Research Article
doi:
https://doi.org/10.1371/journal.ppat.1004117
Summary
Papillomavirus cause persistent, but mostly self-limiting, infections of the host epithelium. However, a subset of oncogenic papillomaviruses is the causative agent of certain human cancers. In persistent infection the viral genomes are tethered to host chromosomes to maintain and partition the extrachromosomal viral genomes to daughter cells. However, in cancers viral DNA is often found integrated close to common fragile sites, regions prone to breakage, amplification and deletion. We show that the viral E2 and cellular BRD4 proteins are associated with fragile regions of the human genome and nucleate viral replication foci at these sites. This is a resourceful strategy for a virus that uses the host DNA damage response to amplify viral DNA. However, the outcome may be increased accidental integration of viral DNA, which in the case of the oncogenic viruses can promote carcinogenesis.
Introduction
Papillomaviruses are an ancient group of viruses that establish a persistent infection in the host epithelium. To maintain such a long-term infection, the E2 protein from a subset of papillomaviruses binds to the viral genome and tethers it to the host chromosomes [1]–[3]. The bromodomain protein, BRD4, binds to mitotic chromosomes with E2 [4], [5], is essential for regulation of viral transcription [6]–[9] and is recruited to early viral replication foci [10], [11]. BRD4 is a mitotic chromosome-associated protein [12] that interacts with acetylated histone tails [13] and is a key regulator of the pTEF-b elongation factor [14]. There has been a recent explosion of data as BRD4 has been implicated in regulation of cell cycle, mitotic memory, transcription of MYC and regulation of viral gene expression [15]–[19]. BRD4 is highly enriched at super-enhancers that maintain expression of oncogenes in tumors [20] and is a promising therapeutic target for a number of cancers [21].
Most HPV infections result in benign lesions, but several are oncogenic and the causative agents of human cancer [22]. Almost all cervical cancer is associated with HPV infection, and oncogenic HPVs are responsible for many anal, penile, vaginal and oropharyngeal cancers [23]. The HPV genome is found integrated into the host genome in over 80% cancers and this promotes malignant progression. The integration event is accidental, but the resulting deregulation of expression of the E6 and E7 oncogenes gives cells a selective growth advantage [24]. There is a predilection for integration within the vicinity of fragile sites [25], [26].
Papillomaviruses are adept at hijacking host functions and induce a host DNA damage response (DDR) in nuclear foci, resulting in an influx of repair factors that the virus exploits to amplify its own DNA [11], [27]–[31]. We show that the HPV E2 protein binds with BRD4 to regions that are highly susceptible to replication stress and overlap many common fragile sites. Common fragile sites are hypersensitive to DNA damage and their replication is often incomplete in the G2 phase of the cell cycle [32]. Thus, they represent a vulnerable and very clever target for papillomavirus replication. Furthermore, replication adjacent to fragile sites may explain the high incidence of integration of oncogenic HPV genomes at these loci.
Results
HPV1 E2 binds to broad regions of human mitotic chromatin
Many papillomavirus E2 proteins bind readily to host mitotic chromosomes with the BRD4 protein [9]. To identify the targets of these E2 proteins we analyzed chromatin binding sites of HPV1 E2, a protein that binds BRD4 and host chromosomes with high affinity. In a natural infection E2 levels range from almost undetectable in basal cells to fairly high levels in differentiated cells [33]; thus we were careful to titrate E2 to low, but detectable, levels for the experiments presented (Figure S1A and S1B). Chromatin was prepared from mitotic C-33 cells expressing HPV1 E2 (C-33-1E2), and analyzed by ChIP-chip analysis for binding to a portion of the human genome (chromosomes 3, 4, 5, 18, 19, 20, 21, 22 and X). We have previously shown by ChIP-chip analysis of 5 kb promoter regions that E2 and BRD4 bind to active promoters in interphase C-33 cells [34]. In the present study we used whole genome tiling arrays to study E2 and BRD4 binding. As shown in Figure 1A, in mitosis E2 was observed to bind to a few extremely broad peaks on several chromosomes. These peaks ranged in size from several hundred Kb to >1 Mb and, for the most part, overlapped coding regions. Two detailed examples of the genomic regions covered by the peaks are shown in Figure S1C.

The mitotic E2 binding peaks were further validated by conventional ChIP assays (Figure 1B) with primers selected from eight of the peaks indicated in Figure 1A. E2 binding to these regions was strong in both asynchronous and mitotic cells, showing that it persisted throughout the cell cycle, consistent with the concept that E2 partitions the viral genome by linking it to mitotic chromosomes [1]. The levels of E2 bound to the broad mitotic regions were several-fold higher than those bound to active promoter regions. Furthermore, the levels of E2 bound to promoters dropped to almost background levels in mitotic cells (Figure 1B), consistent with cessation of transcription and displacement of most transcription factors from promoters in mitosis [35].
Since E2 binds to mitotic chromosomes in complex with BRD4 [4], [5], [7] we carried out ChIP assays to determine whether BRD4 bound the same regions of mitotic chromatin. As shown in Figure S1D, S1E, and S1F (and summarized in Figure 1C) BRD4 bound to five sites selected from an E2 positive region from chromosome 5, even in the absence of E2. However, expression of E2 increased BRD4 binding at least two fold, consistent with the stabilization of BRD4 binding by E2 [7]. In contrast HPV31 E2, which does not stabilize binding of BRD4 to chromatin [9], had little effect on the binding of BRD4 to mitotic chromatin (data not shown). Figure S1G shows a comparison of the size of these broad regions compared to promoter binding of BRD4 and E2 that we had detected previously using promoter microarrays. As we show in more detail below, E2 and BRD4 bind together to these exceptionally large regions of mitotic chromatin that likely correspond to the mitotic chromatin tethering target used by papillomaviruses for genome partitioning. Thus, we have named these regions Persistent E2 and BRD4-Broad Local Enrichments of Chromatin, or PEB-BLOCs.
The cellular protein, BRD4 binds to PEB-BLOCs with HPV1 E2
In C-33-1E2 cells, E2 colocalizes with BRD4 in approximately 50 punctate speckles on mitotic chromosomes (data not shown) and so we extended the pilot experiment described above to analyze BRD4 binding in the entire human genome. BRD4 binding was analyzed by ChIP-chip using whole genome arrays and the BRD4 binding profile is shown in Figure 2A (for chromosome 4) and S2 (for the entire genome). Almost all chromosomes showed large peaks similar in size to, and overlapping with, the E2 peaks identified in the subset of chromosomes shown in Figure 1A. A visual inspection showed that approximately 50 broad BRD4 binding regions were detectable on C-33 mitotic chromatin in the entire genome and about 100 regions were detected in the presence of E2 (Figure S2). Therefore, BRD4 binds to some PEB-BLOCs in the absence of E2, but E2 enhances the BRD4 binding signal. In contrast, BRD4 is only detected on mitotic chromosomes by immunofluorescence in the presence of E2 [7]. This likely reflects differences in sensitivity between the techniques. We have shown previously that the dimerization property of E2 increases the ability of E2-BRD4 complexes to bind mitotic chromosomes, most likely by promoting the formation of higher order complexes [36]. The genomic localization and characteristics of 53 of the strongest PEB-BLOCs identified by visual inspection are listed in Table S1.

We computationally defined and identified the enriched binding regions for E2 and BRD4 (shown in red in Figure 2A and S2). The best algorithm was able to identify all of the visually identified binding peaks, with the exception of one on chromosome 20 (Chr20-P3 in Table S1). Using this algorithm, the overlap between E2 and BRD4 binding regions was calculated, as defined in Methods. Figure 2B shows the overlap among the three binding profiles for chromosomes 3, 4, 5, 20, 21, 22 and X (only a subset of chromosomes was analyzed for binding in these experiments). There was a complete overlap between the BRD4 binding regions in control and E2 expressing cells and >50% overlap with the E2 binding enriched regions and BRD4 binding regions. The overlap with the E2 binding enriched regions is underestimated because of the different resolution of the microarray chips used for the E2 and BRD4 binding studies. However, as can be seen visually in Figure 2A, there is a substantial overlap in the major binding peaks. Figure 2C shows the overlap of computationally defined BRD4 enriched regions, in the presence and absence of E2 expression, for all human chromosomes. Therefore, many PEB-BLOCs exist even without E2 expression and E2 stabilizes and increases Brd4 binding to a subset of PEB-BLOCs. Presumably, different stages of the viral life cycle the levels of E2 would determine which PEB-BLOCs were highly occupied by E2 and BRD4.
BRD4, and its ability to bind acetylated chromatin, is essential for persistent HPV1 E2 binding
Two residues in the transactivation domain of E2 (R37 and I73) are essential for interaction with BRD4 [5], [37]. Therefore, we analyzed binding of an E2 R37A/I73A mutated protein to PEB-BLOCs by ChIP. Wild-type E2 and R37A/I73A E2 were expressed at equivalent levels and had no effect on the levels of BRD4 (data not shown). Both wild-type E2 and BRD4 bound strongly to PEB-BLOC regions in asynchronous cells (Figure 3A) and while BRD4 bound to most PEB-BLOCs in the absence of E2, binding was about two fold higher in the presence of E2. However, E2 R37A/I73A was minimally recruited onto and did not augment BRD4 binding to PEB-BLOCs. While BRD4 and E2 colocalize as distinct speckles on mitotic chromosomes, in cells expressing the R37A/I73A protein, neither E2 nor BRD4 was detected on chromosomes (Figure 3B). Therefore the interaction with BRD4 is essential for E2 binding to PEB-BLOCs, but in turn E2 stabilizes the binding of BRD4 to these regions.

To confirm the requirement for BRD4 in E2 binding to mitotic PEB-BLOCs, BRD4 gene expression was downregulated with siRNA. In the absence of BRD4, E2 no longer bound to mitotic chromosomes (Figure 3C) or colocalized in speckles with BRD4 in the nucleus of interphase cells (data not shown). Small molecule inhibitors such as GSK525762A+ interfere with binding of the specific bromodomains of the family of BET proteins (bromodomain plus extraterminal domain) to their acetylated target [38]. In cells treated with GSK525762A+, neither E2, nor BRD4, could be detected bound to PEB-BLOC regions by ChIP (Figure 3D). Likewise, E2 and BRD4 speckles were no longer observed in the nuclei of interphase cells (Figure 3E) or on mitotic chromosomes (data not shown) after GSK525762A+ treatment. Therefore, E2 binding to PEB-BLOC regions is dependent on BRD4 and its interaction with acetylated histones.
PEB-BLOCs have a distinctive pattern of histone modification
To further investigate the nature of PEB-BLOCs, histone modifications were analyzed by ChIP (Figures 4A and S3) using the primers listed in Table S9. PEB-BLOCs were highly acetylated at positions K9, K14, K18, K23, K27, K56, K9/14, and K9/18 in histone H3 and K5, K8, K12, and K5/8/12/16 in histone H4. E2-BRD4 bound promoter regions showed higher acetylation levels than E2-negative regions, but the acetylation status of PEB-BLOCs was consistently several-fold higher than in active promoter regions, which are already acetylation-rich. Therefore, PEB-BLOCs are highly acetylated at many positions, consistent with the ability of BET inhibitors to abolish E2 and BRD4 binding. Histone methylation, especially of H3K4, is also associated with active chromatin [39]. PEB-BLOCs have consistently high H3K4me1 and H3K4me2, but low H3K4me3. Conversely, promoter regions had high H3K4me2 and H3K4me3, but low H3K4me1 (Figure 4A).

To validate these findings, we performed ChIP-chip analysis for binding of E2, BRD4, H4K8ac, and H3K4me1 on a subset of the genome (chromosome 4 and part of chromosome 3). Each PEB-BLOC overlapped with prominent peaks of H4K8ac and H3K4me1 modification (Figure 4B and 4C). Therefore, PEB-BLOCs contain highly acetylated histones and high levels of H3K4me1, a pattern similar to that described for enhancers [39]. Notably, as shown in Figure 4C, between 65% and 71% of H4K8ac and BRD4 broad enriched regions overlapped and the E2 bound regions were contained completely within this overlap. All E2 bound peaks also completely overlapped with enriched regions of H3K4me1.
To confirm these findings, mitotic and interphase C-33-1E2 cells were analyzed for global histone modification patterns by immunofluorescence (Figure S4 and data not shown). E2-BRD4 speckles colocalized with acH4K8 and acH3K56 on mitotic chromosomes, and were also highly enriched in H3K4me1 and H3K4me2, but not H3K4me3. The E2-BRD4 speckles observed in interphase nuclei also showed an enrichment of acH4K8, acH3K56, H3K4me1 and H3K4me2.
CREBBP/EP300 HAT activity is responsible for histone acetylation of PEB-BLOCs
To ascertain the histone acetyl transferase (HAT) responsible for acetylation of PEB-BLOCs, we downregulated expression of EP300, CREBBP and KAT5 by siRNA treatment. In control cells, BRD4 speckles colocalized with H4K8ac, CREBBP and EP300. However, siRNA downregulation of CREBBP or EP300 resulted in a great reduction in the appearance of BRD4 speckles as well as the focal regions of histone acetylation in the nucleus (Figure 4D). In contrast, KAT5 only partially colocalized with BRD4 speckles and downregulation of KAT5 had no effect on the acetylation or localization of BRD4 to PEB-BLOCs. Therefore, CREBBP and EP300 are both recruited to PEB-BLOCs where they acetylate histones, thus providing binding sites for E2 and BRD4. Notably, E2 proteins interact with CREBBP/EP300 [40] and this could enhance the formation and development of PEB-BLOCs in a natural infection. However, in C-33 cells these regions are already genetically unstable and highly acetylated, and acetylation is not obviously increased by E2. Regions of chromatin that are methylated on H3K4 show highly dynamic acetylation mediated by CREBBP/EP300, while H3K4 methylation remains more stable [41]. This is consistent with the histone modifications of PEB-BLOCs and the requirement for CREBBP/EP300.
Individual alleles of many PEB-BLOCs show differential BRD4 binding and asynchronous DNA replication
To verify that BRD4 nuclear speckles correspond to the regions identified by ChIP-chip, we performed combined IF-FISH with a BRD4 antibody and FISH probes for PEB-BLOCs. In many cases, the BRD4 speckles colocalized with only one of the two PEB-BLOC FISH signals (Figure S5). BRD4 speckles were often observed as doublets on one chromosome, which in mitotic cells colocalized with a similar doublet of FISH signal (Figure 5A and 5B). In contrast, the second PEB-BLOC allele was detected as a condensed FISH signal that didn't colocalize with BRD4, indicating that BRD4 binds to PEB-BLOCs on one allele on mitotic chromosome.

Analysis of the PEB-BLOC FISH signals in interphase cells revealed that the two alleles often replicated at different times. When this occurred, the early replicating allele was observed as a doublet FISH signal, while the late replicating allele was a single FISH signal. When these exist in the same nuclei due to asynchronous replication they are termed SD (singlet-doublet) FISH signals (Figure 5C). We calculated the rate of asynchronous DNA replication for loci corresponding to PEB-BLOCs and non-PEB-BLOCs by counting the number of SD FISH signals in individual nuclei (Figure 5C). Non-PEB-BLOC regions, displayed an SD pattern in ∼12% S-phase cells, as previously reported [42]. In contrast, the SD pattern was present in ∼30% PEB-BLOCS. There was no difference in the percentage of SD signals in control C-33 or C-33-1E2 cells, showing that this is an inherent property of the cells and not due to E2 expression. Notably, asynchronous replication is also a property of common fragile sites [43].
Most PEB-BLOCs are actively transcribed and often contain very large genes
PEB-BLOCs span large chromosomal regions, which mostly contain annotated genes (Table S1). To determine whether these genes were transcriptionally active, RNA was prepared from control C-33 and C-33-1E2 cells and analyzed by microarray gene expression analysis (data not shown). This showed that most genes located in the PEB-BLOCs were transcribed at low to moderate levels. To determine whether there was additional transcription (perhaps non-mRNA) from apparently non-coding regions, we conducted RNA seq analysis (available at GEO: GSE52367). This confirmed that most PEB-BLOC genes were transcriptionally active, and also identified ten long (>0.2 Mb), previously un-annotated, genes in these regions. These novel genes are shown, along with RNA seq signals for 53 of the strongest PEB-BLOCs in Table S1.
About 35 cellular genes were differentially regulated by E2 expression in both microarray and RNA seq analysis. However, these genes were not associated with PEB-BLOCs and have no obvious connection to E2 function.
There has been reported to be a strong correlation between transcription of very long genes and the expression of fragile sites resulting from a conflict in transcriptional and replication machineries [32]. To date, there are 56 annotated human genes that are >1 Mb and another 219 that are between 0.5–1 Mb long. In the 53 strong PEB-BLOC loci listed in Table S1, there are ten known genes >1 Mb and 19 genes >500 kb. Therefore, there is a vast enrichment of long genes in the PEB-BLOC regions. This calculation does not include the transcriptionally active long segments in PEB-BLOCs that contain unknown genes. Figure 5D shows the size range of genes that overlap PEB-BLOCs.
PEB-BLOCs are associated with common fragile sites
Many of the properties described above for PEB-BLOCs are also attributes of common fragile sites. These sites are genetically unstable (reviewed in [44]) and are common sites of viral genome integration [25]. Like PEB-BLOCs, common fragile sites often replicate asynchronously, have monoallelic expression and contain large genes [32]. Fragility can arise because of a conflict between transcription and replication of very long genes as a paucity of replication initiation sites can result in failure to complete replication before mitosis [45]. We compared the location of PEB-BLOCs with mapped common fragile sites in the human genome (retrieved from HUGO, www.genenames.org) and found that a subset of visually identified strong PEB-BLOCs (22 out of 53) contain 25 known fragile sites in the same chromosomal band (Table S1).
However, most common fragile sites have been mapped cytogenetically and span large portions of the human genome, making it difficult to statistically correlate with the enriched binding regions. Furthermore, common fragile sites are cell type specific [46] and the majority have been mapped in lymphocytes. To further examine the association of PEB-BLOCs with common fragile sites we mapped aphidicolin-inducible fragile sites in C-33 cells. C-33 cells were treated with aphidicolin to cause mild replication stress and the resulting fragile sites were identified using a novel ChIP-chip method with an antibody to FANCD2, which is involved in replisome surveillance and binds fragile sites [47]–[49]. Approximately 100 strong FANCD2 binding regions were visually identified and are shown aligned with the BRD4 binding profile in Figure S7. Large, enriched FANCD2 binding regions were further defined by computational analysis and are shown as red blocks under the signal map (Figure S7). Figure 6A shows the alignment of PEB-BLOCs, FANCD2 binding sites and known common fragile sites for chromosome 4 and detailed alignments can be found for all strong PEB-BLOCs in Table S1. It is clear that many PEB-BLOCs and FANCD2 binding peaks overlap precisely, others are slightly offset, and some prominent peaks do not overlap. As shown in Figure 6B, a significant subset of FANCD2 enriched binding regions (∼30%) and PEB-BLOCs (∼36%) overlap (P<0.002). Therefore, there is a strong association between PEB-BLOCs and sites of genomic instability. An absolute distance analysis showed that ∼27% PEB-BLOCs and ∼30% FANCD2 enriched binding sites are within 2 Mb of a known common fragile site (Figure S8).

The association between PEB-BLOCs, FANCD2 binding sites and common fragile sites was further examined in three subsets of fragile sites that are most closely related to our biological system. As shown in Table 1 (with details in Table S6) these consisted of: aphidicolin induced fragile sites recently mapped in epithelial cells [50]; fragile sites that have been cloned and therefore are of much higher resolution [51]; and fragile sites that have been mapped in cervical cancer cells [25]. This showed that there was a significant association between these fragile sites and the FANCD2 regions and a near-significant association between these fragile sites and the enriched PEB-BLOC regions.

PEB-BLOCs show signs of genomic instability
We noted evidence of deletion in several PEB-BLOCs as there was an abrupt loss of BRD4 signal in certain regions of the BRD4 ChIP-chip binding profiles. We found eight loci showing obvious loss of ChIP signals in PEB-BLOCs and/or FANCD2 binding regions (Figures 6C and S6). Five of these regions are located in the same chromosome bands as known fragile sites, four are in PEB-BLOCs and the others are in non-PEB-BLOC FANCD2 binding regions. To verify these deletions, we performed FISH using two adjacent FISH probes. One probe (245M5) was targeted to the putatively deleted region and the other (451M10) was derived from an adjacent, undeleted BRD4 binding region of the PEB-BLOC. As predicted, the 245M5 probe gave rise to only one FISH signal per cell due to the deletion of this locus on one chromosome (Figure 6C). In contrast, the 451M10 probe showed two clear FISH signals, demonstrating that both chromosomal loci were intact. Because there was an abrupt and complete loss of BRD4 signal in these deleted regions (despite the intact locus on the other chromosome) we can conclude that only the BRD4 bound allele sustained the deletion. Thus, PEB-BLOCs sustain frequent deletions.
This finding is supported by our previous observation that BRD4 is often bound to only one allele of PEB-BLOCs (Figure 5A and 5B). Analysis of the RNAseq signal in these regions confirms that there are no detectable transcripts from the missing exons, reinforcing the hypothesis that the deletion is present in the transcribed allele (Figure 6D). Four of the eight regions shown in Figure S6 also show transcription spanning a deleted allele, supporting this conclusion. Therefore, PEB-BLOCs frequently contain deletions in the transcriptionally active allele.
Alpha-HPV E1/E2 replication proteins bind to PEB-BLOCs in C-33 cells
The experiments described above used the E2 protein from HPV1, a virus that causes benign papillomas. The HPV1 E2 protein binds BRD4 with high affinity, but E2 proteins from the Alpha genus have a relatively low affinity for BRD4 and host mitotic chromosomes [9]. Nevertheless, when expressed together with the E1 replication protein both alpha-PV E1 and E2 proteins colocalize in nuclear foci that recruit markers of a DNA damage response (DDR) and recruit BRD4 [11], [29]. Because of the links among E2, BRD4, DDR, replication stress and fragile sites, we questioned whether these nuclear viral replication foci formed at PEB-BLOCs/fragile sites. HPV16 E1 and E2 proteins were transiently expressed in C-33 cells and chromatin was extracted for ChIP-chip analysis. Regions of E1–E2 binding were isolated with an antibody directed against an epitope tag on E1. The resulting E1 binding profile was very similar to that of BRD4 (in the presence of HPV1 E2) and thus to PEB-BLOCS (Figure 7A, 7B and S7). Computation of the E1 enriched regions showed a significant overlap (p<0.002) among the PEB-BLOCs, HPV16 E1 (in the presence of HPV16 E2) and FANCD2 (aphidicolin treated cells) (Figure 7C and Table S5). Therefore, PEB-BLOCs are also targets for alpha-HPV E1/E2 protein complexes and therefore there is a strong link among PEB-BLOCs, fragile sites and viral DNA replication proteins. Highly notable is the fact that HPV genomes are very often integrated close to fragile sites in HPV-associated cancers [25].

PEB-BLOCs are associated with HPV integration sites
It has been noted for many years that HPVs (and other oncogenic viruses) are often found integrated close to common fragile sites [25], [26], [52]. However, most of the HPV integration sites have been mapped at low resolution, similar to the cytogenetically mapped common fragile sites. To allow for a more detailed analysis, we collated the precise HPV integration sites from several studies [53]–[55] as well as those listed in the DrVIS database [56] (Table S7). The overlap between these sites and the BRD4 and FANCD2 enriched regions is highly significant, as shown in Figure 7D and Table 2. The human genome contains a number of hotspots for HPV integration. For example, chromosomes regions 8q24.21 (the MYC locus) and 13q22.1 contain many HPV integration sites [57]; notably these two regions overlap PEB-BLOCs. A recent high resolution study of HPV integration sites in cervical and head and neck cancers demonstrated focal genomic instability; cellular DNA flanking the viral integration site contained amplifications, rearrangements and translocations and concatameric viral DNA was often interspersed with host sequences [58]. Thus, genomic instability continues after the initial integration event.

Papillomavirus replication factories are associated with PEB-BLOCs
Since HPV16 E1 and E2 replication proteins associate with PEB-BLOCs, these are likely sites of viral replication. To verify this we studied the association of HPV genomes with PEB-BLOCs: HPV1, HPV16 and HPV18 genomes were transfected into C-33 cells and the association of viral DNA with specific regions of host chromatin was analyzed by FISH. Transfected viral DNA often gave rise to a single nuclear signal that was closely associated with different PEB-BLOC regions more frequently than control regions (Figure S9).
To further explore this association, we isolated C-33 cells containing replicating HPV16 genomes and analyzed the association between the resulting replication foci, PEB-BLOCs and control regions (Figure 8A). Five of the six PEB-BLOCs tested associated with HPV16 replication centers in ∼9% cells while control regions were associated with replication foci in ∼2% cells (Figure 8B). Of importance, the PEB-BLOC allele associated with the replication factory in Figure 8A appears to be late replicating (two, still tightly linked, FISH signals) compared to the “double-dot” pattern observed in the other allele. However, it was difficult to quantitate this observation as the PEB-BLOC signal adjacent to the replication factory was often disrupted and sometimes dispersed throughout the viral DNA. This made it difficult to determine whether it was a singlet or doublet.
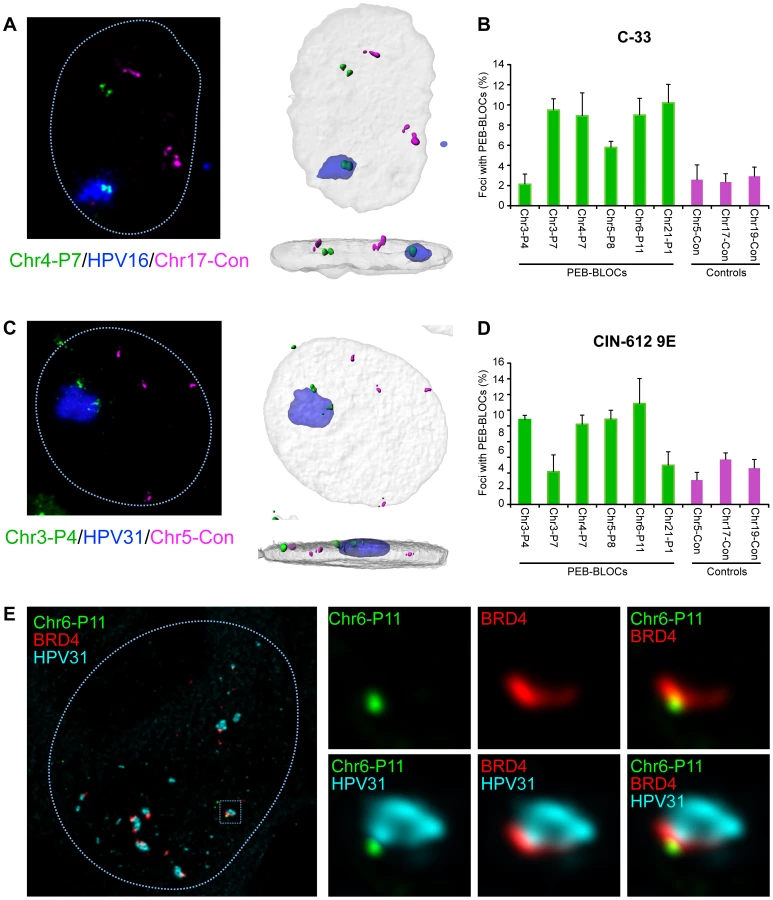
When one considers that we are only measuring the interaction of replication factories with one PEB-BLOC at a time (and only a few PEB-BLOCs are likely to be associated with replication foci in any single cell), the observed association is noteworthy. Also of note, some PEB-BLOCs are only associated with HPV replication foci in certain cell lines; for example, Chr3-P4 does not show increased association in C-33 cells, but does in 9E cells (Figure 8). It is possible that the virus replication foci form only at the PEB-BLOC regions with highest affinity for E2 and BRD4.
We carried out a similar analysis in CIN-612 9E cells, which contain large numbers of HPV31 genomes. Large and small viral replication foci can be generated in these cells by differentiation with calcium [27]. Four out of six PEB-BLOCs tested were closely associated with HPV31 replication foci in ∼12% cells, compared to a ∼4% association with control regions (Figure 8C and 8D). In a parallel study, we find that these large foci are frequently ringed with small BRD4 foci [11] that presumably represent additional PEB-BLOCs. In conclusion, replicating HPV genomes are commonly associated with PEB-BLOCs. Figure 8E shows an example of a small replication focus in CIN-612 9E cells stained by immunofluorescence for BRD4, and by FISH for HPV31 DNA and a single PEB-BLOC. As shown, it appears that the replication foci “grow” from the PEB-BLOC foci and BRD4 is localized at the interface between viral and host DNA.
Discussion
We show that HPV1 E2, and the HPV16 E1/E2 protein complex, bind with BRD4 to common fragile sites in the human genome. Like other persistent viruses that form long-term associations with their host, HPVs are masters at hijacking cellular processes. The E2 proteins interact with BRD4 to regulate viral transcription, and associate with host chromatin to partition the viral genome in dividing cells. We demonstrate that this association is not random, and that the virus has taken advantage of very susceptible regions of the host genome that are prone to replication stress. Both oncogenic and non-oncogenic papillomaviruses induce a DDR and both probably replicate adjacent to these susceptible regions. Most likely, both oncogenic and non-oncogenic HPV types have the propensity to become integrated into unstable regions of the genome on rare occasions. However, only oncogenic HPVs could give the cells a selective growth advantage, in turn further increasing genetic instability, and eventually leading to carcinogenic progression.
The precise role of the BRD4 protein in the HPV lifecycle remains somewhat elusive [19]. BRD4 binds to all PV E2 proteins and regulates viral transcription in an E2-dependent manner. The E2 proteins of viruses such as BPV1 (and HPV1) bind BRD4 with high affinity and link the viral genome to mitotic chromosomes in complex with BRD4, most likely to mediate genome partitioning [4], [59]. However, alpha-PVs (such as HPV16 and HPV31 studied here) bind to BRD4 and chromatin with lower affinity and the role of the E2-BRD4 interaction in replication is enigmatic [10], [11]. In fact, HPV31 genomes encoding an E2 protein that is unable to bind BRD4 in vitro, can replicate persistently, and induce late viral functions, in keratinocytes [60], [61]. One explanation for these findings is that the interaction of E2 and BRD4 is important to establish an efficient infection when limiting amounts of genome are delivered to the nucleus by a viral particle rather than by DNA transfection. Also, the nucleation of viral replication factories at regions of the nucleus highly susceptible to replication stress could be important, but not absolutely required, for efficient viral replication in a natural infection.
While the HPV replication proteins are sufficient to induce a DDR, the viral oncogenes can contribute. E7 induces a DDR by associating with ATM [27] and induces oncogenic replication stress by pushing cells into continual, unscheduled division [62]. This could increase replication stress at fragile sites and potentiate the association with the E2-BRD4-genome complex. Our experiments were carried out in C-33 cancer derived cells and we believe that PEB-BLOCs are very prominent in these cells because they are already very genetically unstable. Thus, under these circumstances E2 and BRD4 bind with high affinity to pre-existing fragile sites without the need for other viral factors to promote replication stress. Normal cells do not show much FANCD2 binding and fragile sites must be induced by replication stress such as that induced by low levels of aphidicolin. In a natural HPV infection, this replication stress could be induced by the viral E7 protein [62].
Common fragile sites are often caused by a paucity of replication origins and/or collisions of transcription and replication machinery in very long genes [32], [63]. Often, fragile sites remain incompletely replicated as cells progress into mitosis. Papillomaviruses amplify their DNA in differentiated cells that are in G2 [64], [65]; hijacking the DDR at this time allows the virus to replicate outside S-phase and without competition from host DNA synthesis. By associating with fragile sites that undergo replication stress at this stage, the virus has to do little but be “in the right place, at the right time”, simply amplifying the DDR response to generate a replication factory. Notably, almost 25 years ago when the correlation between viral integration and fragile sites was first recognized Popescu and DiPaolo predicted that “It is conceivable that because of their replication pattern at a certain point in the cell cycle fragile sites may be the only replicating regions available for the integration of viral DNA” [26].
The role of BRD4 in binding to fragile sites has not been completely defined. Previously, chromatin in fragile sites was reported to be hypoacetylated [66], however, we find that the PEB-BLOC regions are highly acetylated and have an “enhancer-like” chromatin signature. It has recently been shown that BRD4 is enriched at super-enhancers that regulate key cell identity genes and tumor drivers [20], [67]. However, despite a common chromatin signature (high H3K4me1 and H3K27ac), PEB-BLOCs are much larger in size than super-enhancers and we do not detect a significant overlap in these elements. Since fragile sites are approaching mitosis with unreplicated regions of DNA, there needs to be a mechanism to keep the chromatin open and accessible to finish replication or repair and to resist the chromosome condensation required for mitosis. BRD4 might maintain an accessible chromatin environment conducive to the processes of DNA damage sensing and repair.
Notably, while BRD4 can preserve chromatin acetylation, decompact chromatin and modulate higher-order chromatin structure [68], a short isoform of BRD4 actually limits the DDR by compacting chromatin to insulate it from ATM signaling [69]. The image shown in Figure 8E is very compatible with the idea that BRD4 is protecting host chromatin from a full-blown viral-mediated DDR. If BRD4 assists in the repair of fragile sites in genetically unstable cells, inactivation of this function could result in a rapid accumulation of catastrophic DNA damage. Normal, genetically stable cells would not depend on this function, and this could help explain the sensitivity of cancer cells to BET inhibitors.
In conclusion, show that the viral E2 and cellular BRD4 proteins associate with fragile regions of the human genome and nucleate replication foci at these sites. This is a resourceful strategy for a virus that uses the host DNA damage response to amplify viral DNA. However, the consequence could be increased accidental integration of viral DNA, which in the case of oncogenic viruses can promote carcinogenesis.
Materials and Methods
Plasmids
The pMEP4 expression vectors for FLAG-tagged E2 have previously been described [70]. E2 proteins containing alanine substitutions in residues R37 and I73 were described previously [9]. Standard mutagenesis procedures were used to substitute HPV1 E2 residues R37 and I73 with alanines in pTZ18U-FLAG HPV1 E2. FLAG-HPV1 E2 (R37A/I73A) was subcloned into the Asp718 and blunted NheI sites of pMEP4. The FLAG-HA tag was introduced into the HindIII and blunted NotI sites of pMEP4 to generate the control plasmid, pMEP-fh. Plasmids expressing HPV16 E1 and E2 proteins have been described previously [29]. RPCI-11 BAC clones were purchased from Empire genomics (Table S10). HPV1, HPV16, HPV18 and HPV31 genomes have been described previously [24], [71]–[73] and sequences can be found at http://pave.niaid.nih.gov [74].
Antibodies
All antibodies are described in Table S8.
BET Inhibitors
GSK525762+ or the inactive enantiomer GSK525762− were synthesized as described previously [11], following the methods described [38].
Cells
C-33 cells [75] were cultured in DMEM, 10% FBS, 100 U/ml penicillin, and 100 µg/ml streptomycin. The HPV31 positive cell line, CIN-612 9E cells [76] were obtained from Lou Laimins (Northwestern University, Chicago, Illinois, USA) and was grown on irradiated 3T3-J2 feeder cells in F medium (3∶1 [v/v] F-12 [Ham]-DMEM, 5% FBS, 0.4 µg/ml hydrocortisone, 5 µg/ml insulin, 8.4 ng/ml cholera toxin, 10 ng/ml EGF, 24 µg/ml adenine, 100 U/ml penicillin, and 100 µg/ml streptomycin).
Establishment of E2 expressing cells and transient expression of HPV16 E1 and E2
Inducible E2 expressing cell lines were generated in an HPV-negative cervical carcinoma derived cell line, C-33 by transfecting with the pMEP4-E2 expression plasmids, using Fugene (Roche). Cells containing the pMEP episomal plasmids were selected with 80 µg/ml of hygromycin B (Roche). Drug-resistant colonies were pooled after 2 weeks. E2 protein expression was induced with CdSO4 for 4 h before harvest and the levels of E2 proteins were titrated and adjusted by differential CdSO4 concentration to ensure that binding to the identified chromatin regions increased in an E2-dependent and specific fashion. For transient HPV16 E1/E2 expression, C-33 cells were cotransfected with pMEP9/EE-HPV16 E1 and pMEP4/FLAG-HPV16 E2. E2 expression was induced with 3 µM CdSO4 induction for 4 h before harvest at 24 h post-transfection.
Differentiation of CIN-612 9E cells with calcium
CIN-612 9E cells were differentiated with calcium, essentially as described previously [27]. Feeders and CIN-612 9E cells were seeded as described above. When 90% confluent, the medium was changed to Lonza Growth medium (KBM plus supplement media). Twenty four h later, the medium was changed to Differentiation medium (Lonza KBM/1.5 mM CaCl2/no supplements). Cells were cultured for the times indicted before harvest or fixation.
Induction of common fragile sites
C-33 cells were treated with 0.2 µM aphidicolin for 24 h before harvesting for ChIP-chip experiments described in other sections.
Chromatin immunoprecipitation-chip
ChIP experiments were performed as previously described [34]. For mitotic cells, C-33 cells were blocked by 2 mM thymidine overnight and released into medium without thymidine for 9 h. Four hours before harvesting, E2 expression was induced with 3 µM CdSO4 and mitotic cells were collected by mitotic shake off at which point cells were fixed in formaldehyde. For conventional ChIP assay, 0.5 mg of chromatin prepared from asynchronous or mitotic cells was incubated overnight with a specific antibody and collected with Dynabeads conjugated to Protein G (Invitrogen). For ChIP-chip analysis, 2 mg of chromatin was incubated overnight with a specific antibody prebound to Dynabeads conjugated to Protein G. Further processing for ChIP-chip was as described by Jang et al. [34]. DNA isolated from immunoprecipitated chromatin was amplified using the whole genome amplification system (WGA, Sigma). Two HG18 build whole genome arrays were used. C-33-1E2 amplified DNA was labeled and hybridized to the 385K Whole-Genome Tiling Array or the 2.1M Whole-Genome Tiling Array by NimbleGen. E2 binding signals on the arrays for ChIP DNA were normalized to the input signals for total DNA. The ratios were plotted against genomic position to identify regions where increased signal is observed relative to the control sample. All datasets are available at GEO: GSE52312.
Real-time quantitative PCR
Real-time Q-PCR was performed using the ABI Prism 7900HT Sequence Detector (Applied Biosystems) and SYBR Green PCR master mix (Applied Biosystems). An aliquot of ChIP DNA was analyzed with 12.5 µl of SYBR Green PCR master mix and 0.3 µM each oligonucleotide primer in total volume of 25 µl. In each run, a four-fold dilution series of pooled input chromatin DNA was used to generate a standard curve of threshold cycle (Ct) versus log of quantity. PCR was performed at 95°C for 15 min, followed by 40 cycles of denaturation at 95°C for 10 sec and annealing and extension at 60°C for 60 sec. The specificity of each primer pair was determined by dissociation curve analysis. The data were analyzed with SDS 2.1 software (Applied Biosystems). The primers used are listed in Table S9.
Indirect immunofluorescence
Cells were arrested in G1/S phase by culture in 2 mM thymidine overnight, washed to release, and grown for 9 h in the absence of thymidine to select for cells in mitosis. The metallothioneine promoter was induced by the addition of 3 µM CdSO4 for 4 h. Cells were fixed at room temperature in 4% paraformaldehyde (PFA) in PBS for 20 minutes, blocked and stained with mouse monoclonal anti-FLAG M2 antibody and FITC or Alexa 488 anti-mouse antibody; various primary rabbit antibodies and Texas Red or Alexa 596 anti-rabbit antibody. Cellular DNA was stained with DAPI. Images were collected using a Leica TCS-SP5 laser scanning confocal imaging system.
Downregulation of BRD4 expression by siRNA treatment
Cells were seeded at a density of 1×10⁶ cells per 10 cm dish, incubated for 24 h, and transfected with 750 ng of siRNA (Table S11) using 40 µl of HiPerFect (Qiagen). Cells were incubated for three days at which point E2 expression was induced by 3 µM CdSO4 for 4 h. The efficiency of BRD4 downregulation was verified by immunoblot analysis using specific antibodies for the target proteins. siRNA treated cells were fixed for immunofluorescence using specific antibodies, as described above.
Fluorescence in situ hybridization (FISH)
Cells were cultured on coverslips or glass slides. 9E cells were differentiated for 5 days in the KBM media with 1.5 mM CaCl2. The cells were fixed three times with cold methanol∶acetic acid (3∶1) for 15 mins. For chromosome spreads, C-33 cells were prepared as described for indirect immunofluorescence, treated with 0.1 mg/ml of Colcemid Karyomax (Invitrogen) for 90 mins, and collected by mitotic shake-off. Cells were resuspended in 10 ml of hypotonic buffer (0.075 M KCl) and incubated at 37°C for 20 mins. After pelleting, the cells were resuspended and fixed three times in 10 ml of cold methanol∶acetic acid (3∶1) for 15 mins. The fixed cells were resuspended in 0.5 ml methanol∶acetic acid, applied onto glass slide by dropping, and dried for O/N. The cells were treated with RNace-it cocktail for 1 h, dehydrated with 70%, 85%, and 100% ethanol, and dried for several hours. For combined immunofluorescence-FISH analysis, mitotic cells were collected as described above and treated with H1 buffer (10 mM Tris, pH 7.4, 10 mM NaCl, 5 mM MgCl2) for 15 mins and H2 buffer (0.25× PBS) for 15 mins. Cells were centrifuged at spun at 1500 rpm for 10 mins in a Cytocentrifuge 7620 (Wescor) and fixed at room temperature in 4% PFA/PBS for 20 minutes. After immunofluorescent detection as described above, cells were treated with methanol∶acetic acid (3∶1) for 10 min, 2% paraformaldehyde for 1 min, before dehydration through a series of 70%, 90%, and 100% ethanol.
FISH probes were prepared using ULysis nucleic acid labeling kit (Molecular Probes), purified through Illustra ProbeQuant G-50 micro column (GE Healthcare), and resuspended in TE containing 0.3 µg/µl of Cot-1 DNA. For hybridization, 2 µl 5-fluorescein-labeled BAC probe (Empire Genomics) or 50 ng ULysis FISH probe was mixed with 8 µl FISH hybridization buffer (Empire Genomics), applied to the slide, covered with coverslip, and sealed with rubber cement. The cells and probes were denatured at 75°C for 5 minutes and incubated overnight at 42°C. Cells were washed in 1× phosphate-buffered detergent (Qbiogene) for 5 min at room temperature, 1× wash buffer (0.5× SSC, 0.1% SDS) for 5 min at 65°C, and 1× phosphate-buffered detergent (Qbiogene) for 5 min at room temperature. Cellular DNA was stained with DAPI. Images were collected using a Leica TCS-SP5 laser scanning confocal imaging system. Images were processed using Leica AS Lite software, or Bitplane Imaris software (Zurich, Switzerland) or deconvolved with Huygens Essential software (Scientific Volume Imaging B.V., VB Hilversum, Netherlands), where indicated.
RNA-seq
C-33 cells were seeded at a density of 1×10⁶ cells per 10 cm dishes and grown for 2 days. E2 expression was induced by the addition of 3 µM CdSO4 for 4 h. Total RNA was purified using RNeasy (Qiagen), and analyzed for integrity using the Agilent RNA 6000 nano kit on 2100 Bioanalyzer (Agilent). Both polyadenylated and non-polyadenylated (after rDNA subtraction) RNA was sequenced. Two different libraries were constructed for each sample. For one library, total RNA was purified by poly A selection following manufacturer's instructions. For the second library, 1.5 µg total RNA was rRNA depleted using Ribo-Zero (Epicentre, Madison, WI), followed by library generation using the Illumina TruSeq RNA protocol, beginning at the fragmentation step. Libraries were sequenced on an Illumina GAIIx. The adapters were trimmed from raw sequences and low quality reads were filtered out. Processed reads were mapped to human genome assembly hg19 using Tophat and differentially expressed gene analysis was performed using Cufflinks [77]. Data was visualized using the Integrative Genomics Viewer (Broad Institute). The dataset can be accessed at GEO: GSE52367.
Introduction and detection of recircularized papillomavirus genomes in C-33 cells
HPV genomes were removed from the plasmid vector by restriction digestion and religated as described [78]. C-33 cells expressing either HPV1, HPV16, or HPV18 E2 proteins were transfected using FuGene 6 with the corresponding recircularized HPV genome and incubated for 24 h. E2 expression was induced with 3 µM CdSO4 for 4 h and the cells were prepared for FISH experiments as described above. PEB-BLOCs were detected using 5-fluorescein or Alexa 488 labeled probes, produced from BAC clones by Empire Genomics (Table S10), and the HPV genomes were detected using HPV DNA, purified from vector sequences by PCR amplification and labeled by an Alexa 594 ULysis labeling kit (Molecular Probes).
Bioinformatics and statistics
Identification of ChiP-enriched regions
NimbleGen ChIP-chip microarray raw data files were processed with the R/Bioconductor package Ringo [79], [80]. The probe intensity was calculated as the log2 ratio of cy5/cy3. Tukey's biweight normalization was performed to correct systematic dye and labeling biases and probe intensity was smoothed using a 1000 bp width to reduce systematic and stochastic noise along chromosomes. The smoothed intensity was fitted by a mixture model to determine the enrichment threshold. ChIP-enriched regions were defined as regions having at least 10 probes whose smoothed intensity was larger than the enriched threshold, and the distance between these probes was less than 5000 bp. If the distance between two identified enriched regions was less than 50 kbp, these two regions were further combined into a larger enriched region. Enriched regions of less than 50 kbp were also filtered out from further analysis.
Identification of overlapped regions
If two genomic regions Ri and Rj satisfy the following formula, length (Ri ∩ Rj)≥0.5 * min(length(Ri), length(Rj)), they were defined as overlapped.
Chi-squared contingency table test
A chi-squared contingency table test was performed to compare two genomic regions based on the two by two table shown in Table 3, where A represents the number of overlapped regions between E1 and E2; B represents the number of overlapped regions between E1 and NE2; C represents the number of overlapped regions between NE1 and E2; and D represents the number of overlapped regions between NE1 and NE2.

Absolute distance test
Absolute distance test was performed to determine whether the nearest distance between ChiP-enriched regions and reference regions are closer than the nearest distance between randomly distributed regions and reference regions using software package GenometriCorr [81].
Supporting Information
Zdroje
1. SkiadopoulosMH, McBrideAA (1998) Bovine papillomavirus type 1 genomes and the E2 transactivator protein are closely associated with mitotic chromatin. J Virol 72 : 2079–2088.
2. IlvesI, KiviS, UstavM (1999) Long-term episomal maintenance of bovine papillomavirus type 1 plasmids is determined by attachment to host chromosomes, which is mediated by the viral E2 protein and its binding sites. Journal of Virology 73 : 4404–4412.
3. LehmanCW, BotchanMR (1998) Segregation of viral plasmids depends on tethering to chromosomes and is regulated by phosphorylation. ProcNatlAcadSci USA 95 : 4338–4343.
4. YouJ, CroyleJL, NishimuraA, OzatoK, HowleyPM (2004) Interaction of the bovine papillomavirus E2 protein with Brd4 tethers the viral DNA to host mitotic chromosomes. Cell 117 : 349–360.
5. BaxterMK, McPhillipsMG, OzatoK, McBrideAA (2005) The mitotic chromosome binding activity of the papillomavirus E2 protein correlates with interaction with the cellular chromosomal protein, Brd4. J Virol 79 : 4806–4818.
6. WuSY, LeeAY, HouSY, KemperJK, Erdjument-BromageH, et al. (2006) Brd4 links chromatin targeting to HPV transcriptional silencing. Genes Dev 20 : 2383–2396.
7. McPhillipsMG, OzatoK, McBrideAA (2005) Interaction of bovine papillomavirus E2 protein with Brd4 stabilizes its association with chromatin. J Virol 79 : 8920–8932.
8. SmithJA, WhiteEA, SowaME, PowellML, OttingerM, et al. (2010) Genome-wide siRNA screen identifies SMCX, EP400, and Brd4 as E2-dependent regulators of human papillomavirus oncogene expression. Proc Natl Acad Sci U S A 107 : 3752–3757.
9. McPhillipsMG, OliveiraJG, SpindlerJE, MitraR, McBrideAA (2006) Brd4 is required for e2-mediated transcriptional activation but not genome partitioning of all papillomaviruses. J Virol 80 : 9530–9543.
10. WangX, HelferCM, PancholiN, BradnerJE, YouJ (2013) Recruitment of brd4 to the human papillomavirus type 16 DNA replication complex is essential for replication of viral DNA. J Virol 87 : 3871–3884.
11. SakakibaraN, ChenD, JangMK, KangDW, LueckeHF, et al. (2013) Brd4 Is Displaced from HPV Replication Factories as They Expand and Amplify Viral DNA. PLoS Pathog 9: e1003777.
12. DeyA, EllenbergJ, FarinaA, ColemanAE, MaruyamaT, et al. (2000) A bromodomain protein, MCAP, associates with mitotic chromosomes and affects G(2)-to-M transition. Mol Cell Biol 20 : 6537–6549.
13. DeyA, ChitsazF, AbbasiA, MisteliT, OzatoK (2003) The double bromodomain protein Brd4 binds to acetylated chromatin during interphase and mitosis. Proc Natl Acad Sci U S A 100 : 8758–8763.
14. JangMK, MochizukiK, ZhouMS, JeongHS, BradyJN, et al. (2005) The bromodomain protein Brd4 is a positive regulatory component of P-TEFb and stimulates RNA polymerase II-dependent transcription. Molecular Cell 19 : 523–534.
15. DelmoreJE, IssaGC, LemieuxME, RahlPB, ShiJ, et al. (2011) BET bromodomain inhibition as a therapeutic strategy to target c-Myc. Cell 146 : 904–917.
16. DeyA, NishiyamaA, KarpovaT, McNallyJ, OzatoK (2009) Brd4 marks select genes on mitotic chromatin and directs postmitotic transcription. Mol Biol Cell 20 : 4899–4909.
17. MochizukiK, NishiyamaA, JangMK, DeyA, GhoshA, et al. (2008) The bromodomain protein Brd4 stimulates G1 gene transcription and promotes progression to S phase. J Biol Chem 283 : 9040–9048.
18. Weidner-GlundeM, OttingerM, SchulzTF (2010) WHAT do viruses BET on? Front Biosci (Landmark Ed) 15 : 537–549.
19. McBrideAA, JangMK (2013) Current understanding of the role of the Brd4 protein in the papillomavirus lifecycle. Viruses 5 : 1374–1394.
20. LovenJ, HokeHA, LinCY, LauA, OrlandoDA, et al. (2013) Selective inhibition of tumor oncogenes by disruption of super-enhancers. Cell 153 : 320–334.
21. BelkinaAC, DenisGV (2012) BET domain co-regulators in obesity, inflammation and cancer. Nature reviews Cancer 12 : 465–477.
22. zur HausenH, GissmannL, SteinerW, DippoldW, DregerI (1975) Human papilloma viruses and cancer. Bibl Haematol 569–571.
23. BouvardV, BaanR, StraifK, GrosseY, SecretanB, et al. (2009) A review of human carcinogens-Part B: biological agents. Lancet Oncology 10 : 321–322.
24. JeonS, AllenhoffmannBL, LambertPF (1995) Integration of Human Papillomavirus Type-16 into the Human Genome Correlates with a Selective Growth Advantage of Cells. Journal of Virology 69 : 2989–2997.
25. ThorlandEC, MyersSL, GostoutBS, SmithDI (2003) Common fragile sites are preferential targets for HPV16 integrations in cervical tumors. Oncogene 22 : 1225–1237.
26. PopescuNC, DiPaoloJA (1989) Preferential sites for viral integration on mammalian genome. Cancer Genet Cytogenet 42 : 157–171.
27. MoodyCA, LaiminsLA (2009) Human Papillomaviruses Activate the ATM DNA Damage Pathway for Viral Genome Amplification upon Differentiation. Plos Pathogens 5: e1000605.
28. Fradet-TurcotteA, Bergeron-LabrecqueF, MoodyCA, LehouxM, LaiminsLA, et al. (2011) Nuclear accumulation of the papillomavirus E1 helicase blocks S-phase progression and triggers an ATM-dependent DNA damage response. J Virol 85 : 8996–9012.
29. SakakibaraN, MitraR, McBrideAA (2011) The papillomavirus E1 helicase activates a cellular DNA damage response in viral replication foci. J Virol 85 : 8981–8995.
30. GillespieKA, MehtaKP, LaiminsLA, MoodyCA (2012) Human papillomaviruses recruit cellular DNA repair and homologous recombination factors to viral replication centers. J Virol 86 : 9520–9526.
31. SakakibaraN, ChenD, McBrideAA (2013) Papillomaviruses use recombination-dependent replication to vegetatively amplify their genomes in differentiated cells. PLoS Pathog 9: e1003321.
32. HelmrichA, BallarinoM, ToraL (2011) Collisions between replication and transcription complexes cause common fragile site instability at the longest human genes. Mol Cell 44 : 966–977.
33. McBrideAA (2013) The Papillomavirus E2 proteins. Virology 445 : 57–79.
34. JangMK, KwonD, McBrideAA (2009) Papillomavirus E2 proteins and the host BRD4 protein associate with transcriptionally active cellular chromatin. J Virol 83 : 2592–2600.
35. Martinez-BalbasMA, DeyA, RabindranSK, OzatoK, WuC (1995) Displacement of sequence-specific transcription factors from mitotic chromatin. Cell 83 : 29–38.
36. Cardenas-MoraJ, SpindlerJE, JangMK, McBrideAA (2008) Dimerization of the papillomavirus E2 protein is required for efficient mitotic chromosome association and Brd4 binding. J Virol 82 : 7298–7305.
37. SchweigerMR, OttingerM, YouJ, HowleyPM (2007) Brd4 independent transcriptional repression function of the papillomavirus E2 proteins. J Virol 81 : 9612–9622.
38. NicodemeE, JeffreyKL, SchaeferU, BeinkeS, DewellS, et al. (2010) Suppression of inflammation by a synthetic histone mimic. Nature 468 : 1119–1123.
39. HeintzmanND, StuartRK, HonG, FuY, ChingCW, et al. (2007) Distinct and predictive chromatin signatures of transcriptional promoters and enhancers in the human genome. Nat Genet 39 : 311–318.
40. PengYC, BreidingDE, SverdrupF, RichardJ, AndrophyEJ (2000) AMF-1/Gps2 binds p300 and enhances its interaction with papillomavirus E2 proteins. J Virol 74 : 5872–5879.
41. CrumpNT, HazzalinCA, BowersEM, AlaniRM, ColePA, et al. (2011) Dynamic acetylation of all lysine-4 trimethylated histone H3 is evolutionarily conserved and mediated by p300/CBP. Proc Natl Acad Sci U S A 108 : 7814–7819.
42. EnsmingerAW, ChessA (2004) Coordinated replication timing of monoallelically expressed genes along human autosomes. Hum Mol Genet 13 : 651–658.
43. HansenRS, CanfieldTK, LambMM, GartlerSM, LairdCD (1993) Association of fragile X syndrome with delayed replication of the FMR1 gene. Cell 73 : 1403–1409.
44. DebatisseM, Le TallecB, LetessierA, DutrillauxB, BrisonO (2012) Common fragile sites: mechanisms of instability revisited. Trends Genet 28 : 22–32.
45. LetessierA, MillotGA, KoundrioukoffS, LachagesAM, VogtN, et al. (2011) Cell-type-specific replication initiation programs set fragility of the FRA3B fragile site. Nature 470 : 120–123.
46. Le TallecB, DutrillauxB, LachagesAM, MillotGA, BrisonO, et al. (2011) Molecular profiling of common fragile sites in human fibroblasts. Nature structural & molecular biology 18 : 1421–1423.
47. ChanKL, Palmai-PallagT, YingS, HicksonID (2009) Replication stress induces sister-chromatid bridging at fragile site loci in mitosis. Nature cell biology 11 : 753–760.
48. LossaintG, LarroqueM, RibeyreC, BecN, LarroqueC, et al. (2013) FANCD2 binds MCM proteins and controls replisome function upon activation of s phase checkpoint signaling. Mol Cell 51 : 678–690.
49. NaimV, RosselliF (2009) The FANC pathway and BLM collaborate during mitosis to prevent micro-nucleation and chromosome abnormalities. Nat Cell Biol 11 : 761–768.
50. Le TallecB, MillotGA, BlinME, BrisonO, DutrillauxB, et al. (2013) Common Fragile Site Profiling in Epithelial and Erythroid Cells Reveals that Most Recurrent Cancer Deletions Lie in Fragile Sites Hosting Large Genes. Cell Rep 4 : 420–428.
51. FungtammasanA, WalshE, ChiaromonteF, EckertKA, MakovaKD (2012) A genome-wide analysis of common fragile sites: what features determine chromosomal instability in the human genome? Genome research 22 : 993–1005.
52. CannizzaroLA, DurstM, MendezMJ, HechtBK, HechtF (1988) Regional chromosome localization of human papillomavirus integration sites near fragile sites, oncogenes, and cancer chromosome breakpoints. Cancer Genet Cytogenet 33 : 93–98.
53. DasP, ThomasA, MahantshettyU, ShrivastavaSK, DeodharK, et al. (2012) HPV genotyping and site of viral integration in cervical cancers in Indian women. PLoS One 7: e41012.
54. LiH, YangY, ZhangR, CaiY, YangX, et al. (2013) Preferential sites for the integration and disruption of human papillomavirus 16 in cervical lesions. J Clin Virol 56 : 342–347.
55. XuB, ChotewutmontriS, WolfS, KlosU, SchmitzM, et al. (2013) Multiplex Identification of Human Papillomavirus 16 DNA Integration Sites in Cervical Carcinomas. PLoS One 8: e66693.
56. ZhaoX, LiuQ, CaiQ, LiY, XuC, et al. (2012) Dr.VIS: a database of human disease-related viral integration sites. Nucleic Acids Res 40: D1041–1046.
57. KrausI, DrieschC, VinokurovaS, HovigE, SchneiderA, et al. (2008) The majority of viral-cellular fusion transcripts in cervical carcinomas cotranscribe cellular sequences of known or predicted genes. Cancer research 68 : 2514–2522.
58. AkagiK, LiJ, BroutianTR, Padilla-NashH, XiaoW, et al. (2013) Genome-wide analysis of HPV integration in human cancers reveals recurrent, focal genomic instability. Genome Res 24 : 185–99 doi: 10.1101/gr.164806
59. YouJ, SchweigerMR, HowleyPM (2005) Inhibition of E2 binding to Brd4 enhances viral genome loss and phenotypic reversion of bovine papillomavirus-transformed cells. J Virol 79 : 14956–14961.
60. StubenrauchF, ColbertAM, LaiminsLA (1998) Transactivation by the E2 protein of oncogenic human papillomavirus type 31 is not essential for early and late viral functions. J Virol 72 : 8115–8123.
61. SenechalH, PoirierGG, CoulombeB, LaiminsLA, ArchambaultJ (2007) Amino acid substitutions that specifically impair the transcriptional activity of papillomavirus E2 affect binding to the long isoform of Brd4. Virology 358 : 10–17.
62. BesterAC, RonigerM, OrenYS, ImMM, SarniD, et al. (2011) Nucleotide deficiency promotes genomic instability in early stages of cancer development. Cell 145 : 435–446.
63. LetessierA, BirnbaumD, DebatisseM, ChaffanetM (2011) [Genome: does a paucity of initiation events lead to fragility?]. Med Sci (Paris) 27 : 707–709.
64. BanerjeeNS, WangHK, BrokerTR, ChowLT (2011) Human papillomavirus (HPV) E7 induces prolonged G2 following S phase reentry in differentiated human keratinocytes. J Biol Chem 286 : 15473–15482.
65. NakaharaT, PehWL, DoorbarJ, LeeD, LambertPF (2005) Human papillomavirus type 16 E1∧E4 contributes to multiple facets of the papillomavirus life cycle. J Virol 79 : 13150–13165.
66. JiangY, LucasI, YoungDJ, DavisEM, KarrisonT, et al. (2009) Common fragile sites are characterized by histone hypoacetylation. Human molecular genetics 18 : 4501–4512.
67. WhyteWA, OrlandoDA, HniszD, AbrahamBJ, LinCY, et al. (2013) Master transcription factors and mediator establish super-enhancers at key cell identity genes. Cell 153 : 307–319.
68. ZhaoR, NakamuraT, FuY, LazarZ, SpectorDL (2011) Gene bookmarking accelerates the kinetics of post-mitotic transcriptional re-activation. Nat Cell Biol 13 : 1295–1304.
69. FloydSR, PacoldME, HuangQ, ClarkeSM, LamFC, et al. (2013) The bromodomain protein Brd4 insulates chromatin from DNA damage signalling. Nature 498 : 246–250.
70. OliveiraJG, ColfLA, McBrideAA (2006) Variations in the association of papillomavirus E2 proteins with mitotic chromosomes. Proc Natl Acad Sci U S A 103 : 1047–1052.
71. DanosO, KatinkaM, YanivM (1980) Molecular cloning, refined physical map and heterogeneity of methylation sites of papilloma virus type 1a DNA. Eur J Biochem 109 : 457–461.
72. ColeST, DanosO (1987) Nucleotide sequence and comparative analysis of the human papillomavirus type 18 genome. Phylogeny of papillomaviruses and repeated structure of the E6 and E7 gene products. J Mol Biol 193 : 599–608.
73. GoldsboroughMD, DiSilvestreD, TempleGF, LorinczAT (1989) Nucleotide sequence of human papillomavirus type 31: a cervical neoplasia-associated virus. Virology 171 : 306–311.
74. Van DoorslaerK, TanQ, XirasagarS, BandaruS, GopalanV, et al. (2013) The Papillomavirus Episteme: a central resource for papillomavirus sequence data and analysis. Nucleic Acids Res 41: D571–578.
75. AuerspergN (1964) Long-Term Cultivation of Hypodiploid Human Tumor Cells. J Natl Cancer Inst 32 : 135–163.
76. HummelM, HudsonJB, LaiminsLA (1992) Differentiation-induced and constitutive transcription of human papillomavirus type 31b in cell lines containing viral episomes. J Virol 66 : 6070–6080.
77. TrapnellC, RobertsA, GoffL, PerteaG, KimD, et al. (2012) Differential gene and transcript expression analysis of RNA-seq experiments with TopHat and Cufflinks. Nat Protoc 7 : 562–578.
78. WilsonR, LaiminsLA (2005) Differentiation of HPV-containing cells using organotypic “raft” culture or methylcellulose. Methods Mol Med 119 : 157–169.
79. ToedlingJ, HuberW (2008) Analyzing ChIP-chip Data Using Bioconductor. Plos Computational Biology 4: e1000227.
80. ToedlingJ, SklyarO, HuberW (2007) Ringo–an R/Bioconductor package for analyzing ChIP-chip readouts. BMC bioinformatics 8 : 221.
81. FavorovA, MularoniL, CopeLM, MedvedevaY, MironovAA, et al. (2012) Exploring massive, genome scale datasets with the GenometriCorr package. PLoS computational biology 8: e1002529.
Štítky
Hygiena a epidemiologie Infekční lékařství LaboratořČlánek vyšel v časopise
PLOS Pathogens
2014 Číslo 5
- Parazitičtí červi v terapii Crohnovy choroby a dalších zánětlivých autoimunitních onemocnění
- Vakcíny proti klíšťové encefalitidě
- Kdy je nejlepší očkovat
- Možné vedlejší účinky očkování
- Imunogenita vakcín
Nejčtenější v tomto čísle
- Venus Kinase Receptors Control Reproduction in the Platyhelminth Parasite
- Dual-Site Phosphorylation of the Control of Virulence Regulator Impacts Group A Streptococcal Global Gene Expression and Pathogenesis
- Severe Acute Respiratory Syndrome Coronavirus Envelope Protein Ion Channel Activity Promotes Virus Fitness and Pathogenesis
- High-Efficiency Targeted Editing of Large Viral Genomes by RNA-Guided Nucleases
Zvyšte si kvalifikaci online z pohodlí domova
Mazová zátka a její řešení
nový kurzVšechny kurzy