
Transcriptome Sequencing from Diverse Human Populations Reveals Differentiated Regulatory Architecture
Previous gene expression studies have identified factors influencing population-level variation in gene regulation. However, these efforts have been limited to a small set of well-studied populations. By leveraging the high resolution of RNA sequencing and broad population sampling, we survey the landscape of transcriptome variation across a globally distributed set of seven populations that span a breadth of human genetic variation and major dispersal events. We assess differences in gene expression, transcript structure, and regulatory variation. We find only 44 transcripts that show significant differences in expression, likely as a result of the small sample size, but we find that 25% of the variance in gene expression is due to population differences. This is a larger fraction than previously observed, and it is likely due to the greater breadth of human diversity assayed in this study. We also find that population-specific variance is mostly due to transcription variability rather than the configuration of expressed gene products. Additionally, known common regulatory variants have similar effects across populations including those we study here. These data and results serve as a resource cataloging the wide array of gene expression regulation affecting population variation among diverse groups, improving our understanding of transcriptional diversity.
Published in the journal:
. PLoS Genet 10(8): e32767. doi:10.1371/journal.pgen.1004549
Category:
Research Article
doi:
https://doi.org/10.1371/journal.pgen.1004549
Summary
Previous gene expression studies have identified factors influencing population-level variation in gene regulation. However, these efforts have been limited to a small set of well-studied populations. By leveraging the high resolution of RNA sequencing and broad population sampling, we survey the landscape of transcriptome variation across a globally distributed set of seven populations that span a breadth of human genetic variation and major dispersal events. We assess differences in gene expression, transcript structure, and regulatory variation. We find only 44 transcripts that show significant differences in expression, likely as a result of the small sample size, but we find that 25% of the variance in gene expression is due to population differences. This is a larger fraction than previously observed, and it is likely due to the greater breadth of human diversity assayed in this study. We also find that population-specific variance is mostly due to transcription variability rather than the configuration of expressed gene products. Additionally, known common regulatory variants have similar effects across populations including those we study here. These data and results serve as a resource cataloging the wide array of gene expression regulation affecting population variation among diverse groups, improving our understanding of transcriptional diversity.
Introduction
A central challenge in modern medical and population genomics is identifying trait-disposing genetic variants, interpreting their molecular consequences, and determining the transferability of their functional roles across individuals and populations. While genome-wide association studies (GWAS) have correlated an abundance of common and (increasingly) rare variants with disease, far fewer studies have pinpointed causal variants, discovered the biological mechanism of the association, or replicated their findings in different populations. Here, we build upon previous work using transcript abundance and splicing as model systems for understanding how population substructure can impact the genetic architecture of biomedical traits [1]–[4]. In particular, we focus on a set of populations that span the “Out-of-Africa” migration of anatomically modern humans using CEPH Human Genome Diversity Panel cell lines, for which we have collected an extensive ‘omics profile described below.
Genetic studies of microsatellites panels and single nucleotide polymorphisms (SNPs) have shown a decrease in genetic diversity as a function of a population's geographic distance from eastern or southern Africa [5]–[7]. This pattern fits a serial founder effect model, but it remains unclear whether transcriptome variation follows this pattern and how closely genetic effects on regulation mirror human migration history. Previous work has shown that population bottlenecks reduce heterozygosity and are associated with an accumulation of damaging and loss-of-function variation which can impact gene expression [8], [9]. However, further molecular work is needed to settle the controversy regarding demography and its impacts on the distribution of functional genetic variation among populations.
Gene expression studies within and between well-studied populations have been transformative in cataloging gene expression differences, expression quantitative trait loci (eQTLs) with different types of regulatory variants, as well as allele-specific expression (ASE) that underlie many disease associations [3], [10]–[16]. Technological advances in RNA sequencing and transcript assembly have also enabled analysis of variation in transcript structure and regulation of alternative splicing. For example, splicing ratios can differ between distant populations even in the absence of expression differences, and some population-specific splicing differences are involved in known disease-susceptibility genes that correspond with differences in prevalence [4], [17]. Additionally, thousands of unannotated transcripts have been identified within populations [18], [19], highlighting the difficulty in distinguishing population-specific transcripts that are functionally relevant versus those that simply arise from noisy splicing [20]. Elucidating how gene expression regulation and splicing are impacted by historical human migrations will aid functional interpretation of the genome and improve our understanding of the transferability and evolution of genetic regulation across populations.
This study aims to characterize regulatory, splicing, and expression differences via RNA sequencing across a global sampling of seven populations from the HGDP. We have also performed medium pass genome (∼8X) and high coverage (∼96X) exome sequencing of these individuals, enabling us to characterize genetic effects on transcriptome variation. These integrated DNA and RNA sequencing datasets are generated from the broadest points of human migration history yet sampled, and serve as a resource for future studies analyzing functional differences across populations.
Results
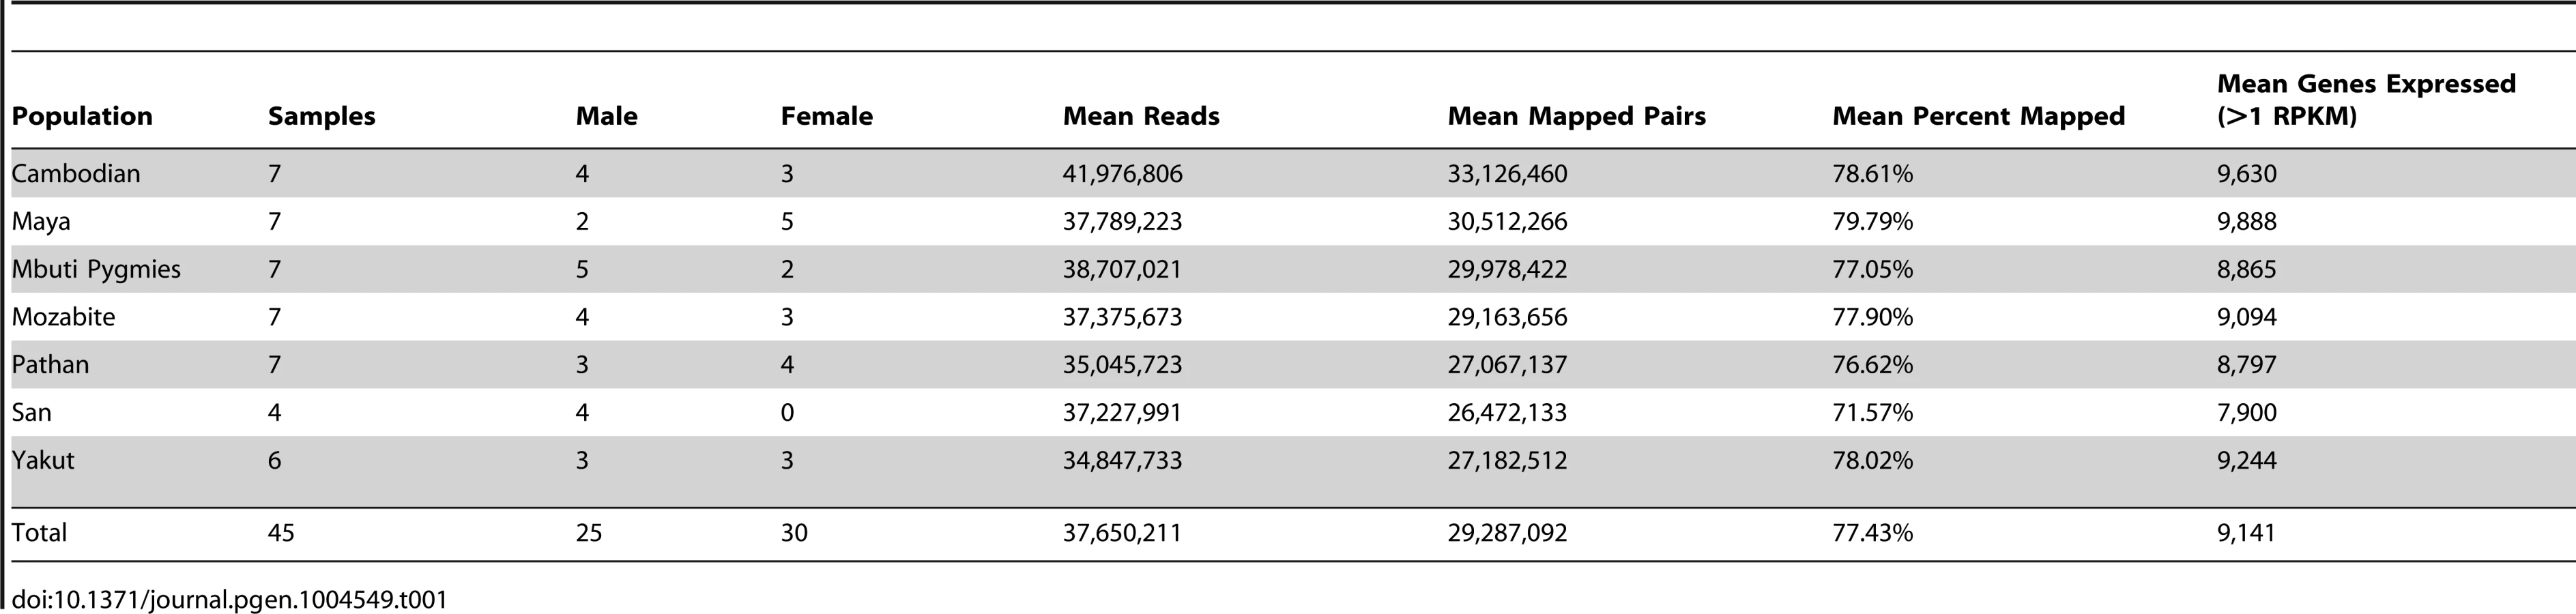
To assess the molecular underpinnings of population level transcriptome diversity, we have sequenced the DNA and mRNA fractions of 45 lymphoblastoid cell lines (LCLs) from seven populations in the Human Genome Diversity Panel [21]: Namibian San, Mbuti Pygmies of the Democratic Republic of Congo, Algerian Mozabites, Pathan of Pakistan, Cambodians of East Asia, Yakut of Siberia, and Mayans of Mexico (Figure 1). Five of these groups are descended from the ancient human dispersals out of Africa associated with serial founder effects [5]. The populations in this study capture important differences in human genetic diversity resulting from early subdivision within Africa and subsequent serial founder effects into the Near East, back to North Africa [22], southern and eastern Asia and Central America.

DNA sequencing was performed via paired-end 101-base pair Illumina sequencing (Methods). Total coverage per individual genome and exome was 8.1±3.3X and 96.5±11.0X (mean ± standard deviation), respectively. Additionally, 15.4M±0.5M read pairs per sample were generated via transcriptome sequencing performed on lymphoblastoid polyA-selected mRNA, and an average of 10.8±4.6 million read pairs per sample were properly mapped to the hg19 transcriptome (Table 1). Gene quantification performed through Cufflinks [23] detects an average of 9,141 known genes expressed per each individual cell line, which is consistent with previous observations [12].
mRNA quantification, reproducibility, and normalization
We randomized library preparations and sequencing across populations, including approximately one individual per population in each lane of sequencing in order to ensure that expression differences were due to biological rather than technical variation. We also sequenced technical replicates for each sample by sequencing each library preparation twice per individual. We assessed the correlation between replicates and identified problematic samples as previously described [24]. Briefly, we applied an optimal power space (OPS) transformation to expressed gene and transcript quantifications to ensure that all data points contributed equally to correlation measures, eliminating bias by low and high FPKM values. Pearson correlations between technical replicates were high (r = 0.915±0.034 (mean ± sd) for genes (Figure S1), r = 0.641±0.167 for transcripts). Higher correlations between replicates for gene versus transcript quantifications likely reflect the greater uncertainty in the deconvolution of the relative abundance of transcripts within a gene. Because reproducibility between replicates was high, we pooled reads across replicates and reassessed gene and transcript quantifications with Cufflinks. For each sample, we determined the median Pearson correlations (D-statistics) with all other samples. D-statistics were high overall (median D-statistic = 0.948 for genes, median D-statistic = 0.862 for transcripts, Figure S2). We identified two outliers, both within the San population (HGDP01029 and HGDP00992), and we removed these samples as well as the two remaining San samples from all downstream analyses.
To compare gene expression patterns across individuals, we first normalized our data. Exon and gene counts were quantified over regions annotated in UCSC known gene tables. Previous work has shown that the sample preparation protocol for RNA-seq introduces nonlinear, sample-specific effects that explain more than 50% of the variation in expression data [25], [26]. These nonlinear effects can manifest as sequence-specific biases [13], which we accounted for via conditional quantile normalization (CQN) [27]. This normalization strategy removed large distributional outliers (Figure S4) by accounting for non-linear guanine-cytosine (GC) content and feature length effects.
Genetic differentiation
As previously observed, genetic variation clearly differentiates globally diverse populations [28], [29] (Figure 2A–D). A tree generated via hierarchical clustering of FST distances (Figure 2A–B) shows a clear separation of sub-Saharan African populations and out-of-Africa populations. Additionally, principal component analysis (PCA) of autosomal single nucleotide polymorphisms (SNPs) in the HGDP dataset (Figure 2C–D) shows population-specific clustering [29] with these seven global populations separating within the first four PCs. Despite clear clustering among the selected populations at the genetic level, PCA of gene expression levels assessed via Cufflinks reflects high individual expression variability and shows no clear population clustering (Figure 2E–F). A formal test of this hypothesis is presented in the last subsection of the Results section, “Variability in expression and alternative splicing ratios,” which also considers the impact of population labeling as a factor in gene expression differences among individuals.

Differential expression across populations
We next sought to identify individual exons and genes that show strong evidence of differential expression (DE) among populations. We used a negative binomial model for gene expression analyses (Methods) and incorporated a normalization offset term from CQN via edgeR [30] (Figure S3); we find that our model provides a good fit to the data (Methods, Figure S4). We identified 251 DE exons via generalized linear model with a false discovery rate (FDR) of less than 5% when comparing all populations (Table S1). Two examples of genes containing highly DE exons are shown in Figure 3 (expression of all individuals shown in Figure S5), both of which are involved in immune function and have some previous evidence for population-specific effects [31], [32]. Figure 3A shows the expression of MX1 colored by population (FDR = 1.57%). MX1 is known to affect the immune response to influenza, the West Nile Virus, the avian flu, and other DNA and RNA viruses [33], [34]. Additionally, LSP1 (lymphocyte-specific protein 1, Figure 3B, FDR = 0.87%) has been associated with breast cancer risk in Europeans. Interestingly, this signal did not replicate using admixture mapping in Latina women, perhaps due to differences in allele frequency among the GWAS and attempted replication populations [32]. We also identified 44 differentially expressed transcripts at ≤5% FDR (Table S2). We used gene set enrichment analysis (GSEA) of ranked p-values to detect functional enrichment of differentially expressed transcripts [35]. The following categories were enriched with a FDR≤5%: RXR and RAR heterodimerization with other nuclear receptors (q = 0.007, canonical pathway), IL 2 signaling pathway (q = 0.015, BioCarta), and Top 40 genes from cluster 7 of acute myeloid leukemia (AML) expression profile (q = 0.018, chemical and genetic perturbations) (Figure S6).

Allelic variation in expression
Allele-specific expression (ASE) can be detected as a read imbalance at a given heterozygous site; it has previously been shown to tag regulatory variants [12]. To identify the degree to which allelic effects on expression vary, we compared ASE sharing among individuals for variants in the high coverage exomes. We define normalized ASE sharing as the number of shared significant ASE events (p<0.05) with at least 30 reads, normalized by sharing of SNPs that are heterozygous with at least 30 reads, regardless of presence or absence of a significant allelic imbalance. Reads were sampled to have equal counts in order to account for expression variability. There is a rapid reduction in normalized ASE sharing as the number of individuals in the comparison set increases (Figure S7A). That is, even when heterozygous sites are shared, most allelic imbalances are private to an individual. Some allelic imbalances are shared by pairs of individuals; rarely do three individuals in the set share an imbalance and very little sharing occurs across more than four individuals. We compared normalized ASE sharing across individual pairs and found similar levels of sharing within and between populations (Figure S7B). A potential explanation for this lack of ASE sharing among individuals is that the allelic state of the underlying causal regulatory variant tagged by the ASE exome site is acting in cis but in weak linkage disequilibrium, potentially with a rare regulatory variant.
In a previous study, Stranger et al. (2012) mapped eQTLs in eight populations from the HapMap3 dataset. To determine if the effects of these previously identified cis-regulatory variants can be captured in our more diverse HGDP populations, we compared ASE events in our dataset to previously discovered eQTLs [3] across populations. We hypothesized that if an individual is heterozygous for a previously discovered cis eQTL SNP (eSNP), and a significant ASE signal exists in the associated gene, then the allelic imbalance is more likely to be driven by the eQTL (see Figure S8 for a graphical representation of the model). We assessed the HGDP genotypes of eSNPs identified in HapMap3 and determined that there is a significant ASE enrichment within eQTLs associated with heterozygous versus homozygous eSNPs (p<2.2×10⁻¹⁶, Figure S9). This finding is consistent with our model and previous studies [12] and indicates that our measures of ASE are tagging shared regulatory variation between these studies. We also calculated an enrichment score similar to an odds ratio to determine how often ASE events are found in heterozygous versus homozygous eQTLs compared to the number of measured sites (Methods) for each HGDP and HapMap3 population. We observe an enrichment of ASE events in heterozygous eQTLs versus homozygous eQTLs consistently in all populations, but we do not observe a signal showing stronger effects in HGDP populations that are more closely related to the eQTL discovery population (Figure S10). This supports the previous notion that the effects of common regulatory variation are largely shared across populations with taggability depending on patterns of shared LD [3].
We next sought to determine whether regulatory events discovered within populations replicate more consistently in more closely related populations. Because of the limited sample size and structured populations in this study, de novo eQTL discovery is infeasible. We therefore assessed cross-population regulatory sharing using previously discovered eQTLs [3]. We compared Spearman's rank correlation coefficient ρ2 values, a measure akin to variance explained, between our dataset and the HapMap3 study and find consistency between the associations (r = 0.22, p<2.2 * 10−16). The −log10(p) values across studies were also significantly correlated (r = 0.14, p<2.2 * 10−16). We next measured the associations between eQTLs identified in each population. We find that the effect sizes of eQTLs are significantly associated across most pairwise populations (Figure 4), independent of genetic divergence. The reproducibility of eQTLs is similar across populations, indicating that previously discovered common eQTLs reflect either the true causal SNPs or tag the causal eQTL due to similar LD at the locus (Figure S11). We also assessed the impact of similarity in allele frequencies between studies on the ρ2 values and find that eQTLs with similar minor allele frequencies (MAFs) between studies replicate better than eQTLs with different minor allele frequencies. As expected, eQTLs with high MAFs in one study and low MAFs in another study replicate poorly (Figure S12).

Novel transcribed regions across populations
Using the genome, exome, and RNA-seq resource described above, we characterize the completeness of current gene annotations as previously described [13]. By pooling our dataset of 1.7 billion paired reads, we identify regions of novel transcription that lie outside of previously characterized gene structures. By calculating per-base global sequencing coverage and merging together continuous transcribed regions above our cutoff filters, we identified 445,091 total regions of putative transcription in our LCLs, 384,285 (∼86%) of which corresponded to annotated exons in Refseq, Ensembl, UCSC, or Gencode databases (Methods, Figure S13). Conversely, 34,555 regions (∼7%) meeting our minimum expression threshold did not overlap with known annotations (Figure S14).
When we filter regions expressed in at least one individual per population at greater than or equal to 1 RPKM, there are only a few hundred of these 34,555 regions expressed across all individuals in that population (Table S3). Additionally, we see that every novel transcribed region expressed ubiquitously in one population is also present in at least one other individual of another population. This result suggests that the vast majority of novel transcribed regions are not population specific, but can be found across multiple diverse human groups.
Variability in expression and alternative splicing
Previous work indicates that exonic splicing may vary significantly more than gene expression variability across species within the same tissue [36], [37]. The majority of previous human transcriptome work has focused on expression and regulatory variability, leaving the degree of alternative splicing variation across diverse human populations relatively unexplored. To understand expression and splicing relationships within and between human populations, we measured the coefficient of variation, cv, in gene expression (standard deviation divided by the mean) and the variability in alternative splicing ratios (Hellinger distance to the centroid of the splicing ratios of each gene across all individuals in the population, ) using methods developed previously [4]. We find that the cv and values for genes are highly correlated between pairwise populations (cv correlations are, on average, within [0.44, 0.67] between pairwise populations, p<2.2×10⁻¹⁶ for each comparison (Figure S15), and correlations are on average within [0.64, 0.82] between pairwise populations. p<2.2×10⁻¹⁶ for each comparison (Figure S16)). The relationships overall between cv and values do not reflect the genetic divergences seen between pairwise populations (Mantel test with 1,000 Monte Carlo repetitions between cv Spearman rank correlation distance matrix and FST gives ρ = 0.38, p = 0.16, and the same test between and FST gives ρ = 0.44, p = 0.14).
We next used established methods to assess the proportion of gene expression variation among individuals attributable to population identity [1]. We find that population label, on average, explains 25.0% of the variation in gene expression among individuals (Figure 5A) for all genes expressing at least two transcripts. To assess significance for each gene, we used a permutation test reshuffling population labels among individuals and find that the p-value distribution is heavily skewed towards low p-values compared to the expected uniform distribution (Figure 5B). This genome-scale level of population stratification for gene expression is higher than previously seen by the GEUVADIS consortium [1], which reported ∼3% of the variance attributable to population label as a factor when considering populations of mostly European descent in the 1,000 Genomes Project. These results are perhaps expected given that the populations in our study span a greater breadth of human genetic diversity. We repeated this analysis comparing each population to all other populations and find that a smaller proportion of the variation is due to population-specific differences and that these differences do not follow the pattern expected by population divergence (Figure S17). We also decomposed population-specific variability into variability in overall expression levels as opposed to splicing variability via multiplicative model, which, as previously demonstrated [1], [4], accounts for differences in scales and units between expression and splicing metrics. We find that on average, variation in gene expression explains the majority (75.5%±22.3% (mean ± sd), Figure 5C) of population-specific variation, indicating that alternative splicing generally makes up the minority of population-specific variation within humans. We repeated this analysis comparing each population to all other populations and find consistent results (Figure S18). We next assessed differential splicing between pairwise populations. In Figure 6, we show a sashimi plot of a gene (ENSG00000183291.11, SEP15) with substantial differential splicing across all pairwise populations. Overall, we do not see evidence for differential splicing patterns consistent with population genetic divergence (Figure S19); this result is consistent with a minority of population-specific variance in gene expression levels explained by splicing variability.


Discussion
We have analyzed the transcriptome landscape from populations spanning the breadth of human genomic diversity. While other studies have characterized variation within and among populations [12], [13], this study provides a unique opportunity to discover regulatory drivers of expression diversity in serially bottlenecked populations throughout human migration history. The HGDP populations in this study were explicitly chosen to encompass a large geographic range that experienced varied demographic histories, and thus they provide unique insight into global variation in transcription. In addition to gaining an understanding of transcriptome variation in diverse populations, this study also enables the discovery of novel gene structures and provides a public resource for analyses of diverse human transcriptomes.
In this study, we have assessed population-specific expression variability, alternative splicing, and regulatory variation. We account for technical artifacts in our analyses, including GC content and feature length effects, which otherwise add nonlinear systematic noise to expression data. We show that we substantially reduce technical sources of variation from these effects in our data and obtain high reproducibility between sequencing replicates. We detect few differentially expressed exons, which is likely affected by the fact that we analyze cultured cell lines grown in a highly homogenous environment. Further, given our sample size per population, we are only powered to detect very dramatic differences in expression among populations. Using variance decomposition methods developed previously, we find that 25.0% of transcription variability can be attributed to population differences among the six we study here. A previous study that sought to detect expression differences between the CEU and YRI estimated that ∼17% of genes were differentially expressed across these populations [38]. This estimate is quite comparable to ours. However, the estimates from both studies are substantially larger than those reported by the GEUVADIS consortium, which found that population labels accounted for only ∼3% of transcription differences among 462 individuals sampled from the European populations in the 1000 Genomes Project as well as Yorubans. One potential reason why our analysis produced estimates larger than GEUVADIS is that the European populations sampled there are more closely related to each other than the breadth of populations studied here.
Immunity genes as a whole are overrepresented in the set of differentially expressed genes across populations. This is highly consistent with the immune role of LCLs we study here. This finding is also consistent with previous work showing that natural selection may have favored different alleles in certain immune genes across human populations and that differences in autoimmune disease risks may be a side consequence of differences in these evolutionary histories [39], [40]. The increased expression of immune genes in LCLs also improves our power to detect differences with respect to most other gene functions. Potential mechanisms for differential expression across populations include variation in cis and trans eQTL allele frequencies, environmental differences, and epigenetic differences.
We also measured the population-specific variance attributable to expression versus splicing and find that on average, 75.5% is due to gene expression differences. This result is consistent with previous findings in humans and indicates that, within tissues, splicing differentiates populations less than expression. While this finding is consistent with previous human studies [1], [4], it appears to be inconsistent with other cross-species work [36], [37]. This suggests that splicing potentially plays a greater role on longer evolutionary time-scales. Additionally, the methodology used to assess splicing varies substantially between these studies; in this study, we have used variance decomposition methods relying on gene and transcript annotation data, which is more limited in many other species. In the cross-species studies, exonic splicing was measured via “percent spliced in” (Ψ), which may be affected by expression variability or other forms of transcript differences, such as those arising from alternative start sites. Further work on the efficacy of alternative splicing quantification methodologies would benefit future studies.
We also show that eQTLs that were previously identified across a wide range of human populations show allelic imbalances and replicate consistently across populations, but this replication is dependent on minor allele frequencies. Our results suggest that rare eQTLs within a population that are common in another population will likely have differing effect sizes. Given that the ∼1.2 million SNPs assayed in HapMap3 are common and therefore largely shared globally, we have only limited power to assess the effects of rare regulatory variants. As more transcriptomes are sequenced across diverse populations, we expect that rarer eQTLs identified in large population-based genome - and RNA-sequencing studies will identify more population-specific enrichment patterns.
This study provides the first analyses of transcriptome diversity from serially bottlenecked populations spanning the breadth of human migration history. In this study, we integrated genome, exome, and transcriptome sequencing data from LCLs that are part of the HGDP. This enabled us to assess regulatory drivers of global expression variation in serially bottlenecked populations across a large geographic range and different demographic histories. We find that population of origin accounts for ∼25% of variation in transcription. While we are powered to detect only large differences in expression among populations, genes involved in immunity are overrepresented in this set. Of the 25% difference in transcription explained by population of origin, expression differences accounts for three-fold more of the effect than do splicing differences. Further, the common regulatory variants we replicate here impact expression across broad geographic groups relatively uniformly and do not correlate with the degree of genetic divergence among populations. We look forward to larger studies spanning the breadth of human diversity that are better powered to detect additional population-specific effects and cellular mechanisms of global expression variation. Here, we analyze the total variance in expression and splicing explained by global populations, which, together with other studies, suggests a complex genetic mechanism for population level variation in transcription.
Materials and Methods
RNA preparation, library construction and sequencing
Total RNA was extracted from lymphoblastoid cell lines in four San, seven Mbuti Pygmies, seven Mozabites, six Pathan, seven Cambodians, seven Yakut, and seven Mayans from the Human Genome Diversity Panel using an RNeasy Mini Kit (Qiagen). mRNAs were purified using magnetic oligo-dT beads and randomly fragmented to 300–400 nucleotides in length. First-strand cDNA synthesis was performed using random hexamers and reverse transcriptase. This was followed by second-strand cDNA synthesis with dUTP via the dUTP strand-marking protocol [41]. Illumina TruSeq adaptors were ligated to the ends of the double-stranded cDNA fragments followed by digestion with uracil N-glycosylase (UNG) to remove second strand cDNA. A 300–400 bp size-selection of the final product was performed by gel-excision, following the Illumina-recommended protocol.
Each individual was sequenced in a 7-plex library on an Illumina HiSeq 2000 producing 101-bp paired end reads. Lanes were assessed for multiple quality metrics including number of reads, read quality, and reads mapping to the human genome. Two San individuals failed sequencing quality control and so all four San individuals were excluded from further analysis.
Exome capture
Sample genomic DNA was extracted from lymphoblastoid cell lines. Exonic regions were enriched using an Agilent SureSelect XT 44 Mb All-Exon Capture Kit (v2) and sequenced on Illumina HiSeq machines.
Exome and genome read mapping and SNP calling
Illumina sequencing reads were mapped to the human reference genome (hg19) using a standard pipeline informed by the 1000 Genomes Project [42]. Briefly, reads were mapped and paired using bwa v0.5.9 [43]. Duplicate read pairs were identified using Picard (http://picard.sourceforge.net/). Base qualities were empirically recalibrated, indels were realigned, and variants were called using the Genome Analysis Tool Kit (GATK) v1.6 [44]. SNP calls that failed the Variant Quality Score Recalibration (VQSR) step were filtered out.
FST calculations
Exonic SNPs were annotated using the RefSeq database to identify synonymous coding variants. High confidence and high coverage synonymous variants were used to compute Weir & Cockerham FST values [45] for each pairwise population using vcftools (v0.1.11) [46].
RNA sequencing read mapping
Reads were mapped to the human reference genome (hg19) with bowtie-2.0.0 and tophat-2.0.4 split read mapping algorithms using the “-b2-very-sensitive” parameters [46]. Reads were subsequently filtered to include only properly paired reads. This yielded between 12.1 and 44.8 million reads per individual (29.3 mean±7.9 s.d. million reads), which corresponds to 62.17±13.79% of the total reads per individual.
Quantification and normalization of known exons and genes
Exon and gene count estimates were created by using bedtools to count read overlap with known genes and exons from the UCSC “knownGene” table file downloaded on July 17th, 2012 for differential expression analysis. Raw exon and gene read counts were normalized through conditional quantile normalization, which reduces expression outliers by accounting for feature level GC nucleotide content and overall feature length [27].
UCSC knownGene tables were also used for novel transcript structure analysis because a larger collection of gene structures have been catalogued in this annotation set. For all other analyses, gencode v13 annotations were used, because they give one-to-one correspondence of transcript to gene annotation, enabling the Gonzalez-Porta methods to be used as they were developed.
Quantification of known transcripts
Transcript level quantification was performed with cufflinks-2.0.2 and produced FPKM (fragments per kilobase of exon per million) estimates per transcript. Cufflinks uses a generative statistical model of paired-end sequencing experiments to derive a likelihood for the abundances of a set of transcripts given a set of fragments. The likelihood function can be shown to have a unique maximum, which Cufflinks finds using a numerical optimization algorithm. The program then multiplies these probabilities to compute the overall likelihood that one would observe the fragments in the experiment, given the proposed abundances on the transcripts [23].
In order to compare expression levels in this dataset with those identified in Stranger et al [3], we reran Cufflinks (v2.1.1) using the Gencode v13 annotations to get both gene and transcript quantifications. These expression abundances were subsequently used to quantify the relative importance of variability in gene expression and variability in alternative splicing to individual transcript variability.
Annotation of genetic variants
Sequencing variants called from the differentially expressed and differentially spliced regions were annotated for a series of functional predictions, conversation scores, and RefSeq database annotations as described below. This was done in order to better assess the significance of genetic variants present in the data and their potential contribution or involvement in modulating gene expression, transcript splicing, and phenotypic variability. General annotations include information from: the NHLBI Exome Sequence Project allele frequencies; 1000 Genomes Project allele frequencies; publically available Complete Genomics sample allele frequencies; region and exonic annotations from both Ensembl and RefGene; and information about protein structure and function from the UNIPROT and INTERPRO databases. Conservation scores were also produced from the following algorithms: GERP++, SLR, SIFT, LRT, PHYLOP, and SiPhy based on 29 mammalian genomes [47]–[51]. Lastly, functional prediction annotations were produced from the following sources: FATHMM, MutationTaster, Mutation Assessor, LRT, PolyPhen2, and the RefSeq RefGene database [50], [52].
Identifying unannotated transcription
Methods to characterize regions of previous unannotated transcription closely followed previously described work [13] (Figure S14). In brief, for each base of the genome we calculated global sequencing coverage and split the genome into continuous transcribed regions. Expression of a region was defined as the maximum per base coverage of bases in the region. As in previous studies, we chose a threshold of an average expression level of 5×10∧-8 (or 0.05 reads/million) to consider a region expressed and merged together regions separated by less than 15 bp [13]. Sample specific expression of these novel regions was then quantified by calculating RPKM of each region for each individual. For these analyses, we ran Cufflinks (v2.0.2) using the UCSC KnownGene tables downloaded on July 16, 2012 because there were fuller annotations than in Gencode v13.
Allele-specific expression (ASE)
ASE was determined as previously [12]. Briefly, variants were called for all HGDP individuals in this project using high coverage, high quality exome variant calls generated according to the GATK best practices. Samtools was used to determine the number of reads that matched the reference and non-reference allele. Imbalance reference allele mapping bias was compensated using the per individual overall reference ratio within the binomial test.
Differential expression
We used conditional quantile normalization for all exons and genes with unique start and stop positions, accounting for GC content and length as covariates, and generated an offset term per gene or exon and individual. We filtered to exons or genes where the standard FPKM expression was > = 2 and the length was at least 100 bp, which left 207,180 of all UCSC knownGene annotated exons (29.7%) and 72,931 of all annotated genes (26.8%). Then, we used the following negative binomial model to detect differential expression:

ASE enrichment within eQTLs

Data access
The SRA accession number for the genome and exome sequence data reported in this paper is SRP036155. The GEO accession number containing the RNA-Seq data and gene/transcript expression matrices reported in this paper is GSE54308. Links to additional data (exome variant files, eQTL SNP data, FST matrices, gene/transcript expression quantifications, ASE tables, and eQTL data) and scripts are provided on an FTP site by the Stanford Center for Genomics and Personalized Medicine computing cluster located here: http://bustamantelab.stanford.edu/datasets.html.
Supporting Information
Zdroje
1. LappalainenT, SammethM, FriedländerMR, 't HoenPAC, MonlongJ, et al. (2013) Transcriptome and genome sequencing uncovers functional variation in humans. Nature 501 : 506–11 doi:10.1038/nature12531
2. MontgomerySB, LappalainenT, Gutierrez-ArcelusM, DermitzakisET (2011) Rare and common regulatory variation in population-scale sequenced human genomes. PLoS Genet 7: e1002144 doi:10.1371/journal.pgen.1002144
3. StrangerBE, MontgomerySB, DimasAS, PartsL, StegleO, et al. (2012) Patterns of cis regulatory variation in diverse human populations. PLoS Genet 8: e1002639 doi:10.1371/journal.pgen.1002639
4. Gonzàlez-PortaM, CalvoM, SammethM, GuigóR (2012) Estimation of alternative splicing variability in human populations. Genome Res 22 : 528–538 doi:10.1101/gr.121947.111
5. RamachandranS, DeshpandeO, RosemanCC, RosenbergNA, FeldmanMW, et al. (2005) Support from the relationship of genetic and geographic distance in human populations for a serial founder effect originating in Africa. Proc Natl Acad Sci U S A 102 : 15942–15947 doi:10.1073/pnas.0507611102
6. RosenbergNA, MahajanS, RamachandranS, ZhaoC, PritchardJK, et al. (2005) Clines, clusters, and the effect of study design on the inference of human population structure. PLoS Genet 1: e70 doi:10.1371/journal.pgen.0010070
7. HennBM, GignouxCR, JobinM, GrankaJM, MacphersonJM, et al. (2011) Hunter-gatherer genomic diversity suggests a southern African origin for modern humans. Proc Natl Acad Sci U S A 108 : 5154–5162 doi:10.1073/pnas.1017511108
8. LohmuellerKE, IndapAR, SchmidtS, BoykoAR, HernandezRD, et al. (2008) Proportionally more deleterious genetic variation in European than in African populations. Nature 451 : 994–997 doi:10.1038/nature06611
9. MacArthurDG, BalasubramanianS, FrankishA, HuangN, MorrisJ, et al. (2012) A systematic survey of loss-of-function variants in human protein-coding genes. Science 335 : 823–828 doi:10.1126/science.1215040
10. IdaghdourY, StoreyJD, JadallahSJ, GibsonG (2008) A genome-wide gene expression signature of environmental geography in leukocytes of Moroccan Amazighs. PLoS Genet 4: e1000052 doi:10.1371/journal.pgen.1000052
11. StrangerBE, NicaAC, ForrestMS, DimasA, BirdCP, et al. (2007) Population genomics of human gene expression. Nat Genet 39 : 1217–1224 doi:10.1038/ng2142
12. MontgomerySB, SammethM, Gutierrez-ArcelusM, LachRP, IngleC, et al. (2010) Transcriptome genetics using second generation sequencing in a Caucasian population. Nature 464 : 773–777 doi:10.1038/nature08903
13. PickrellJK, MarioniJC, PaiAA, DegnerJF, EngelhardtBE, et al. (2010) Understanding mechanisms underlying human gene expression variation with RNA sequencing. Nature 464 : 768–772 doi:10.1038/nature08872
14. MontgomerySB, GoodeD, KvikstadE, AlbersCA, ZhangZ, et al. (2013) The origin, evolution and functional impact of short insertion-deletion variants identified in 179 human genomes. Genome Res 749–761 doi:10.1101/gr.148718.112
15. NicaAC, MontgomerySB, DimasAS, StrangerBE, BeazleyC, et al. (2010) Candidate causal regulatory effects by integration of expression QTLs with complex trait genetic associations. PLoS Genet 6: e1000895 doi:10.1371/journal.pgen.1000895
16. NicolaeDL, GamazonE, ZhangW, DuanS, DolanME, et al. (2010) Trait-associated SNPs are more likely to be eQTLs: annotation to enhance discovery from GWAS. PLoS Genet 6: e1000888 doi:10.1371/journal.pgen.1000888
17. ZhangW, DuanS, BleibelWK, WiselSA, HuangRS, et al. (2009) Identification of common genetic variants that account for transcript isoform variation between human populations. Hum Genet 125 : 81–93 doi:10.1007/s00439-008-0601-x
18. JuYS, KimJ-I, KimS, HongD, ParkH, et al. (2011) Extensive genomic and transcriptional diversity identified through massively parallel DNA and RNA sequencing of eighteen Korean individuals. Nat Genet 43 : 745–752 doi:10.1038/ng.872
19. DunhamI, KundajeA, AldredSF, CollinsPJ, DavisCA, et al. (2012) An integrated encyclopedia of DNA elements in the human genome. Nature 489 : 57–74 doi:10.1038/nature11247
20. PickrellJK, PaiAA, GiladY, PritchardJK (2010) Noisy splicing drives mRNA isoform diversity in human cells. PLoS Genet 6: e1001236 doi:10.1371/journal.pgen.1001236
21. CannHM (2002) A Human Genome Diversity Cell Line Panel. Science 296 : 261b–262 doi:10.1126/science.296.5566.261b
22. PriceAL, TandonA, PattersonN, BarnesKC, RafaelsN, et al. (2009) Sensitive detection of chromosomal segments of distinct ancestry in admixed populations. PLoS Genet 5: e1000519 doi:10.1371/journal.pgen.1000519
23. TrapnellC, WilliamsBA, PerteaG, MortazaviA, KwanG, et al. (2010) Transcript assembly and quantification by RNA-Seq reveals unannotated transcripts and isoform switching during cell differentiation. Nat Biotechnol 28 : 511–515 doi:10.1038/nbt.1621
24. 't HoenPaC, FriedländerMR, AlmlöfJ, SammethM, PulyakhinaI, et al. (2013) Reproducibility of high-throughput mRNA and small RNA sequencing across laboratories. Nat Biotechnol 31 : 1015–1022 doi:10.1038/nbt.2702
25. HansenKD, BrennerSE, DudoitS (2010) Biases in Illumina transcriptome sequencing caused by random hexamer priming. Nucleic Acids Res 38: e131 doi:10.1093/nar/gkq224
26. LiJ, JiangH, WongWH (2010) Modeling non-uniformity in short-read rates in RNA-Seq data. Genome Biol 11: R50 doi:10.1186/gb-2010-11-5-r50
27. HansenKD, IrizarryRA, WuZ (2012) Removing technical variability in RNA-seq data using conditional quantile normalization. Biostatistics 13 : 204–216 doi:10.1093/biostatistics/kxr054
28. JakobssonM, ScholzSW, ScheetP, GibbsJR, VanLiereJM, et al. (2008) Genotype, haplotype and copy-number variation in worldwide human populations. Nature 451 : 998–1003 doi:10.1038/nature06742
29. LiJZ, AbsherDM, TangH, SouthwickAM, CastoAM, et al. (2008) Worldwide human relationships inferred from genome-wide patterns of variation. Science 319 : 1100–1104 doi:10.1126/science.1153717
30. McCarthyDJ, ChenY, SmythGK (2012) Differential expression analysis of multifactor RNA-Seq experiments with respect to biological variation. Nucleic Acids Res 40 : 4288–4297 doi:10.1093/nar/gks042
31. FerrisMT, AylorDL, BottomlyD, WhitmoreAC, AicherLD, et al. (2013) Modeling host genetic regulation of influenza pathogenesis in the collaborative cross. PLoS Pathog 9: e1003196 doi:10.1371/journal.ppat.1003196
32. FejermanL, ChenGK, EngC, HuntsmanS, HuD, et al. (2012) Admixture mapping identifies a locus on 6q25 associated with breast cancer risk in US Latinas. Hum Mol Genet 21 : 1907–1917 doi:10.1093/hmg/ddr617
33. SongM-S, ChoY-H, ParkS-J, PascuaPNQ, BaekYH, et al. (2013) Early regulation of viral infection reduces inflammation and rescues mx-positive mice from lethal avian influenza infection. Am J Pathol 182 : 1308–1321 doi:10.1016/j.ajpath.2012.12.022
34. BighamAW, BuckinghamKJ, HusainS, EmondMJ, BofferdingKM, et al. (2011) Host genetic risk factors for West Nile virus infection and disease progression. PLoS One 6: e24745 doi:10.1371/journal.pone.0024745
35. SubramanianA, TamayoP, MoothaVK, MukherjeeS, EbertBL, et al. (2005) Gene set enrichment analysis: a knowledge-based approach for interpreting genome-wide expression profiles. Proc Natl Acad Sci U S A 102 : 15545–15550 doi:10.1073/pnas.0506580102
36. Barbosa-MoraisNL, IrimiaM, PanQ, XiongHY, GueroussovS, et al. (2012) The evolutionary landscape of alternative splicing in vertebrate species. Science 338 : 1587–1593 doi:10.1126/science.1230612
37. MerkinJ, RussellC, ChenP, BurgeCB (2012) Evolutionary dynamics of gene and isoform regulation in Mammalian tissues. Science 338 : 1593–1599 doi:10.1126/science.1228186
38. StoreyJD, MadeoyJ, StroutJL, WurfelM, RonaldJ, et al. (2007) Gene-Expression Variation Within and Among Human Populations. 80 : 502–509 doi:10.1086/512017
39. PodderS, GhoshTC (2012) Evolutionary dynamics of human autoimmune disease genes and malfunctioned immunological genes. BMC Evol Biol 12 : 10 doi:10.1186/1471-2148-12-10
40. PickrellJK, CoopG, NovembreJ, KudaravalliS, LiJZ, et al. (2009) Signals of recent positive selection in a worldwide sample of human populations. Genome Res 19 : 826–837 doi:10.1101/gr.087577.108
41. ParkhomchukD, BorodinaT, AmstislavskiyV, BanaruM, HallenL, et al. (2009) Transcriptome analysis by strand-specific sequencing of complementary DNA. Nucleic Acids Res 37: e123 doi:10.1093/nar/gkp596
42. DePristoMa, BanksE, PoplinR, GarimellaKV, MaguireJR, et al. (2011) A framework for variation discovery and genotyping using next-generation DNA sequencing data. Nat Genet 43 : 491–498 doi:10.1038/ng.806
43. LiH, DurbinR (2009) Fast and accurate short read alignment with Burrows-Wheeler transform. Bioinformatics 25 : 1754–1760 doi:10.1093/bioinformatics/btp324
44. McKennaA, HannaM, BanksE, SivachenkoA, CibulskisK, et al. (2010) The Genome Analysis Toolkit: a MapReduce framework for analyzing next-generation DNA sequencing data. Genome Res 20 : 1297–1303 doi:10.1101/gr.107524.110
45. WeirBS, CockerhamCC (1984) Estimating F-Statistics for the Analysis of Population Structure. Evolution (N Y) 38 : 1358–1370.
46. TrapnellC, PachterL, SalzbergSL (2009) TopHat: discovering splice junctions with RNA-Seq. Bioinformatics 25 : 1105–1111 doi:10.1093/bioinformatics/btp120
47. DavydovEV, GoodeDL, SirotaM, CooperGM, SidowA, et al. (2010) Identifying a high fraction of the human genome to be under selective constraint using GERP++. PLoS Comput Biol 6: e1001025 doi:10.1371/journal.pcbi.1001025
48. MassinghamT, GoldmanN (2005) Detecting amino acid sites under positive selection and purifying selection. Genetics 169 : 1753–1762 doi:10.1534/genetics.104.032144
49. FlicekP, AhmedI, AmodeMR, BarrellD, BealK, et al. (2013) Ensembl 2013. Nucleic Acids Res 41: D48–55 doi:10.1093/nar/gks1236
50. MeyerLR, ZweigAS, HinrichsAS, KarolchikD, KuhnRM, et al. (2013) The UCSC Genome Browser database: extensions and updates 2013. Nucleic Acids Res 41: D64–9 doi:10.1093/nar/gks1048
51. GarberM, GuttmanM, ClampM, ZodyMC, FriedmanN, et al. (2009) Identifying novel constrained elements by exploiting biased substitution patterns. Bioinformatics 25: i54–62 doi:10.1093/bioinformatics/btp190
52. LiuX, JianX, BoerwinkleE (2011) dbNSFP: a lightweight database of human nonsynonymous SNPs and their functional predictions. Hum Mutat 32 : 894–899 doi:10.1002/humu.21517
53. HennBM, Cavalli-SforzaLL, FeldmanMW (2012) The great human expansion. Proc Natl Acad Sci U S A 109 : 17758–17764 doi:10.1073/pnas.1212380109
Štítky
Genetika Reprodukční medicínaČlánek vyšel v časopise
PLOS Genetics
2014 Číslo 8
- Kazuistika – Perspektivy využití precizované medicíny v rámci personalizované specifické terapie onkologických pacientů
- Nobelova cena za chemii pro genetické nůžky: Objev, který změní naši budoucnost?
- Technologie na bázi RNA v klinické praxi: od přebarvených petúnií k terapii vzácných a dosud jen obtížně léčitelných chorob u lidí
- „Nepředstavovali jsme si, že náš výzkum povede přímo ke vzniku nových léků, dokonce ještě za našeho života“
- Bezplatné služby pro diagnostiku ATTRv amyloidózy pro kardiology
Nejčtenější v tomto čísle
- Meta-Analysis of Genome-Wide Association Studies in African Americans Provides Insights into the Genetic Architecture of Type 2 Diabetes
- KDM6 Demethylase Independent Loss of Histone H3 Lysine 27 Trimethylation during Early Embryonic Development
- The RNA Helicases AtMTR4 and HEN2 Target Specific Subsets of Nuclear Transcripts for Degradation by the Nuclear Exosome in
- EF-P Dependent Pauses Integrate Proximal and Distal Signals during Translation
Zvyšte si kvalifikaci online z pohodlí domova
Mazová zátka a její řešení
nový kurzVšechny kurzy