
A System for Genome-Wide Histone Variant Dynamics In ES Cells Reveals Dynamic MacroH2A2 Replacement at Promoters
The ability of cells to remember the correct cell fate is at least partly dependent on how the genome is packaged. Embryonic stem (ES) cells, which have the ability to become any cell type in the body, are a particularly well-studied system for understanding how the packaging of the genome – chromatin – controls cell state. One of the more curious aspects of ES cell chromatin is its “hyperdynamic” nature, as the histone proteins that comprise chromatin have been reported to exchange rapidly on and off the DNA in these cells. Here, we report a pulse chase system for studying histone dynamics in mouse ES cells, and report on the dynamics of two histone variants, H3.3 and MacroH2A2. Notably, MacroH2A2 is highly dynamic in ES cells, with rapid exchange occurring over gene promoters, alongside much more stably-bound domains that cover large blocks of the genome. Upon differentiation to fibroblasts MacroH2A2 becomes much more stably-bound to the genome, consistent with the idea that this histone variant plays a role in “locking down” repressed regions the genome. These results provide further evidence for a key role of histone dynamics in control of cell state inheritance.
Published in the journal:
. PLoS Genet 10(8): e32767. doi:10.1371/journal.pgen.1004515
Category:
Research Article
doi:
https://doi.org/10.1371/journal.pgen.1004515
Summary
The ability of cells to remember the correct cell fate is at least partly dependent on how the genome is packaged. Embryonic stem (ES) cells, which have the ability to become any cell type in the body, are a particularly well-studied system for understanding how the packaging of the genome – chromatin – controls cell state. One of the more curious aspects of ES cell chromatin is its “hyperdynamic” nature, as the histone proteins that comprise chromatin have been reported to exchange rapidly on and off the DNA in these cells. Here, we report a pulse chase system for studying histone dynamics in mouse ES cells, and report on the dynamics of two histone variants, H3.3 and MacroH2A2. Notably, MacroH2A2 is highly dynamic in ES cells, with rapid exchange occurring over gene promoters, alongside much more stably-bound domains that cover large blocks of the genome. Upon differentiation to fibroblasts MacroH2A2 becomes much more stably-bound to the genome, consistent with the idea that this histone variant plays a role in “locking down” repressed regions the genome. These results provide further evidence for a key role of histone dynamics in control of cell state inheritance.
Introduction
All genomic transactions in eukaryotes occur in the context of chromatin. While histones are generally among the most stably-associated DNA-binding proteins known [1], a subset of histones exhibit dynamic replication-independent exchange with the soluble pool of nucleoplasmic histones [2]–[4]. Dynamic histone exchange is intimately linked to a variety of key aspects of chromatin biology.
In all eukaryotes studied, histone H3 exchange is most rapid at promoters [5]–[12], and is generally slowest over heterochromatic regions. In addition, H3 exchange is rapid at boundary elements that block the spread of heterochromatin [5], [7], raising the possibility that rapid histone exchange could function mechanistically to erase laterally spreading chromatin states. These correlations, in which histone exchange is slow over epigenetically-heritable heterochromatin domains but is rapid at boundary elements, raise the question of how histone dynamics contribute to epigenetic inheritance. Interestingly, H3/H4 tetramers carrying the H3.3 variant “split” during replication to a greater extent than do H3.1-containing tetramers [13], consistent with the hypothesis that dynamic regions of chromatin could potentially self-perpetuate through replication [2]. In addition, the rapid histone turnover observed at promoter regions of actively transcribed genes suggests that histone turnover may have an important role in gene regulation, as higher histone turnover rates could provide greater access of regulatory proteins to specific DNA elements. Yet much remains to be learned about the mechanistic basis for, and the biological consequences of, dynamic chromatin states.
Embryonic stem (ES) cells are a key model for mammalian pluripotency and cell state inheritance. ES cells are characterized by unusual chromatin packaging [14], and a wide variety of chromatin regulators have been implicated in control of pluripotency and differentiation [15]–[19]. One curious feature of ES cell chromatin is its “hyperdynamic” state—photobleaching experiments show that many histone variants exchange more rapidly in ES cells than in differentiated cell types [20]. This hyperdynamic state has been proposed to maintain the ES cell genome accessible as a relatively permissive ground state that becomes “locked down” during the process of lineage commitment and subsequent differentiation. Understanding histone exchange dynamics in ES cells, and during differentiation, is therefore of great interest for understanding the roles for chromatin in cell state inheritance.
The histone variant MacroH2A plays a key role in cell state stabilization in mammals. Mammals encode three MacroH2A variants, MacroH2A1.1 and MacroH2A1.2, which are alternatively spliced isoforms of a single gene, and the distinct gene product MacroH2A2. All three MacroH2A variants are distinguished by the presence of the unusual “Macro” domain fused to their relatively well-conserved H2A cores. It has been suggested that MacroH2A plays a role in fixing the epigenetic state of differentiated cells (reviewed in [21]). Support for this notion comes from observations that MacroH2A deposition increases with cellular age and senescence [22], [23], and that epigenetic reprogramming via somatic cell nuclear transfer is accompanied by an active removal of MacroH2A1 from the donor chromatin upon transfer into the ooplasm [24]. More recent studies have indicated that MacroH2A depletion from somatic cells increases their propensity for undergoing epigenetic reprogramming [25]–[28] —in several of these studies, depletion of either MacroH2A1 or MacroH2A2 enhances reprogramming, with depletion of both having an additive effect. These studies suggest that removal of MacroH2A from the somatic genome may be prerequisite for acquisition of pluripotency during epigenetic reprogramming.
MacroH2A may further contribute to fixing the epigenetic state of differentiated female cells due to its accumulation on the inactive X chromosome (Xi) [29]. However, association of MacroH2A1 with the Xi appears to occur after the random inactivation of the X chromosome (XCI) [30], and in conditional Xist deletions gene silencing is maintained despite the loss of MacroH2A1 on the Xi [31]. Nonetheless, while MacroH2A1 appears to be dispensable for XCI, removal of this variant from the Xi could still potentially represent a barrier to epigenetic reprogramming of a differentiated, post-XCI somatic cell to the pre-XCI ground state of pluripotency.
Despite the general characterization of MacroH2A as being a “repressive” histone variant, there are numerous examples where Macro incorporation is associated with increased gene expression, particularly during early lineage specification after embryoid body formation from ES cells [32], and more recently in embryonic fibroblasts where MacroH2A1 is present at high levels in the active Thy1 gene, but nearly completely absent when this gene is silent in pluripotent ES cells [27]. Determining the dynamics of MacroH2A turnover in both pluripotent ES cells and somatic cells is therefore of paramount interest for gaining an in-depth understanding of the epigenetic processes underlying cellular reprogramming.
Three methods are currently used to study histone dynamics [33]. First, the original discovery that the H3.3 variant marks sites of replication-independent histone exchange [3], [4] has enabled many labs to infer histone dynamics simply from steady-state H3.3 localization patterns [6], [7], [9]–[11]. Second, genetically encoded “pulse-chase” systems have been utilized in which an epitope-tagged histone molecule is induced, and mapping of the epitope tag at various times after induction provides a detailed kinetic view of histone exchange dynamics [5], [8], . Finally, a metabolic labeling strategy termed “CATCH-IT” enables kinetic analysis of overall chromatin dynamics [37].
Here, we extend the approach of inducible expression of epitope-tagged histone variants to study chromatin dynamics in murine embryonic stem cells. We generated ES lines carrying doxycycline (“Dox”)-inducible HA-tagged versions of several histone variants, including H3.3 and MacroH2A2. These cells allowed us to monitor the rate of incorporation of HA-tagged variants by ChIP-Seq at varying times following Dox induction. For the well-studied H3.3 variant, we validate our method by recapitulating known aspects of H3.3 localization and dynamics. We also characterized the dynamics of the understudied MacroH2A2 variant in detail in ES cells and in their embryonic fibroblast (MEF) derivatives. MacroH2A2 exhibited broad, likely replication-coupled, incorporation throughout large stretches of the ES cell genome, along with unexpectedly rapid turnover behavior at highly-expressed promoters. In contrast, MacroH2A2 in more differentiated MEFs was additionally associated with a subset of gene-poor genomic loci, and its exchange at promoters slowed considerably. These results reveal surprising aspects of MacroH2A2 localization and dynamics and suggest that the view of MacroH2A2 as simply an indicator and/or mediator of repressed chromatin states is not accurate. Moreover, these studies establish a model system for investigation of histone variant dynamics in tissue culture systems as well as in complex organ systems in vivo.
Results
A system for genome-wide analysis of histone variant dynamics
In order to assay genome-wide histone variant dynamics in embryonic stem cells and cell types derived from them, we generated ES cells based on the murine KH2 ES cell line [38], which harbors a modified reverse tetracycline transactivator (M2rtTA) targeted to the ROSA26 locus and an FRT recombination site targeted into safe-haven chromatin downstream of the Type I Collagen (Col1A1) locus. Introduction of a donor plasmid carrying another FRT recombination site along with HA-tagged cDNA sequences encoding the histone variants of interest under transcriptional control of the tetracycline operator (TetO), along with an additional plasmid encoding the FLP recombinase, allows for site-specific integration of the tetracycline-inducible HA-tagged histone cassette into the genome (Figure 1A). Subsequent addition of the tetracycline analog doxycycline (“Dox”) to these ES cell clones or mice derived from them results in induction of the tagged histone variant (Figure 1A, bottom panel). Cell lines were generated and validated for several different histone variants, including MacroH2A2 (hereafter called Macro in some contexts), and H3.3 (Figure S1A).

For all cell lines analyzed, no expression of tagged histones was detected in the absence of Dox by Western blotting or immunofluorescence staining with an HA antibody. Robust activation of the tagged proteins was detectable within 2–3 hours of Dox addition (Figure 1B, Figure S1B). Several controls show that ectopic expression of tagged histone variants did not significantly perturb ES cell pluripotency. First, even after 12 hours of induction, ectopically expressed histones were far less abundant than the endogenous proteins levels (Figure S1C). Second, after 72 hours of overexpression, ES colonies maintained their pluripotent state as assessed by cell morphology, alkaline phosphatase (AP) staining, and expression of pluripotency markers such as Oct4, Sox2 and Nanog (Figure S2). The only exception was H3.3, where 72 (but not 24) hours of ectopic expression resulted in a slightly reduced proliferation rate, but did not compromise pluripotency based on Oct4 or AP staining (not shown). Finally, as shown below, mapping of total MacroH2A2 (for which a high quality commercial antibody exists) both before and after HA-Macro induction yielded nearly identical results, demonstrating that ectopic expression did not drive nonphysiological incorporation of this histone variant into ectopic sites throughout genome.
Genome-wide dynamics of H3.3 replacement in mES cells
To validate our system, we first sought to determine whether a pulse-chase experiment is consistent with steady state mapping of H3.3 localization [4], [6], [7], [9], and what additional information it provides. ES cells carrying doxycycline-inducible HA-H3.3 were treated with Dox, and harvested after 0, 3, or 6 hours. HA-H3.3-containing chromatin was mapped genome-wide by chromatin immunoprecipitation followed by Illumina deep sequencing (ChIP-Seq). Sequencing reads were mapped back to the genome. Importantly, HA mapping at t = 0 (no doxycycline) did not show enrichment over specific loci but rather genome-wide nonspecific background, demonstrating the specificity of the anti-HA antibody (see below). Because H3.3 replacement is strongly associated with the 5′ ends of genes [6], [7], we aligned all annotated genes by their transcription start sites (TSSs), and averaged all mapped reads at each position relative to the TSS (Figure S3). Consistent with studies in flies and murine ES cells [6], [7], [9], we find that H3.3 is localized to two peaks surrounding the TSS, and that H3.3 levels correlate with the mRNA abundance of the associated gene. We also confirmed that the rapid H3.3 dynamics observed at Polycomb-bound regulatory elements in flies [7] are also present in the mouse embryonic stem cell genome at regions occupied by polycomb proteins Rnf2 and Suz12 (Figure S3E). Our results therefore recapitulate major known aspects of histone H3.3 dynamics. As H3.3 replacement has been extensively studied, we therefore turned to the understudied MacroH2A.2 variant.
MacroH2A2 associates with gene-rich regions and promoters in ES cells
We next extended our studies to a histone variant with unknown dynamic properties, MacroH2A2. Because MacroH2A2 localization in ES cells has not been characterized, we first carried out genome wide mapping of MacroH2A2 in murine ES cells using a commercially available antibody (Figure 2, Tables S1, S2). MacroH2A2 was broadly localized to large (megabase-scale) blocks across the mouse genome, where it colocalized with regions of high gene density (Figure 2A, Figure S4, Table S3) —the correlation between average MacroH2A2 enrichment and gene density was 0.46 for 100 kb windows, and rose to 0.59 when considering 1 MB windows of the genome (Figure 2B). In addition to broad localization over gene-rich regions, we noted that MacroH2A2 exhibited a tight (∼500 bp) peak on average over promoters (Figure 2C). Counterintuitively, genes lacking MacroH2A2 were generally poorly expressed (Figure 2D and Figure S4B, see Cluster 3), stemming largely from the absence of MacroH2A2 at repressed gene families such as those encoding olfactory receptors or zinc finger transcription factors. Interestingly, among genes associated with promoter MacroH2A2, tighter localization was correlated with higher expression levels (Figure S4B, Clusters 1 and 2). Consistent with the surprising correlation between MacroH2A2 localization and active promoters, we found a moderately positive correlation between our MacroH2A2 dataset and H2A.Z localization [39] in ES cells (Figure S5).

Confidence in these surprising observations comes from four lines of evidence. First, localization datasets obtained before and after HA-MacroH2A2 induction were highly-correlated (Figure 2C). Second, anti-HA ChIP-Seq in uninduced HA-Macro cells yielded a nearly flat genome-wide background (Figure 2A and Figure S4A, top panel, Figure S6, left panel). Third, MacroH2A2 localization obtained using the MacroH2A2 antibody was very highly correlated with the localization pattern observed using anti-HA ChIP-Seq from cells expressing HA-MacroH2A2 (Figure 2A and Figure S6), but not HA-H3.3 (Figure S3). Finally, MacroH2A2 localization patterns were strongly correlated, but not identical, between ES cells and MEFs (see below). Thus, we find MacroH2A2 localizes to large blocks of gene-rich chromatin in ES cells, and within these blocks exhibits strong promoter localization at expressed genes.
Rapid MacroH2A2 replacement at highly expressed promoters
We next carried out genome wide mapping of HA-MacroH2A2 at 3 time points (3, 6, and 12 hours) after Dox induction. Reads were mapped back to the genome and genes were aligned by TSS as above. HA mapping in the no Dox control revealed a primarily flat genomic background (Figures 2A, 3A), with trace levels of promoter localization likely resulting from low levels of leaky expression of HA-MacroH2A2 (Figure S6). Data from 3, 6, and 12 hours after HA-Macro induction was strongly correlated with endogenous MacroH2A2 localization (Figure 3A, Figure S6). The strong correlation between all 3 time points and the steady-state localization is to be expected from the fact that ES cells are rapidly cycling, so even at 3 hours of induction a substantial subpopulation of cells will have gone through S phase and carried out any replication-dependent MacroH2A2 incorporation.

In yeast, cell cycle arrest can be used to explicitly assay replication-independent histone replacement dynamics [5], [8]. However, this is impractical in ES cells, and our data come from asynchronously cycling cells. Nonetheless, such data can be used to study histone turnover. Two considerations, one conceptual and the other empirical, will aid in understanding how pulse-chase data obtained from cycling cells can be used to infer turnover dynamics (see Figure S7). Conceptually, we expect that loci exhibiting replication-coupled histone deposition (or slow replication-independent deposition) will gradually accumulate epitope-tagged histone variants over a time course of induction (Figure S7A). In contrast, because replication-independent replacement will initially occur in a greater fraction of cells than the subset of cells that are actively transiting S phase, such loci will exhibit more rapid accumulation of tagged histone. Given that genome-wide measurement methods typically normalize for sequencing depth (with the underlying assumption/hypothesis being equivalent total amounts of material between samples), the end result of this is that loci exhibiting rapid turnover will exhibit high levels of epitope tag enrichment early in a time course, but later in the time course this normalized relative enrichment will decrease as the bulk of cells transit S phase and replication-coupled deposition results in a greater total amount of epitope tag incorporated into the genome. In other words, relative enrichment of the rapidly exchanging population is high at early time points before population-wide assembly of HA-histone into the slower subpopulations, whereas at later time points normalization relative to the extensive HA-histone in cold domains results in a diminishing peak at “hot” loci (Figure S7B). Importantly, the assessment of relatively hot and cold loci is robust to normalization methods (Figure S7B, Methods). This predicted behavior is exactly what we have previously observed [5] empirically in yeast—here, replication-independent H3 turnover was directly measured in G1-arrested yeast. A parallel experiment was carried out using asynchronous cells, and those loci shown to exhibit rapid replication-independent turnover exhibited precisely the above-predicted behavior—rapid enrichment of tagged H3, followed by diminishing tag enrichment as the bulk of the genome was assembled into tagged H3 via replication-coupled assembly.
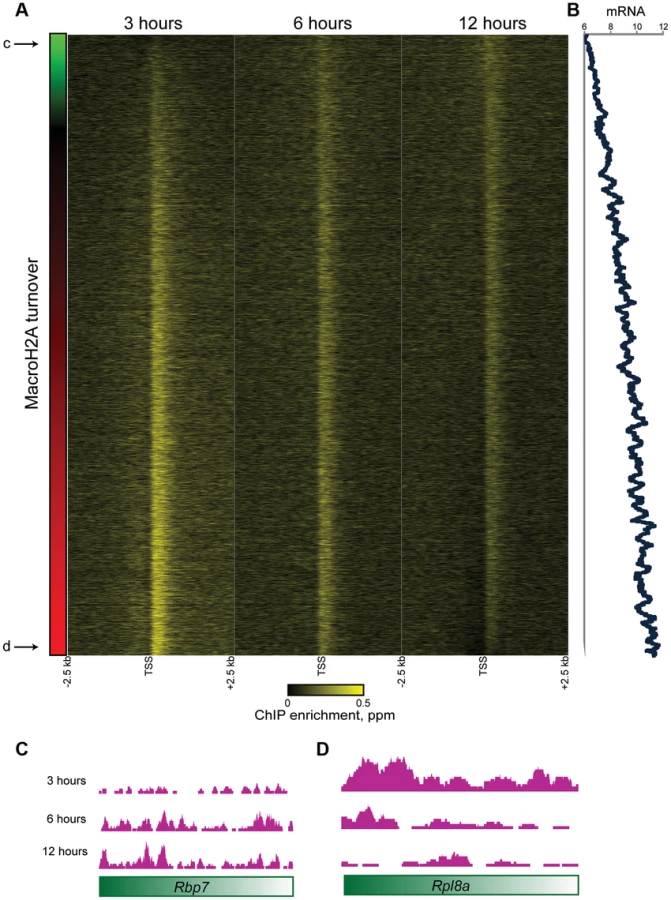
Consistent with the above considerations, in addition to the genome-wide HA incorporation observed at all 3 time points, we also observe extensive locus-specific variation in HA-Macro dynamics (Figure 3A, red and green-bordered boxes identify regions of rapid and slow HA incorporation, respectively). Regions exhibiting high levels of HA at 3 hours relative to 12 hours were inferred to be “hot” (Figure S7, [5]), and typically occurred in highly delimited peaks associated with promoters (see below), whereas cold regions generally covered broad chromosomal stretches, often in intergenic regions (Figures 3B–D, S8, Table S2). These trends can also be seen in detail when focusing on promoter proximal Macro dynamics (Figure 4). On average, the TSS-proximal peak of MacroH2A2 diminished from 3 hours to 6 hours to 12 hours, consistent with rapid replication-independent replacement. This observation was reproduced in a second HA-Macro induction time course (Figure S9). In contrast, genes associated with broad domains of MacroH2A2 across their promoters (Figures 2B and 4A, Cluster 2) exhibited consistent HA-MacroH2A2 mapping patterns at all three time points, as would be expected if these broad domains were relatively stable and incorporated Macro either via slow replacement or only during replication.

These results are consistent with at least two populations of MacroH2A2-containing chromatin that can be distinguished by their dynamic behavior. We infer that the TSS-proximal MacroH2A2 that is enriched at early time points before diminishing in enrichment represents a rapidly exchanging population of Macro that is present at moderate steady state occupancy, while larger Macro domains undergo either slow turnover or replication-coupled assembly. These larger domains tend to be gene poor, often occurring over gene deserts (Figures 3C–D) but occasionally encompassing individual genes as well (Figure 4A, cluster 2).
To gain further insight into the population of dynamic promoter-proximal Macro, we sorted genes with tight promoter Macro peaks (Cluster 1) according to their relative inferred Macro dynamics (Figure 5A) —note that relative dynamic behavior is completely insensitive to whether data are normalized assuming equivalent levels of Macro, or taking increasing total Macro incorporation over time into account. Genes with rapidly exchanging MacroH2A2 were enriched for GO processes consistent with housekeeping functions such as “translation” or “metabolism” (not shown) that are generally highly expressed, suggesting a potential link to expression level. Indeed, we found a strong correlation (r = 0.46) between MacroH2A2 dynamics and mRNA abundance (Figure 5B), as poorly expressed genes were associated with more stable MacroH2A2 than were highly expressed genes (see Figures 5C–D for examples). This link between promoter Macro dynamics and mRNA abundance supports our hypothesis that a pattern of diminishing HA enrichment over our time course is diagnostic of rapid MacroH2A2 replacement. These results are also consistent with the rapid histone H3 dynamics at promoters observed in a variety of organisms.
What is the function of rapid MacroH2A2 replacement at highly-expressed promoters? Knockdown of MacroH2A2 resulted in extremely modest changes in global mRNA abundance (Table S4), likely reflecting compensatory gene regulation by MacroH2A1, which is present in ES cells at ∼10-fold higher abundance than is MacroH2A2. Nonetheless, mRNA abundance exhibited greater changes at genes associated with slow MacroH2A2 exchange dynamics than at genes with rapid MacroH2A2 replacement (Figure S10).
MacroH2A2 localization and dynamics in differentiated cells
Given that several histone variants are “hyperdynamic” in ES cells [20] and that the Macro content in somatic cells is considered an epigenetic barrier for epigenetic reprogramming to pluripotency [24], [26], we sought to characterize the changes in MacroH2A2 dynamics between ES cells and mouse embryonic fibroblasts (MEFs). We generated transgenic mouse embryos by injecting TRE-HA-MacroH2A2 ES cells into blastocysts, derived MEFs from E12.5 chimeric embryos, then purified a homogenous population of TRE-HA-MacroH2A2 MEFs after selection against host blastocyst-derived cells. Importantly, HA-Macro protein induction dynamics were similar in ES cells and MEFs (Figure S11), enabling comparisons of Macro dynamics using this system. We first mapped MacroH2A2 in MEFs using an anti-MacroH2A2 antibody. As observed for ES cells, Macro localization patterns were strongly correlated before and after Dox induction (Figure S12), and were strongly correlated with HA mapping data from Dox-induced cells (r = 0.98, see below), providing strong evidence for antibody specificity.
Overall, MacroH2A2 patterns were similar (r = 0.67 using 100 kb bins) between ES cells and MEFs (Figure 6A, Figure S13, Tables S1–S2), supporting prior reports showing good correlations for MacroH2A1 localization between different cell types [40]. There was a general increase in MacroH2A2-enriched regions in MEFs relative to ES cells (Figure S13A), consistent with the fact that MacroH2A2 levels are higher in MEFs than in ES cells. Overall, while MacroH2A2 was generally maintained at gene-rich regions in MEFs as well as ES cells (Figure 6A, S13), we identified a large number of additional regions that gained Macro in MEFs relative to ES cells. Interestingly, MEF-specific Macro domains typically occurred in gene-poor chromosomal regions (Figure S13). In terms of gene categories associated with the sparse genes found in these gene-poor regions, MEFs gained MacroH2A2 at a broad set of genes involved in alternative differentiation programs including neural, leukocyte, muscle, and spermatogenesis programs (Table S5). This broadly supports the idea that the more plastic pluripotent chromatin state becomes progressively restricted during differentiation, with unused genes in each variety of differentiated cell type becoming “locked down” via MacroH2A2 incorporation.

In addition to broad gains of MacroH2A2 over gene-poor regions, we observed widespread changes in Macro enrichment over promoters between MEFs and ES cells. The average peak of MacroH2A2 over promoters exhibited an apparent decrease in MEFs (Figure 6B), although given that genome-wide there is more MacroH2A2 signal distant from promoters in MEFs relative to ES cells, this loss is overestimated as a result of dataset normalization. Accounting for this possibility, we nonetheless noted extensive redistribution of promoter-localized MacroH2A2 between ES cells and MEFs (Figure 6C). Curiously, MacroH2A2 changes between ES cells and MEFs correlated poorly (r = 0.02) with gene expression changes between these cell types, although we did note that exceptionally unpregulated genes characteristic of fibroblasts such as collagen and extracellular matrix factors (Col1a1, Col5a1, Lox, Tgfb2, Fib1, etc.) generally lost MacroH2A2 at their promoters in MEFs (Tables S1–S2). Instead of correlating with gene expression changes, we found that loss of Macro in MEFs tended to occur at promoters exhibiting dynamic Macro turnover in ES cells (Figures 6C–D). In contrast, stably Macro-associated promoters in ES cells preferentially retained Macro in MEFs. Together, these results suggest that dynamic assembly and disassembly of MacroH2A2 at highly expressed promoters is a specific feature of ES cells that is lost upon differentiation. In other words, while ribosomal protein genes (Rpl8, Rpl32, etc.) are highly expressed in both ES cells and MEFs, in ES cells their promoters are associated with rapidly-exchanging Macro, whereas these promoters are depleted of Macro in MEFs.
To explicitly characterize Macro dynamics in MEFs, we carried out HA-Macro mapping at 3, 6, and 12 hours after Dox induction. As with ES cells, HA localization at all 3 time points was highly correlated (r = 0.98 for all three time points using 100 kb windows) with mapping data obtained using the anti-Macro antibody. In contrast to ES cells, however, inspection of genome browser tracks yielded many fewer instances of 3 hour HA peaks that diminished at 6 and 12 hours. More systematically, we found that the average TSS-proximal HA peak was nearly identical at all three time points (compare Figures 7A and B). Not only was the average promoter HA peak nearly identical at all three time points, but there was less variation from t = 3 to t = 12 in our MEF data than in our ES data (Figure 7C). Sorting genes by inferred turnover behavior in MEFs revealed a subtle correlation between promoter turnover kinetics and mRNA abundance in MEFs (Figure 7D), but this relationship was far less robust (r = 0.17 versus r = 0.46) than that observed in ES cells (Figure S14). Taken together, these data show that rapid MacroH2A2 turnover is a specific feature of ES cells, and that upon differentiation to MEFs Macro is lost from dynamic promoters but retained in larger blocks of stably-associated Macro.

Discussion
Here, we extended a genetically encoded pulse-chase approach to use inducible epitope-tagged histone variants to study chromatin dynamics in mammalian cells. The inclusion of a temporal component in studying histone variant turnover yields information normally lost when analyzing static binding data, even for the well-studied H3.3 histone variant. Our use of non-transformed pluripotent embryonic stem cells and primary mouse embryonic fibroblasts demonstrate the broad utility of this approach in mammals.
MacroH2A2 localization and dynamics
We primarily focus here on the relatively unstudied MacroH2A2 variant. Overall, we observe extensive differences in the localization and dynamics of this variant between pluripotent ES cells and committed mouse embryonic fibroblasts. In ES cells, we observed widespread localization of MacroH2A2 across gene rich domains, along with a strong TSS-proximal peak of MacroH2A2. From our time course mapping studies, we infer that MacroH2A2 is rapidly replaced at promoters, and that this replacement is positively correlated with a gene's expression level. It is worth noting that H3.3 replacement is also rapid at promoters and correlates with mRNA abundance, indicating that in ES cells promoters exhibit rapid turnover of multiple histone variants.
Upon differentiation to embryonic fibroblasts, MacroH2A2 is broadly gained over gene poor domains, resulting in increased MacroH2A2 levels over genes associated with alternative differentiation programs such as neural or immune cell differentiation. Intriguingly, MacroH2A2 becomes far less dynamic in MEFs, and moreover MacroH2A2 is generally lost from those promoters where it is most dynamic in ES cells. Among other things, this observation argues that dynamic MacroH2A2 replacement inferred at highly-expressed genes in ES cells does not simply reflect nonspecific association of ectopically expressed histones with “open” promoters, as the highly expressed genes in MEFs exhibit far more subtle Macro dynamics than do the same genes in ES cells. Removal of the X chromosome from all key analyses (Figure S15) does not alter any of the conclusions regarding the change in Macro behavior between ES cells and MEFs, which is unsurprising as both cell types used in this study are male and thus data from the X chromosome reflects only the active X.
Together, these results are broadly consistent with the idea that pluripotent cells are characterized by “hyperdynamic” chromatin [20]. Interestingly, in contrast to the global hyperdynamic state observed by photobleaching for other histone variants, here we observe local, rather than global, dynamic MacroH2A2 behavior at a small fraction of loci—promoters of highly expressed genes. It will be interesting to identify factors contributing to ES-specific promoter MacroH2A2 dynamics in future studies.
MacroH2A2 dynamics in cell fate determination
Our findings that the dynamics of Macro turnover decrease as pluripotent ES cells become developmentally committed, and that stable MacroH2A2 becomes incorporated in gene poor regions and at genes associated with alternative cell fates in MEFs, have implications for the interpretation of several recent studies suggesting that the MacroH2A content of somatic cells acts as a barrier to epigenetic reprogramming of the genome to a pluripotent state. It is widely appreciated that Macro content increases during cellular differentiation and ageing, and studies employing somatic cell nuclear transfer (SCNT, or cloning), revealed that somatic MacroH2A1 is actively removed from the genome prior to the acquisition of pluripotency [24]. These observations, coupled with the accumulation of MacroH2A on the Xi during the process of X chromosome inactivation in female cells, suggest that removal of MacroH2A from the somatic genome may facilitate, or even be a prerequisite for, reprogramming to pluripotency.
Indeed, a recent study found that depletion of MacroH2A1 and 2 from somatic cells prior to initiation of epigenetic reprogramming via the ectopic expression of Oct4, Sox2, Klf4, and c-Myc (the Yamanaka factors—[41]) greatly improved reprogramming efficiency [27]. This study implicated repression of pluripotency-associated genes (Oct4, Sox2) with high MacroH2A1 content in somatic cells as the epigenetic barrier, such that removal of MacroH2A from pluripotency-associated promoters might allow for the reprogramming factors to more readily activate these genes. While this may be a contributing factor, in general MacroH2A content does not strongly predict gene repression. For example, in MEFs MacroH2A1 is highly enriched at the active Thy1 gene, but in ES and iPS cells, where Thy1 is silent, MacroH2A1 is nearly completely absent [27]. Indeed, in ES cells we find that MacroH2A2 is associated with active promoters (Figure 2), further arguing against a simple model for a universally repressive function of MacroH2A. Instead, we speculate that stable association of MacroH2A (Figure S10), rather than average MacroH2A occupancy per se, is more likely to play a role in gene repression. Consistent with this idea, we observe Macro enrichment over Sox2 in both ES cells and in MEFs, but in ES cells this gene is marked by rapid Macro replacement whereas Macro association is much more stable in MEFs (not shown).
Our findings that (1) dynamic incorporation of MacroH2A2 in gene-rich regions is correlated with highly active promoters, and that (2) stable MacroH2A2 incorporation in gene-poor regions (harboring genes associated with alternative cell fates) in MEFs is correlated with gene silencing, suggests that Macro removal during reprogramming may be most critical at these stable loci for re-establishing the “permissive” chromatin state characteristic of pluripotent cells.
Extension to tissue-specific chromatin dynamics
To date, the majority of studies on histone dynamics have been carried out in cell culture systems. However, it will be of great interest to begin understanding the tissue-specific differences in chromatin dynamics in vivo, both under control conditions and in response to environmental perturbations. Thus, we generated a inducible histone variant mouse strain after blastocyst injection of the TRE-HA-H3.3 ES cell line and successful germline transmission of the R26-M2rtTA and TRE-HA-H3.3 alleles (Figure S16). Administration of 2 mg/mL doxycycline in the drinking water of TRE-HA-H3.3 mice resulted in HA-H3.3 induction in liver nuclear extracts (Figure S16C). These animals will therefore provide a unique and exciting resource for characterization of histone dynamics in different tissues and cell types, and provide a proof of principle for the application of our approach in vivo.
Materials and Methods
Ethics statement
All procedures involving mice were reviewed and approved by the Institutional Animal Care and Use Committee of the University of Pennsylvania (Animal Welfare Assurance Reference Number #A3079-01, approved protocol #803415 granted to Dr. Lengner) and were in accordance with the guidelines set forth in the Guide for the Care and Use of Laboratory Animals of the National Research Council of the National Institutes of Health.
Targeting & stable cell line derivation
cDNA of various histone variants ((H2a-MMM1013-98478233; H2Az-MMM1013-9498090; MacroH2a2-MMM1013-9201250; H3.3-MMM1013-98478016, H1o-MMM1013-65296, Open Biosystems & human H3.1-Kind gift of Eric Campeau)) were initially subcloned in-frame with the HA-tag, then were cloned into the unique EcoRI restriction site of the pBS31 vector containing a PGK promoter followed by an ATG start codon and an FRT recombination site, followed by a splice acceptor-double polyA cassette, the tetracycline operator with a minimal CMV promoter, the unique EcoRI site, and an SV40 polyadenylation signal. The pBS31 vector containing the histone/histone variant cDNA was then electroporated along with a Flpe recombinase-expressing vector into KH2 embryonic stem cells harboring the modified reverse tetracycline transactivator (M2rtTA) targeted to and under transcriptional control of the ROSA26 locus, as well as an FRT-flanked PGK-neomycinR cassette followed by a promoterless, ATG-less hygromycinR cassette targeted downstream of the Collagen1a1 locus [38]. Selection for hygromycin resistance upon flip-in yielded numerous colonies which were verified for proper site-specific recombination at the Coll1a1 locus by digestion of genomic DNA and Southern blotting with a 3′ internal probe, yielding a 6.2 kb wildtype band, a 6.7 kb band for the FRT-containing knock-in allele, and a 4.1 kb band for the successfully flipped-in inducible allele. Together, the components of this system enable tetracycline induction of the epitope-tagged histone variant of choice in embryonic stem cells from a genomically-integrated construct.
HA-histone induction
Activation of the TetOn HA-tagged histone expression was carried out by addition of 2 µg/mL doxycycline hyclate (Sigma D9891) to the culture media. Cells were collected at different induction time points and induction of HA tagged histone variants in ES cells was assayed via Western blot.
Validation of ES cell pluripotency
ES cell cultures were fixed in 4% paraformaldehyde for 5 minutes prior to staining for pluripotency markers alkaline phosphatase and Oct4. Alkaline phosphatase was detected by enzymatic reaction using a Vector Red substrate kit (Vector Labs). Immunofluorescence staining for Oct4 was carried out by first permeabilizing and blocking in 5% FBS, 0.1% Triton-X 100 for 15 minutes, then incubating with an anti-Oct4 primary antibody at 1∶100 for 1 hr at room temperature (Rabbit polyclonal H-134, Santa Cruz Biotech). After 3 washes with PBS, cells were incubated with an anti-rabbit secondary antibody labeled with Cy3, washed, stained with DAPI for total DNA, and imaged.
Chimera generation and MEF Isolation
HA-MacroH2A2 or HA-H3.3-inducible ES cells were injected into BDF2 blastocysts and transplanted into pseudopregnant recipient females. For HA-MacroH2A2 MEF isolation, pregnant females were euthanized at E12.5, embryos were dissected followed by removal of internal organs. Embryos were then minced in the presence of 0.25% Trypsin-EDTA and incubated at 37°C for 20 minutes. MEF medium was then added and cell suspension was titrated followed by plating cells onto two 15 cm culture dishes per embryo. Cells were cultured for 12 hours at 37°C, 3% CO2, and 5% O2 after which puromycin was added to the MEF culture media to select against host blastocyst-derived cells (by virtue of a constitutively active puromycin resistance cassette targeted to the ROSA26 locus along with the M2rtTA). After 48 hours of puromycin selection, homogenous populations of HA-MacroH2A2 MEFs were trypsinized and frozen at passage 1. ChIP-Seq experiments on MEFs were carried out after thawing and one additional passage (i.e., p2 MEFs). For generation of HA-H3.3 mice, blastocyst injection was performed as above, but embryos were carried to term. High contribution chimeras (>95% by coat color) were backcrossed to Bl/6 mice to establish an inducible HA-H3.3 mouse colony.
Time course & ChIP-Seq
ES cells were grown in standard ES media containing Lif (ES Gro, Millipore) on mitotically inactivated feeder MEFs until approximately 80% confluence. ES cells were then pre-plated on gelatin and incubated for 45 min to deplete feeder MEFs by virtue of their faster adherence than ES cells (roughly 3 hours). ES cells were then split onto three gelatinized plates each of which was induced at different time points by the addition of final 2 µg/mL doxycycline hyclate (Sigma). A similar procedure was used for induction of MEFs at passage 2. All time points were crosslinked with formaldehyde to a final concentration of 1% for 10 minutes, and were quenched with 125 mM glycine. Crosslinked cells were resuspended in 270 µl SDS-Lysis Buffer (1% SDS, 10 mM EDTA and 50 mM Tris-Cl, pH 8.1) including protease inhibitor complex (Sigma) and PMSF (Sigma), and chromatin was sonicated in Bioruptor (UCD-200) to an average size of 150–400 base pairs. 70 µg of chromatin of each time point was immunoprecipitated either with HA antibody (Abcam) or MacroH2A2 antibody (Abcam). Eluted ChIP materials were PCI (Phenol-Chloroform-Isoamylalcohol) extracted, RNAse (Qiagen) and CIP (NEB) treated.
Deep sequencing library construction
ChIP material was then gel-purified and DNA fragments were blunt-ended and phosphorylated with the End-it-Repair kit (EPICENTRE). Illumina genome sequencing adaptors were ligated using the Fast-Link ligation kit (EPICENTRE) after the addition of adenosine nucleotide, using exo - Klenow. And samples were PCR amplified with Illumina genomic DNA sequencing primers. PCR products (250 to 450 bp in size) were gel purified and sent for Illumina GA2 “Solexa” sequencing at the UMass Worcester deep sequencing core facility.
Data availability
Data will be available at Gene Expression Omnibus, Accession #GSE57665.
Mapping and normalization
Raw FastQ reads were first collapsed by their sequences while the occurrences were kept. We then mapped reads to the mm9 genome using bowtie allowing at most one mismatch in the alignment. Only one mapping was randomly picked by the -M 1 parameter setting for dealing with multimappers. Each aligned coordinate was extended toward its 3′ end to reach 150 bp length (although extension was clipped if it exceeded the length of the chromosome). We calculated the relative distance to the nearest TSS for all named genes, and for each TSS tallied the sum of read occurrences from 4 kb upstream to 4 kb downstream. The occurrences were normalized to p.p.m. and binned in 20 bp intervals. For TSS-centered averages (as in Figure 3C, for example) data were additionally normalized relative to the average of the first 2 kb (from −4 kb to −2 kb).
Importantly, for turnover analyses, relatively hot and cold regions are insensitive to the normalization method used—if we normalized all datasets to the hottest regions of the genome, rather than observing decreasing HA enrichment at promoters over time, we would observe very slow incorporation across the rest of the genome with increasing enrichment over time. However, in the absence of a true benchmark with known absolute occupancy (eg a set of promoters with 100% occupancy of MacroH2A2 at t = 3 hours), we choose to utilize standard genome-wide normalization and interpret our dataset with these considerations in mind.
100 kb tile-based data analysis
The mouse genome was segmented into nonoverlapping 100 kb tiles (eg chromosome 1 1–100,000, chromosome 1 100,001–200,000, etc.). For each tile, total normalized Macro or HA levels were calculated, and number of annotated TSSs was counted (using only TSSs for named genes). Tiles with the top 1% of signal in the anti-HA dataset from uninduced cells were discarded, as these typically covered regions adjacent to extensive repeats that show artifactual “enrichment” in all public datasets examined, including pre-ChIP input sequencing. For computing correlations between datasets, unmappable tiles with zero mapped reads were also removed.
Promoter-based data analysis
For all named genes, data were aggregated into 20 bp bins from −4 kb to +4 kb surrounding the annotated TSS. These data were used for clustering and visualization throughout. In addition, we calculated a summary statistic based on total enrichment values for the 1.2 kb stretch from −600 to +600 bp—this value was used for analyses such as Figures 5A, 6D, or 7C (and related Supporting Figures). For comparisons between ES cells and MEFs, we used all genes with an average promoter MacroH2A2 enrichment of at least 0.1, in one of the two datasets, for the 1.2 kB surrounding the TSS.
Supporting Information
Zdroje
1. KimuraH, CookPR (2001) Kinetics of core histones in living human cells: little exchange of H3 and H4 and some rapid exchange of H2B. J Cell Biol 153 : 1341–1353.
2. AhmadK, HenikoffS (2002) Epigenetic consequences of nucleosome dynamics. Cell 111 : 281–284.
3. AhmadK, HenikoffS (2002) Histone H3 variants specify modes of chromatin assembly. Proc Natl Acad Sci U S A 99 Suppl 4 : 16477–16484.
4. AhmadK, HenikoffS (2002) The histone variant H3.3 marks active chromatin by replication-independent nucleosome assembly. Mol Cell 9 : 1191–1200.
5. DionMF, KaplanT, KimM, BuratowskiS, FriedmanN, et al. (2007) Dynamics of replication-independent histone turnover in budding yeast. Science 315 : 1405–1408.
6. MitoY, HenikoffJG, HenikoffS (2005) Genome-scale profiling of histone H3.3 replacement patterns. Nat Genet 37 : 1090–1097.
7. MitoY, HenikoffJG, HenikoffS (2007) Histone replacement marks the boundaries of cis-regulatory domains. Science 315 : 1408–1411.
8. RufiangeA, JacquesPE, BhatW, RobertF, NouraniA (2007) Genome-wide replication-independent histone H3 exchange occurs predominantly at promoters and implicates H3 K56 acetylation and Asf1. Mol Cell 27 : 393–405.
9. GoldbergAD, BanaszynskiLA, NohKM, LewisPW, ElsaesserSJ, et al. (2010) Distinct factors control histone variant H3.3 localization at specific genomic regions. Cell 140 : 678–691.
10. StroudH, OteroS, DesvoyesB, Ramirez-ParraE, JacobsenSE, et al. (2012) Genome-wide analysis of histone H3.1 and H3.3 variants in Arabidopsis thaliana. Proc Natl Acad Sci U S A 109 : 5370–5375.
11. JinC, ZangC, WeiG, CuiK, PengW, et al. (2009) H3.3/H2A.Z double variant-containing nucleosomes mark ‘nucleosome-free regions’ of active promoters and other regulatory regions. Nat Genet 41 : 941–945.
12. AygunO, MehtaS, GrewalSI (2013) HDAC-mediated suppression of histone turnover promotes epigenetic stability of heterochromatin. Nat Struct Mol Biol 20 : 547–554.
13. XuM, LongC, ChenX, HuangC, ChenS, et al. (2010) Partitioning of histone H3-H4 tetramers during DNA replication-dependent chromatin assembly. Science 328 : 94–98.
14. BernsteinBE, MikkelsenTS, XieX, KamalM, HuebertDJ, et al. (2006) A bivalent chromatin structure marks key developmental genes in embryonic stem cells. Cell 125 : 315–326.
15. FazzioTG, HuffJT, PanningB (2008) An RNAi screen of chromatin proteins identifies Tip60-p400 as a regulator of embryonic stem cell identity. Cell 134 : 162–174.
16. ChristophersenNS, HelinK (2010) Epigenetic control of embryonic stem cell fate. J Exp Med 207 : 2287–2295.
17. BoyerLA, PlathK, ZeitlingerJ, BrambrinkT, MedeirosLA, et al. (2006) Polycomb complexes repress developmental regulators in murine embryonic stem cells. Nature 441 : 349–353.
18. CreyghtonMP, MarkoulakiS, LevineSS, HannaJ, LodatoMA, et al. (2008) H2AZ is enriched at polycomb complex target genes in ES cells and is necessary for lineage commitment. Cell 135 : 649–661.
19. KajiK, CaballeroIM, MacLeodR, NicholsJ, WilsonVA, et al. (2006) The NuRD component Mbd3 is required for pluripotency of embryonic stem cells. Nat Cell Biol 8 : 285–292.
20. MeshorerE, YellajoshulaD, GeorgeE, ScamblerPJ, BrownDT, et al. (2006) Hyperdynamic plasticity of chromatin proteins in pluripotent embryonic stem cells. Dev Cell 10 : 105–116.
21. CreppeC, PosavecM, DouetJ, BuschbeckM (2012) MacroH2A in stem cells: a story beyond gene repression. Epigenomics 4 : 221–227.
22. ChangolkarLN, CostanziC, LeuNA, ChenD, McLaughlinKJ, et al. (2007) Developmental changes in histone macroH2A1-mediated gene regulation. Mol Cell Biol 27 : 2758–2764.
23. ChangolkarLN, PehrsonJR (2006) macroH2A1 histone variants are depleted on active genes but concentrated on the inactive X chromosome. Mol Cell Biol 26 : 4410–4420.
24. ChangCC, GaoS, SungLY, CorryGN, MaY, et al. (2010) Rapid elimination of the histone variant MacroH2A from somatic cell heterochromatin after nuclear transfer. Cell Reprogram 12 : 43–53.
25. Gaspar-MaiaA, QadeerZA, HassonD, RatnakumarK, LeuNA, et al. (2012) MacroH2A histone variants act as a barrier upon reprogramming towards pluripotency. Nat Commun 4 : 1565.
26. PasqueV, GillichA, GarrettN, GurdonJB (2011) Histone variant macroH2A confers resistance to nuclear reprogramming. Embo J 30 : 2373–2387.
27. PasqueV, RadzisheuskayaA, GillichA, Halley-StottRP, PanamarovaM, et al. (2012) Histone variant macroH2A marks embryonic differentiation in vivo and acts as an epigenetic barrier to induced pluripotency. J Cell Sci 6094–6104.
28. BarreroMJ, SeseB, KueblerB, BilicJ, BoueS, et al. (2013) Macrohistone Variants Preserve Cell Identity by Preventing the Gain of H3K4me2 during Reprogramming to Pluripotency. Cell Rep 3 : 1005–1011.
29. CostanziC, PehrsonJR (1998) Histone macroH2A1 is concentrated in the inactive X chromosome of female mammals. Nature 393 : 599–601.
30. ChadwickBP, WillardHF (2001) Histone H2A variants and the inactive X chromosome: identification of a second macroH2A variant. Hum Mol Genet 10 : 1101–1113.
31. CsankovszkiG, PanningB, BatesB, PehrsonJR, JaenischR (1999) Conditional deletion of Xist disrupts histone macroH2A localization but not maintenance of X inactivation. Nat Genet 22 : 323–324.
32. CreppeC, JanichP, CantarinoN, NogueraM, ValeroV, et al. (2012) MacroH2A1 regulates the balance between self-renewal and differentiation commitment in embryonic and adult stem cells. Mol Cell Biol 32 : 1442–1452.
33. DealRB, HenikoffS (2010) Capturing the dynamic epigenome. Genome Biol 11 : 218.
34. SchermerUJ, KorberP, HorzW (2005) Histones are incorporated in trans during reassembly of the yeast PHO5 promoter. Mol Cell 19 : 279–285.
35. JamaiA, ImoberdorfRM, StrubinM (2007) Continuous Histone H2B and Transcription-Dependent Histone H3 Exchange in Yeast Cells outside of Replication. Mol Cell 25 : 345–355.
36. KraushaarDC, JinW, MaunakeaA, AbrahamB, HaM, et al. (2013) Genome-wide incorporation dynamics reveal distinct categories of turnover for the histone variant H3.3. Genome Biol 14: R121.
37. DealRB, HenikoffJG, HenikoffS (2010) Genome-wide kinetics of nucleosome turnover determined by metabolic labeling of histones. Science 328 : 1161–1164.
38. BeardC, HochedlingerK, PlathK, WutzA, JaenischR (2006) Efficient method to generate single-copy transgenic mice by site-specific integration in embryonic stem cells. Genesis 44 : 23–28.
39. HuG, CuiK, NorthrupD, LiuC, WangC, et al. (2013) H2A.Z facilitates access of active and repressive complexes to chromatin in embryonic stem cell self-renewal and differentiation. Cell Stem Cell 12 : 180–192.
40. GambleMJ, FrizzellKM, YangC, KrishnakumarR, KrausWL (2010) The histone variant macroH2A1 marks repressed autosomal chromatin, but protects a subset of its target genes from silencing. Genes Dev 24 : 21–32.
41. TakahashiK, YamanakaS (2006) Induction of pluripotent stem cells from mouse embryonic and adult fibroblast cultures by defined factors. Cell 126 : 663–676.
42. YildirimO, LiR, HungJH, ChenPB, DongX, et al. (2011) Mbd3/NURD complex regulates expression of 5-hydroxymethylcytosine marked genes in embryonic stem cells. Cell 147 : 1498–1510.
43. YangF, KempCJ, HenikoffS (2013) Doxorubicin enhances nucleosome turnover around promoters. Curr Biol 23 : 782–787.
44. CoreLJ, LisJT (2008) Transcription regulation through promoter-proximal pausing of RNA polymerase II. Science 319 : 1791–1792.
45. KimJ, WooAJ, ChuJ, SnowJW, FujiwaraY, et al. (2010) A Myc network accounts for similarities between embryonic stem and cancer cell transcription programs. Cell 143 : 313–324.
Štítky
Genetika Reprodukční medicínaČlánek vyšel v časopise
PLOS Genetics
2014 Číslo 8
- Kazuistika – Perspektivy využití precizované medicíny v rámci personalizované specifické terapie onkologických pacientů
- Nobelova cena za chemii pro genetické nůžky: Objev, který změní naši budoucnost?
- Technologie na bázi RNA v klinické praxi: od přebarvených petúnií k terapii vzácných a dosud jen obtížně léčitelných chorob u lidí
- „Nepředstavovali jsme si, že náš výzkum povede přímo ke vzniku nových léků, dokonce ještě za našeho života“
- Bezplatné služby pro diagnostiku ATTRv amyloidózy pro kardiology
Nejčtenější v tomto čísle
- Meta-Analysis of Genome-Wide Association Studies in African Americans Provides Insights into the Genetic Architecture of Type 2 Diabetes
- KDM6 Demethylase Independent Loss of Histone H3 Lysine 27 Trimethylation during Early Embryonic Development
- The RNA Helicases AtMTR4 and HEN2 Target Specific Subsets of Nuclear Transcripts for Degradation by the Nuclear Exosome in
- EF-P Dependent Pauses Integrate Proximal and Distal Signals during Translation
Zvyšte si kvalifikaci online z pohodlí domova
Mazová zátka a její řešení
nový kurzVšechny kurzy