
A Genome-Wide Association Study of the Maize Hypersensitive Defense Response Identifies Genes That Cluster in Related Pathways
The hypersensitive pathogen defense response (HR) in plants typically consists of a rapid, localized cell death around the point of attempted pathogen penetration. It is found in all plant species and is associated with high levels of resistance to a wide range of pathogens and pests including bacteria, fungi, viruses, nematodes, parasitic plants and insects. Little is known about the control of HR after initiation, largely because it is so rapid and localized and therefore difficult to quantify. Here we use a mutant maize gene conferring an exaggerated HR to quantify HR levels in a set of 3,381 mapping lines characterised at 26.5 million loci to identify genes associated with naturally-occurring variation in HR. Many of these genes seem to be involved in a set of connected regulatory pathways including protein degradation, control of programmed cell death, recycling of cellular components and regulation of oxidative stress. We have also shown that several of these genes show high levels of expression induction during HR. The study provides the first comprehensive list of natural variants in maize genes that modulate HR and cluster within reported pathways underlying molecular events during HR.
Published in the journal:
. PLoS Genet 10(8): e32767. doi:10.1371/journal.pgen.1004562
Category:
Research Article
doi:
https://doi.org/10.1371/journal.pgen.1004562
Summary
The hypersensitive pathogen defense response (HR) in plants typically consists of a rapid, localized cell death around the point of attempted pathogen penetration. It is found in all plant species and is associated with high levels of resistance to a wide range of pathogens and pests including bacteria, fungi, viruses, nematodes, parasitic plants and insects. Little is known about the control of HR after initiation, largely because it is so rapid and localized and therefore difficult to quantify. Here we use a mutant maize gene conferring an exaggerated HR to quantify HR levels in a set of 3,381 mapping lines characterised at 26.5 million loci to identify genes associated with naturally-occurring variation in HR. Many of these genes seem to be involved in a set of connected regulatory pathways including protein degradation, control of programmed cell death, recycling of cellular components and regulation of oxidative stress. We have also shown that several of these genes show high levels of expression induction during HR. The study provides the first comprehensive list of natural variants in maize genes that modulate HR and cluster within reported pathways underlying molecular events during HR.
Introduction
Programmed cell death (PCD) can be defined as death of a cell mediated by intracellular signaling [1]. Apoptosis, the most common form of PCD in animals, is defined by certain hallmark characteristics including cellular shrinkage, ‘blebbing’ and nuclear fragmentation [2]. The other major form of programmed cell death identified in animals is autophagic cell death which has been defined as “a type of cell death occurring together with (but not necessarily by) autophagic vacuolization” [3]. Autophagy itself is the degradation of components of the cell through the action of lysozomes. As well as being involved in PCD, in many cases autophagy is regarded as a ‘pro-survival’ response, allowing cells to survive various types of stress [4].
PCD is perhaps best thought of as a complex of related processes and is important in many developmental processes in plants including leaf senescence, degeneration of cereal aleurone cells, development of tracheary elements in xylogenesis, and cell death in plant reproduction [5]. There is some discussion in the literature regarding the relationship between animal and plant PCD mechanisms. A recent review suggested that animal and plant PCD are not analogous and that two major types of plant PCD should be recognized: vacuolar cell death, characterized by the removal of cell contents by autophagy and the release of hydrolases from lytic vacuoles, and necrosis, characterized by early rupture of the plasma membrane and shrinkage of the protoplast [6].
The plant hypersensitive response (HR) is a key immune response of plants that confers resistance to almost every type of pathogen; bacteria, viruses, fungi, nematodes, insects and even parasitic plants [7]. HR is a form of PCD characterized by rapid, localized cell death at the point of attempted pathogen penetration, usually resulting in disease resistance [8]. It is often associated with other responses, including ion fluxes, an oxidative burst, lipid peroxidation and cell wall fortification [9]. Van Doorn et al [6] suggest that HR is a type of PCD sharing features with, but distinct from, both vacuolar cell death and necrosis.
HR is generally effective against biotrophic pathogens, since biotrophs require a long-term feeding relationship with living cells of the host. It is generally mediated by dominant plant resistance genes (R-genes) whose activation is triggered by the direct or indirect detection of specific pathogen effector proteins [10]. Crucially, R-proteins are maintained in their inactive state if their corresponding effector is not present. Mutants in which HR is constitutively active have been identified in many plant species, including maize [11], [12], Arabidopsis thaliana [13], barley (Hordeum vulgare) [14], and rice (Oryza sativa) [15].
Plant lesion mimics mutants, or lesioned mutants are a class of mutants that spontaneously form lesions (patches of dead cells) in the absence of any obvious injury, stress or infection to the plant. Since these lesions in some cases resemble HR or lesions casued by disease these mutaions have been termed disease lesion mimics [16]. In fact many of the genes underlying this mutant class are likely not involved in defense response pathways but are components of various pathways, all of which cause cell death if their function is perturbed [11]. For instance the Arabidopsis gene acd2 and the maize gene lls1 are defective in chlorophyll degradation [17], [18]. However several lesion mimic genes are indeed involved in the defense response in their wild type form. One such gene is derived from the Rp1 locus of maize.
The Rp1 locus on maize chromosome 10 carries multiple tandemly-repeated R-gene paralogs with characteristic coiled-coil, nucleotide-binding site and leucine-rich repeat (CC-NBS-LRR) domains, some of which confer resistance to specific races of maize common rust conferred by the fungus Puccini sorghi [19]. The locus is meiotically unstable due to a high frequency of unequal crossovers between paralogs [20]. Unequal crossing over followed by intragenic recombination resulted in the formation of the chimeric gene Rp1-D21 [21], [22]. In the Rp1-D21 protein, the recognition and elicitation functions are uncoupled, causing the spontaneous activation and formation of HR lesions on the leaves and stalks of the plant in the absence of pathogen recognition. Rp1-D21 has partially dominant gene action and its phenotypic effect is influenced by the environment, developmental stage and genetic background [21], [23]–[26]. In this and in past studies [23]–[25], [27] we make the explicit assumption that the cell death caused by Rp1-D21 is an exaggerated form of the HR that is, in normal circumstances, a response to pathogenesis. This assumption is based on a number of lines of reasoning: Most importantly Rp1-D21 is a typical CC-NB-LRR protein of the type that is often associated with HR-mediated resistance [10]. Rp1-D and several other alleles confer pathogen-dependent HR in maize and transgenic expression of Rp1-D21 confers a constitutive HR phenotype in maize [21]. Furthermore, we have shown that the cell death conferred by Rp1-D21 is associated with typical hallmarks of HR including the accumulation of salicylic acid (G-F Wang unpublished) and reactive oxygen species and the expression of pathogenesis-related genes [23], [25]. Finally Rp1-D21 mediated HR is temperature and light-dependent dependent [25], which is typical of HR associated with R-genes [25], [28]–[30].
Since the Rp1-D21 HR phenotype is an exaggerated defense response [23], it is likely that many or all of the genes that modify the aberrant Rp1-D21-associated HR are also associated with variation in the wild type defense response. Thus the Rp1-D21 phenotype can be used as a reporter for the identification of loci affecting the strength and severity of HR. This approach, in which a mutant phenotype is used as a reporter to reveal normally undetectable genetically-controlled variation, has been termed Mutant-Assisted Gene Identification and Characterization (MAGIC) [31].
In previous work [23], [24], [27], a maize inbred line (H95) into which Rp1-D21 was introgressed and maintained in a heterozygous condition (designated Rp1-D21-H95) was crossed with lines from several mapping populations. By phenotyping the resulting F1 families, several quantitative trait loci (QTL) modulating the HR conferred by Rp1-D21 were identified. A genome-wide scan of HR phenotypes scored on progenies of crosses between the heterozygous Rp1-D21 tester line and 231 diverse inbred lines of maize (constituting a high-resolution association mapping panel) identified six significantly associated SNPs, five of which are located within or immediately adjacent to candidate causative genes predicted to play significant roles in the control of programmed cell death and especially in ubiquitin pathway-related genes [27].
Here we have significantly expanded and refined this analysis by crossing Rp1-D21-H95 into a large sample of the maize nested association mapping (NAM) population, a 5000-member recombinant inbred line (RIL) population derived from 25 diverse parents [32]. Taking advantage of the power of joint linkage analysis and high-resolution of genome-wide association mapping in this population, we were able to characterize the genetic architecture controlling the maize HR in a comprehensive fashion. We identified a set of candidate genes implicating several regulatory pathways in controlling HR. These include mechanisms that regulate protein degradation, oxidative stress, lignin biosynthesis, PCD and autophagy. We have further shown that the expression of many of these genes is upregulated in the presence of the Rp1-D21 gene.
Results
Evaluation of HR-related phenotypes and correlation with disease resistance traits
The heritability estimates for the measured traits, lesion severity (LES), height ratio (HTR) and stalk width ratio (SWR) were all high, with line mean basis heritability ranging from 0.83 to 0.87, while for days to anthesis ratio (DTAR) it was 0.58 (Table S1). Line within population, population-by-environment interaction, and line-by-environment interaction within population were all significant contributors to variance for all traits. Figure S1 shows the distribution of phenotypic values across the subpopulations. The Rp1-D21-H95 mutant line which was crossed to the NAM recombinant inbred lines (RILS) to generate the F1 families that were scored, had a relatively severe HR phenotype with scores of 7.3, 0.47, 0.39 and 0.95 for LES, HTR, SWR and DTAR, respectively (for comparisons see Fig. S1).
NAM linkage, QTL and GWA analysis
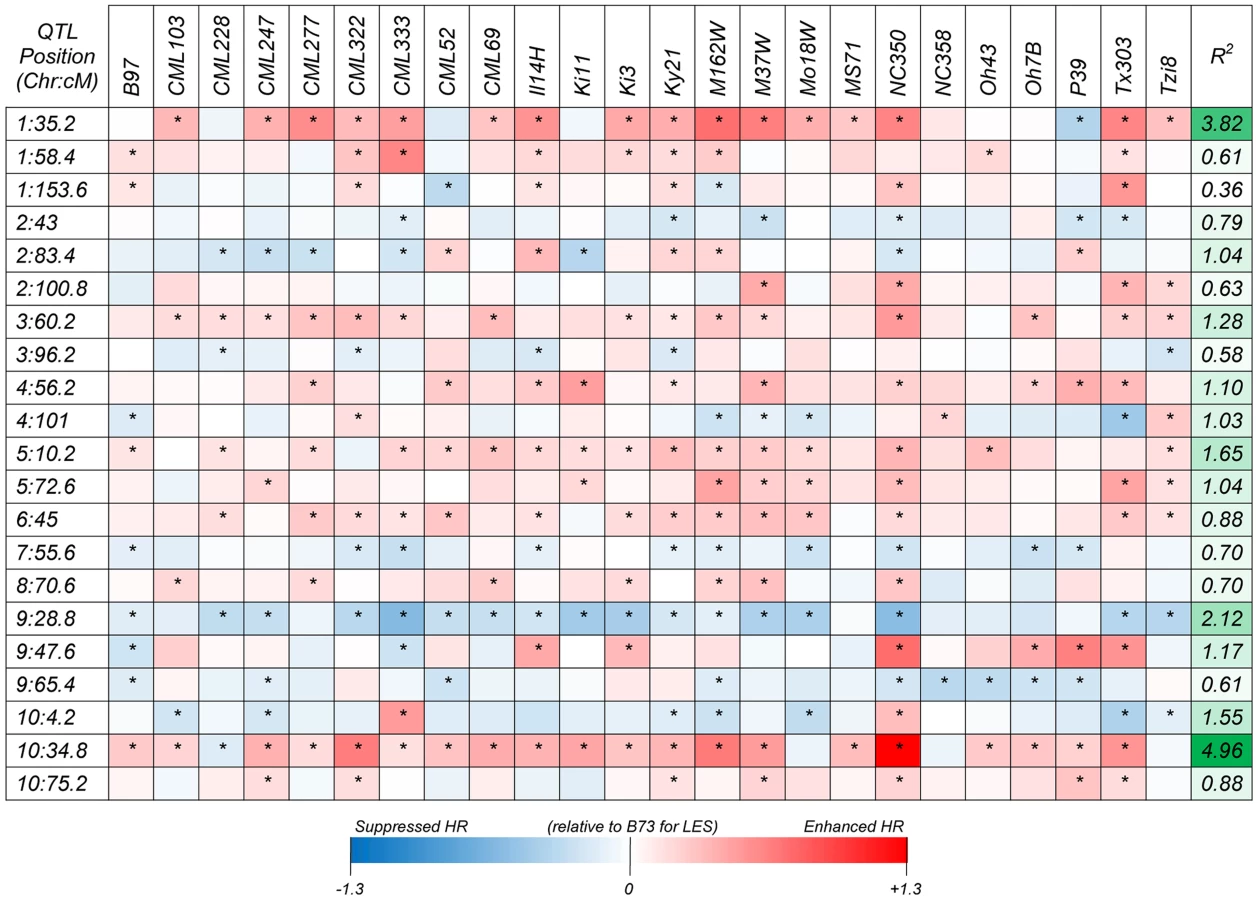
Following a joint family stepwise regression analysis of the HR-related traits, 21, 19, 22 and 7 QTL were detected for LES, HTR, SWR and DTAR, respectively (Fig. 1 and File S1). Altogether, 32 distinct non-overlapping QTL regions were identified. A total of six QTL overlapped across all four traits while 14 were unique to one trait (Fig. 1). For all four traits, two QTL, on chromosome 1 (QTL peak at about 35 cM) and 10 (QTL peak at about 34.5 cM) explained a high proportion of the phenotypic variance and showed high allelic effects in most of the 24 NAM sub-populations (Fig. 2, Fig. S2 and File S2). QTL on chromosomes 3, 5, 6, 9 and 10 with peaks at about 60, 11, 46, 29 and 4 cM, respectively, had significant allelic effects in more than half of the 24 NAM populations (Fig. 2, Fig. S2). Single family QTL analyses identified QTL with similar locations and effects as joint family QTL analysis, but identified more small effect QTL that were often specific to individual families (Fig. 3, Fig. S3). The major QTL on chromosome 1 (QTL peak at about 35 cM) and 10 (QTL peak at about 34.5 cM) accounted for as much as 35.3 and 38.5% of the phenotypic variation, respectively, within specific individual families (File S3).


Exhaustive two-dimensional searches for epistatic QTL interactions in the joint linkage model were performed for all four lesion mimic-derived traits. Only QTL interactions for LES, HTR and SWR passed the initial filter for putatively significant interactions (File 10). However, no epistatic QTL interactions were significantly associated (all p-values greater than permutation test-based thresholds) with traits when fit simultaneously with the additive joint linkage QTL.
Genome Wide Association (GWA) analysis identified more than one hundred SNPs with a resample model inclusion probability (RMIP) ≥0.25 (Table 1, Figure S4). In some cases, clusters of associated SNPs were identified within ∼100–2,000 bp of each other. In these cases we assumed that SNPs were all detected due to their linkage with the same causative gene and the SNP with the highest statistical significance was chosen as being representative of the cluster. Ultimately, 44 significantly associated SNPs, representing 44 distinct loci were identified in this way. Thirty-six of these SNPs were within 23 of the 32 non-overlapping QTL identifed by joint linkage analysis. Consistent with the QTL analysis, the most significant large effect QTL on chromsomes 1 and 10 harboured SNPs with lowest GWAS p values (as low as 1.89×10−36) and largest RMIP (as much as 0.95) and allelic effect values, indicating strong associations and higher contributions to the phenotype variance (Files S4,S5).
Candidate genes, transcript expression levels and associated pathways
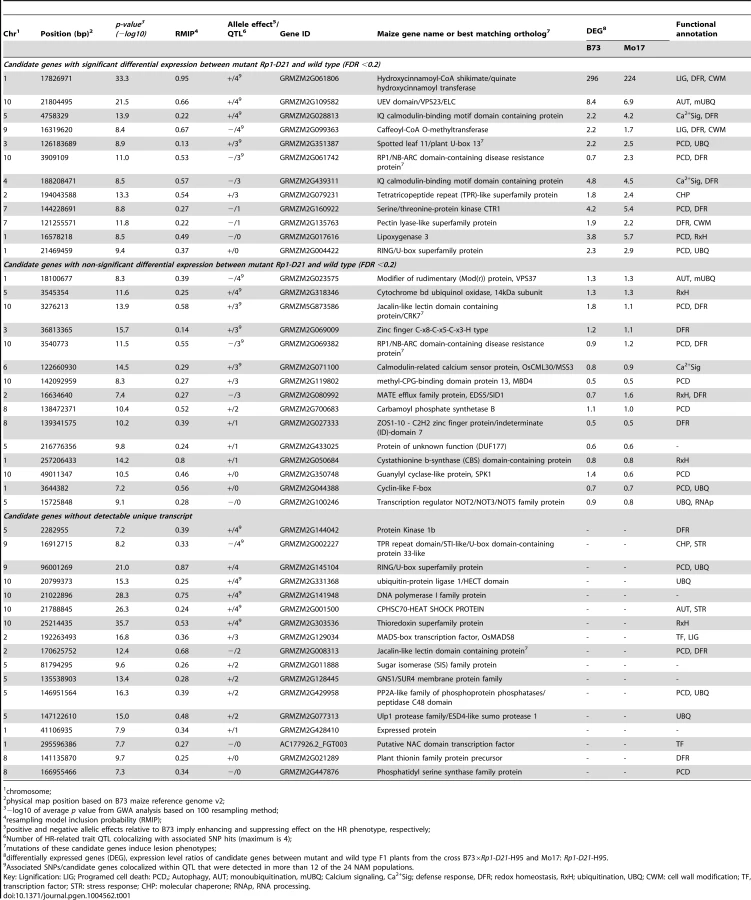
The closest predicted gene to each of the 44 SNPs was identified based on the publicly available maize genome (http://maizesequence.org, Table 1, File S5). Eleven of the 44 SNPs loci were within the coding region of the candidate genes, while the other 33 candidate genes were the closest predicted genes to each SNP, with physical map distances between the SNP and the candidate gene ranging from 33 bp to 83,325 bp (File S5).
Based on functional annotations of the candidate genes, we identified several groups of genes predicted to function in common pathways that have been associated with HR: PCD, autophagy, redox homeostasis, ubiquitin-mediated protein degradation, calcium signaling, lignin biosynthesis and the defense response (Table 1, File S5). Additionally, one of the associated SNPs was at the Rp1 locus itself.
Expression profiling was performed to compare gene expression in the leaves of 18-day old seedlings from near-isogenic lines with and without Rp1-D21 in B73×H95 and Mo17×H95 F1 hybrid backgrounds. Twelve of the 44 candidate genes were differentaily expressed (in all cases up-regulated in the presence of Rp1-D21) while 15 were not (Table 1, File S5). Unique transcripts were not detected for the remaining 17 candidate genes.
Correlations between HR-related traits and disease resistance traits
Correlation coeffecients were estimated between line mean values for the Rp1-D21-associated HR-related traits and three different maize disease resistance traits (Southern leaf blight - SLB, Northern leaf blight - NLB and Grey leaf spot - GLS) previously examined on the per se (i.e. not crossed to Rp1-D21-H95) NAM populations [33]–[35]. For the correlations with disease resistance traits, analysis was performed on pooled data from 24 NAM families (all the NAM families except HP301) and the IBM population (Table 2) and on each of the 25 biparental populations separately (Table S2). The HR-related traits were all highly significantly correlated with each other with correlation coefficients over the whole NAM population ranging from 0.70 to 0.89 (Table 2). With the exception of DTAR/GLS, the HR-related traits all showed highly significant (p<0.0001) but low correlations (range: 0.08 to 0.15) with all the disease traits (Table 2). In all cases, enhanced HR was associated with enhanced disease resistance. Correlations analyzed within individual NAM families varied substantially between families and traits (Table S2).
![Correlation coefficients between mean values of NAM RILs for lesion mimic traits and disease resistance score values obtained from previous studies (SLB, Kump et al. <em class="ref">[34]</em>; NLB, Poland et al. <em class="ref">[35]</em>; GLS, Benson <em class="ref">[33]</em>).](https://pl-master.mdcdn.cz/media/cache/media_object_image_large/media/image/f3753887a9fa8f9371c7d185cf72d99c.png)
The correlation between allele effect estimates for shared QTL between traits were also calculated (Table S3). Among shared QTL for HR-related traits, effects were highly correlated (range: 0.74–0.91, p<0.0001). Fourteen QTL co-localized between previously identified SLB QTL [34] and the HR-trait QTL (Figure 1). Effect estimate correlations were calculated on an individual QTL basis for each pair of colocalizing QTL. Only the QTL on chromosome 3 and 7 showed modest postive effect correlations (Table S4) while the chromosome 9 QTL effect estimates were negatively correlated, i.e. stronger HR was correlated with lower resistance. Of 11 QTL that colocalized between the HR-related QTL and NLB resistance QTL (Figure 1), only the QTL on chromosome 1 had significantly correlated effect estimates (Table S4).
Discussion
This report comprehensively describes the genetic architecture controlling natural variation in the HR defense response in maize. We have used the MAGIC procedure [31], in which modifiers of an ectopic HR phenotype conferred by the autoactive R-gene allele Rp1-D21 were mapped in a set of 3381 lines from the maize NAM population [32]. The modulation of wild-type HR would normally be unmeasurable since the reponse is so rapid and localized. Our approach exposes allelic variants regulating HR since the Rp1-D21 perturbs the system at the very onset of HR initiation. The approach we have taken here lacks the ability to detect loci at which the allele inherited from the reference line (H95) is dominant to both the parental alleles from the NAM population and masks potential functional variation. This can be addressed by employing different crossing schemes [31].
The measurements used to quantify the HR by necessity conflate several different possible effects on the HR phenotype,e.g. changes in lesion number, size and shape. It is difficult to assess these separate component traits in a robust way in large segregating populations over multiple environments. In previous work we had used image analysis of a smaller segregating population to try to achieve this [27]. However the analysis was both very time consuming and yielded traits with low heritabilities, unsuitable for quantitative analysis. It is likely that the different pathways identified will affect the HR in different ways and elucidation of this will require further detailed analysis.
The MAGIC approach has been used succesfully to map modifiers of HR in other recent studies [23], [24], [36], [37]. The major advances here are that the much larger size (about 11-fold higher), diverse genetic makeup of, and the detailed genotypic data available for the NAM population, allow us for the first time to comprehensively describe the genetic architecture and to identify a set of specific genes and pathways implicated in controlling the plant HR, specifically; redox homeostasis, lignin biosynthesis, calcium signalling, programed cell death, autophagy, ubiqutin-mediated protein degradation, interaction with other R-gene paralogs.
Correlation between disease resistance and HR severity
The heritability estimates observed for LES, HTR and SWR in the NAM population were very high (all >0.8 , Table S1) indicating a strong genetic influence on variation in these traits. The NAM population has been previously evaluated for disease resistance to SLB [34], NLB [35] and GLS [33]. Low but highly significant correlations were detected between the HR-related traits and the disease resistance traits over the entire NAM population (Table 2). Importantly, the correlations are in the same direction; increased HR was associated with increased resistance. At the level of individual QTL, the story was not as straight-forward. Of 14 and 11 QTL co-localizing between the HR-trait QTL and SLB and NLB QTL respectively only two and one respectively showed modest postive effect correlations between their allelic effects (Table S4) while the effects of an SLB QTL on chromosome 9 were negatively correlated with HR-traits, i.e. stronger HR was correlated with lower resistance. Overall it is clear that the majority of HR QTL do not coincide with a disease resistance QTL (of the three diseases assessed in NAM so far) or if they do, that the QTL have uncorrelated effects. Together with the low correlations over the entire population, this suggests the genetic control of these traits is substantially, though (importantly) not entirely, independent.
HR is mostly associated with resistance to biotrophic pathogens [38] while SLB, NLB and GLS are substantially necrotrophic [39]. We expect a stronger correlation would be found with resistance to a biotrophic disease. With this in mind, it is of note that the most biotrophic of the three diseases assessed, NLB [40] shows the highest correlations with HR. We would also expect to obtain stronger correlations if both traits had been measured in per se lines rather than disease resistance evaluated on per se lines and HR on F1 hybrids as was the case.
Necrotrophs can exploit the HR, sometimes triggering it ‘deliberately’ as part of their pathogenesis process [41], [42]. So it might seem counter-intuitive that enhanced HR is associated even at a low level with enhanced reistance rather than susceptibility to SLB and GLS in particular. However necrotrophy and biotrophy are two extremes of a continuum and the relationship between cell death and disease resistance or susceptibility is complex [43]. The causal agents of SLB and GLS (the fungi Cochliobolus heterostrophus and Cercospora zeae-maydis respectively) grow in the living plant for some time (∼1–2 days for SLB, ∼2 weeks for GLS) before any host cell death is apparent. It is likely that an HR or associated response at this ‘biotrophic’ stage of the disease would confer some resistance. The exploitation of HR by necrotrophic disease is a possible explanation for the negative effect correlations between the SLB and HR effects for the chromosome 9 QTL.
Joint linkage and individual population analysis
The joint linkage analyses identified 32 distinct non-overlapping QTL for all traits (Figure 1). The variable effect estimates for most QTL alleles across poulations implies the presence of alleleic series at most QTL postions (Fig. 2, Fig. S2, File S2). Most of the QTL had small effects, but two QTL on chromosomes 1 (peak at ∼35 cM) and 10 (∼34.5 cM) had major contributions to phenotypic variance with R2 values as high as 32 and 37%, respectively in specific populations (File S2, Fig. 2, Fig. S2). The single population analyses largely confirmed the joint-linkage analysis results with additional small effect QTL identified in specific populations. All QTL previously identified in the IBM [23], [24] and 3 NAM mapping populations [24] were detected in our current study.
The additive effects of QTL reflect their average effects over segregating genetic backgrounds, and thus across many possible epistatic interactions [44]. We did not find any QTL - QTL interactions that explained significant variation in lesion mimic-derived traits beyond what was already explained in the additive joint linkage QTL model. This result is congruent with results from other complex quantitative traits analyzed with NAM [34], [45]–[47]. Statistical epistasis is a more general concept than functional epistasis [48] and depends on allele frequencies in the study population. QTL - QTL interactions can be difficult to detect even when the genes underlying QTL interact epistatically in regulatory or biochemical pathways [44]. Thus, our inability to detect such statistical interactions does not imply that the causative genes do not interact epistatically in a functional sense.
Genome-wide association analyses
The NAM population was specificaly designed for high-resolution dissection/fine mapping of QTL [49] as implemented with GWA analysis [34], [35], [50], [51]. Linkage disequilibrium and hence mapping resolution will vary across the genome and the closest gene to an associated SNP may not always be the causal gene [e.g. 52]. Also, it is well known that gene complements vary significantly between lines, so that the causal gene may not always be present in the sequenced B73 genome [53]. Still, previous NAM GWA studies and validation with fine mapping/positional cloning in independent near-iosgenic line (NIL) populations demonstrate resolution in some cases is sufficient to identify causative genes such as DGAT, a key determinant of oil content [50], [54] and the flowering time gene VGT1 [55], [56]. Furthermore, in this study we used a substantially more detailed genetic map than was used in these previous studies (7386 SNPs used for joint linkage compared to 1106 previously, ∼26 million used for GWA (see Materials and Methods and [57]) compared to ∼1.6 million previously) and complemented the GWA analysis with transcriptome profiling to compare gene expression between near isogenic hybrids differing for Rp1-D21 in two hybrid backgrounds (B73×H95 and Mo17×H95).
Forty-four significantly associated SNP loci were identified (Table 1, Figure S4, File S5), 36 of which mapped to one of the QTL identifed by joint linkage analysis. The large-effect QTL on chromsome 1 and 10 harboured SNPs with lowest p values (as low as 1.89×10−36; Table 1, File S5) and highest RMIP (up to 0.95) and allelic effect values, indicating strong associations and high contributions to the phenotype variance. In some cases and particularly in QTL with large confidence intervals, GWA identified more than one associated genomic region within a single QTL. A previous publication [27] used the 231 lines from the maize association population [58] and identified 6 SNPs significantly associated with variation in HR (Fig. 1). Of these, the three with the largest effects were closely linked on chromosome 10 at 21.7–21.8 Mbp, in precisely the same position as the major QTL and SNP identified in this study. However, the other three SNPs identified by Olukolu et al [27], on chromosomes 5, 7 and 9, were not identified in the present study. While the 26 parents of the NAM population are a subset of the maize association population and were chosen to maximize the included diversity, a substantial amount of the diversity present in the association population is not included in the NAM population. It is possible that the causal polymorphisms underlying these SNP on chromosomes 5,7 and 9 were simply not segregating in the NAM or were segregating in only one or two populations, making their effects hard to detect. This does point out an obvious limitation in any study of this type that aims to describe the genetic architecture underlying natural variation in a trait; namely, only variation captured among the original parental lines of the population used can be detected. The NAM parental lines capture about 57% of the variation captured amongst 2,815 maize inbred accessions collected from maize breeding programs all over the world [59]. Furthermore alleles that segregate in only one or two of the 25 subpopulations that comprise the NAM population may not be detected by joint analysis or GWA due to lower power. In these cases, single population analysis may be more effective in identifying rare but important QTL. Figures 3 and S3 illustrate this point quite clearly. Two of the three SNPs identified by Olukolu et al [27] that were not identified in the present study, on chromosomes 7 and 9, were within QTL identified in individual population analyses (TX303 and NC358 families, respectively) but not in the joint analysis (File S2, S3, Fig. 3, Fig. S3).
Candidate genes and underlying pathways
Remarkably, most of the 44 candidate genes identified are predicted to function in a discrete set of interconnected pathways associated with functions that a priori would seem likely to be involved in HR, including programmed cell death, defense response, ubiquitination, redox homeostasis, autophagy, calcium signalling, lignin biosynthesis and cell wall modification (Table 1). Furthermore, the expression of many of these genes were upregulated in the presence of Rp1-D21.
Lignification of cell walls is an important part of the HR defense response and inhibtion of lignin bisynthesis has been shown to reduce the effectiveness of HR and resistance [60], [61]. Lignin depositon is usually observed in the cells around the point of HR initiation [62]. The hydroxycinnamoyl-CoA shikimate/quinate hydroxycinnamoyl transferase (HCT) gene is the gene closest to the most highly associated SNP (RMIP = 0.95) and is predicted to be involved in lignin biosynthesis. It is the most differentially upregulated candidate gene in the Rp1-D21-carrying compared to the wild type hybrids in both backgrounds tested (296-fold in B73×H95 and 224-fold in Mo17×H95, Table 2). A second candidate gene, caffeoyl-CoA O-methyltransferase (CCoAOMT), is also predicted to be involved in lignin biosynthesis downstream in the pathway from HCT [63]. This gene was also significantly upregulated in NILs carrying Rp1-D21. The same CCoAOMT gene was also identified as a candidate gene for SLB resistance [34]. The allele effect estimates for the SLB resistance and the HR-related QTL at this locus are negatively correlated, i.e. increasing strength of HR is correlated with reduced levels of SLB resistance. This may be an example where an allele that enhances HR can be exploited by a necrotroph that can grow on dead tissue, as discussed above.
Several studies have implicated autophagy in plant immunity and HR [64]. In particular, it has been shown to be important for restricting the spread of plant HR cell death [65], [66]. The ability of cells to remove damaged organelles/cellular components and recycle them during stress and nutrient starvation is an essential rescue mechanism for cells to escape from the progression of cell death [67]. This pro-survial mechanism might be particularly important for resistance against necrotophic pathogens that promote cell death for nutrition [68], [69]. Conversely, autophagy has been implicated as a pro-death signal in HR triggered by certain R-genes in Arabidopsis [70]. These apparently contradictory roles of autophagy in plant cells have also been noted in the animal autopahagy literature [71].
Of the three candidate genes identified in this study with predicted roles in autophagy (Table 1), only the UEV domain/VPS23/ELC gene, located in the major QTL on chromosome 10, was significantly upregulated in NILs carrying Rp1-D21. The other autophagy-related candidate genes include modifier of rudimentary (Mod(r)) protein/VPS37 and heat shock cognate 70 (HSC70). Both the UEV domain/VPS23/ELC and VPS37 genes (VPS stands for vacuolar protein sorting) are predicted to be involved in the biogenesis of multivesicular bodies (MVBs) and endosomal sorting of membrane cargo [72], [73]. ESCRT-I, a 350-kDa protein complex, comprises class E VPS proteins, VPS23, VPS28, and VPS37, that are required for binding and sorting of mono-ubiquitinated MVB cargoes, an interaction that seems to occur via the VPS23 subunit (a ubiquitin E2 variant) and the chaperone HSC70 [74], [75]. Damaged proteins that are targeted to the MVB membrane by VPS23 and VPS37 become internalized through the invagination of the outer membrane and finally fuse with the vacoule or lysosome where damaged proteins are degraded by the luminal proteases [72], [73].
Sixteen of the candidate genes have predicted roles in a PCD. The expression of five of these genes was upregulated in NILs carrying Rp1-D21. The Rp1-D21 phenotype is more severe in the Mo17×H95 background than in the B73×H95 backgound [23]. In this context, it is interesting to note that in all five cases, the genes were more up-regulated in the Mo17×H95 background. These five candidate genes include Spotted leaf 11 (SPL11)/plant U-box 13 (PUB13), RP1/NB-ARC domain-containing disease resistance protein, Serine/threonine-protein kinase CTR1, Lipoxygenase 3 (LOX3) and a RING/U-box superfamily protein. Homologs of three of these genes are involved directly or indirectly in the induction of a spontaneous HR similar to the phenotype in this study. The A. thaliana SPL11/PUB13 encodes a U-Box/Armadillo repeat protein with a E3 ubuqitin ligase activity and plays a role in the ubiquitination pathway. Mutations in this gene confer a spontaneous cell death phenotype and enhanced non-race-specific resistance to both Magnaporthe grisea and Xanthomonas oryzae pv oryzae [76]. Deletion of CTR1 gene, a negative reglator of the ethylene signaling pathway, was shown to lead to amplification of the spontaneous cell death and defense phenotypes of the A. thaliana vad1 (for vascular associated death 1) mutant [77]. The RP1/NB-ARC domain-containing candidate gene is a paralog of the Rp1-D21 gene used in this study and is located in the same complex Rp1 locus [19]. The fact that we identified a candidate in this region implies that Rp1 proteins may act as heterodimers so that the activity of one paralog is affected by the presence or absence of others. There is considerable evidence in the literature for these types of interactions [78]–[80]. A pepper ortholog of the two closely related Jacalin-like lectin domain-containing candidate genes has been shown to play a role in cell death and disease resistance in both pepper and A. thaliana [81].
The LOX3 gene is predicted to be involved in the mediation of PCD as well as disruption of redox homeostasis. LOX3 encodes an enzyme that dioxygenates unsaturated fatty acids , subsequently triggering lipoperoxidation of the cell membrane and synthesis of signaling molecules. The ensuing signaling results in structural and metabolic cellular changes in several pathopysiological conditions. The effect of the lipoperoxidation and the hydroperoxides by-product have been reported to induce pro-apoptotic conditions leading to HR cell death [82], [83]. Lipoxygenase genes have also been implicated in increased resistance to fungal pathogens [84].
Ubiquitin-mediated protein degradation pathways have recently emerged as major players in the regulation of R-gene mediated HR and plant immunity [85]. It is interesting therefore that nine of the candidate genes identified in this study as well as two other candidate genes identified in a previous study [27] have predicted roles in this pathway. Of particular interest here are examples for which the stability of canonical NBS-LRR type R-genes is regulated by ubiquitin-dependant mechanisms, conferring direct effects on R-gene function. Probably the best example of this is the case of the F-box gene CPR1 [86], a gene that determines the specificity of the SCF ubiquitin E3 ligase complex. CPR1 targets the R-gene RPS2 and the NBS-LRR R-gene homolog SNC1 for degradation. The protein accumulation, but not the corresponding steady state transcript level of both RPS2 and SNC1 increase substantialy in cpr1 mutants and are reduced in CPR1 overexpressing lines (with a corresponding loss of immunity conferred by these genes).
Finally, three candidate genes were predicted to be involved in calcium signalling and five in redox homeostasis. Increases in cytoplasmic calcium have been associated with HR in a number of studies [87]–[89], while blockers of calcium channels and cyclic nucleotide gated channels (CNGC, the opening of which are modulated by calcium) can inhibit HR-mediated cell death [89]–[91]. The role of oxidative stess in HR is very well documented in the literature. An ‘oxidative burst’, the rapid generation of superoxide and accumulation of H2O2 is one of the first events described after elicitation of the HR [92]. The detoxification of reactive oxygen species can delay HR [e.g. 93]. Importantly calcium influx and reactive oxygen accumulation in HR appear to be mutually-dependent processes in some cases [90], [94].
In conclusion, in this study we have combined the gene-mapping power of the NAM population with the ability of the MAGIC technique to render quantifiable a previously inaccesible (though very important) phenotype. We have identified a relatively small set of candidate genes that strongly implicate a few key pathways in controlling the strength of the HR associated with Rp1-D21. In some cases expression analyses reinforce these conclusions. Roles for all these pathways in the control of programed cell death and HR have been demonstrated previously in the literature. While some of the loci/pathways identified may be specific to Rp1-D21 –induced HR or to a subset of HRs induced by specific R-genes, we believe that most of are involved in HR more generally. In fact, all these pathways have been implicated in HR in other species and all were implicated by recent work that examined system-wide induced HR in tomato [95]. This work provides the most comprenensive understanding of the genetic control of the plant HR to date. Further work will attempt to dissect these effects further, to validate the genes and determine which aspect of HR, intiation, signal transduction, excecution or containment, they affect.
Materials and Methods
Plant materials
An Rp1-D21-H95 mutant line was generated from a cross between an Rp1-D21 variant and the maize inbred line H95. The ensuing F1 progeny was then backcrossed to the H95 parent four times, while selecting for the HR phenotype marked by spontaneous lesion formation. Since the homozygous Rp1-D21-H95 mutant lines are sterile, it was maintained in a heterozygous state. For further details of this line see Chaikam et al [24]. The Rp1-D21-H95 line was crossed as a male to each of 3,381 lines from nested association mapping (NAM) population and to 225 lines from the IBM population [96] to create a set of F1 families, each of which segregated 1∶1 (wild type:mutant) for the presence and absence of the Rp1-D21-induced HR phenotype but which were otherwise isogenic within a family.
Development of the maize (NAM) populations has been previously described [32], [56]. This study used a subset from the NAM population that is comprised of 25 bi-parental RIL populations with B73 as a common parent and 200 lines in each population. The B73×HP301 population was not included in our panel of 3,381 lines since HP301 and about 88% of the derived lines in this population carry the ga1cross-incompatibility gene, making it very difficult to obtain F1 seed from these lines used as female parents [97]. The selection of 3,381 F1 families was based on the availability of seed. F1 crosses derived from the IBM population were also included in the correlation analysis part of this study but excluded from the joint linkage and genome-wide association (GWA) analysis.
Field trials
Each of the 3,606 F1 families (including 225 IBM lines) was evaluated in four environments that comprised two locations (Clayton, NC and West Lafayette, IN) and 2 years (2011 and 2012), with single replicate of the NAM RILs in each location. An augmented randomized incomplete block design was implemented with the Rp1-D21-H95 as repeated check to provide an estimate of experimental error. Each NAM family was assigned to a block and a total of 10 sub-blocks within each family block. The Rp1-D21-H95 check was included in each of the 10 blocks in each NAM family and in each location. Two rows of a constant genotype were planted around the edges of the field to minimize border row effect. Standard fertilizer, pesticide and herbicide regimes were applied during the trial to ensure normal plant growth. Thinning to desired plant density and overhead irrigation were applied as required. At Clayton, NC, 12 kernels of each line were sown in 2 m rows with an inter-row spacing of 0.97 m and a 0.6 m alley at the end of each plot, while at West Lafayette, IN, 18 seeds were sown in 6 m rows with an inter-row spacing of 0.76 m.
Phenotypic evaluations
Four lesion-associated traits, lesion severity (LES), mutant to wild type height ratio (HTR), mutant to wild type stalk width ratio (SWR), and mutant to wild type days to anthesis ratio (DTAR) were scored. Each F1 family segregated 1∶1 for the presence and absence of Rp1-D21 but was otherwise isogenic. Within a family it was immediately obvious, by the presence or absence of lesions and by the growth habit of the plant, which plants carries Rp1-D21 and which were wild-type. For the LES trait, only plants carrying Rp1-D21 were scored, while for HTR, SWR and DTAR, both wild type and mutant classes were phenotyped separately and ratios between them derived.
Lesion severity (LES)
In all environments, lesion severity scores were assigned based on a scale of 1 to 10 (Figure S5), with “1” representing very few lesions and “10” indicating a completely dead plant [24]. Experiments were scored five times at Clayton, NC in both 2011 and 2012. At West Lafayette, IN, plants were scored six and four times in years 2011 and 2012, respectively. Scoring was started one month after planting and continued at approximately 10–14 day intervals.
We scored an aberrant HR defense response rather than a disease symptom in this case, but since the lesion phenotypes are generally similar to disease lesions, we applied a widely-accepted statistic in plant pathology; standardized area under disease progress curve (sAUDPC), to quantitatively measure HR severity [98]. For each environment, the sAUDPC for LES was calculated as follows: The average value of two consecutive ratings was computed and multiplied by the number of days between the ratings. Values were summed over all intervals, and then divided by the total number of days over which evaluations were performed to determine the weighted average.
Mutant to wild type height ratio (HTR)
Plant height data were collected after flowering from three representative mutant F1 individuals and from three representative wild type F1 individuals within each F1 family. Height means were calculated for each class within each family and the HTR was calculated by dividing the average mutant type height to the average wild type height.
Mutant to wild type stalk width ratio (SWR)
Stalk width immediately above the primary ear was measured on three representative mutant F1 individuals and three representative wild type F1 individuals within each F1 family. SWR was then calculated by dividing the average mutant stalk width to the wild type average stalk width.
Mutant to wild type days to anthesis ratio (DTAR)
Plants were monitered every other day for the date when 50% of the wild type and 50% of the mutant plants in an F1 family were shedding pollen. The days from planting to anthesis were computed for the wild type and the mutant plants in each family. DTAR was then calculated by dividing the days to anthesis for mutants by days to anthesis for wild type plants.
Disease scores
Disease scores for SLB (southern leaf blight; Cochliobolus heterostrophus), GLS (gray leaf spot; Cercospora zeae-maydis) and NLB (northern leaf blight; Exserohilum turcicum) were obtained from previous studies [33]–[35]. These data were used to evaluate the correlation between disease resistance and HR severity in response to Rp1-D21 aberrant phenotype (lesion mimics).
Statistical analysis of phenotypic data
The least square (LS) mean data used for analysis can be found in File S6. File S7 and Figure S1 gives the metadata for each of the populations. To obtain least square mean values adjusted for environmental effects, data were analyzed with a mixed model considering line as a fixed effect and environment, block within environment, population by environment and line-by-environment interaction within population as random effects using Proc Mixed in SAS v9.3 [99]. The REML Wald's Z statistic was used to test the significance of each random factor in the model [100]. Least squares means for lines were estimated from this mixed model and used as the input phenotype for association analysis. For the purpose of estimating heritability, a mixed model with all factors, including lines, as random effects was used. Correlations between disease scores (SLB, GLS and NLB) and lesion mimic traits for each line were estimated using Proc Corr in SAS v9.3 [99]. The NAM sub-population groups, considered as a covariate, were accounted for during correlation analysis.
Genotypic data, SNP imputation and SNP Projection
A total of 7386 SNP markers scored on all 4892 available NAM RILs were used for linkage and QTL analyses (Files S8, S9). The marker values were imputed at 0.2 cM intervals based on SNP calls made from short sequence reads using the GBS protocol [101]. Briefly, each sample was digested with the ApeK1 restriction enzyme, PCR amplified, multiplexed, sequenced and then processed through a custom SNP calling pipeline. Because the sequence coverage was low, about 0.5×, two problems arose; First, many sites had more than 50% missing data, and, second, at many heterozygous sites only a single allele of the two possible alleles was detected. As a result, about 80% of the heterozygous sites were scored as homozygous. To deal with these issues, each SNP call was first scored as either the B73 or non-B73 parent. Then the Viterbi algorithm was applied to the resulting sequence to identify probable heterozygous loci and genotype calling errors. Sites were then chosen at 0.2 cM intervals and values for each site imputed as 2 (probability allele came from the non-B73 parent) based on the nearest non-missing flanking markers. Where both flanking markers came from the same parent the value was either 0 or 2. Where the markers came from different parents, the value was intermediate and based on the relative distance from the two markers [59].
For the GWA analysis, a total of about 26.5 million SNPs polymorphic among the NAM founder lines were obtained from the HapMapv2 project [57]. The data at each locus are comprised of two alleles per SNP, with the minor alleles set to 1 and everything else to 0. The data were recoded to reduce computational time during projection by setting B73 alleles (common parental allele) to 0 and non-B73 alleles (alternate allele) to 1. Projection of the 26.5 million HapMap v2 NAM founder genotypes on the NAM RILs was performed based on the genotype of the RIL's diverse founder/parental lines at each of the 26.5 million HapMap v2 SNP, and an individual RIL's genotype calls at the NAM SNP markers flanking the physical position of the HapMap v2 SNP. Because we used the high density 7386 NAM SNP marker linkage map, each interval was only 0.2 cM in genetic distance, permitting very accurate imputation of HapMap v2 SNPs. If the diverse founder/parental line has the same homozygous allele as B73 at both flanking loci, the RIL genotype is assigned a B73 allele (coded as 0) for a SNP position. When the diverse founder/parental line carries an alternate/non-B73 allele homozygous at both flanking loci, the probability that the RIL carries the alternate allele is computed as the weighted average of the flanking mapped NAM SNP genotype, with the weights assigned based on the relative physical position of the HapMap SNP within the interval. This is computed as:

Single family and joint family linkage analysis
The single/independent population QTL analysis was performed based on composite interval mapping (CIM) and implemented in the Windows QTL Cartographer software v2.5 [102]. Permutation tests set to an alpha-level of 0.05 were performed to determine population and trait specific LOD thresholds at aprroximately 3.0. Linkage and QTL maps were prepared using the MapChart software v2.2 [103].
Joint-linkage mapping was implemented as previously described [56]. Before the joint stepwise regression procedure in PROC GLMSELECT was implemented in SAS software v9.3, LOD thresholds were established following 1,000 trait-dependent permutation tests based on alpha set at 0.05 with the model containing a family main effect. Trait specific QTL LOD thresholds of 5.44, 5.00, 4.27 and 8.34 were obtained and applied to detect QTL for LES, HTR, SWR and DTAR, respectively. The model included family main effects and a single marker effects nested within families. The lowest resulting p value among marker tests was obtained for each permutation.
Following initial detection of QTL loci, the stepwise regression model was optimized with an iterative process by sequentially dropping a marker in the model, testing the fit of adjacent markers until the eighth marker (1.6 cM away) from the originally selected marker, and fitting the best marker in the region back into the model. Allele effects at each marker included in the final model were estimated simultaneously using the solution option of Proc GLM in SAS software v.9.3. The t-tests of the null hypothesis of zero allele effect were performed for each NAM founder allele effect at each QTL. The QTL support intervals were computed in the SAS software v.9.3 by adding a single flanking marker to the full model one at a time from the QTL at a step of 0.2 cM. This was performed at the left and right side of the QTL. The support interval boundary was considered to be the last marker at which the QTL regained significance at the p = 0.05 level.
To test for significant digenic epistatic interactions, a subset of 1409 SNP markers were obtained from the available 7386 SNP markers at uniform 1 cM intervals and all pairwise combinations of the 1409 markers were tested separately using models that included population main effects, the two marker main effects nested in populations, and the marker-marker interaction nested in populations by extending the method of Holland [104]. The analysis was performed across the 24 NAM families while the trait-specific QTL LOD thresholds were estimated based on a permutation test at a critical value with alpha less than 5%. Marker pair interactions with p-values less than the permutation test-based threshold were considered for inclusion in the final joint linkage model without regard to the signficance of the main effects of the markers. Each such pair of markers and their interaction were added to the final additive joint linkage model one at a time; the p-value of the interaction in this full model was used to determine if the epistatic interaction improved the model fit.
Genome-wide association analysis
GWA models were fit for each chromosome, one at a time. For each chromosome, line residual values from the final joint linkage QTL model excluding all markers on the chromosome under consideration were computed in SAS software v.9.3. Using 26.5 million SNPs, GWA (genome wide association) analysis was performed based on forward regression of the HapMap v2 SNPs to subsamples of these phenotypic residual values adjusted for QTL on other chromosomes. To identify SNPs with the most robust associations with traits, we implemented a subsampling (subagging) procedure during the GWA analysis [105], with forward regression (using a p-value threshold for inlcusion in the model of 1×10⁻⁶ [106]) performed in each of 100 subsample datasets. Each subsample dataset comprised 80% of the RILs from each NAM family [34], [51]. A population main effect was included in the model prior to the addition of SNP terms during the forward selection. The effect estimate of each significant SNP in each subsample was also computed and averaged over the 100 subsamples. The resample model inclusion probability (RMIP) was computed for each SNP as the proportion of subsample data sets in which it was included in the final regression model. Only SNPs with RMIP >0.05 are shown on the Manhattan plot. Following Valdar et al. (2006), an RMIP threshold of 0.25 was used to report the most robust SNP associations.
Candidate gene selection
Genes co-localizing with or adjacent to associated SNPs were determined using the maize B73 reference genome assembly v2 available on the MaizeGDB genome browser [107] or the www.maizesequence.org genome browser [108]. Functional annotations of the candidate genes were determined using blastp [109], conserved domain search tools [110] and annotations avialble at the Maize Genome database (http://gbrowse.maizegdb.org/gb2/gbrowse/maize_v2/). Further annotation was achieved by inspection of the literature specific to each gene and domain (File S5).
RNA-seq library construction, data processing and differential expressed gene analysis
Wild-type (WT) and mutant plants in B73×Rp1-D21-H95 and Mo17×Rp1-D21-H95 backgrounds growing in constant 22°C with 12 h-day/12 h-dark were used for RNA extraction. The 3rd true leaves of 5 individual seedlings collected from 18-day old WT or mutant plants were pooled and total RNA was isolated using Trizol reagent (Life Technologies) according to manufacturer's instructions. RNA concentration and quality were monitored by the NanoDrop and agarose gel electrophoresis. mRNA was isolated from the total RNA by Dynabeads oligo(dT) (Life Technologies) following manufacturer's directions. RNA-seq libraries were constructed according to the TruSeq RNA Sample Prep v2 LS protocol (Illumina) and sequenced using the Illumina HiSeq 2000. Two biological replicates, each consisting of 5 individual plants, and two technical replicates (two lanes) were performed, with 100 nt single end reads. The sequences were aligned to maize genome sequence v2 (www.maizegdb.org) via TopHat 2.0 [111], using all the default parameter settings. The raw counts per gene were calculated using in-house scripts. Only reads with unique alignments were maintained for subsequent analyses. Genes with total read counts less than 20 were filtered out. Differentially expressed genes (DEGs) were identified using the software package edgeR from the Bioconductor suite [112]. To account for multiple testing, the procedure of Benjamini and Hochberg [113] for controlling the false discovery rate (FDR) was applied using a threshold of q< = 0.05 to determine significance.
Supporting Information
Zdroje
1. VauxDL, KorsmeyerSJ (1999) Cell death in development. Cell 96 : 245–254.
2. CohenJJ, DukeRC, FadokVA, SellinsKS (1992) Apoptosis and programmed cell death in immunity. Ann Rev Immunol 10 : 267–293.
3. KroemerG, GalluzziL, VandenabeeleP, AbramsJ, AlnemriES, et al. (2008) Classification of cell death: recommendations of the Nomenclature Committee on Cell Death 2009. Cell Death & Differen 16 : 3–11.
4. GalluzziL, MorselliE, VicencioJM, KeppO, JozaN, et al. (2008) Life, death and burial: multifaceted impact of autophagy. Biochem Soc Trans 36 : 786–790.
5. KuriyamaH, FukudaH (2002) Developmental programmed cell death in plants. Curr Opin Plant Biol 5 : 568–573.
6. Van DoornW, BeersE, DanglJ, Franklin-TongV, GalloisP, et al. (2011) Morphological classification of plant cell deaths. Cell Death & Differen 18 : 1241–1246.
7. WuJ, BaldwinIT (2010) New insights into plant responses to the attack from insect herbivores. Ann Rev Genet 44 : 1–24.
8. CollNS, EppleP, DanglJL (2011) Programmed cell death in the plant immune system. Cell Death Differ 18 : 1247–1256.
9. Hammond-KosackKE, JonesJ (1996) Resistance gene-dependent plant defense responses. Plant Cell 8 : 1773–1791.
10. BentAF, MackeyD (2007) Elicitors, effectors, and R Genes: The new paradigm and a lifetime supply of questions. Anne Rev Phytopath 45 : 399–436.
11. JohalGS (2007) Disease lesion mimic mutants of maize. American Phytopath. Soc Feature Story http://www.apsnet.org/online/feature/mimics/.
12. Walbot V, Hoisington D, Neuffer MG (1983) Disease lesion mimic mutations. In: Kosuge T, Meredith CP, Hollaender A, editors. Genetic Engineering of Plants. New York: Plenum Press. pp. 431–432.
13. LorrainS, VailleauF, BalagueC, RobyD (2003) Lesion mimic mutants: keys for deciphering cell death and defense pathways in plants? Trends Plant Sci 8 : 263–271.
14. WolterM, HollricherK, SalaminiF, Schulze-LefertP (1993) The mlo resistance alleles to powdery mildew infection in barley trigger a developmentally controlled defence mimic phenotype. Mol Gen Genet 239 : 122–128.
15. YinZ, ChenJ, ZengL, GohM, LeungH, et al. (2000) Characterizing rice lesion mimic mutants and identifying a mutant with broad-spectrum resistance to rice blast and bacterial blight. Mol Plant Microbe Interact 13 : 869–876.
16. NeufferMG, CalvertOH (1975) Dominant disease lesion mimics in maize. J Heredit 66 : 265–270.
17. GrayJ, ClosePS, BriggsSP, JohalGS (1997) A novel suppressor of cell death in plants encoded by the Lls1 gene of maize. Cell 89 : 25–31.
18. MachJM, CastilloAR, HoogstratenR, GreenbergJT (2001) The Arabidopsis-accelerated cell death gene ACD2 encodes red chlorophyll catabolite reductase and suppresses the spread of disease symptoms. Proc Nat Acad Sci 98 : 771–776.
19. HulbertSH (1997) Structure and evolution of the Rp1 complex conferring rust resistance in maize. Ann Rev Phytopath 35 : 293–310.
20. SudupakMA, BennetzenJL, HulbertSH (1993) Unequal exchange and meiotic instability of disease-resistance genes in the Rp1 region of maize. Genetics 133 : 119–125.
21. SmithS, SteinauM, TrickH, HulbertS (2010) Recombinant Rp1 genes confer necrotic or nonspecific resistance phenotypes. Mol Genet Genomics 283 : 591–602.
22. CollinsN, DrakeJ, AyliffeM, SunQ, EllisJ, et al. (1999) Molecular characterization of the maize Rp1-D rust resistance haplotype and its mutants. Plant Cell 11 : 1365–1376.
23. ChintamananiS, HulbertSH, JohalGS, Balint-KurtiPJ (2010) Identification of a maize locus that modulates the hypersensitive defense response, using mutant-assisted gene identification and characterization. Genetics 184 : 813–825.
24. ChaikamV, NegeriA, DhawanR, PuchakaB, JiJ, et al. (2011) Use of mutant-assisted gene identification and characterization (MAGIC) to identify novel genetic loci that modify the maize hypersensitive response. Theor Appl Genet 123 : 985–997.
25. NegeriA, WangG-F, BenaventeL, KibitiC, ChaikamV, et al. (2013) Characterization of temperature and light effects on the defense response phenotypes associated with the maize Rp1-D21 autoactive resistance gene. BMC Plant Biol 13 : 106.
26. HuG, RichterTE, HulbertSH, PryorT (1996) Disease lesion mimicry caused by mutations in the rust resistance gene Rp1. Plant Cell 8 : 1367–1376.
27. OlukoluBA, NegeriA, DhawanR, VenkataBP, SharmaP, et al. (2013) A connected set of genes associated with programmed cell death implicated in controlling the hypersensitive response in maize. Genetics 193 : 609–620.
28. ChengC, GaoX, FengB, SheenJ, ShanL, et al. (2013) Plant immune response to pathogens differs with changing temperatures. Nat Commun 4 : 2530.
29. ZhuY, QianW, HuaJ (2010) Temperature Modulates Plant Defense Responses through NB-LRR Proteins. PLoS Pathog 6: e1000844.
30. AlcázarR, ParkerJE (2011) The impact of temperature on balancing immune responsiveness and growth in Arabidopsis. Trends Plant Sci 16 : 666–675.
31. JohalGS, Balint-KurtiP, WellCF (2008) Mining and harnessing natural variation: A little magic. Crop Sci 48 : 2066–2073.
32. McMullenMD, KresovichS, VilledaHS, BradburyP, LiHH, et al. (2009) Genetic properties of the maize nested association mapping population. Science 325 : 737–740.
33. Benson J (2013) Resistance to gray leaf spot of maize: underlying genetic architecture and associated mechanisms. Thesis. Cornell University.
34. KumpKL, BradburyPJ, WisserRJ, BucklerES, BelcherAR, et al. (2011) Genome-wide association study of quantitative resistance to southern leaf blight in the maize nested association mapping population. Nat Genet 43 : 163–168.
35. PolandJA, BradburyPJ, BucklerES, NelsonRJ (2011) Genome-wide nested association mapping of quantitative resistance to northern leaf blight in maize. Proc Nat Acad Sci 108 : 6893–6898.
36. Balint-KurtiPJ, JohalGS (2011) Use of mutant-assisted gene identification and characterization (magic) to identify useful alleles for crop improvement. ISB News Reports January 2011 : 1–3.
37. PenningBW, JohalGS, McMullenMM (2004) A major suppressor of cell death, slm1, modifies the expression of the maize (Zea mays L.) lesion mimic mutation les23. Genome 47 : 961–969.
38. OliverRP, IpchoSVS (2004) Arabidopsis pathology breathes new life into the necrotrophs-vs.-biotrophs classification of fungal pathogens. Mol Plant Pathol 5 : 347–352.
39. JenningsP, UllstrupAJ (1957) A histological study of three Helminthosporium leaf blights on corn. Phytopath 47 : 707–714.
40. OhmRA, FeauN, HenrissatB, SchochCL, HorwitzBA, et al. (2012) Diverse lifestyles and strategies of plant pathogenesis encoded in the genomes of eighteen Dothideomycete fungi. PLoS Pathog 8: e1003037.
41. NagyED, BennetzenJL (2008) Pathogen corruption and site-directed recombination at a plant disease resistance gene cluster. Genome Res 18 : 1918–1923.
42. FarisJD, ZhangZ, LuH, LuS, ReddyL, et al. (2010) A unique wheat disease resistance-like gene governs effector-triggered susceptibility to necrotrophic pathogens. Proc Nat Acad Sci 107 : 13544–13549.
43. MengisteT (2012) Plant immunity to necrotrophs. Ann Rev Phytopathol 50 : 267–294.
44. MackayTF (2013) Epistasis and quantitative traits: using model organisms to study gene-gene interactions. Nature Rev Genet 15 : 22–33.
45. WallaceJ, LarssonS, BucklerE (2014) Entering the second century of maize quantitative genetics. Heredity 112 : 30–38.
46. TianF, BradburyPJ, BrownPJ, HungH, SunQ, et al. (2011) Genome-wide association study of leaf architecture in the maize nested association mapping population. Nat Genet 43 : 159–162.
47. BucklerES, HollandJB, BradburyPJ, AcharyaCB, BrownPJ, et al. (2009) The genetic architecture of maize flowering time. Science 325 : 714–718.
48. PhillipsPC (2008) Epistasis—the essential role of gene interactions in the structure and evolution of genetic systems. Nature Reviews Genetics 9 : 855–867.
49. YuJ, HollandJB, McMullenMD, BucklerES (2008) Genetic design and statistical power of nested association mapping in maize. Genetics 178 : 539–551.
50. CookJP, McMullenMD, HollandJB, TianF, BradburyP, et al. (2012) Genetic architecture of maize kernel composition in the nested association mapping and inbred association panels. Plant Physiol 158 : 824–834.
51. TianF, BradburyPJ, BrownPJ, HungH, SunQ, et al. (2011) Genome-wide association study of leaf architecture in the maize nested association mapping population. Nat Genet 43 : 159–162.
52. HungH-Y, ShannonL, TianF, BradburyP, ChenC, et al. (2012) ZmCCT and the genetic basis of day-length adaptation underlying the postdomestication spread of maize. Proc Natl Acad Sci USA 109 : 1913–1921.
53. LaiJ, LiY, MessingJ, DoonerHK (2005) Gene movement by Helitron transposons contributes to the haplotype variability of maize. Proc Nat Acad Sci 102 : 9068–9073.
54. ZhengP, AllenWB, RoeslerK, WilliamsME, ZhangS, et al. (2008) A phenylalanine in DGAT is a key determinant of oil content and composition in maize. Nat Genet 40 : 367–372.
55. SalviS, SponzaG, MorganteM, TomesD, NiuX, et al. (2007) Conserved noncoding genomic sequences associated with a flowering-time quantitative trait locus in maize. Proc Natl Acad Sci 104 : 11376–11381.
56. BucklerES, HollandJB, BradburyPJ, AcharyaCB, BrownPJ, et al. (2009) The genetic architecture of maize flowering time. Science 325 : 714–718.
57. ChiaJM, SongC, BradburyPJ, CostichD, de LeonN, et al. (2012) Maize HapMap2 identifies extant variation from a genome in flux. Nat Genet 44 : 803–807.
58. Flint-GarciaSA, ThuilletAC, YuJM, PressoirG, RomeroSM, et al. (2005) Maize association population: a high-resolution platform for quantitative trait locus dissection. Plant J 44 : 1054–1064.
59. RomayM, MillardM, GlaubitzJ, PeifferJ, SwartsK, et al. (2013) Comprehensive genotyping of the USA national maize inbred seed bank. Genome Biol 14: R55.
60. MoerschbacherBM, NollU, GorrichonL, ReisenerH-J (1990) Specific inhibition of lignification breaks hypersensitive resistance of wheat to stem rust. Plant Physiol 93 : 465–470.
61. BhuiyanNH, SelvarajG, WeiY, KingJ (2009) Role of lignification in plant defense. Plant Sig Behavior 4 : 158–159.
62. MohrPG, CahillDM (2001) Relative roles of glyceollin, lignin and the hypersensitive response and the influence of ABA in compatible and incompatible interactions of soybeans with Phytophthora sojae. Physiol Mol Plant Pathol 58 : 31–41.
63. BoerjanW, RalphJ, BaucherM (2003) Lignin biosynthesis. Ann Rev Plant Biol 54 : 519–546.
64. HofiusD, MunchD, BressendorffS, MundyJ, PetersenM (2011) Role of autophagy in disease resistance and hypersensitive response-associated cell death. Cell Death Differ 18 : 1257–1262.
65. LiuY, SchiffM, CzymmekK, TalloczyZ, LevineB, et al. (2005) Autophagy regulates programmed cell death during the plant innate immune response. Cell 121 : 567–577.
66. PatelS, Dinesh-KumarSP (2008) Arabidopsis ATG6 is required to limit the pathogen-associated cell death response. Autophagy 4 : 20–27.
67. CodognoP, MeijerAJ (2005) Autophagy and signaling: their role in cell survival and cell death. Cell Death Differ 12 (Suppl 2) 1509–1518.
68. LaiZ, WangF, ZhengZ, FanB, ChenZ (2011) A critical role of autophagy in plant resistance to necrotrophic fungal pathogens. Plant J 66 : 953–968.
69. LenzHD, HallerE, MelzerE, KoberK, WursterK, et al. (2011) Autophagy differentially controls plant basal immunity to biotrophic and necrotrophic pathogens. Plant J 66 : 818–830.
70. HofiusD, Schultz-LarsenT, JoensenJ, TsitsigiannisDI, PetersenNHT, et al. (2009) Autophagic Components Contribute to Hypersensitive Cell Death in Arabidopsis. Cell 137 : 773–783.
71. LevineB, YuanJ (2005) Autophagy in cell death: an innocent convict? The Journal of Clinical Investigation 115 : 2679–2688.
72. SpitzerC, SchellmannS, SabovljevicA, ShahriariM, KeshavaiahC, et al. (2006) The Arabidopsis elch mutant reveals functions of an ESCRT component in cytokinesis. Development 133 : 4679–4689.
73. BacheKG, SlagsvoldT, CabezasA, RosendalKR, RaiborgC, et al. (2004) The growth-regulatory protein HCRP1/hVps37A is a subunit of mammalian ESCRT-I and mediates receptor down-regulation. Mol. Biol. Cell 15 : 4337–4346.
74. BenbrookDM, LongA (2012) Integration of autophagy, proteasomal degradation, unfolded protein response and apoptosis. Exp Oncol 34 : 286–297.
75. WrightonKH (2011) Autophagy: ESCRTing proteins for microautophagy. Nat Rev Mol Cell Biol 12 : 136–137.
76. ZengLR, QuS, BordeosA, YangC, BaraoidanM, et al. (2004) Spotted leaf11, a negative regulator of plant cell death and defense, encodes a U-box/armadillo repeat protein endowed with E3 ubiquitin ligase activity. Plant Cell 16 : 2795–2808.
77. BouchezO, HuardC, LorrainS, RobyD, BalagueC (2007) Ethylene is one of the key elements for cell death and defense response control in the Arabidopsis lesion mimic mutant vad1. Plant Physiol 145 : 465–477.
78. EitasTK, DanglJL (2010) NB-LRR proteins: pairs, pieces, perception, partners, and pathways. Current Opinion in Plant Biol 13 : 472–477.
79. WilliamsSJ, SohnKH, WanL, BernouxM, SarrisPF, et al. (2014) Structural basis for assembly and function of a heterodimeric plant immune receptor. Science 344 : 299–303.
80. BonardiV, CherkisK, NishimuraMT, DanglJL (2012) A new eye on NLR proteins: focused on clarity or diffused by complexity? Curr Opin Immunol 24 : 41–50.
81. HwangIS, HwangBK (2011) The pepper mannose-binding lectin gene CaMBL1 is required to regulate cell death and defense responses to microbial pathogens. Plant Physiol 155 : 447–463.
82. MaccarroneM, MelinoG, Finazzi-AgroA (2001) Lipoxygenases and their involvement in programmed cell death. Cell Death Differ 8 : 776–784.
83. CacasJ-L, VailleauF, DavoineC, EnnarN, AgnelJ-P, et al. (2005) The combined action of 9 lipoxygenase and galactolipase is sufficient to bring about programmed cell death during tobacco hypersensitive response. Plant, Cell & Environ 28 : 1367–1378.
84. GaoX, ShimWB, GobelC, KunzeS, FeussnerI, et al. (2007) Disruption of a maize 9-lipoxygenase results in increased resistance to fungal pathogens and reduced levels of contamination with mycotoxin fumonisin. Mol Plant Microbe Interact 20 : 922–933.
85. MarinoD, PeetersN, RivasS (2012) Ubiquitination during plant immune signaling. Plant Physiol 160 : 15–27.
86. ChengYT, LiY, HuangS, HuangY, DongX, et al. (2011) Stability of plant immune-receptor resistance proteins is controlled by SKP1-CULLIN1-F-box (SCF)-mediated protein degradation. Proc Nat Acad Sci 108 : 14694–14699.
87. GrantM, BrownI, AdamsS, KnightM, AinslieA, et al. (2000) The RPM1 plant disease resistance gene facilitates a rapid and sustained increase in cytosolic calcium that is necessary for the oxidative burst and hypersensitive cell death. Plant J 23 : 441–450.
88. LecourieuxD, MazarsC, PaulyN, RanjevaR, PuginA (2002) Analysis and effects of cytosolic free calcium increases in response to elicitors in Nicotiana plumbaginifolia cells. Plant Cell 14 : 2627–2641.
89. XuH, HeathMC (1998) Role of calcium in signal transduction during the hypersensitive response caused by basidiospore-derived infection of the cowpea rust fungus. Plant Cell 10 : 585–597.
90. LevineA, PennellRI, AlvarezME, PalmerR, LambC (1996) Calcium-mediated apoptosis in a plant hypersensitive disease resistance response. Curr Biol 6 : 427–437.
91. AliR, MaW, Lemtiri-ChliehF, TsaltasD, LengQ, et al. (2007) Death don't have no mercy and neither does calcium: Arabidopsis CYCLIC NUCLEOTIDE GATED CHANNEL2 and innate immunity. Plant Cell 19 : 1081–1095.
92. LambC, DixonRA (1997) The oxidative burst in plant disease resistance. Ann. Rev. Plant Physiol. Plant Mol Biol 48 : 251–275.
93. DokeN, OhashiY (1988) Involvement of an O2 − generating system in the induction of necrotic lesions on tobacco leaves infected with tobacco mosaic virus. Physiol Mol Plant Pathol 32 : 163–175.
94. MurraySL, AdamsN, KliebensteinDJ, LoakeGJ, DenbyKJ (2005) A constitutive PR-1::luciferase expression screen identifies Arabidopsis mutants with differential disease resistance to both biotrophic and necrotrophic pathogens. Mol Plant Pathol 6 : 31–41.
95. EtaloDW, StulemeijerIJE, Peter van EsseH, de VosRCH, BouwmeesterHJ, et al. (2013) System-Wide Hypersensitive Response-Associated Transcriptome and Metabolome Reprogramming in Tomato. Plant Physiology 162 : 1599–1617.
96. LeeM, SharopovaN, BeavisWD, GrantD, KattM, et al. (2002) Expanding the genetic map of maize with the intermated B73×Mo17 (IBM) population. Plant Mol Biol 48 : 453–461.
97. BloomJC, HollandJB (2012) Genomic localization of the maize cross-incompatibility gene, gametophyte factor 1 (ga1). Maydica 56 : 1782.
98. ShanerG, FinneyPE (1977) The effect of nitrogen fertilizer on expression of slow mildewing resistance in Knox wheat. Phytopathol 67 : 1051–1056.
99. SAS (2004) Help and Documentation. Cary, NC: SAS Institute.
100. Littell RC, Milliken GA, Stroup WA, Wolfinger RD, Schabenberger O (2006) SAS System for mixed models. Cary, NC: SAS institute.
101. ElshireRJ, GlaubitzJC, SunQ, PolandJA, KawamotoK, et al. (2011) A robust, simple genotyping-by-sequencing (GBS) approach for high diversity species. PLoS One 6: e19379.
102. Silva LdaC, WangS, ZengZB (2012) Composite interval mapping and multiple interval mapping: procedures and guidelines for using Windows QTL Cartographer. Methods Mol Biol 871 : 75–119.
103. VoorripsRE (2002) MapChart: software for the graphical presentation of linkage maps and QTLs. J Hered 93 : 77–78.
104. HollandJ (1998) EPISTACY: A SAS Program for detecting two-locus epistatic interactions using genetic marker information. Heredity 89 : 374–375.
105. ValdarW, HolmesCC, MottR, FlintJ (2009) Mapping in structured populations by resample model averaging. Genetics 182 : 1263–1277.
106. PanagiotouOA, IoannidisJP (2012) What should the genome-wide significance threshold be? Empirical replication of borderline genetic associations. Int J Epidemiol 41 : 273–286.
107. AndorfCM, LawrenceCJ, HarperLC, SchaefferML, CampbellDA, et al. (2010) The Locus lookup tool at MaizeGDB: Identification of genomic regions in maize by integrating sequence information with physical and genetic maps. Bioinformatics 26 : 434–436.
108. SchnablePS, WareD, FultonRS, SteinJC, WeiF, et al. (2009) The B73 maize genome: complexity, diversity, and dynamics. Science 326 : 1112–1115.
109. AltschulSF, MaddenTL, SchafferAA, ZhangJ, ZhangZ, et al. (1997) Gapped BLAST and PSI-BLAST: a new generation of protein database search programs. Nucleic Acids Res 25 : 3389–3402.
110. Marchler-BauerA, AndersonJB, CherukuriPF, DeWeese-ScottC, GeerLY, et al. (2005) CDD: a Conserved Domain Database for protein classification. Nucleic Acids Res 33: D192–196.
111. TrapnellC, PachterL, SalzbergSL (2009) TopHat: discovering splice junctions with RNA-Seq. Bioinformatics 25 : 1105–1111.
112. RobinsonMD, McCarthyDJ, SmythGK (2010) edgeR: a Bioconductor package for differential expression analysis of digital gene expression data. Bioinformatics 26 : 139–140.
113. BenjaminiY, HochbergY (1995) Controlling the false discovery rate: a practical and powerful approach to multiple testing. . J Royal Stat Soc Series B (Methodol.) 57 : 289–300.
Štítky
Genetika Reprodukční medicínaČlánek vyšel v časopise
PLOS Genetics
2014 Číslo 8
- Kazuistika – Perspektivy využití precizované medicíny v rámci personalizované specifické terapie onkologických pacientů
- Nobelova cena za chemii pro genetické nůžky: Objev, který změní naši budoucnost?
- Technologie na bázi RNA v klinické praxi: od přebarvených petúnií k terapii vzácných a dosud jen obtížně léčitelných chorob u lidí
- „Nepředstavovali jsme si, že náš výzkum povede přímo ke vzniku nových léků, dokonce ještě za našeho života“
- Bezplatné služby pro diagnostiku ATTRv amyloidózy pro kardiology
Nejčtenější v tomto čísle
- Meta-Analysis of Genome-Wide Association Studies in African Americans Provides Insights into the Genetic Architecture of Type 2 Diabetes
- KDM6 Demethylase Independent Loss of Histone H3 Lysine 27 Trimethylation during Early Embryonic Development
- The RNA Helicases AtMTR4 and HEN2 Target Specific Subsets of Nuclear Transcripts for Degradation by the Nuclear Exosome in
- EF-P Dependent Pauses Integrate Proximal and Distal Signals during Translation
Zvyšte si kvalifikaci online z pohodlí domova
Mazová zátka a její řešení
nový kurzVšechny kurzy