
Analysis of the Basidiomycete Reveals Conservation of the Core Meiotic Expression Program over Half a Billion Years of Evolution
Coprinopsis cinerea (also known as Coprinus cinereus) is a multicellular basidiomycete mushroom particularly suited to the study of meiosis due to its synchronous meiotic development and prolonged prophase. We examined the 15-hour meiotic transcriptional program of C. cinerea, encompassing time points prior to haploid nuclear fusion though tetrad formation, using a 70-mer oligonucleotide microarray. As with other organisms, a large proportion (∼20%) of genes are differentially regulated during this developmental process, with successive waves of transcription apparent in nine transcriptional clusters, including one enriched for meiotic functions. C. cinerea and the fungi Saccharomyces cerevisiae and Schizosaccharomyces pombe diverged ∼500–900 million years ago, permitting a comparison of transcriptional programs across a broad evolutionary time scale. Previous studies of S. cerevisiae and S. pombe compared genes that were induced upon entry into meiosis; inclusion of C. cinerea data indicates that meiotic genes are more conserved in their patterns of induction across species than genes not known to be meiotic. In addition, we found that meiotic genes are significantly more conserved in their transcript profiles than genes not known to be meiotic, which indicates a remarkable conservation of the meiotic process across evolutionarily distant organisms. Overall, meiotic function genes are more conserved in both induction and transcript profile than genes not known to be meiotic. However, of 50 meiotic function genes that were co-induced in all three species, 41 transcript profiles were well-correlated in at least two of the three species, but only a single gene (rad50) exhibited coordinated induction and well-correlated transcript profiles in all three species, indicating that co-induction does not necessarily predict correlated expression or vice versa. Differences may reflect differences in meiotic mechanisms or new roles for paralogs. Similarities in induction, transcript profiles, or both, should contribute to gene discovery for orthologs without currently characterized meiotic roles.
Published in the journal:
. PLoS Genet 6(9): e32767. doi:10.1371/journal.pgen.1001135
Category:
Research Article
doi:
https://doi.org/10.1371/journal.pgen.1001135
Summary
Coprinopsis cinerea (also known as Coprinus cinereus) is a multicellular basidiomycete mushroom particularly suited to the study of meiosis due to its synchronous meiotic development and prolonged prophase. We examined the 15-hour meiotic transcriptional program of C. cinerea, encompassing time points prior to haploid nuclear fusion though tetrad formation, using a 70-mer oligonucleotide microarray. As with other organisms, a large proportion (∼20%) of genes are differentially regulated during this developmental process, with successive waves of transcription apparent in nine transcriptional clusters, including one enriched for meiotic functions. C. cinerea and the fungi Saccharomyces cerevisiae and Schizosaccharomyces pombe diverged ∼500–900 million years ago, permitting a comparison of transcriptional programs across a broad evolutionary time scale. Previous studies of S. cerevisiae and S. pombe compared genes that were induced upon entry into meiosis; inclusion of C. cinerea data indicates that meiotic genes are more conserved in their patterns of induction across species than genes not known to be meiotic. In addition, we found that meiotic genes are significantly more conserved in their transcript profiles than genes not known to be meiotic, which indicates a remarkable conservation of the meiotic process across evolutionarily distant organisms. Overall, meiotic function genes are more conserved in both induction and transcript profile than genes not known to be meiotic. However, of 50 meiotic function genes that were co-induced in all three species, 41 transcript profiles were well-correlated in at least two of the three species, but only a single gene (rad50) exhibited coordinated induction and well-correlated transcript profiles in all three species, indicating that co-induction does not necessarily predict correlated expression or vice versa. Differences may reflect differences in meiotic mechanisms or new roles for paralogs. Similarities in induction, transcript profiles, or both, should contribute to gene discovery for orthologs without currently characterized meiotic roles.
Introduction
Meiosis is a specialized cell division process in which one round of DNA replication is followed by two divisions to produce haploid products. The basidiomycete mushroom Coprinopsis cinerea (also known as Coprinus cinereus) [1] is ideal for eukaryotic meiotic studies due to its short, well-defined life cycle and the highly synchronous development of both the mushroom and its meiotic tissues [2]. The mechanisms and molecular machinery associated with meiosis are well-conserved within eukaryotes, albeit with some modifications observed in widely studied systems, for example, the lack of synaptonemal complex (SC) in Schizosaccharomyces pombe (reviewed in [3], [4]), Mre11-dependent double-strand break formation in Saccharomyces cerevisiae (reviewed in [5]), and uncoupled recombination and SC formation in Caenorhabditis elegans and Drosophila melanogaster (reviewed in [3], [4]). Meiosis in C. cinerea resembles that of most complex eukaryotes, with SC formation dependent on recombination, Mre11-independent double–strand break formation, and an average of one chiasma per chromosome arm [6]–[12].
The assembled 36.29 Mbp genome sequence of C. cinerea [6], [13], [14], has ∼ 13,400 open reading frames computationally predicted based on available EST data, comparisons with other fungal gene sets, and ab initio methods [6]. The availability of these data, combined with the tractability of C. cinerea, presents an ideal opportunity for the development and use of genomic technologies to investigate meiosis in this organism and compare meiotic transcription among eukaryotes.
The use of transcription profiles to infer gene function is particularly well-suited for the study of meiosis. While changes in transcription do not always correspond to functional effects, it was noted that timing of gene expression and protein function are often coincident during meiosis in S. cerevisiae, particularly for specialized processes such as recombination (reviewed in [15], [16]). Expression of meiotic genes likely requires tight control to prevent deleterious effects in other tissues; indeed, aberrant expression of meiotic genes has been implicated in mammalian cancer [16].
Insights into meiosis and spore development were provided by meiotic time courses in S. cerevisiae [17], [18] and S. pombe [19]. Meiosis and gametogenesis have also been profiled, by microarray and other methods, in several plant species (wheat, petunia, maize, rice) [20]–[23], silkworm [24], D. melanogaster [25], C. elegans [26], [27], and mammalian testis [16], [28]–[31]. These studies vary in their ability to distinguish meiotic stages due to the difficulties of dissecting purely meiotic tissues from larger structures such as anthers, and are hampered by the lack of synchrony, limiting the ability to sample defined meiotic stages. However, in common with the S. cerevisiae and S. pombe studies [17]–[19], transcriptional waves were apparent in a number of organisms [20], [28], [30], [31], with differential expression of genes essential for recombination, chromosome cohesion, and segregation noted in each species.
Comparative analysis of meiotic expression data from S. cerevisiae and S. pombe showed a lack of conservation of meiotic regulatory machinery, but nevertheless allowed definition of a “core meiotic transcriptome” of 75 genes [15]. This “core” group contained a number of previously characterized meiotic genes, such as dmc1, rec8, and hop2. However, several key meiotic genes are surprisingly absent from the list of core genes, including spo11, which encodes a key meiotic protein that makes double-strand breaks, suggesting that this list is not comprehensive.
S. cerevisiae, S. pombe and C. cinerea are highly divergent. Ascomycetes and basidiomycetes diverged ∼500–900 million years ago [32], [33], with the divergence of S. cerevisiae and S. pombe occurring shortly afterwards. Stimulation of entry into meiosis in both S. cerevisiae and S. pombe is induced by nutritional restriction, in contrast to the largely light-mediated induction of fruit body development and meiosis in C. cinerea [34]. The inclusion of C. cinerea, a more evolutionarily distant fungus with complex multicellular structure and differing meiotic cues, allows us to further investigate the evolutionary conservation of meiosis.
In this study, 70bp oligonucleotides were designed against the whole predicted C. cinerea transcriptome and used to assess transcript-level changes across a broad-scale time course encompassing meiosis in C. cinerea. The resultant transcriptional data were compared with similar data sets in S. cerevisiae and S. pombe to ask whether genes induced upon entry into meiosis and the transcript abundance during meiosis are conserved among the three fungal species.
Results/Discussion
A large proportion of C. cinerea genes change in expression during meiosis
Oligonucleotide microarrays representing all the predicted C. cinerea genes were constructed and validated (see Materials and Methods), and used to investigate transcript level changes during meiosis. Gill tissue samples were taken from six time points spanning a 15-hour period. In C. cinerea dikaryons, haploid nuclei remain separate until just prior to meiosis, when they fuse (karyogamy). Gill tissue was collected at three hours before karyogamy (K−3; prior to meiotic DNA replication), at karyogamy (K), three hours after karyogamy (K+3; leptotene/zygotene), six hours after karyogamy (K+6; pachytene), nine hours after karyogamy (K+9; metaphase I), and twelve hours after karyogamy (K+12; tetrads have formed; Figure 1). cDNA populations derived from these samples were comparatively hybridized to microarrays, with a mixed sample as reference. Data were collected from four biological replicates for each time point. After data filtering and statistical analysis (see Materials and Methods), 2,851 probes (representing 2,721 genes) were found to exhibit changing expression during the meiotic time course. This is ∼20% of the 13,230 probes on the array, and corresponds with similar proportions of genes displaying differential expression in S. cerevisiae and S. pombe over similar time courses [17]–[19].

In several organisms, many meiotic genes are primarily expressed only in meiotic tissue (e.g. [26], [29], [35]–[38] and references therein). We identified genes expressed only in meiotic gill tissue in comparison with dikaryotic vegetative mycelia. In this comparison, 886 genes were expressed in meiotic gill tissue only, including genes with well-characterized roles in meiosis such as hop1, spo11, rec8, mer3, and dmc1 (Table S1). Gene ontology (GO) enrichment analysis (using EASE within MeV [39], [40]; Materials and Methods) was used to identify over-represented gene functions within this group, revealing, as expected, enrichment of genes with meiotic function (Table S2).
Clustering and gene ontology enrichment analysis of genes significantly changing during C. cinerea meiosis reveal transcriptional waves and distinct temporally regulated processes
Gene transcripts significantly changing during the C. cinerea meiotic time course were classified by clustering. Genes were K-means clustered using the Pearson correlation, which groups genes according to similarity in their temporal expression patterns, using a successive bifurcation strategy that removed user-choice from the resultant number of clusters (Materials and Methods, Figure S1). This strategy produced nine distinct gene transcript profiles (Figure 2), exhibiting successive “waves” of transcription, as reported for other organisms [16]–[31].

Gene ontology (GO) enrichment analysis of the nine clusters was used to identify over-represented gene functions within each of the nine C. cinerea clusters (Table S3). The nine clusters exhibit a clear difference in transcript profile between clusters 1–5 and 6–9, as indicated by the initial bifurcation (Figure 2). This is supported by the distinct classes of genes enriched in these clusters, which represents a broad switch from expression of genes required for the meiotic prophase I activities in early clusters, to expression of gill maturation and sporulation-related genes in later clusters (Table S3). This corresponds with a similarly dramatic transcriptional switch from “early” to “middle” gene expression, as observed in S. cerevisiae [17], [18].
Pre-meiotic DNA replication in C. cinerea occurs just prior to nuclear fusion [41]. Many aspects of DNA replication are well-conserved [42], such as the origin-recognition complex (ORC) and MCM2–7 complex, and these genes are expressed primarily in early clusters 1–3 (Table S1). Clusters 1–3 are enriched in functional categories of genes involved in early meiotic processes (Table S3); DNA replication is reflected in categories such as nucleic acid binding. Cluster 2, which exhibits a more prolonged transcript presence than other clusters, is enriched for regulation and organization of the cytoskeleton. This is likely to be important for karyogamy, organization of the meiotic spindle, and segregation of chromosomes; these processes span the entire time course, explaining the prolonged requirement of these transcripts. RNA splicing functions are also enriched in cluster 2, which is notable because control of splicing has been implicated in meiotic regulation [43], [44]. All the genes encoding components of the cohesin complex (scc3, smc1, smc3 and the meiosis-associated factor rec8) are present in cluster 3. Cohesin holds sister chromatids together during meiosis, and primarily loads early, during replication. The gene encoding Spo11, which initiates recombination through its formation of double-strand breaks [45] is also in cluster 3. This suggests that cluster 3 may be a source of promising candidates for early-acting meiotic genes.
We noted a massive enrichment of genes involved in ribosome production, translation, protein catabolism, and ribosomal RNA processing in cluster 4. In S. cerevisiae, ribosomal protein genes are repressed on entering meiosis, with a subsequent increase in expression during sporulation, reflecting the starvation conditions required to induce meiosis in this organism [17]. In C. cinerea, transcript levels of ribosomal protein genes are relatively high until karyogamy, after which a gradual decline is observed, with no subsequent increase of transcription. Ribosomal degradation prior to meiosis and subsequent resynthesis during meiosis or sporulation have been previously noted in S. cerevisiae and Chlamydomonas reinhardtii (reviewed in [46]), and ribosomal turnover is implicated in regulation of cell growth and proliferation in Xenopus laevis and D. melanogaster (reviewed in [47]). Enhanced expression of ribosomal genes in C. cinerea at K-3 and K may be in preparation for meiosis and for the massive, rapid cellular expansion in the gills and fruit body over the timescale examined in this time course.
Cluster 5 genes exhibit intermediate transcript levels prior to karyogamy, with increased levels of expression during nuclear fusion and leptotene/zygotene, after which transcripts decrease rapidly. Cluster 5 is highly enriched for genes known to be involved in meiotic processes such as damaged-DNA binding, mismatch repair, and DNA modification (Table S3). Characterized genes in this cluster include those critical for key meiotic events such as strand exchange (dmc1, rad5, rdh54), axial element formation and synapsis (hop1), and crossover formation (msh5, mlh1). Several of the genes expressed in cluster 5 play key roles in meiosis in other organisms (as summarized in [37]), making this cluster a rich source for exploration of meiotic gene candidates.
Clusters 6–9 are enriched in genes required for spore formation. We observed a progressive shift from expression of biosynthetic genes, which may play a role in gill expansion due to carbohydrate acquisition and vacuolation (e.g. fatty acid synthesis in cluster 6, sugar and energy reserve synthesis in cluster 7) to those involved in formation of spore structure and spore packaging (e.g. cell wall biogenesis in cluster 8 and extracellular polysaccharide and carbohydrate transport in cluster 9) as well as preparation for spore germination (spore germination associated genes in cluster 8, and those involved in perception of external stimuli in cluster 9). A comparative analysis of spore formation, although potentially of great interest, is beyond the scope of this study.
Meiotic function genes are more conserved in their induction and expression patterns than genes not known to be meiotic
Previously, meiotic genes in S. cerevisiae and S. pombe were found to be more likely to be co-induced than a control set of genes with orthologs in S. pombe that were induced in one S. cerevisiae strain but not another [19]. We wished to ask if meiotic genes are also more likely to be co-induced than non-meiotic genes in comparisons among the two yeasts and C. cinerea.
To determine which genes are induced upon entry into meiosis in C. cinerea, we compared gene expression during vegetative dikaryotic growth to expression in meiotic gill tissue at K-3. We observed 886 genes to be expressed only in gill tissue, with a further 3,621 genes expressed in vegetative tissue but significantly induced upon entry into meiosis. To ask whether genes meiotically induced in C. cinerea are also induced upon meiotic entry in S. cerevisiae and S. pombe, we identified single copy, unambiguous, putative orthologs (henceforth referred to as “orthologs”; see Materials and Methods) and compared their patterns of induction. Transcript level changes upon meiotic entry in S. cerevisiae and S. pombe were determined from previously published microarray data [17], [19], and induction of the meiosis-associated gene spo11 was used as a control indicator of the transition between non-meiotic and meiotic cells. Transcript level changes in S. cerevisiae and S. pombe were compared with one another and with the significant changes between vegetative tissue and K-3 in C. cinerea.
Orthologs and expression data were available in all three fungal species for 2,006 genes. Genes were assigned to “meiotic function” (MF) or “no known meiotic function” (NKMF) categories as defined by the Saccharomyces Genome Database [48] and the Gene Ontology [49] (Table S1). Of the 2,006 pertinent genes, significant induction on entry to meiosis was observed for 1,046 C. cinerea genes. In the yeasts, 829 S. cerevisiae genes and 869 S. pombe genes were induced. We considered the 829 genes induced in S. cerevisiae, as this is the maximum number of genes with the potential to be induced in all three species, and asked how many were induced upon entry into meiosis in all three species for the MF and NKMF classes. We observed that 50 of the 119 MF genes were induced in all three fungal species, while only 169 of the 710 NKMF genes were co-induced (p<1×10⁻⁴, Fisher's Exact test). The names and putative functions of genes in the MF_co-induced, MF_not_co-induced, and NKMF_co-induced categories are listed in separate tabs in Table S1.
The 50 commonly induced MF gene set contains a number of genes known to be crucial for meiosis, such as all three genes of the Mre11 complex (mre11, rad50 and xrs2/nbs1), genes encoding strand invasion proteins (dmc1 and rad51), and genes encoding meiosis-associated proteins (spo11, rec8, hop1 and dmc1). This suggests that coordinate induction of genes across multiple species may prove to be an indicator of meiotic function; the inclusion of C. cinerea as a comparator clarifies those genes that are likely evolutionarily conserved in their meiotic behaviour. Several of the genes that are coordinately induced in all three species but currently have no known meiotic function are involved in spindle formation, chromosome segregation or DNA-metabolic processes, and may yet prove to be important in meiosis (Table S1).
Comparison of genes coordinately induced on entry into meiosis is necessarily a binary approach, asking “on/off” questions that do not query the changes in transcript level through a time course. A complementary approach is to compare the temporal transcript profiles of genes during meiosis. Comparative studies of mammalian gametogenesis asked whether genes were conserved in their relative expression patterns in distinct pre-meiotic, meiotic, and post-meiotic tissues in rat and mouse (∼23 million years divergent [50]), and found that correlated genes were enriched for reproductive function [15], [28], [29]. The availability of time course data describing meiosis in three different fungal species affords us the opportunity to ask if conservation of transcript profile can also be observed within meiotic cells in these more diverged organisms. This may also highlight similarities and differences in meiotic process not observed by examining coordinate induction.
We examined the 2,721 genes with significantly changing transcript levels in C. cinerea, and found S. cerevisiae and S. pombe orthologs and corresponding expression data for 743 genes [17], [19]. Meiotic progression in the three fungi differs with respect to the overall time required for completion of meiosis, and the duration of certain stages within the meiotic program. Thus, in order to compare meiotic transcript profiles in the three species, we aligned expression data according to previously described meiotic landmarks and defined an eight-point time course (Figure 3). Data were unavailable for all three species at every stage defined; in these cases, expression data were interpolated by averaging the expression from flanking time points.

The 743 orthologs were again divided into MF genes (81) and NKMF genes (662). For each orthologous gene, the transcript profiles were compared for each of the three possible interspecies pair-wise combinations (i.e., Ccin vs. Scer, Ccin vs. Spom, Scer vs. Spom), and correlation coefficients (r) were generated. In all comparisons, more transcript profiles are well-correlated (r>0.5) for MF genes than NKMF genes (Ccin/Spom, 44% vs. 28%; Ccin/Scer, 54% vs. 30%; Spom/Scer, 32% vs. 29%), and the correlation value distributions (Figure 4) were significantly different when MF genes were compared with NKMF genes (Mann-Whitney-Wilcoxon test: Ccin/Spom, W = 38049, p<0.0001; Ccin/Scer, W = 37655, p<0.0001; Scer/Spom, W = 34760, p<0.0112). Thus, the transcript profiles of MF genes are more highly conserved than those of NKMF genes. Fifty-two genes of the NKMF class are well-correlated in all three pair-wise comparisons (and six of these genes are also coinduced in all three species); these subsets (Table S1) provide an interesting pool of candidates that may have additional, as yet uncharacterized, meiotic functions.

Given that MF genes are enriched both for coordinate induction on entry to meiosis and transcript profile correlation though meiosis, we noted some surprising differences in induction and correlation in some meiotic genes, highlighting the complementary value of both these types of analysis. Of genes coordinately induced in the three species, several do not exhibit well-correlated transcript profiles. Of the 50 coordinately induced MF genes, only 41 are well correlated between at least 2 of the three species, with only a single gene (rad50) coordinately induced and well-correlated in all three species (Figure 5), indicating that transcript profile conservation reveals additional information about meiotic regulation; coordinate induction does not predict transcript profile correlation or vice versa. Meiotic genes may be expected to be all induced upon meiotic entry, but their subsequent expression behavior may be able to inform us about the different ways meiosis is achieved in different organisms.

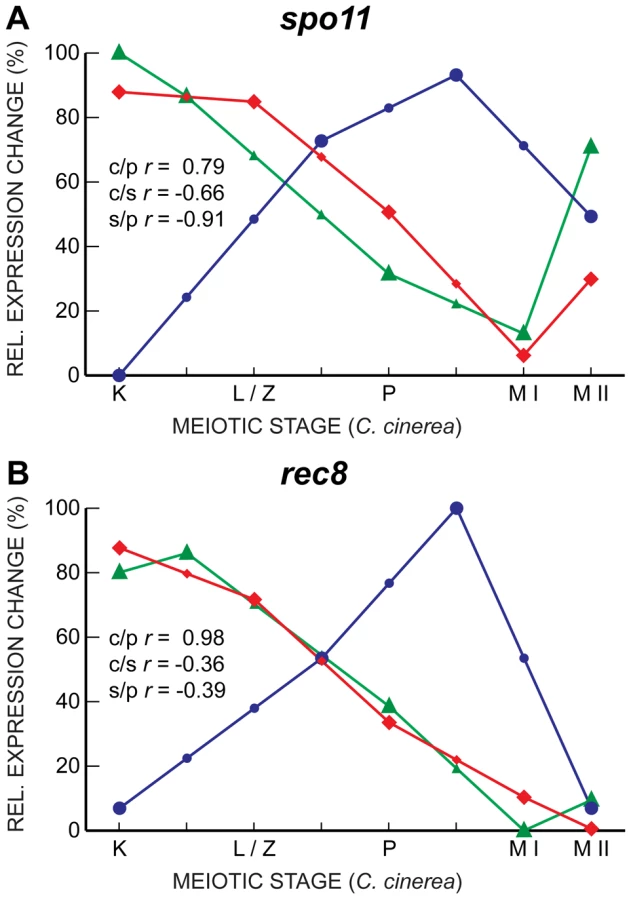
Interestingly, despite their well-characterized meiotic roles, and although they are induced upon entry into meiosis in all three fungal species, the transcript profiles of spo11 and rec8, which encodes a meiosis-associated cohesin subunit [51], [52], are well-correlated only between C. cinerea and S. pombe, with S. cerevisiae expression peaking late in meiosis, just before the first meiotic division, later than the timing of the corresponding protein activity (Figure 6). Other genes essential for meiosis, such as hop1 and dmc1, also exhibit a similar late transcript peak in S. cerevisiae. This unexpected lack of correlation may indicate additional or differing functions for some meiotic proteins; for example, Spo11 forms meiotic double-strand breaks independently of the Mre11 complex in C. cinerea and S. pombe, but in an Mre11-dependent manner in S. cerevisiae [5], [53], [54]. Alternatively or additionally, post-transcriptional regulation might be more prevalent in core meiotic genes in S. cerevisiae. For example, alternative splicing of introns is disproportionately involved in meiotic gene regulation when compared to other biological processes in S. cerevisiae [43].
Other genes exhibit the correlated transcript profiles expected given the roles of their proteins. For example, the genes encoding three members of the cohesin complex, Smc1, Smc3, and Scc3, are all well-correlated between C. cinerea and S. cerevisiae, and somewhat correlated between S. cerevisiae and S. pombe (Figure 7). Single genes encode the cohesin Scc1 (S. cerevisiae)/Rad21 (S. pombe) in the yeasts, whereas C. cinerea has two homologous genes encoding this protein. For one of these, rad21.2, the transcript profile is well-correlated with those of its S. cerevisiae and S. pombe homologs. The Rad21.2 protein is found exclusively in meiotic tissue (Palmerini et al., in preparation). In contrast, rad21.1 displays a very different transcript profile (Figure 7). The Rad21.1 protein is the only mitotic kleisin in C. cinerea (Palmerini et al., in preparation) and its RNA abundance spike late in meiosis may reflect transcription in preparation for the first post-meiotic mitosis.

We also noted an unusual expression pattern of some MCM complex genes. This complex, composed of MCM2–7, is involved in replication, and thus one would expect these genes to be expressed early and coordinately. Most of the genes are indeed expressed in such a manner, with the exception of S. pombe mcm6 and S. cerevisiae mcm5, which have very similar, late-peaking, expression profiles (Figure 8). C. cinerea mcm2 also exhibited this late expression profile, but the change through meiosis was not statistically significant. In Drosophila melanogaster, mcm5 mutants are defective in the resolution of meiotic double-strand breaks to crossovers [55] raising the possibility of a similar meiotic role for mcm5 in S. cerevisiae. The similar expression patterns of S. pombe mcm6 and C. cinerea mcm2 suggest this additional role may not be confined to a specific MCM subunit.

Previous studies have shown both conservation and apparent divergence in proteins required for meiosis [37], [38], [56]–[61]. Our work shows that, for proteins whose primary sequence is conserved enough for homology to be recognized, gene expression profiles throughout meiosis are significantly conserved. That this conservation occurs across >500 million years of evolution suggests that meiosis is more conserved than hitherto recognized. Based on our data and existing criteria, we propose an expanded inventory of genes involved in meiosis (Table S4).
We also predict that additional conservation of meiotic genes will be found as the algorithms for detecting homology become more sophisticated. This has practical implications, in that previously uncharacterized genes with meiotic roles could be identified both by similarity of expression profile to known meiotic genes within an organism (i.e., Figure 2) and by conservation of expression profile across organisms. For example, ubc9, which is induced upon entry into meiosis in the three fungi, has well correlated expression profiles in a comparison between C. cinerea and S. pombe, and a late peaking expression profile similar to that of spo11 and rec8 in S. cerevisiae. Ubc9 has no known meiotic role in the yeasts but is involved in sumoylation during meiosis in C. cinerea [62], [63]. Genes with orthologs in the C. cinerea meiotic cluster 5 with no currently identified meiotic function (53) are also compelling candidates for study. Of these genes, four, including those encoding two transcription factors (Hir1 and Tfb2) are coordinately induced in all three fungal species. An additional six genes are well-correlated in pair-wise comparisons in all three fungi. In addition, given the sequence divergence of many meiotic genes, such as those encoding synaptonemal complex components, a proportion of the genes in cluster 5 with no currently apparent orthologs are likely to have meiotic roles. This is illustrated by bad42, which has a critical meiotic role in C. cinerea meiosis but has no known orthologs [64].
It is logical that meiotic processes must be tightly controlled to avoid deleterious effects of renegade gene expression (e.g. [16]). The broad conservation of meiosis opens up interesting possibilities for the study of this process in different organisms. Thus, protein function can be inferred from studies in different species and the exploitation of the benefits of various study organisms, such as the elegant cytology and uncoupled recombination and SC formation in C. elegans and D. melanogaster; the tractability of S. cerevisiae and S. pombe; and the synchronous meiosis, facile screening, and prolonged prophase in C. cinerea. In addition, the striking differences in expression pattern between species for necessarily tightly controlled genes such as spo11 indicate differences in meiotic gene regulation, highlighting the value of different types of analysis.
Materials and Methods
Design, production and validation of a Coprinopsis cinerea 70-mer oligonucleotide microarray
To produce a microarray for C. cinerea, 70-mer oligonucleotides were designed against the then-available ∼12,500 predicted gene sequences using ArrayOligoSelector [65] in successive design rounds, initially using a secondary target binding energy cut-off of −25 kcal/mol and relaxing where necessary. Where possible, oligonucleotides were 3′-biased and filtered to maximize the chance of specific hybridization; using FastA [66] and BLASTn [67], oligos were discarded that had a secondary match with >85% similarity, or a secondary hit with >20bp contiguous match [68]. Oligos that spanned more than 1 intron were also discarded. Oligonucleotides were also designed against repeat elements (without secondary match filtering), known C. cinerea genes, and a small subset of EST sequences that were not represented by gene predictions. In total, 13,230 probes were designed, with 1,061 of the predicted genes represented by more than one probe. A total of 12,104 probes representing 11,746 genes of the Jan06m300_GLEAN prediction set were designed, plus an additional 165 probes representing 162 aug_GLEAN predicted genes. Some predictions from the Jan06m300_GLEAN set do not have oligos, as a proportion were shorter than the 70bp oligo length, and many corresponded to repeated elements and were removed. Some ESTs were not represented by gene predictions, and 390 additional probes represent unique ESTs. A total of 467 probes were designed to distinct repeated elements. Also, 48 probes represent mating factor genes from different C. cinerea strains that are thus not present in the sequenced strain. The 56 remaining probes were designed against existing NCBI C. cinerea sequences, which often had small variations in comparison with the sequenced strain. These slightly mismatched oligos were therefore not mapped to gene predictions. Oligonucleotides were resuspended in 3×SSC at a final concentration of 20µM, and were printed onto amine-coated glass slides (Cel) by the Center for Genomics and Bioinformatics, Indiana University. Microarrays were UV-crosslinked at 450 mJ prior to hybridization. To assess probe performance, data from the genes represented on the array by more than one probe were compared and found to be well-correlated, as determined by a Pearson product-moment test (correlation coefficient = 0.89); data from single probes are thus highly reliable (Figure S2).
Array results were validated using qPCR data for a number of genes, including genes of high and low expression, genes with steady expression throughout the time course, and genes of known function in C. cinerea (Figure S2, Table S5). Data were normalized against an average of all the data points for a given primer pair or probe in order to render array and qPCR data directly comparable. Array and qPCR data were determined to be well-correlated as determined by a Spearman rank order test, which gave a correlation coefficient of 0.84; this compares favorably with similar analyses of other microarray datasets [69]. Furthermore, array results for characterized C. cinerea genes correspond with published northern data [8], [11], [12], [70]–[73]. Statistical analysis for comparison of array and qPCR data, and comparison of multiple probe gene data, were done using Minitab (http://www.minitab.com).
Fungal strains and culture conditions
C. cinerea wild-type monokaryon strains J6;5-5 and J6;5-4 [74] were incubated at 37°C on YMG media. These strains were mated, and the resulting dikaryon subcultured into fruiting tubes, grown at 37°C for 2 days, and then moved to 25°C under a regime of 8 hours dark, 16 hours light, as previously described [75]. Fruiting initials emerged after ca. 7 days and synchronous mushroom caps were harvested at three hours prior to karyogamy (K−3), karyogamy (K), and 3, 6, 9, and 12 hours post-karyogamy (K+3, K+6, K+9, K+12) and frozen with liquid nitrogen. For vegetative tissue, fragmented dikaryotic or monokaryotic mycelia were used to inoculate static 20ml liquid YMG cultures. Static cultures were incubated at 37°C for 2 days, then used to inoculate 100ml YMG. These larger cultures were shaken at ∼150 rpm at 37°C for 2 days, then harvested with a Buchner funnel and immediately frozen with liquid nitrogen.
RNA isolation and array hybridization
Mushroom gill tissue was excised from 7–10 fruiting bodies per time point and, after removal of veil tissue, immediately frozen in liquid nitrogen. Dikaryotic and monokaryotic vegetative mycelia were harvested through a Buchner funnel. RNA was extracted from all the tissue collected using the RNeasy Plant Mini Kit (Qiagen) according to the manufacturer's instructions. The RNA yield typically ranged from ca. 100µg-1mg, of which 20µg was used per array hybridization. First strand cDNA was synthesized and labeled with Alexa-fluor dyes using the Superscript Indirect cDNA Labeling System (Invitrogen) as described. For gill samples, two-channel hybridizations were performed, comparing a time point (test) sample with a reference mixture of time point samples, to maximize array resolution. Due to sample limitations, the reference consisted of cDNA from the latter 4 time points only. Four biological replicates of each time point were tested, incorporating dyeswaps. Vegetative dikaryotic and monokaryotic mycelia were directly compared in two-channel hybridizations. Microarray slides were blocked prior to hybridization with 5×SSC, 0.1%SDS, 0.1mg.ml−1 BSA at 42°C for 45 min, after which slides were rinsed twice in room temperature 0.1×SSC for 5 min each, followed by a final 10s rinse in water. Slides were dried by centrifugation for 1min in a Labnet C1303 slide spinner. Arrays were placed in Corning hybridization chambers and mSeries Lifterslips (Erie Scientific) placed over the array grids. Labeled cDNAs were combined in 50µl with 30% deionized formamide (Ambion), 5×SSPE, 0.2% SDS, 1µg.µl−1 tRNA (Invitrogen), 40ng.µl−1 oligo dA (Invitrogen). The hybridization mixture was heated at 100°C for 2min, cooled to 25°C, and applied to the microarray slide. Slides were hybridized for 16 hours at 42°C, then washed for 5 min each in 1×SSC, 0.03%SDS (37°C), then 0.2×SSC (ambient temperature), and finally 0.1×SSC (ambient temperature). Slides were dried by centrifugation, as previously, and scanned immediately.
Quantitative reverse-transcription polymerase chain reaction
Primers for quantitative RT-PCR were designed using Primer Quest (idtdna.com) with an amplicon size of 200–250bp, target Tm of 59°C with no more than 2°C Tm difference between primer pairs, 50% GC, target primer length 24nt. Eleven genes were examined with qPCR (Table S5). RNA samples were treated with Turbo DNase (Ambion) and quantified using a Nanodrop Spectrophotometer. Equal quantities of RNA were reverse transcribed using qScript cDNA SuperMix (Quanta). The resulting cDNA was diluted 16-fold for use in qPCR. PCR was performed in triplicate, in 15µl reactions using PerfeCTa SYBR Green FastMix Low ROX mix (Quanta), 150nM primers (final concentration) and 5µl cDNA. Duplicate qPCR reactions of a standard curve comprising a 4-fold dilution series of genomic DNA or mixed cDNA was performed alongside test reactions, as well as no template and no reverse transcriptase controls. Reactions were assembled in 96 well plates (Stratagene) and performed on a Stratagene MX3000P instrument, with the following cycle: 95°C, 10 min; (95°C, 30 s; 59°C, 1 min; 72°C, 1 min)×40 cycles (qPCR); 95°C, 1 min; 55°C, 30 s; 95°C, 30s (melt curve analysis). Transcript copy number was estimated from the standard curve.
Microarray data capture and analysis
Microarray slides were scanned using a GenePix 4200A scanner (Molecular Devices). Spots were identified using GenePix Pro software (Molecular Devices) and manual inspection. Scans were quality assessed using the Basic Hybridization Analysis R script (http://cgb.indiana.edu/downloads/1). Spots were manually flagged to be excluded from analysis if there were areas of poor quality such as scratches or dust. Spots were also flagged for omission, using GenePix software, if they fulfilled any of the following criteria: manually flagged, buffer only spots, spots not found, percentage of saturated pixels in both channels >3, percentage of pixels above background plus 1 standard deviation in both channels<60, spot pixels<40.
Data normalization and filtering were performed using the Bioconductor [76] (http://www.bioconductor.org/) packages marray and OLIN [77] as well as custom scripts. OLIN [77] was used for intra-slide normalization and log2 transformation.
For statistical analysis of meiotic time course data, data from a given probe were included only if they fulfilled one or both of the following criteria. First, data for a given oligonucleotide were included if two out of four biological replicates for every time point contained data for both probes. This criterion was chosen to avoid the inclusion of data from single replicates (i.e., for which none or only one replica produced data of acceptable quality). However, data for probes that had robust data for all four replicates for at least one time point were also included, whether or not they fulfilled the first criterion. Of the 13,230 array probes, 8,413 fulfilled one or both of these criteria, of which 286 fulfilled only the first criterion, 941 fulfilled only the second, and 7,186 fulfilled both. Significance Analysis of Microarrays (SAM) software [78] was utilized to determine which genes were changing in expression during the meiotic time course progression, using a false discovery rate (FDR) of 10%. This cut-off encompassed most of the C. cinerea genes previously characterized as having differential expression during meiosis. Using the 10% FDR cut-off, 2,851 probes (representing 2,721 genes) exhibited differential expression over the 15-hour time course.
Gene expression in vegetative dikaryotic mycelia was compared to K-3 expression by combining single channel dikaryotic data and single channel K-3 expression data. Single channel data from three independent dikaryotic replicates were scaled to the same median, and the data averaged. Data for a given spot were excluded if only one replicate was present. The average dikaryotic data were combined with individual K-3 replicates within four separate GPR files. Data were flagged, OLIN normalized, and analyzed with SAM as described above.
Data clustering and gene ontology
All clustering and Gene Ontology (GO) analysis was performed within the MeV framework [39]. Genes assessed to be differentially expressed across the time course by SAM were clustered using the K-Means Support function, with the Pearson correlation as similarity measure [79] and a successive splitting strategy similar in approach to [80]. Within K-Means Support, the clustering algorithm was performed 100 times, and genes were assigned to a cluster if they fell within the same group for at least 90 of these iterations. Initially, the full set of 2,851 genes was divided into two clusters, after which each of these resultant clusters was further bifurcated repeatedly. Terminal clusters were those that could not be further divided at the 90% level. Nine robust clusters resulted from this strategy.
After removal of duplicate probes to the same gene in a cluster, EASE analysis [40] was performed to determine enrichment of gene classes by gene ontology. Gene ontology terms assigned to genes from the Jan06m300_GLEAN prediction set (11746 of which are represented on the array) were used for EASE analysis. Gene ontology classes were deemed enriched if there was >1 gene of that class in the cluster and the Fisher's Exact statistic was <0.01.
Identification of putative orthologs of C. cinerea, S. cerevisiae, and S. pombe
OrthoMCL [81] was run using WU-BLASTP with significance cutoff of 1e−4, with Smith-Waterman post-alignment, and low-complexity filtering with seg+xnu on the protein sets of Coprinopsis cinerea (v2, Jan 2009; Broad Institute and [6]), Schizosaccharomyces pombe (downloaded Feb 19, 2009; GeneDB) and Saccharomyces cerevisiae (downloaded Feb 20, 2009; SGD). Briefly, OrthoMCL uses the Markov Clustering approach [82], [83] to identify clusters of genes by similarity with additional correction for paralogous gene distances. An inflation value of 1.5 was used to build the clusters. It has been shown to be one of the more accurate approaches to identifying orthology [84]. The OrthoMCL clusters containing C. cinerea genes and single-copy members of described meiotic genes from S. pombe and S. cerevisiae were used to identify the complement of these genes in C. cinerea.
Comparative analysis of gene expression in different fungi
For comparison of genes induced on entry to meiosis in C. cinerea, S. cerevisiae and S. pombe, we identified the time-interval during which spo11 was initially expressed. For C. cinerea, this was the interval between vegetative dikaryotic growth and K−3. Significantly changing genes were identified using SAM as for the meiotic time course. For S. cerevisiae, the suitable interval was between time 0 (the time of nutritional restriction to stimulate meiosis) and 1 hour subsequently [17]. In S. pombe, pat1 mutant vegetative cells were preconditioned for meiosis by starving overnight, before induction of meiosis by a temperature shift at time 0 [19]. Initial expression of spo11 (and other meiotic genes) occurred in the starvation interval, between vegetative and time 0.
To compare expression profiles of genes throughout meiosis, expression data from time courses of C. cinerea, S. cerevisiae and S. pombe were compared using the Pearson correlation within Excel. Genes were compared only if single putative orthologs were found in all three fungal species. Gaps in biological expression data were interpolated by taking the mean of flanking data points. The Mann-Whitney-Wilcoxon test was used to determine whether the distribution of correlation coefficients differed between groups of genes. Statistical comparisons were performed using Minitab (http://www.minitab.com). “Meiotic function” genes were defined by using “meiosis”, “DNA-replication”, “DNA repair”, and “recombination” to search the Saccharomyces Genome Database [48] and the Gene Ontology [49].
Microscopy
Images of meiotic gill cells were obtained as previously described [54].
Data
Raw microarray expression data obtained in this study are accessible in the Gene Expression Omnibus database (GEO), with accession numbers GSE13731 and GSE18540. Table S1 provides summary data on all array probes.
Supporting Information
Zdroje
1. RedheadSA
VilgalysR
MoncalvoJM
JohnsonJ
HoppleJS
2001 Coprinus Pers. and the disposition of Coprinus species sensu lato. Taxon 50 203 241
2. RajuNB
LuBC
1970 Meiosis in Coprinus. 3: Timing of meiotic events in C. lagopus (sensu Buller). Canadian Journal of Botany 48 2183 2186
3. PageSL
HawleyRS
2004 The genetics and molecular biology of the synaptonemal complex. Annual Review of Cell and Developmental Biology 20 525 558
4. HendersonKA
KeeneyS
2005 Synaptonemal complex formation: where does it start? Bioessays 27 995 998
5. LiWX
MaH
2006 Double-stranded DNA breaks and gene functions in recombination and meiosis. Cell Research 16 402 412
6. StajichJE
WilkeSK
AhrenD
AuTCH
BirrenB
2010 Genome evolution in mushrooms: Insights from the genome and assembled chromosomes of Coprinopsis cinerea (Coprinus cinereus). Proc Natl Acad Sci U S A 11889 11894
7. CelerinM
MerinoST
StoneJE
MenzieAM
ZolanME
2000 Multiple roles of Spo11 in meiotic chromosome behavior. Embo Journal 19 2739 2750
8. GereckeEE
ZolanME
2000 An mre11 mutant of Coprinus cinereus has defects in meiotic chromosome pairing, condensation and synapsis. Genetics 154 1125 1139
9. LiLB
GereckeEE
ZolanME
1999 Homolog pairing and meiotic progression in Coprinus cinereus. Chromosoma 108 384 392
10. MerinoST
CummingsWJ
AcharyaSN
ZolanME
2000 Replication-dependent early meiotic requirement for Spo11 and Rad50. Proc Natl Acad Sci U S A 97 10477 10482
11. SeitzLC
TangKL
CummingsWJ
ZolanME
1996 The rad9 gene of Coprinus cinereus encodes a proline-rich protein required for meiotic chromosome condensation and synapsis. Genetics 142 1105 1117
12. StassenNY
LogsdonJM
VoraGJ
OffenbergHH
PalmerJD
1997 Isolation and characterization of rad51 orthologs from Coprinus cinereus and Lycopersicon esculentum, and phylogenetic analysis of eukaryotic recA homologs. Current Genetics 31 144 157
13. Coprinus cinereus Sequencing Project. Broad Institute of MIT and Harvard (www.broad.mit.edu)
14. GathmanAC
LillyWW
Coprinopsis cinerea genome. Available: http://genome.semo.edu/ccin
15. SchlechtU
PrimigM
2003 Mining meiosis and gametogenesis with DNA microarrays. Reproduction 125 447 456
16. ChalmelF
LardenoisA
PrimigM
2007 Toward understanding the core meiotic transcriptome in mammals and its implications for somatic cancer. Testicular Chromosome Structure and Gene Expression 1120 1 15
17. ChuS
DeRisiJ
EisenM
MulhollandJ
BotsteinD
1998 The transcriptional program of sporulation in budding yeast. Science 282 699 705
18. PrimigM
WilliamsRM
WinzelerEA
TevzadzeGG
ConwayAR
2000 The core meiotic transcriptome in budding yeasts. Nature Genetics 26 415 423
19. MataJ
LyneR
BurnsG
BahlerJ
2002 The transcriptional program of meiosis and sporulation in fission yeast. Nature Genetics 32 143 147
20. CnuddeF
HedataleV
de JongH
PiersonES
RaineyDY
2006 Changes in gene expression during male meiosis in Petunia hybrida. Chromosome Research 14 919 932
21. CrismaniW
BaumannU
SuttonT
ShirleyN
WebsterT
2006 Microarray expression analysis of meiosis and microsporogenesis in hexaploid bread wheat. BMC Genomics 7 Available: http://www.biomedcentral.com/1471-2164/7/267. Accessed 2008 October 7
22. MaJ
DuncanD
MorrowDJ
FernandesJ
WalbotV
2007 Transcriptome profiling of maize anthers using genetic ablation to analyze pre-meiotic and tapetal cell types. Plant Journal 50 637 648
23. WangZ
LiangY
LiCJ
XuYY
LanLF
2005 Microarray analysis of gene expression involved in anther development in rice (Oryza sativa L.). Plant Molecular Biology 58 721 737
24. XiaQ
ChengD
DuanJ
WangG
ChengT
2007 Microarray-based gene expression profiles in multiple tissues of the domesticated silkworm, Bombyx mori. Genome Biol 8 R162
25. AndrewsJ
BouffardGG
CheadleC
LuJN
BeckerKG
2000 Gene discovery using computational and microarray analysis of transcription in the Drosophila melanogaster testis. Genome Research 10 2030 2043
26. ReinkeV
GilIS
WardS
KazmerK
2004 Genome-wide germline-enriched and sex-biased expression profiles in Caenorhabditis elegans. Development 131 311 323
27. ReinkeV
SmithHE
NanceJ
WangJ
Van DorenC
2000 A global profile of germline gene expression in C. elegans. Molecular Cell 6 605 616
28. SchlechtU
DemouginP
KochR
HermidaL
WiederkehrC
2004 Expression profiling of mammalian male meiosis and gametogenesis identifies novel candidate genes for roles in the regulation of fertility. Molecular Biology of the Cell 15 1031 1043
29. ChalmelF
RollandAD
Niederhauser-WiederkehrC
ChungSSW
DemouginP
2007 The conserved transcriptome in human and rodent male gametogenesis. Proc Natl Acad Sci U S A 104 8346 8351
30. JohnstonDS
WrightWW
DiCandeloroP
WilsonE
KopfGS
2008 Stage-specific gene expression is a fundamental characteristic of rat spermatogenic cells and Sertoli cells. Proc Natl Acad Sci U S A 105 8315 8320
31. PangALY
JohnsonW
RavindranathN
DymM
RennertOM
2006 Expression profiling of purified male germ cells: stage-specific expression patterns related to meiosis and postmeiotic development. Physiological Genomics 24 75 85
32. TaylorJW
BerbeeML
2006 Dating divergences in the Fungal Tree of Life: review and new analyses. Mycologia 98 838 849
33. BlairJE
2009 Fungi.
HedgesSB
KumarS
The Timetree of Life Oxford Oxford University Press 215 219
34. KuesU
2000 Life history and developmental processes in the basidiomycete Coprinus cinereus. Microbiology And Molecular Biology Reviews 64 316 353
35. WrobelG
PrimigM
2005 Mammalian male germ cells are fertile ground for expression profiling of sexual reproduction. Reproduction 129 1 7
36. MitchellAP
1994 Control of meiotic gene expression in Saccharomyces cerevisiae. Microbiological Reviews 58 56 70
37. RameshMA
MalikSB
LogsdonJM
2005 A phylogenomic inventory of meiotic genes: Evidence for sex in Giardia and an early eukaryotic origin of meiosis. Current Biology 15 185 191
38. MalikSB
PightlingAW
StefaniakLM
SchurkoAM
LogsdonJMJr
2008 An expanded inventory of conserved meiotic genes provides evidence for sex in Trichomonas vaginalis. PLoS ONE 3 e2879.
39. SaeedAI
SharovV
WhiteJ
LiJ
LiangW
2003 TM4: A free, open-source system for microarray data management and analysis. Biotechniques 34 374 378
40. HosackDA
DennisG
ShermanBT
LaneHC
LempickiRA
2003 Identifying biological themes within lists of genes with EASE. Genome Biology 4 R70
41. KandaT
ArakawaH
YasudaY
TakemaruT
1990 Basidiospore formation in a mutant of incompatibility factors and in mutants that arrest at meta-anaphase-I in Coprinus cinereus. Experimental Mycology 14 218 226
42. DiffleyJFX
LabibK
2002 The chromosome replication cycle. Journal of Cell Science 115 869 872
43. JuneauK
PalmC
MirandaM
DavisRW
2007 High-density yeast-tiling array reveals previously undiscovered introns and extensive regulation of meiotic splicing. Proc Natl Acad Sci U S A 104 1522 1527
44. MoldonA
MalapeiraJ
GabrielliN
GogolM
Gomez-EscodaB
2008 Promoter-driven splicing regulation in fission yeast. Nature 455 997 1001
45. KeeneyS
GirouxCN
KlecknerN
1997 Meiosis-specific DNA double-strand breaks are catalyzed by Spo11, a member of a widely conserved protein family. Cell 88 375 384
46. HeywoodP
MageePT
1976 Meiosis in protists - some structural and physiological aspects of meiosis in algae, fungi, and protozoa. Bacteriological Reviews 40 190 240
47. ThomasG
2000 An encore for ribosome biogenesis in the control of cell proliferation. Nature Cell Biology 2 E71 E72
48. http://www.yeastgenome.org/
49. AshburnerM
BallCA
BlakeJA
BotsteinD
ButlerH
2000 Gene Ontology: tool for the unification of biology. Nature Genetics 25 25 29
50. AdkinsRM
GelkeEL
RoweD
HoneycuttRL
2001 Molecular phylogeny and divergence time estimates for major rodent groups: evidence from multiple genes. Mol Biol Evol 18 777 791
51. KleinF
MahrP
GalovaM
BuonomoSBC
MichaelisC
1999 A central role for cohesions in sister chromatid cohesion, formation of axial elements, and recombination during yeast meiosis. Cell 98 91 103
52. WatanabeY
NurseP
1999 Cohesin Rec8 is required for reductional chromosome segregation at meiosis. Nature 400 461 464
53. YoungJA
HyppaRW
SmithGR
2004 Conserved and nonconserved proteins for meiotic DNA breakage and repair in yeasts. Genetics 167 593 605
54. AcharyaSN
ManyAM
SchroederAP
KennedyFM
SavytskyyOP
2008 Coprinus cinereus Rad50 mutants reveal an essential structural role for Rad50 in axial element and synaptonemal complex formation, homolog pairing and meiotic recombination. Genetics 180 1889 1907
55. LakeCM
TeeterK
PageSL
NielsenR
HawleyRS
2007 A genetic analysis of the Drosophila mcm5 gene defines a domain specifically required for meiotic recombination. Genetics 176 2151 2163
56. GertonJL
HawleyRS
2005 Homologous chromosome interactions in meiosis: Diversity amidst conservation. Nature Reviews Genetics 6 477 487
57. HwangSY
OhB
KnowlesBB
SolterD
LeeJS
2001 Expression of genes involved in mammalian meiosis during the transition from egg to embryo. Molecular Reproduction and Development 59 144 158
58. MataJ
BahlerJ
2003 Correlations between gene expression and gene conservation in fission yeast. Genome Research 13 2686 2690
59. RichardGF
KerrestA
LafontaineI
DujonB
2005 Comparative genomics of hemiascomycete yeasts: Genes involved in DNA replication, repair, and recombination. Molecular Biology and Evolution 22 1011 1023
60. SherwoodRK
BennettRJ
2009 Fungal meiosis and parasexual reproduction–lessons from pathogenic yeast. Current Opinion in Microbiology 12 599 607
61. SchurkoAM
LogsdonJMJr
2008 Using a meiosis detection toolkit to investigate ancient asexual “scandals” and the evolution of sex. Bioessays 30 579 589
62. SakaguchiK
KoshiyamaA
IwabataK
2007 Meiosis and small ubiquitin-related modifier (SUMO)-conjugating enzyme, Ubc9. Febs Journal 274 3519 3531
63. KoshiyamaA
HamadaFN
NamekawaSH
IwabataK
SugawaraH
2006 Sumoylation of a meiosis-specific RecA homolog, Lim15/Dmc1, via interaction with the small ubiquitin-related modifier (SUMO)-conjugating enzyme Ubc9. Febs Journal 273 4003 4012
64. MedinaPMB
2003 Isolation of genes required for meiotic synapsis in the basidiomycete Coprinus cinereus. Ph.D Thesis. Chapel Hill, University of North Carolina
65. BozdechZ
ZhuJC
JoachimiakMP
CohenFE
PulliamB
2003 Expression profiling of the schizont and trophozoite stages of Plasmodium falciparum with a long-oligonucleotide microarray. Genome Biology 4 Available: http://genomebiology.com/2003/4/2/R9. Accessed 2006 January 8
66. PearsonWR
LipmanDJ
1988 Improved tools for biological sequence comparison. Proc Natl Acad Sci U S A 85 2444 2448
67. AltschulSF
GishW
MillerW
MyersEW
LipmanDJ
1990 Basic local alignment search tool. Journal of Molecular Biology 215 403 410
68. HeZL
WuLY
LiXY
FieldsMW
ZhouJZ
2005 Empirical establishment of oligonucleotide probe design criteria. Applied and Environmental Microbiology 71 3753 3760
69. MoreyJS
RyanJC
Van DolahFM
2006 Microarray validation: factors influencing correlation between oligonucleotide microarrays and real-time PCR. Biological Procedures Online 175 193
70. IwabataK
KoshiyamaA
YamaguchiT
SugawaraH
HamadaFN
2005 DNA topoisomerase II interacts with Lim15/Dmc1 in meiosis. Nucleic Acids Research 33 5809 5818
71. NamekawaS
IchijimaY
HamadaF
KasaiN
IwabataK
2003 DNA ligase IV from a basidiomycete, Coprinus cinereus, and its expression during meiosis. Microbiology-Sgm 149 2119 2128
72. NaraT
SakaT
SawadoT
TakaseH
ItoY
1999 Isolation of a Lim15/Dmc1 homolog from the basidiomycete Coprinus cinereus and its expression in relation to meiotic chromosome pairing. Molecular and General Genetics 262 781 789
73. YamaguchiT
NamekawaSH
HamadaFN
KasaiN
NaraT
2004 Expression of flap endonuclease-1 during meiosis in a basidiomycete, Coprinus cinereus. Fungal Genetics And Biology 41 493 500
74. ValentineG
WallaceYJ
TurnerFR
ZolanME
1995 Pathway analysis of radiation-sensitive meiotic mutants of Coprinus cinereus. Molecular & General Genetics 247 169 179
75. ZolanME
TremelCJ
PukkilaPJ
1988 Production and characterization of radiation-sensitive meiotic mutants of Coprinus cinereus. Genetics 120 379 387
76. GentlemanRC
CareyVJ
BatesDM
BolstadB
DettlingM
2004 Bioconductor: open software development for computational biology and bioinformatics. Genome Biology 5 Available http://genomebiology.com/2004/5/10/R80. Accessed 2007 June 23
77. FutschikME
CromptonT
2005 OLIN: optimized normalization, visualization and quality testing of two-channel microarray data. Bioinformatics 21 1724 1726
78. TusherVG
TibshiraniR
ChuG
2001 Significance analysis of microarrays applied to the ionizing radiation response. Proc Natl Acad Sci U S A 98 5116 5121
79. SoukasA
CohenP
SocciND
FriedmanJM
2000 Leptin-specific patterns of gene expression in white adipose tissue. Genes & Development 14 963 980
80. ErnstJ
VainasO
HarbisonCT
SimonI
Bar-JosephZ
2007 Reconstructing dynamic regulatory maps. Molecular Systems Biology 3 74
81. LiL
StoeckertCJJr
RoosDS
2003 OrthoMCL: identification of ortholog groups for eukaryotic genomes. Genome Research 13 2178 2189
82. EnrightAJ
Van DongenS
OuzounisCA
2002 An efficient algorithm for large-scale detection of protein families. Nucleic Acids Res 30 1575 1584
83. van DongenS
2005 Graph clustering by flow simulation. Ph.D. Thesis. University of Utrecht, Netherlands
84. ChenF
MackeyAJ
VermuntJK
RoosDS
2007 Assessing performance of orthology detection strategies applied to eukaryotic genomes. PLoS ONE 2 e383.
85. PadmoreR
CaoL
KlecknerN
1991 Temporal comparison of recombination and synaptonemal complex formation during meiosis in S. cerevisiae. Cell 66 1239 1256
86. HunterN
KlecknerN
2001 The single-end invasion: An asymmetric intermediate at the double-strand break to double-Holliday junction transition of meiotic recombination. Cell 106 59 70
87. BahlerJ
SchuchertP
GrimmC
KohliJ
1991 Synchronized meiosis and recombination in fission yeast - Observations with Pat1-114 diploid cells. Current Genetics 19 445 451
Štítky
Genetika Reprodukční medicínaČlánek vyšel v časopise
PLOS Genetics
2010 Číslo 9
- Kazuistika – Perspektivy využití precizované medicíny v rámci personalizované specifické terapie onkologických pacientů
- Nobelova cena za chemii pro genetické nůžky: Objev, který změní naši budoucnost?
- Technologie na bázi RNA v klinické praxi: od přebarvených petúnií k terapii vzácných a dosud jen obtížně léčitelných chorob u lidí
- „Nepředstavovali jsme si, že náš výzkum povede přímo ke vzniku nových léků, dokonce ještě za našeho života“
- Bezplatné služby pro diagnostiku ATTRv amyloidózy pro kardiology
Nejčtenější v tomto čísle
- Synthesizing and Salvaging NAD: Lessons Learned from
- Optimal Strategy for Competence Differentiation in Bacteria
- Long- and Short-Term Selective Forces on Malaria Parasite Genomes
- Identifying Signatures of Natural Selection in Tibetan and Andean Populations Using Dense Genome Scan Data
Zvyšte si kvalifikaci online z pohodlí domova
Mazová zátka a její řešení
nový kurzVšechny kurzy