-
Články
- Vzdělávání
- Časopisy
Top články
Nové číslo
- Témata
- Kongresy
- Videa
- Podcasty
Nové podcasty
Reklama- Kariéra
Doporučené pozice
Reklama- Praxe
Longitudinal Genome-Wide Association of Cardiovascular Disease Risk Factors in the Bogalusa Heart Study
Cardiovascular disease (CVD) is the leading cause of death worldwide. Recent genome-wide association (GWA) studies have pinpointed many loci associated with CVD risk factors in adults. It is unclear, however, if these loci predict trait levels at all ages, if they are associated with how a trait develops over time, or if they could be used to screen individuals who are pre-symptomatic to provide the opportunity for preventive measures before disease onset. We completed a genome-wide association study on participants in the longitudinal Bogalusa Heart Study (BHS) and have characterized the association between genetic factors and the development of CVD risk factors from childhood to adulthood. We report 7 genome-wide significant associations involving CVD risk factors, two of which have been previously reported. Top regions were tested for replication in the Young Finns Study (YF) and two associations strongly replicated: rs247616 in CETP with HDL levels (combined P = 9.7×10⁻²⁴), and rs445925 at APOE with LDL levels (combined P = 8.7×10⁻¹⁹). We show that SNPs previously identified in adult cross-sectional studies tend to show age-independent effects in the BHS with effect sizes consistent with previous reports. Previously identified variants were associated with adult trait levels above and beyond those seen in childhood; however, variants with time-dependent effects were also promising predictors. This is the first GWA study to evaluate the role of common genetic variants in the development of CVD risk factors in children as they advance through adulthood and highlights the utility of using longitudinal studies to identify genetic predictors of adult traits in children.
Published in the journal: . PLoS Genet 6(9): e32767. doi:10.1371/journal.pgen.1001094
Category: Research Article
doi: https://doi.org/10.1371/journal.pgen.1001094Summary
Cardiovascular disease (CVD) is the leading cause of death worldwide. Recent genome-wide association (GWA) studies have pinpointed many loci associated with CVD risk factors in adults. It is unclear, however, if these loci predict trait levels at all ages, if they are associated with how a trait develops over time, or if they could be used to screen individuals who are pre-symptomatic to provide the opportunity for preventive measures before disease onset. We completed a genome-wide association study on participants in the longitudinal Bogalusa Heart Study (BHS) and have characterized the association between genetic factors and the development of CVD risk factors from childhood to adulthood. We report 7 genome-wide significant associations involving CVD risk factors, two of which have been previously reported. Top regions were tested for replication in the Young Finns Study (YF) and two associations strongly replicated: rs247616 in CETP with HDL levels (combined P = 9.7×10⁻²⁴), and rs445925 at APOE with LDL levels (combined P = 8.7×10⁻¹⁹). We show that SNPs previously identified in adult cross-sectional studies tend to show age-independent effects in the BHS with effect sizes consistent with previous reports. Previously identified variants were associated with adult trait levels above and beyond those seen in childhood; however, variants with time-dependent effects were also promising predictors. This is the first GWA study to evaluate the role of common genetic variants in the development of CVD risk factors in children as they advance through adulthood and highlights the utility of using longitudinal studies to identify genetic predictors of adult traits in children.
Introduction
Cardiovascular disease (CVD) affects over 79 million people in the United States [1], and is the leading cause of death worldwide [2]–[4]. Identifying the genetic determinants of CVD can lead to more effective diagnostics, prognostics, therapeutics, and, ultimately, preventive strategies. The best chance for prevention would be to identify risk at the earliest possible age. Genome-wide association (GWA) leveraging cross-sectional phenotypic data has been a particularly useful approach to identifying loci that influence many of the quantitative risk factors of CVD [5]–[10], however the use of cross sectional data does not provide insight into how such risk factors develop over time. Longitudinal studies, particularly those that begin in childhood, allow for the identification of risk profiles of susceptible individuals before disease onset. The Bogalusa Heart Study (BHS) is a longitudinal study focused on the early natural history of CVD. The BHS began in 1973 and includes up to 9 phenotypic screenings in childhood (4–17 years of age) and up to 10 adult (18–48 years of age) cross-sectional screenings. We have conducted a longitudinal genome-wide association study on a subset of the total sample of unrelated individuals with a large number of measurements (mean number of measurements = 8, range = 4–13) and are of European Ancestry (N = 525).
Results
Longitudinal GWA
We conducted a genome-wide association study of longitudinal measures of 12 traits measured from childhood through adulthood on participants of the BHS of European ancestry: anthropomorphic (height, weight, and waist circumference), blood pressure (BP) (diastolic and systolic BP), heart rate, blood lipids (low density lipoprotein cholesterol (LDL), high density lipoprotein cholesterol (HDL), total cholesterol (TC), and triglycerides), and metabolic traits (glucose and insulin). Genotyping was performed on the Illumina Human610 and HumanCVD BeadChips [11] for a total of 545,821 SNPs passing QC and allele frequency filters (see Materials and Methods). Imputation was performed using the CEU HapMap 2 as a reference population with the computer program MACH v.1.0.16 (http://www.sph.umich.edu/csg/yli/mach/) [12], providing genotype estimates for an additional 1,622,114 SNPs. For each SNP, we tested whether it had an average linear effect over time (SNP effect), and whether it entered into a time-dependent effect (SNPxAGE interaction effect), such that the genotype is associated with variation in the linear trajectory of the trait from childhood through adulthood. Both SNP and SNPxAGE effects were calculated using linear mixed models as implemented in the R nlme package [13], adjusting for age and gender.
Table 1 lists all regions showing SNP effect associations (P<10−6) and Table 2 lists all regions showing association (P<10−6) with SNPxAGE effects. We analyzed the regions surrounding the top associations for consistency with recombination hotspots and LD relationships (Figure S1) and provide Manhattan plots of each trait association (Figure S2). From both sets of analyses, there were 5 novel associations with a P-value less than 5×10⁻⁸ and 6 novel regions where there were at least 10 genotyped or imputed SNPs with P<10−5. The most significant association (rs7890572, P = 3.8×10⁻¹⁰) was observed with a linear triglyceride trajectory effect (i.e., SNPxAGE effect) on the X chromosome within the IL1RAPL1 gene and near the gene encoding glycerol kinase (GK), in which mutations have been implicated in pseudo-hypertriglyceridemia, caused by high levels of glycerol creating measurement artifacts in the triglyceride assay [14]. A novel association of potential biological interest involved a SNP effect on insulin levels with variation in the CHN2 locus (rs3793275, P = 5.8×10⁻⁹), a beta-chimerin that has recently been described as part of a fusion gene also containing the insulin receptor that was shown to be responsible for severe insulin deficiency [15]. This SNP is also associated with glucose trajectories in our dataset (SNPxAGE; P = 1.5×10⁻⁷). In the 7q11 region, 25 SNPs are associated (P<10−5) with diastolic BP (SNP effect; peak SNP rs709595, P = 7.0×10⁻⁷). The calcitonin gene-related peptide receptor (CRCP) is approximately 200 kb from the top SNP, but contains SNPs that are in LD with the top SNP (see Figure S1). The calcitonin gene-related peptide is a vasodilator [16] and its receptor CRCP has been previously implicated in hypertension in a small candidate gene association study of hypertension in Japanese individuals [17].
Tab. 1. Top SNP effect GWA hits for 12 phenotypes. 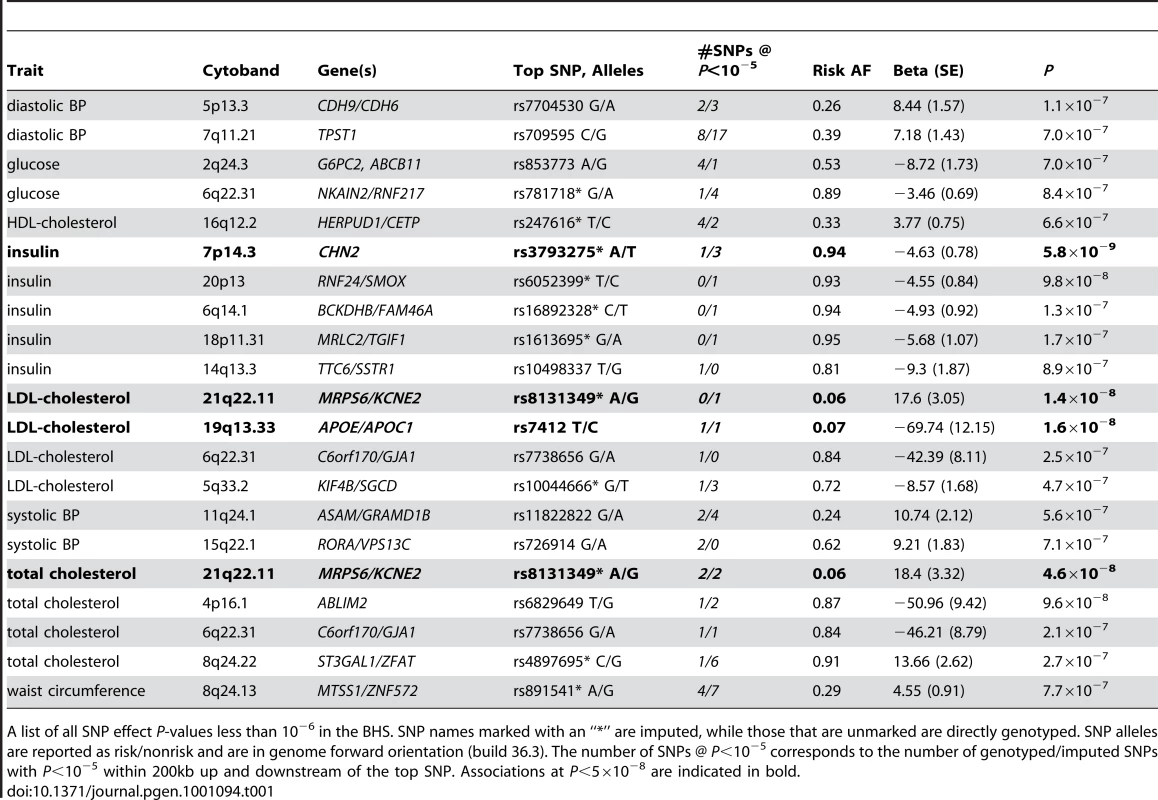
A list of all SNP effect P-values less than 10−6 in the BHS. SNP names marked with an “*” are imputed, while those that are unmarked are directly genotyped. SNP alleles are reported as risk/nonrisk and are in genome forward orientation (build 36.3). The number of SNPs @ P<10−5 corresponds to the number of genotyped/imputed SNPs with P<10−5 within 200kb up and downstream of the top SNP. Associations at P<5×10⁻⁸ are indicated in bold. Tab. 2. Top SNPxAGE effect GWA hits for 12 phenotypes. 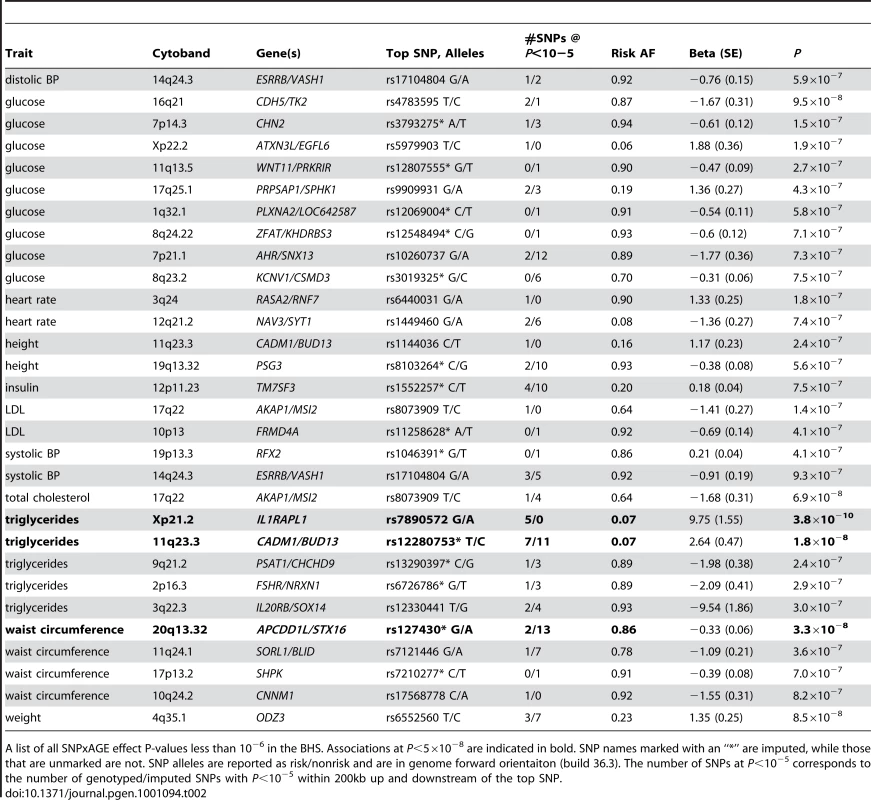
A list of all SNPxAGE effect P-values less than 10−6 in the BHS. Associations at P<5×10⁻⁸ are indicated in bold. SNP names marked with an “*” are imputed, while those that are unmarked are not. SNP alleles are reported as risk/nonrisk and are in genome forward orientaiton (build 36.3). The number of SNPs at P<10−5 corresponds to the number of genotyped/imputed SNPs with P<10−5 within 200kb up and downstream of the top SNP. In addition to novel associations, there were three regions showing SNP associations that have been previously identified in GWA studies: rs853773 [18] near G6PC2 was associated with a glucose SNP effect (P = 7.0×10⁻⁷), rs247616 [5] near CETP was associated with an HDL SNP effect (P = 6.6×10⁻⁷), and the APOE e2 SNP rs7412 [19] was associated with a genome-wide significant LDL SNP effect (P = 1.6×10⁻⁸). A region near APOA5 that had been previously implicated in triglyceride levels showed a significant SNPxAGE effect on triglycerides in our study (rs12280753; P = 1.8×10⁻⁸). Although the nearest gene to rs12280753 is not APOA5, this SNP was also the most strongly associated SNP in previous studies of adult triglyceride levels [5], [10], [20].
Replication in the Young Finns
We pursued replication of these findings in genotyped individuals within the Young Finns (YF) cohort, consisting of 2,442 Finnish individuals tracked from childhood through middle adulthood (ages 3–45) with three measures in young individuals (ages 3–24) and two measures in older individuals (ages 24–45). These individuals have been genotyped on a custom-built Illumina genotyping chip (670K). Using the same analysis methods, we tested whether the top SNP was associated in the YF study (Table 3). Imputed genotype dosages were used when direct genotype data was not available. For the APOE-e2 SNP rs7412, which is not in HapMap or on the 670K chip, we used the SNP with the next strongest association in the BHS (rs445925). There were two SNPs that significantly replicated beyond the multiple testing threshold (P<0.05/51 = 1×10⁻³): the rs247616 SNP at CETP (P = 1.7×10⁻¹⁸), and rs445925 at APOE (P = 4.1×10⁻¹⁵). There was no trend to replicate the direction of effect between the studies: within the SNP effects, there were 12/21 (57%, chi-square P = 0.51) markers that showed the same direction of effect, while within SNPxAGE effects, there were 14/30 (47%, chi-square P = 0.72). The samples were combined and P-values were calculated for the combined BHS and YF data, using study as a covariate (Table 3). The associations at rs247616 at CETP with HDL-cholesterol (P = 9.7×10⁻²⁴) and rs445925 at APOE with LDL-cholesterol (P = 8.7×10⁻¹⁹) were strongly significant, but no other regions in the combined BHS/YF data reached genome-wide significance of P<5×10⁻⁸.
Tab. 3. Replication results in the Young Finns. 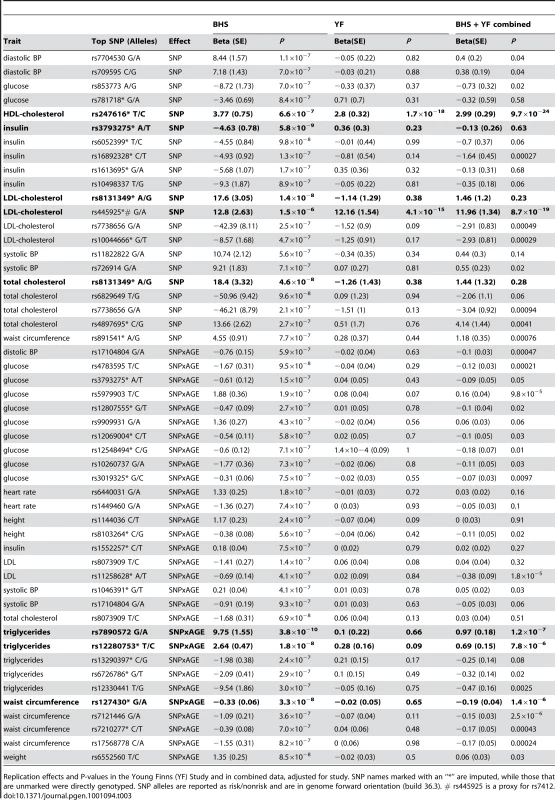
Replication effects and P-values in the Young Finns (YF) Study and in combined data, adjusted for study. SNP names marked with an “*” are imputed, while those that are unmarked were directly genotyped. SNP alleles are reported as risk/nonrisk and are in genome forward orientation (build 36.3). # rs445925 is a proxy for rs7412. Prediction of adult values given childhood values
Genetic variants will be most useful for trait prediction when they are associated with a trait above and beyond other known risk factors. In addition, the ability to predict adult trait levels in children, before disease onset, can lead to a disease prevention strategy. In longitudinal studies starting in childhood and going into adulthood, we can ask whether genetic loci are associated with the adult trait level above and beyond the trait level seen in the first measure taken in childhood. To test this hypothesis, we evaluated whether our associated markers were likely to be predictive of adult levels of the traits, after adjustment for trait levels in childhood. To account for variation in data collection, we also included the age at each of these measures as well as gender as covariates in the analysis. Within the BHS, variants that were characterized as SNPxAGE effects were more likely to be predictive of adult values after correcting for childhood values, which is expected since these variants were characterized in BHS initially (Table 4). In the YF study, however, we also saw more SNPxAGE variants associated with adult levels given childhood levels (Table 4). There were 6 variants that were associated with adult levels in the YF study at P<0.05, with 2 corresponding to the genome-wide significant SNP effects and 4 corresponding to BHS SNPxAGE variants. Only the association of rs445925 with LDL-cholesterol was strong enough to withstand multiple corrections. Further analysis of this observation is warranted in a larger cohort.
Tab. 4. Association of GWAS SNPs with adult trait levels after adjusting for childhood levels. 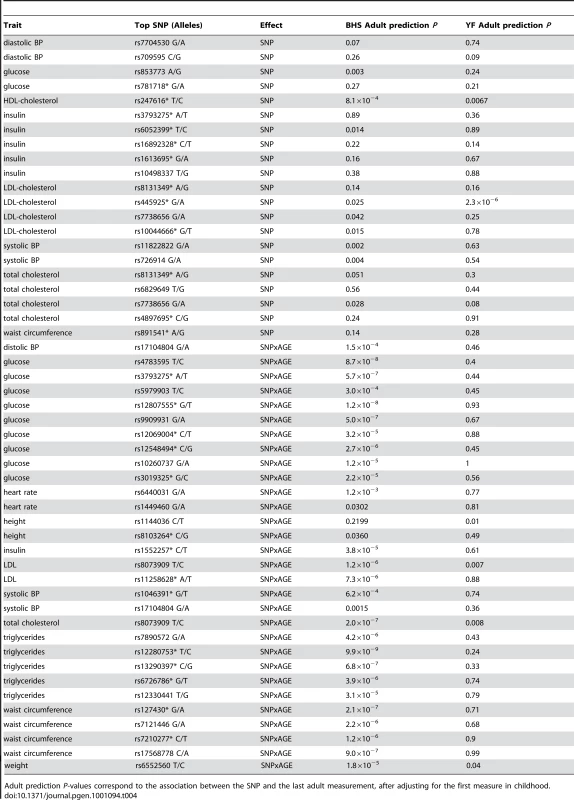
Adult prediction P-values correspond to the association between the SNP and the last adult measurement, after adjusting for the first measure in childhood. Previously identified markers
We assessed whether associations that have been described in previous adult cross-sectional GWA studies exhibit consistent effects over time and whether the effect sizes observed in children through middle-aged adults are consistent with those previously described. We identified 169 SNP-trait associations (see Materials and Methods) for which we had directly genotyped or imputed genotype data. We first estimated our power to detect each previous association at alpha = 0.05 under a more structured, but similar study design (i.e., 8 equally spaced measurements), given the previously reported effect size and allele frequency. Under this model, we would expect to have detected 40/169 (24%) associations at P<0.05, and we observed a similar number of SNP effects in the BHS data (32/169; 19%). We evaluated the associations across all traits together by comparing how well the previously reported effect size was recapitulated in the BHS GWA (Figure 1A). For consistency across studies and traits, if an effect size was not already expressed in terms of percent standard deviation (%SD), we converted the previously reported effect size into %SD and compared the previous effect size to the SNP effect. The previously reported effect size was a strong predictor of the SNP effect (slope = 0.47, P = 1.2×10⁻²¹), suggesting that SNPs that have been previously identified in adult cross-sectional GWA studies are good predictors of time-averaged effects in the BHS sample.
Fig. 1. Effects of previously identified variants in the BHS. 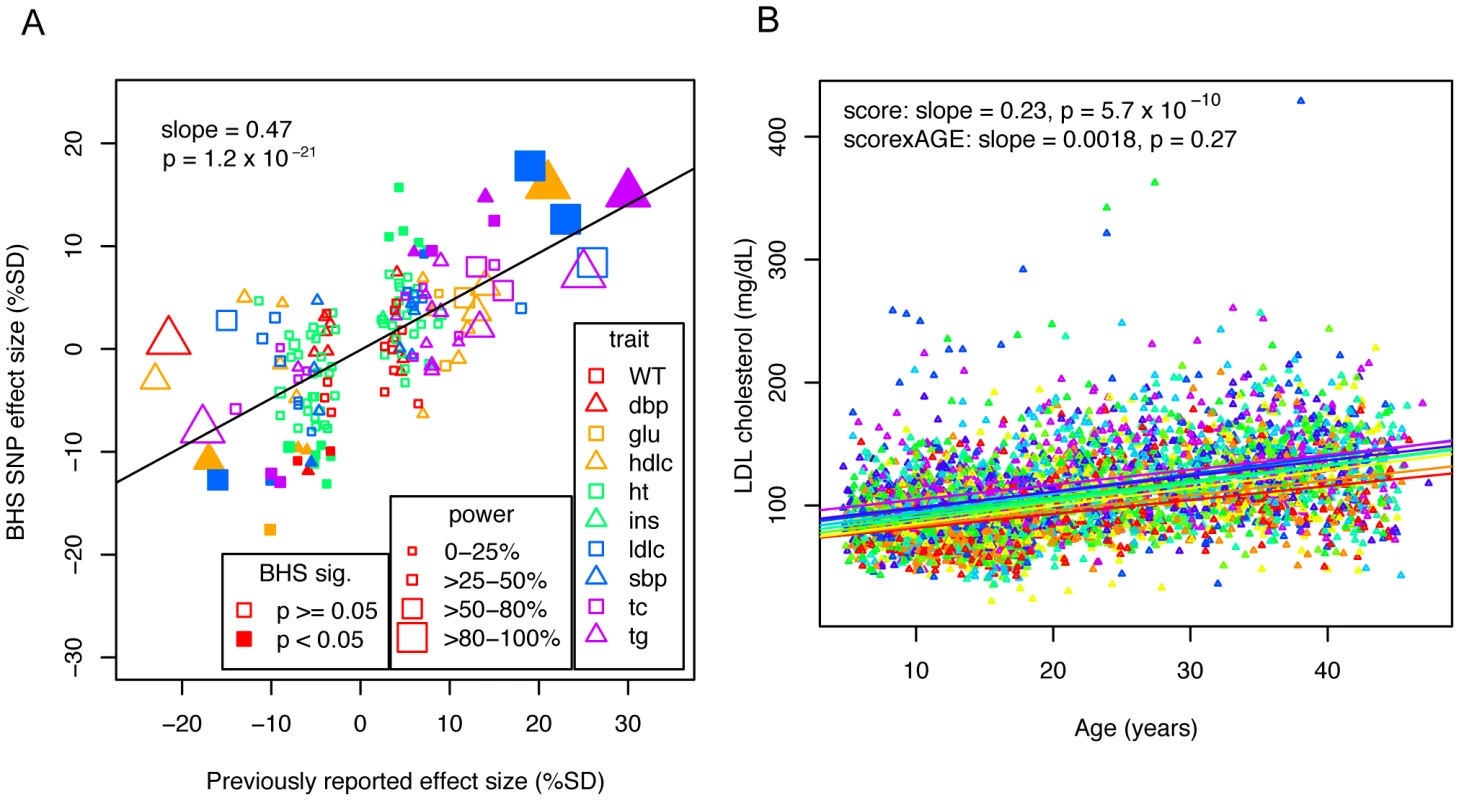
A) Effect sizes of previously identified markers are plotted against observed effects in the BHS. SNP-trait associations are plotted by shape and color to indicate trait. The size of the point indicates the power to detect an association of the magnitude previously described, and whether a point is filled in or not indicates whether the association was significant at P<0.05 in the BHS. Linear regression lines are shown, with the slope and p-value of the association between previously reported effect sizes and the observed effect sizes. B) Individuals were scored based on the effect size of each previously identified marker and are grouped and color-coded based on the decile of their score. Linear lines are linear regression estimates of the average trajectory of each decile group. We also determined whether the same previously identified SNPs were likely to show effects on a trait over time (SNPxAGE effects). Under a simple model that assumed that all of the effect in adults is due to a locus that has no effect in childhood, we estimated power to detect such an interaction effect in a similarly structured study with 8 repeated measures. Given these assumptions, we would have expected to see 24/169 (14%) SNPxAGE associations. We observed 6/169 (3.6%) SNPs that showed SNPxAGE effects at P<0.05, indicating that effects seen in SNPs described in adult GWA studies are not due primarily to differences in effects over time, although larger studies will be required to definitively characterize this.
Composite scoring
We considered whether a composite genotype score would better predict overall CVD risk factor trajectories or time-dependent effects than any single locus. For each person and each trait, we created a score by summing the expected effect in percent standard deviation of each allele that the person carried. We then determined whether the score was associated with the trait's average value and trajectory by using this score as a predictor for each trait in a linear mixed model, adjusting for age and gender. We assessed the score's average effect across time (score effect) and whether or not there was a time-dependent effect (score*age effect). The traits HDL, LDL, total cholesterol, triglycerides, and height showed strongly significant score effects, while only triglycerides showed a score*age effect (Table 5). Longitudinal data was visualized by color-coding the individuals according to the decile of their overall score and the average linear trend of each group was plotted (LDL, Figure 1B and others in Figure S3). These results indicate that the cumulative effects of SNPs that are identified in large adult cross-sectional studies are generally age-independent effects, with an exception in triglycerides, which was the only trait to show a significant score*age effect. We additionally tested whether previously identified variants were predictive of adult levels after adjusting for childhood levels (Table 6). We saw that 25/169 (14.8%) showed association at P<0.05. These observations in the BHS data suggest that even though results from existing GWA studies demonstrate age-independent effects, they can be predictive of trait values in adults.
Tab. 5. P-values associated with score and score*age effects (Age and Sex adjusted). 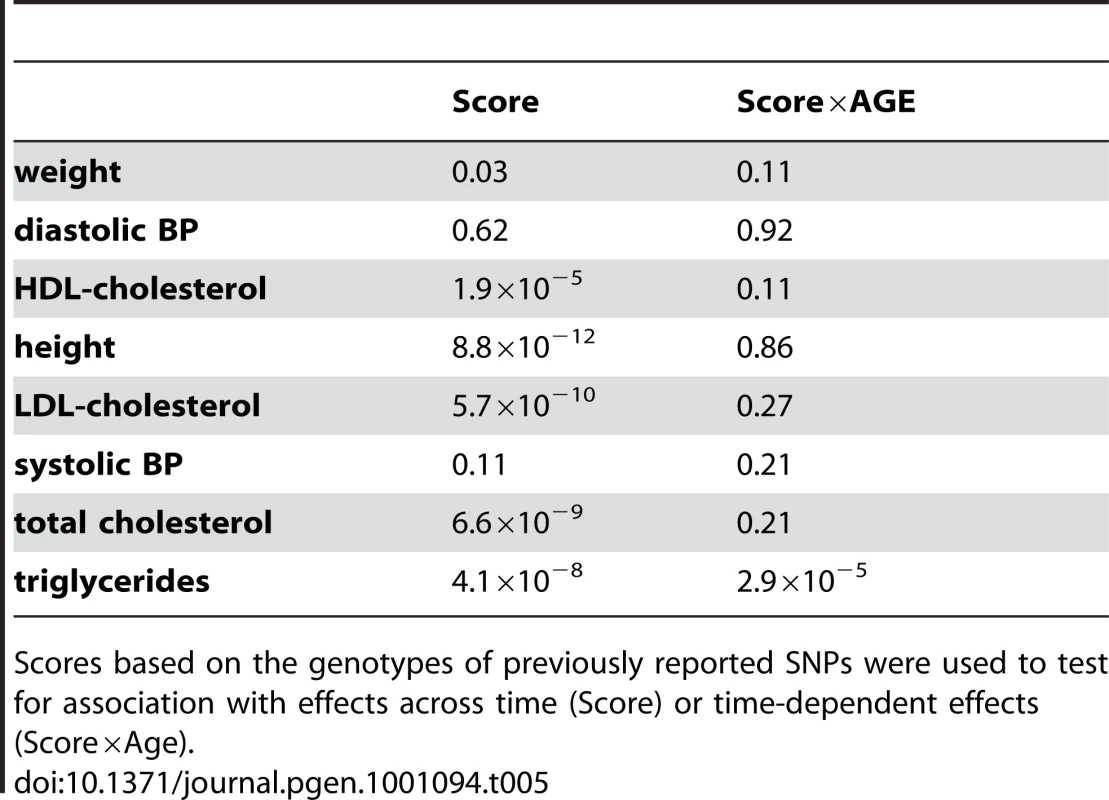
Scores based on the genotypes of previously reported SNPs were used to test for association with effects across time (Score) or time-dependent effects (Score×Age). Tab. 6. P-values for predictive ability of previously identified SNPs, after adjusting for first measure in childhood. 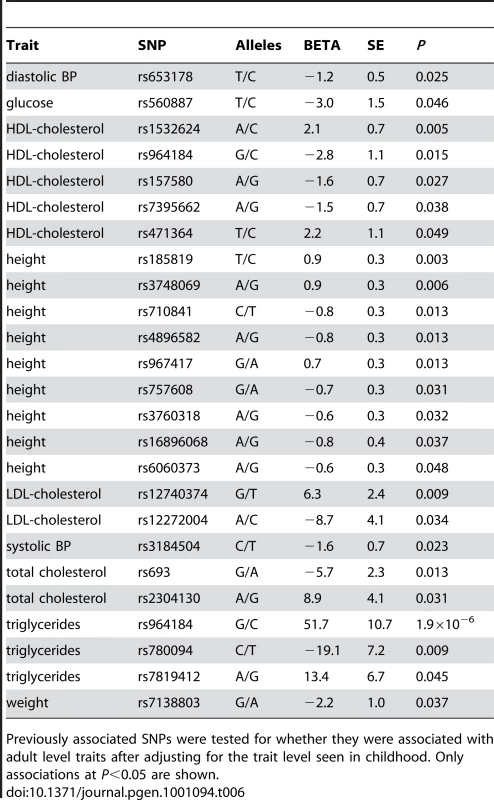
Previously associated SNPs were tested for whether they were associated with adult level traits after adjusting for the trait level seen in childhood. Only associations at P<0.05 are shown. Discussion
We identified seven associations at P<5×10⁻⁸ showing either time-averaged or time-dependent effects on CVD risk factors in the BHS, two of which have been previously characterized. Of all associations with P<10−6, we were able to strongly replicate the association in the YF with HDL-cholesterol at CETP with a combined P = 9.7×10⁻²⁴, and LDL-cholesterol at APOE with a combined P = 8.7×10⁻¹⁹. Differences that exist between the cohorts, such as birth year (15 year difference), and environmental differences could have influenced replication of the remaining SNPs. Larger discovery studies will also have better resolution and power to accurately estimate longitudinal effect sizes, likely allowing for more robust replication.
We evaluated the longitudinal effects of markers that have been previously identified in adult GWA studies. We found that previously identified markers showed time-averaged effects consistent with their reported effect size. This argues that the linear mixed model is an effective tool for modeling time-averaged effects in a GWA setting and that adult GWA studies may be capturing variation that tends to have consistent effects over time. Using a scoring approach, the overall signal from previously identified markers tended to have strong associations with time-averaged effects, but except in the case of triglycerides, did not show time-dependent effects. Previously identified markers were also likely to be associated with adult trait levels above and beyond childhood levels. Although we primarily describe time-averaged effects for previously identified markers, there may be more subtle time-dependent effects that larger studies will be better able to capture.
It is important to note that although we focused on analysis of linear trends over time, a linear model may not best capture these trends. Other approaches could be explored further such as non-linear models when there is an a priori expectation of trait trajectory, or model free approaches. These additional models could lead to additional variations that influence trajectories, or more precise estimations of effect size.
Longitudinal studies are particularly suited to capturing effects that vary over time. Genetic variation that shows a time-dependent effect may help predict those that will go onto develop disease before they show symptomatic traits. The discovery of variants associated with SNPxAGE interaction effects could thus be used to screen young individuals who are pre-symptomatic and provide the opportunity for preventive measures decades before disease onset. We explored how well the markers that we identified predicted adult traits after correcting for childhood traits and suggest further study of variants with SNPxAGE effects as possibly better predictors of adult trait levels above and beyond childhood levels. These results are consistent with the idea that longitudinal studies may be a useful tool to better capture time-dependent variation that could ultimately be better predictive of future outcomes.
Materials and Methods
Ethics statement
The study was approved by the institutional review board and the ethics committee of each institution. Written informed consent was obtained from each participant in accordance with institutional requirements and the Declaration of Helsinki Principles. All subjects in the BHS gave informed consent at each examination, and for those under 18 years of age, consent of a parent/guardian was obtained. Study protocols were approved by the Institutional Review Board of the Tulane University Health Sciences Center.
The Bogalusa Heart Study (BHS)
Between 1973 and 2008, 9 cross-sectional surveys of children aged 4–17 years and 10 cross-sectional surveys of adults aged 18–48 years (Figure S4), who had been previously examined as children, were conducted for CVD risk factor examinations in Bogalusa, Louisiana. This panel design of repeated cross-sectional examinations has resulted in serial observations from childhood to adulthood. By linking the 19 surveys, 12,163 individuals have been examined, with 37,317 observations. In the ongoing Longitudinal Aging Study funded by NIH and NIA since 2000, there are 1,202 subjects who have been examined 4–14 times from childhood to adulthood and have DNA available for GWA genotyping. Based on the analysis of identity-by-state (IBS) sharing from whole genome genotyping data, we focus on a subset of 525 genotyped individuals who are of European ancestry and unrelated (229 male, 296 female). The average number of measurements per individual is 8 (range 4–13).
The Cardiovascular Risk in Young Finns Study (YF)
The YF cohort is a Finnish longitudinal population study sample on the evolution of cardiovascular risk factors from childhood to adulthood [21]. The first cross-sectional study was conducted in 1980 in five centers and included 3,596 participants in the age groups of 3, 6, 9, 12, 15, and 18, who were randomly chosen from the national population register. After baseline in 1980 these subjects have been re-examined in 1983 and 1986 as young individuals, and in 2001 and 2007 as older individuals. Genotype data for the present analysis (DNA collected in 1980, 2001 and 2007) was available for 2,442 individuals.
In the latest follow-up in 2001, a total of 2,283 participants (of which DNA is available from 2,265 participants) were examined for numerous study variables, including serum lipoproteins, glucose, insulin, obesity indices, blood pressure, life-style factors, smoking status, alcohol use and general health status.
Genotyping & QC
BHS genotyping
We genotyped 1,202 BHS samples using the Illumina Human610 Genotyping BeadChip [22], and HumanCVD BeadChip [11]. Genotypes were called using a clustering algorithm in Illumina's BeadStudio software. Three samples on the Human610 BeadChip gave poor results (call rates <99%) and were discarded from the study. In addition, 3 samples had a different estimated gender from genotype data versus gender provided with the phenotype data and were also discarded. SNPs with call rates <90% were discarded, and SNPs with call rates between 90–95% or cluster separation score <0.3 were manually inspected and cluster positions were edited if needed. We removed approximately 30,000 SNP loci (4.9%) due to poor performance. The final average sample call rate was 99.95% for the Human610 BeadChip, and 99.32% for the CVD BeadChip. We assessed reproducibility by genotyping 29 samples in duplicate (18 known replicates, 11 blind replicates), and observed >99.99% identical genotype calls on both BeadChips. Finally we observed 99.98% genotype concordance in 12,581 overlapping SNPs between the 610 and CVD BeadChips. A final list of 545,821 unique SNPs passed QC and allele frequency filters.
YF study genotyping
For replication, we had genome-wide SNP data from a custom Illumina BeadChip containing 670,000 SNPs and CNV probes from 2,442 YF participants (1,123 males, 1,319 females). The custom content on the custom 670K array replaced some poor performing SNPs on the Human610 BeadChip and added more CNV content, and includes 546,677 SNPs passing QC from 594,210 SNPs on the chip. The custom 670K chip shares 562,643 SNPs in common with the Illumina Human610 BeadChip. Genotypes were called using Illumina's clustering algorithm [23]. A total of 2,556 samples were genotyped. After initial clustering, we removed 2 subjects for poor call rates (CR<0.90), and 54 samples failed subsequent QC (i.e., duplicated samples, heterozygosity, low call rate, or custom SNP fingerprint genotype discrepancy). The following filters were applied to the remaining data: MAF 0.01, GENO 0.05, MIND 0.05, and HWE 1×10⁻⁶. Three of 2,500 individuals were removed for low genotyping (MIND>0.05), 11,766 markers were excluded based on HWE test (P≤1×10⁻⁶), 7,746 SNPs failed missingness test (GENO>0.05), 34,596 SNPs failed frequency test (MAF<0.01) and one individual failed gender check. A final list of 546,677 SNPs passed QC and allele frequency filters.
Assessing cryptic relatedness
Bogalusa participants with genotype data were filtered for relatedness. Whole-genome genotype data was used to calculate identity-by-descent (PI_HAT) values in PLINK [24]. Individuals were then removed such that no pair of individuals retained a PI_HAT value greater than 0.10. PI_HAT values were consistent with known sibling and half-sibling relationships. The final list consisted of 525 BHS individuals.
In the YF data, there were 546,770 SNPs and 2,496 individuals which were utilized to generate an identity-by-descent (IBD) matrix file in PLINK [24]. There were 51 pairs of individuals with pi-hat greater than 0.2 thus these individuals removed due to possible relatedness. One of the pair was removed using greater missingness as criteria. The final list consisted of 2,442 YF subjects.
Imputation
We imputed genotypes in genotyped BHS individuals for all HapMap (phase II, release 22) SNPs using the program MACH [12]. The best estimate of the quantitative allele dosage was used as the predictor in association tests. The CEU HapMap phased haplotypes were used as a reference (N = 60 unrelated individuals). This resulted in overall allelic error rates of 1.6%. SNPs were filtered for minor allele frequency (<5%) and r2 with respect to genotyped SNPs (<0.30), resulting in genotype data in a total of 2,173,391 SNPs. Imputation was performed in the YF samples using MACH with the HapMap release 22 CEU haplotypes as reference.
Prediction ability
Previously identified markers were obtained through the NHGRI database [25] (accessed 5/20/09). Marker associations, alleles, and allele frequencies were verified with those reported in the original papers and corrected if required. Markers were used if the alleles at the locus provided unambiguous orientation or if the allele frequencies were different enough between A/T and C/G SNPs to distinguish which allele was the associated allele. We thus excluded any A/T or C/G SNPs with a minor allele frequency >0.4 and required that the allele frequency in the previously reported study be within 10% of the allele frequency in the BHS. We excluded studies of non-European Ancestry origin. One SNP per cytogenic region was used for each phenotype: the SNP with the smallest previously reported p-value was used.
Effect size was translated to percent standard deviation. If the effect size was reported in an absolute measure (e.g. cm for height), then the standard deviation from the BHS study was used. Standard deviation was calculated from the standard error of the SNP association reported in the linear mixed model. For glucose, cholesterol, and triglycerides measures, units were converted to mg/dl before converting to %SD.
A risk value was calculated for each individual based on the imputed genotype and previously reported effect size, converted to %SD. The %SD was multiplied by the allelic dosage for each SNP and summed over all the associated SNPs for each phenotype. The resulting risk value was then used as a predictor for the BHS individuals.
Genome-wide association
GWA was performed using linear mixed model regression with fixed covariates of age and sex, random slope, and random intercept. Genotypes were coded as 0,1, or 2 when the SNP was genotyped and by dosage (scale 0–2) when imputed. Analysis was performed within the nlme package in R [13]. Covariance structures were determined by testing all spatial covariance structures (exponential, Gaussian, linear, rational quadradics, and spherical) with covariates and a sample of SNPs, and picking the structure that best fit the data as measured by the lowest AIC (Akaike Information Criteria) value. SNP and SNPxAGE interaction effects were estimated separately. Although the default nlme optimizer tended to have difficulty converging, we obtained good results by using the optim optimizer on data where all missing data was removed. The number of SNPs that converged and for which we obtained results is listed in Table S1. Analyses were performed on a compute cluster with 600,000 tests taking ∼3 hrs on 64 processors.
Filtering for genomic inflation
If genomic inflation factors were inflated or deflated, we reran the GWA using the first four MDS components as covariates. If the inflation factor was still less than 0.90 or greater than 1.05, we removed the analysis. In addition, we filtered body mass index (BMI) SNP, BMI SNPxAGE, and weight SNP analyses completely from the analysis due to a combination of consistently inflated or deflated genomic inflation factors or a long list of highly associated SNPs.
Power
Power was calculated using G*Power 3 [26].We used the MANOVA repeated measures module with 8 repeated measures with a correlation of 0.5 between them, similar to the correlations seen in this study. We estimated power for between-factor and between-within interaction effects. Effect size (f) was calculated asand R2 was calculated from the allele frequencies as reported in the original associations (p and q) and the effect size in terms of %SD [27].
Supporting Information
Zdroje
1. 2007 NHLBI morbidity and mortality chartbook Bethesda, MD National Heart, Lung, and Blood Institute
2. BonowRO
2002 Primary prevention of cardiovascular disease: a call to action. Circulation 106 3140 3141
3. MathersCD
LoncarD
2006 Projections of global mortality and burden of disease from 2002 to 2030. PLoS Med 3 e442
4. MurrayCJ
LopezAD
1997 Global mortality, disability, and the contribution of risk factors: Global Burden of Disease Study. Lancet 349 1436 1442
5. AulchenkoYS
RipattiS
LindqvistI
BoomsmaD
HeidIM
2009 Loci influencing lipid levels and coronary heart disease risk in 16 European population cohorts. Nat Genet 41 47 55
6. KathiresanS
WillerCJ
PelosoGM
DemissieS
MusunuruK
2009 Common variants at 30 loci contribute to polygenic dyslipidemia. Nat Genet 41 56 65
7. Newton-ChehC
JohnsonT
GatevaV
TobinMD
BochudM
2009 Genome-wide association study identifies eight loci associated with blood pressure. Nat Genet 41 666 676
8. LevyD
EhretGB
RiceK
VerwoertGC
LaunerLJ
2009 Genome-wide association study of blood pressure and hypertension. Nat Genet 41 677 687
9. SabattiC
ServiceSK
HartikainenAL
PoutaA
RipattiS
2009 Genome-wide association analysis of metabolic traits in a birth cohort from a founder population. Nat Genet 41 35 46
10. WillerCJ
SannaS
JacksonAU
ScuteriA
BonnycastleLL
2008 Newly identified loci that influence lipid concentrations and risk of coronary artery disease. Nat Genet 40 161 169
11. KeatingBJ
TischfieldS
MurraySS
BhangaleT
PriceTS
2008 Concept, design and implementation of a cardiovascular gene-centric 50 k SNP array for large-scale genomic association studies. PLoS ONE 3 e3583
12. ScottLJ
MohlkeKL
BonnycastleLL
WillerCJ
LiY
2007 A genome-wide association study of type 2 diabetes in Finns detects multiple susceptibility variants. Science 316 1341 1345
13. Jose PinheiroDB
DebRoySaikat
SarkarDeepayan
the R Core team 2009 nlme: Linear and Nonlinear Mixed Effects Models. R package version 3.1-93
14. WalmsleyTA
PotterHC
GeorgePM
FlorkowskiCM
2008 Pseudo-hypertriglyceridaemia: a measurement artefact due to glycerol kinase deficiency. Postgrad Med J 84 552 554
15. SulimanSG
StanikJ
McCullochLJ
WilsonN
EdghillEL
2009 Severe insulin resistance and intrauterine growth deficiency associated with haploinsufficiency for INSR and CHN2: new insights into synergistic pathways involved in growth and metabolism. Diabetes 58 2954 2961
16. BrainSD
WilliamsTJ
TippinsJR
MorrisHR
MacIntyreI
1985 Calcitonin gene-related peptide is a potent vasodilator. Nature 313 54 56
17. SanoM
KuroiN
NakayamaT
SatoN
IzumiY
2005 Association study of calcitonin-receptor-like receptor gene in essential hypertension. Am J Hypertens 18 403 408
18. Bouatia-NajiN
BonnefondA
Cavalcanti-ProencaC
SparsoT
HolmkvistJ
2009 A variant near MTNR1B is associated with increased fasting plasma glucose levels and type 2 diabetes risk. Nat Genet 41 89 94
19. BennetAM
Di AngelantonioE
YeZ
WensleyF
DahlinA
2007 Association of apolipoprotein E genotypes with lipid levels and coronary risk. JAMA 298 1300 1311
20. KathiresanS
MelanderO
GuiducciC
SurtiA
BurttNP
2008 Six new loci associated with blood low-density lipoprotein cholesterol, high-density lipoprotein cholesterol or triglycerides in humans. Nat Genet 40 189 197
21. RaitakariOT
JuonalaM
RonnemaaT
Keltikangas-JarvinenL
RasanenL
2008 Cohort profile: the cardiovascular risk in Young Finns Study. Int J Epidemiol 37 1220 1226
22. EberleMA
NgPC
KuhnK
ZhouL
PeifferDA
2007 Power to detect risk alleles using genome-wide tag SNP panels. PLoS Genet 3 1827 1837
23. TeoYY
InouyeM
SmallKS
GwilliamR
DeloukasP
2007 A genotype calling algorithm for the Illumina BeadArray platform. Bioinformatics 23 2741 2746
24. PurcellS
NealeB
Todd-BrownK
ThomasL
FerreiraMA
2007 PLINK: a tool set for whole-genome association and population-based linkage analyses. Am J Hum Genet 81 559 575
25. HindorffL
JunkinsH
MehtaJ
ManolioTA
Catalog of Published Genome-Wide Association Studies. Available at: www.genome.gov/gwastudies. Accessed 5/20/09
26. FaulF
ErdfelderE
LangAG
BuchnerA
2007 G*Power 3: a flexible statistical power analysis program for the social, behavioral, and biomedical sciences. Behav Res Methods 39 175 191
27. FalconerDS
MacKayTFC
1996 Introduction to Quantitative Genetics: Benjamin Cummings
Štítky
Genetika Reprodukční medicína
Článek Allelic Variation at the 8q23.3 Colorectal Cancer Risk Locus Functions as a Cis-Acting Regulator ofČlánek Allelic Selection of Amplicons in Glioblastoma Revealed by Combining Somatic and Germline AnalysisČlánek Lactic Acidosis Triggers Starvation Response with Paradoxical Induction of TXNIP through MondoAČlánek Rice a Cinnamoyl-CoA Reductase-Like Gene Family Member, Is Required for NH1-Mediated Immunity to pv.Článek Differentiation of Zebrafish Melanophores Depends on Transcription Factors AP2 Alpha and AP2 Epsilon
Článek vyšel v časopisePLOS Genetics
Nejčtenější tento týden
2010 Číslo 9- Akutní intermitentní porfyrie
- Růst a vývoj dětí narozených pomocí IVF
- Vliv melatoninu a cirkadiálního rytmu na ženskou reprodukci
- Intrauterinní inseminace a její úspěšnost
- Délka menstruačního cyklu jako marker ženské plodnosti
-
Všechny články tohoto čísla
- Optimal Strategy for Competence Differentiation in Bacteria
- Mutational Patterns Cannot Explain Genome Composition: Are There Any Neutral Sites in the Genomes of Bacteria?
- Frail Hypotheses in Evolutionary Biology
- Genetic Architecture of Complex Traits and Accuracy of Genomic Prediction: Coat Colour, Milk-Fat Percentage, and Type in Holstein Cattle as Contrasting Model Traits
- Allelic Variation at the 8q23.3 Colorectal Cancer Risk Locus Functions as a Cis-Acting Regulator of
- Allelic Selection of Amplicons in Glioblastoma Revealed by Combining Somatic and Germline Analysis
- Germline Variation Controls the Architecture of Somatic Alterations in Tumors
- Mice Doubly-Deficient in Lysosomal Hexosaminidase A and Neuraminidase 4 Show Epileptic Crises and Rapid Neuronal Loss
- Analysis of Population Structure: A Unifying Framework and Novel Methods Based on Sparse Factor Analysis
- FliO Regulation of FliP in the Formation of the Flagellum
- Cdc20 Is Critical for Meiosis I and Fertility of Female Mice
- dMyc Functions Downstream of Yorkie to Promote the Supercompetitive Behavior of Hippo Pathway Mutant Cells
- DCAF26, an Adaptor Protein of Cul4-Based E3, Is Essential for DNA Methylation in
- Genome-Wide Double-Stranded RNA Sequencing Reveals the Functional Significance of Base-Paired RNAs in
- An Immune Response Network Associated with Blood Lipid Levels
- Genetic Variants and Their Interactions in the Prediction of Increased Pre-Clinical Carotid Atherosclerosis: The Cardiovascular Risk in Young Finns Study
- The Histone H3K36 Methyltransferase MES-4 Acts Epigenetically to Transmit the Memory of Germline Gene Expression to Progeny
- Long- and Short-Term Selective Forces on Malaria Parasite Genomes
- Lactic Acidosis Triggers Starvation Response with Paradoxical Induction of TXNIP through MondoA
- Identification of Early Requirements for Preplacodal Ectoderm and Sensory Organ Development
- Orphan CpG Islands Identify Numerous Conserved Promoters in the Mammalian Genome
- Analysis of the Basidiomycete Reveals Conservation of the Core Meiotic Expression Program over Half a Billion Years of Evolution
- ETS-4 Is a Transcriptional Regulator of Life Span in
- The SR Protein B52/SRp55 Is Required for DNA Topoisomerase I Recruitment to Chromatin, mRNA Release and Transcription Shutdown
- The Baker's Yeast Diploid Genome Is Remarkably Stable in Vegetative Growth and Meiosis
- Chromatin Landscape Dictates HSF Binding to Target DNA Elements
- The APETALA-2-Like Transcription Factor OsAP2-39 Controls Key Interactions between Abscisic Acid and Gibberellin in Rice
- Accurately Assessing the Risk of Schizophrenia Conferred by Rare Copy-Number Variation Affecting Genes with Brain Function
- Widespread Over-Expression of the X Chromosome in Sterile F Hybrid Mice
- The Characterization of Twenty Sequenced Human Genomes
- The Genome of a Pathogenic : Cooptive Virulence Underpinned by Key Gene Acquisitions
- A Single Element Maintains Repression of the Key Developmental Regulator
- Identification of New Genetic Risk Variants for Type 2 Diabetes
- Effect of Correlated tRNA Abundances on Translation Errors and Evolution of Codon Usage Bias
- Evidence of Selection upon Genomic GC-Content in Bacteria
- Proteomic Changes Resulting from Gene Copy Number Variations in Cancer Cells
- Rice a Cinnamoyl-CoA Reductase-Like Gene Family Member, Is Required for NH1-Mediated Immunity to pv.
- Longitudinal Genome-Wide Association of Cardiovascular Disease Risk Factors in the Bogalusa Heart Study
- Response to Mechanical Stress Is Mediated by the TRPA Channel Painless in the Heart
- DNMT3L Modulates Significant and Distinct Flanking Sequence Preference for DNA Methylation by DNMT3A and DNMT3B
- Identifying Signatures of Natural Selection in Tibetan and Andean Populations Using Dense Genome Scan Data
- Incremental Genetic Perturbations to MCM2-7 Expression and Subcellular Distribution Reveal Exquisite Sensitivity of Mice to DNA Replication Stress
- Loss of Maternal ATRX Results in Centromere Instability and Aneuploidy in the Mammalian Oocyte and Pre-Implantation Embryo
- Comparative Genomic Hybridization (CGH) Reveals a Neo-X Chromosome and Biased Gene Movement in Stalk-Eyed Flies (Genus )
- Differentiation of Zebrafish Melanophores Depends on Transcription Factors AP2 Alpha and AP2 Epsilon
- Gene–Environment Interactions at Nucleotide Resolution
- Dementia Revealed: Novel Chromosome 6 Locus for Late-Onset Alzheimer Disease Provides Genetic Evidence for Folate-Pathway Abnormalities
- Critical Functions of Rpa3/Ssb3 in S-Phase DNA Damage Responses in Fission Yeast
- Preferential Re-Replication of Heterochromatin in the Absence of Geminin
- The Potential for Enhancing the Power of Genetic Association Studies in African Americans through the Reuse of Existing Genotype Data
- Evidence That Mutation Is Universally Biased towards AT in Bacteria
- Perturbation Analysis of Heterochromatin-Mediated Gene Silencing and Somatic Inheritance
- Diversity of Eukaryotic DNA Replication Origins Revealed by Genome-Wide Analysis of Chromatin Structure
- Genetic Deletion of the Desmosomal Component Promotes Tumor Microinvasion in a Mouse Model of Pancreatic Neuroendocrine Carcinogenesis
- The Metabolic Enzyme ManA Reveals a Link between Cell Wall Integrity and Chromosome Morphology
- SNPs Associated with Cerebrospinal Fluid Phospho-Tau Levels Influence Rate of Decline in Alzheimer's Disease
- Synthesizing and Salvaging NAD: Lessons Learned from
- A Central Regulatory System Largely Controls Transcriptional Activation and Repression Responses to Phosphate Starvation in Arabidopsis
- An Insect Herbivore Microbiome with High Plant Biomass-Degrading Capacity
- PLOS Genetics
- Archiv čísel
- Aktuální číslo
- Informace o časopisu
Nejčtenější v tomto čísle- Synthesizing and Salvaging NAD: Lessons Learned from
- Optimal Strategy for Competence Differentiation in Bacteria
- Long- and Short-Term Selective Forces on Malaria Parasite Genomes
- Identifying Signatures of Natural Selection in Tibetan and Andean Populations Using Dense Genome Scan Data
Kurzy
Zvyšte si kvalifikaci online z pohodlí domova
Autoři: prof. MUDr. Vladimír Palička, CSc., Dr.h.c., doc. MUDr. Václav Vyskočil, Ph.D., MUDr. Petr Kasalický, CSc., MUDr. Jan Rosa, Ing. Pavel Havlík, Ing. Jan Adam, Hana Hejnová, DiS., Jana Křenková
Autoři: MUDr. Irena Krčmová, CSc.
Autoři: MDDr. Eleonóra Ivančová, PhD., MHA
Autoři: prof. MUDr. Eva Kubala Havrdová, DrSc.
Všechny kurzyPřihlášení#ADS_BOTTOM_SCRIPTS#Zapomenuté hesloZadejte e-mailovou adresu, se kterou jste vytvářel(a) účet, budou Vám na ni zaslány informace k nastavení nového hesla.
- Vzdělávání


