
Transition from Positive to Neutral in Mutation Fixation along with Continuing Rising Fitness in Thermal Adaptive Evolution
It remains to be determined experimentally whether increasing fitness is related to positive selection, while stationary fitness is related to neutral evolution. Long-term laboratory evolution in Escherichia coli was performed under conditions of thermal stress under defined laboratory conditions. The complete cell growth data showed common continuous fitness recovery to every 2°C or 4°C stepwise temperature upshift, finally resulting in an evolved E. coli strain with an improved upper temperature limit as high as 45.9°C after 523 days of serial transfer, equivalent to 7,560 generations, in minimal medium. Two-phase fitness dynamics, a rapid growth recovery phase followed by a gradual increasing growth phase, was clearly observed at diverse temperatures throughout the entire evolutionary process. Whole-genome sequence analysis revealed the transition from positive to neutral in mutation fixation, accompanied with a considerable escalation of spontaneous substitution rate in the late fitness recovery phase. It suggested that continually increasing fitness not always resulted in the reduction of genetic diversity due to the sequential takeovers by fit mutants, but caused the accumulation of a considerable number of mutations that facilitated the neutral evolution.
Published in the journal:
. PLoS Genet 6(10): e32767. doi:10.1371/journal.pgen.1001164
Category:
Research Article
doi:
https://doi.org/10.1371/journal.pgen.1001164
Summary
It remains to be determined experimentally whether increasing fitness is related to positive selection, while stationary fitness is related to neutral evolution. Long-term laboratory evolution in Escherichia coli was performed under conditions of thermal stress under defined laboratory conditions. The complete cell growth data showed common continuous fitness recovery to every 2°C or 4°C stepwise temperature upshift, finally resulting in an evolved E. coli strain with an improved upper temperature limit as high as 45.9°C after 523 days of serial transfer, equivalent to 7,560 generations, in minimal medium. Two-phase fitness dynamics, a rapid growth recovery phase followed by a gradual increasing growth phase, was clearly observed at diverse temperatures throughout the entire evolutionary process. Whole-genome sequence analysis revealed the transition from positive to neutral in mutation fixation, accompanied with a considerable escalation of spontaneous substitution rate in the late fitness recovery phase. It suggested that continually increasing fitness not always resulted in the reduction of genetic diversity due to the sequential takeovers by fit mutants, but caused the accumulation of a considerable number of mutations that facilitated the neutral evolution.
Introduction
Evolution experiments conducted in the laboratory allow direct temporal observation of the genetic and phenotypic alterations and the precise verification of evolutionary mechanisms [1]–[3]. As evolution usually triggers functional improvement in either biological activity or physiological fitness, positive selection may fix beneficial mutations within the population. On the other hand, most mutations in extant living organisms are often shown to be neutral to their fitness in studies of molecular phylogenetics [4] focusing on a specific target gene or protein. Combining Darwinian adaptive evolution and Kimura's neutral molecular evolution, it can be assumed that the observation of neutral mutations was because extant living organisms have been mostly in the fitness stationary phase, while the increasing fitness accompanied by beneficial mutations only occurred in a limited early period in the extensive timescale of evolution. This raised the question of whether the increasing fitness is related to positive selection, while the stationary fitness is related to neutral evolution. That is, whether there is any chance that a considerable number of non-beneficial mutations can be accumulated in an evolutionary period of continuously rising fitness.
To address this question, we designed an evolution experiment maintaining strong selection pressure to examine the temporal accumulation of mutations in molecular evolution. Living organisms generally survive within a limited range of temperature, and temperatures slightly higher than the upper limit of this range often lead to reduced growth fitness and may sometimes cause extinction. Evolution experiments with thermal selection are practical, as the environmental temperature can be precisely controlled in the laboratory.
As a classical model, the bacterium Escherichia coli has been investigated intensively with regard to its physiological responses to thermal stress. In contrast to thermal tolerance that temporarily rescues the cells from heat damage via activated production of heat shock proteins [5]–[7], thermal adaptation is the capacity to overcome thermal stress and maintain self-propagation at temperatures higher than the primary limitation, generally due to genetic and/or phenotypic changes taking place within cells over a relatively long period [8].
The mechanism of thermal adaptation has been poorly investigated because of a lack of suitable experimental models with newly acquired physiological properties. The successful development of thermal adaptive mutants grown at temperatures 0.8°C higher than the growth limitation of the ancestral clone [9] and the relevant evolutionary tradeoffs [10] highlighted the necessity of experimental approaches in the study of thermal adaptive evolution. Subsequent rigorous studies investigated the chromosomal changes [11], deletion and insertion of long fragments [12] and the relative heat-induced expression profiles [13], which may contribute to thermal adaptation. However, several essential issues remain unclear, including how high the upper temperature limit can be raised for E. coli propagation, how quickly the fitness (e.g., growth rate) is improved during the evolutionary process and how many mutations occur over the whole genome, particularly how mutations are fixed in a population accompanying improvements in fitness.
To address how cells accumulate beneficial and/or neutral mutations in adapting to relatively high temperatures, we carried out thermal adaptive evolution of E. coli in the test tube, starting from an initial temperature of 36.9°C up to a final temperature of 44.8°C in increments of 2°C or 4°C. At every stepwise temperature shift, a rapid recovery of growth rate in the primary phase of approximately 250 – 300 generations and a subsequent gradually increasing phase appeared with the fitness increasing significantly throughout the entire 2-year serial transfer experiment. A thermally adapted strain with a 4.7°C improvement in the growth limit was acquired after 523 days, equivalent to 7,560 generations. Whole-genome sequence analysis of several selected cell populations in thermal evolution showed that the Ka/Ks ratio (non-synonymous mutation frequency over synonymous mutation frequency) switched from a high value to nearly unity. Intriguingly, the contribution of fixed mutations to the fitness turned from beneficial to neutral, while the growth rate rose continually. This transition was accompanied by the emergence of a mutator phenotype in the highly selective environment. Accordingly, we assumed that the extant organisms, improving their phenotypes gradually and continually, may have accumulated neutral mutations to maintain genetic diversity for forthcoming environmental changes.
Results
Greatly improved upper temperature limit of cell growth from thermal adaptive evolution
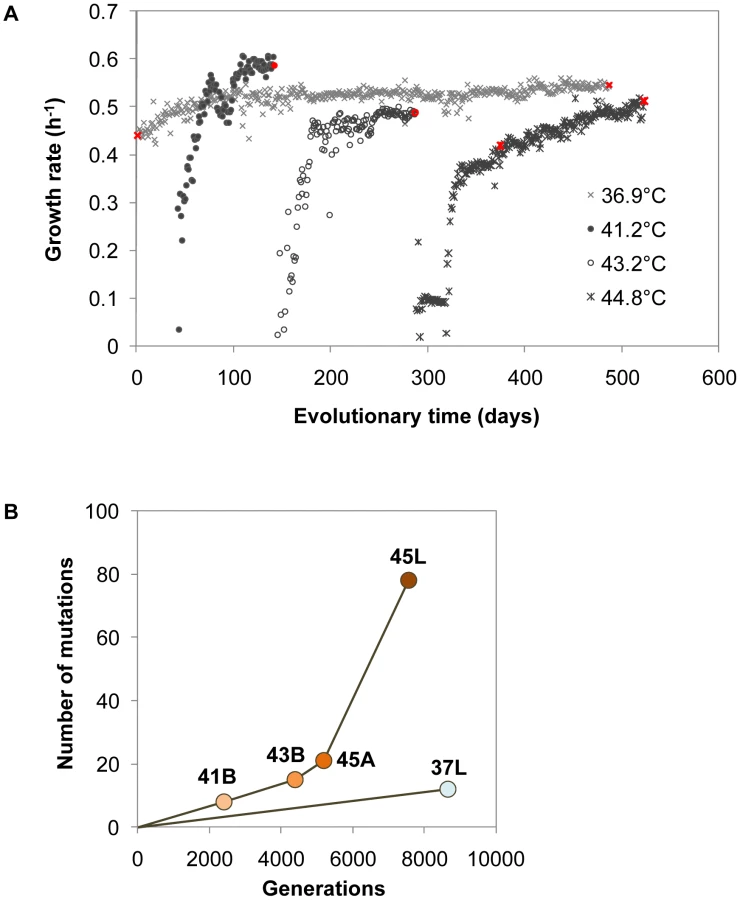
Thermal adaptive evolution with a laboratory E. coli strain was carried out in a stepwise manner in increments of approximately 2°C or 4°C from 36.9°C to 44.8°C. Daily transfer of the culture in fresh medium was performed and the transfer point was tried to be kept during the exponential phase (Figure 1A). As shown in Figure 1B, the ancestor E. coli strain (Anc) with primary growth at 36.9°C (laboratory conditions) was divided into two: one for long-term culture at a constant temperature of 36.9°C (lineage of 37L) and the other (lineage of 41B-43B-45A-45L) for the thermal adaptive process with gradually increasing temperature of 36.9°C, 41.2°C, 43.2°C and 44.8°C. After 523 days of culture transfer, E. coli cells (designated as 45L) capable of rapid and constant growth at 44.8°C in minimal medium were obtained, as the endpoint thermal adaptive strain.

To see how much the evolution changed the growth profile of the E. coli cells, thermal niche assay was performed. Both Anc and 37L showed the highest growth fitness at 36.9°C but the restricted growth once the temperature was raised to 41.2°C, and ceased growth at the higher temperatures (Figure 1C). The evolved population (45L) continued to proliferate (>0.1 h−1) even when the temperature was raised as high as 45.9°C. A greatly extended range of growth temperature, a 4.7°C improvement in the upper limit, was finally achieved. Note that such a shift in the thermal niche was independent of the length of serial transfer but was directly related to the environmental changes, i.e., the period of thermal stress (Figure S1). In addition, a slight trade-off due to the thermal adaptation was observed at the low temperatures of 15.0 and/or 20.1°C (Figure S2). We assumed that the thermal evolution experiment probably made the cells more sensitive to the drop in temperature.
Two-phase fitness increasing dynamics in thermal evolution
The complete growth record revealed two periods involved in the adaptation process, i.e., an initial rapid growth recovery phase followed by a gradual increasing growth phase (Figure 2A). Although the 2°C temperature shift resulted in a sudden growth rate drop (<0.1 h−1), the bacterial cells showed regular propagation (>0.3 h−1) within 40 days. Once the cells achieved a relatively high growth rate, a turning point appeared in the growth rate trajectory, where the subsequent period of gradual increase was initiated. This two-phase process was universally observed in all trajectories of diverse temperatures. In particular, the thermal evolution line showed continually and markedly increasing growth fitness, compared with the evolutionary route at a constant temperature of 36.9°C (lineage of 37L and refs. 2 and 14) [2], [14]. The trajectories observed here provided a detailed record of daily cell growth and clear insight into the dynamics of fitness recovery during thermal adaptation.
Accumulation of genome mutations with continually rising fitness
The cell populations indicated in Figure 1B (marked in red, Figure 2A) were applied for mutation analysis. Genome mutation determination was based on a customised resequencing array technique and verified by Sanger sequencing (Table S3). In total, 12, 8, 15, 21 and 78 mutations (excluding mutations in rRNAs and tRNAs) were identified in 37L, 41B, 43B, 45A and 45L, respectively (Figure 2B and Table 1). The mutations occurring in the earlier period were inherited in later periods, i.e., 43B included all 8 mutations that appeared in 41B, and 45L carried all mutations in 43B. The thermal evolution line accumulated mutations faster than the line under a constant temperature of 36.9°C, which may be attributed to the positive selection accompanied with the growth rate recovery during temperature adaptation. Intriguingly, the mutation fixation was markedly accelerated during the gradual recovery phase at 44.8°C (from 45A to 45L, Figure 2A), which indicated independence between mutation fixation rate and fitness recovery rate.

Both single-nucleotide substitutions (Table S1) and insertion/deletion mutations (Table S2) were found in all populations (Table 1). No large deletion neither prophage induction was observed, which was supposed to be thermal sensitive as reported in other bacteria [15]. Here we focused on the substitution analysis. Most mutations fixed during thermal evolution until 45A were nonsynonymous, which may result in changes in gene function. In contrast, from 45A to 45L, synonymous mutations were markedly accumulated, suggesting that the fixation rate of synonymous mutations increased even though they may have no significant contribution to the increase in fitness.
Mutator appearance in the gradual growth recovery phase
The synonymous substitution rate was of the order of approximately 10−10 per bp per generation until 45A, whereas it was markedly increased to approximately 5.3×10⁻⁹ bp per generation from 45A to 45L (Table 2). As synonymous mutations are generally assumed to be close to neutral, the rate is proportional to the spontaneous synonymous substitution rate when the fixation mechanisms, genetic drift and/or hitchhiking effect, meet the condition that Ne × u (Ne and u are the effective population size and the spontaneous synonymous substitution rate, respectively) is sufficiently smaller than 1. When the initial population (Ne, less than 106 cells in most daily transfers) and the general spontaneous mutation rate (u, 5.4×10⁻¹⁰ per nucleotide per generation [16]) are adopted, Ne × u is considerably smaller than 1. Thus, the observed acceleration of the synonymous substitution rate was most likely due to the increase in spontaneous substitution rate, which was subsequently verified by mutagenesis assay. It showed that the spontaneous substitution rate of 45L (∼1.0×10⁻⁸ per division) was approximately two orders higher than that of the ancestral clone (∼1.5×10⁻¹⁰ per division). The long-term thermal adaptive evolution resulted in a hypermutable phenotype.

Notably, mutations in the genes encoding enzymes with biological activities that may contribute to the accelerated spontaneous mutation rate were found in 45L (Table S1). For example, the single-nucleotide substitution producing a stop codon in mutH would cause protein translation to fail, resulting in loss of function of mismatch repair in DNA replication; the nonsynonymous substitution in dnaE replaced the nonpolar amino acid Ala with the polar amino acid Thr, which may cause structural changes in the protein leading to reduced fidelity of DNA polymerase III. The mutator was probably produced from these mutations related to replication fidelity or other related functions. This hypermutable property appeared not to affect the fitness improvement, but rather allowed the continually increasing growth rate (Figure 2 and Figure S3). The evolution experiment here showed not only the emergence of a mutator phenotype in the highly selective environment but also the important mutations potentially contributing to the high mutation rate.
Transition from positive to nearly neutral mutation fixation in molecular evolution
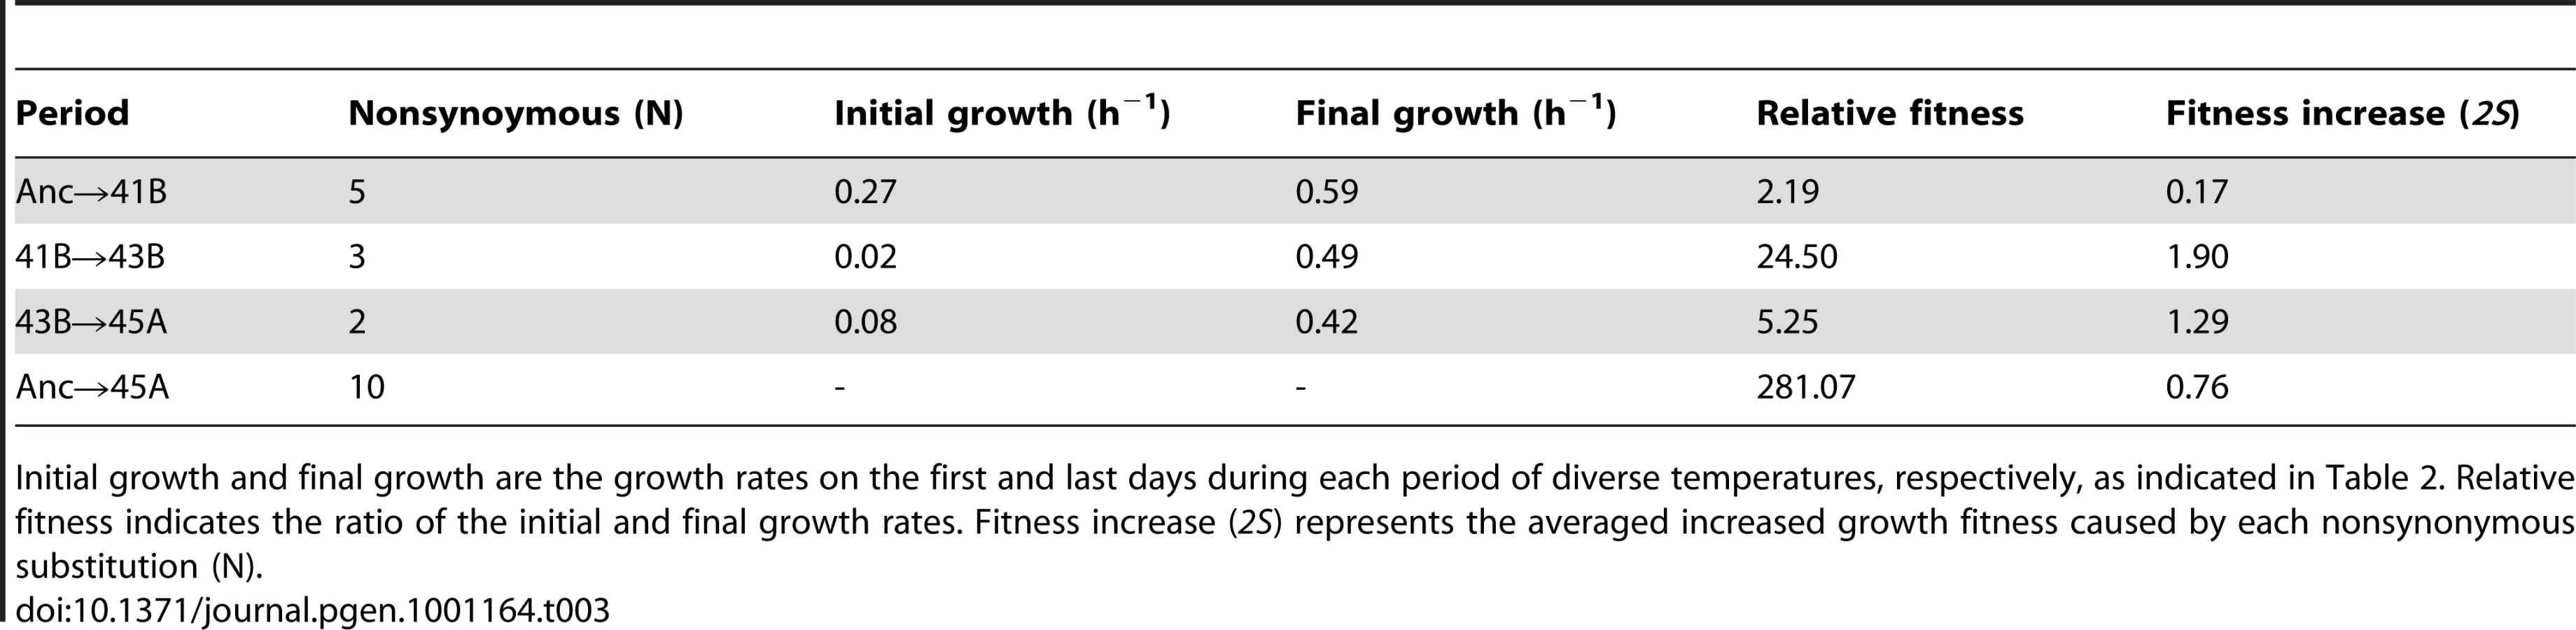
The contribution of fixed substitutions to fitness, which was positive in the periods from Anc to 45A, turned to neutral or slightly negative in the period from 45A to 45L in terms of Ka/Ks ratio (Table 2). The biases for these probabilities (Ks and Ka) were calculated from the numbers of synonymous or nonsynonymous substitutions that occurred between the neighbouring populations of the intervening generation [17]. The high ratio of Ka to Ks (>1.0) in the periods from Anc to 45A suggested a positive selection effect during the evolutionary process [18]. The average contribution of each nonsynonymous substitution to the fitness increase (2S) was of the order of 1∼0.1 (Table 3), much larger than the threshold value (1/Ne, which was 10−3∼10−6 under our experimental conditions). It suggested that some or all of the nonsynonymous substitutions from Anc to 45A must have been fixed through positive selection.
Despite the continually increasing growth rate in the period from 45A to 45L (Figure 2A and Figure S3), the Ka/Ks ratio was 0.8, suggesting that the majority of the fixed nonsynonymous substitutions were nearly neutral or slightly negative in their contribution to the fitness improvement. As the number of experimentally detected fixed nonsynonymous substitutions was 32, close to the theoretical value of 35 (calculated from the number of detected synonymous substitutions in Table 2), we assumed that the number of nonsynonymous substitutions responsible for the observed fitness improvement in the period from 45A to 45L was very small. These few positive substitutions were masked by the majority of nonsynonymous substitutions causing neutrality, leading to the nearly neutral value of the Ka/Ks ratio. Note that the Ka and Ks value acquired here agreed well with that analyzed using other methods considering the transversion and transition bias [19]. Taking into account the high fixation rate of synonymous mutations and the Ka/Ks ratio of 45A→45L, the average contribution of these fixed substitutions was approximately neutral even with the substantially increasing fitness.
Discussion
We have shown that the average contribution of substitutions made a transition from positive to nearly neutral in the evolutionary process accompanied with continually increasing fitness that was defined as the growth rate. Although the cellular fitness showed common recovery in all the adaptation processes to the different temperatures, molecular evolution proceeded in two different manners: 1) mutation fixation of positive contribution to fitness, accompanied with fixation of few synonymous mutations; and 2) mutation fixation of nearly neutral contribution to fitness. As the spontaneous mutation rate increased significantly, both synonymous and nonsynonymous mutations were greatly accumulated and fixed. This large amount of mutations probably masked the positive contributions of a small number of mutations to fitness, leading to neutrality in terms of Ka/Ks.
The growth recovery constituted two phases universally throughout thermal evolution, which have been reported in other laboratory evolutionary experiments [3]. Beneficial mutations may occur in the early period resulting in rapid recovery of cell propagation, whereas the long-term response, the so-called “nearly static” state [14], [20], occurred in the later period for gradual continuing improvement of growth fitness. However, the growth recovery rate in the later period in thermal evolution was much higher than that supposed to be in the “nearly static” state. For example, the rate of fitness increase estimated by linear regression analysis was ∼10−4 per generation from 45A to 45L (Figure S3), and was ∼10−5 per generation in the period under a constant temperature of 36.9°C (from day 80 to 478 of the lineage 37L), which was consistent with that (∼10−5 per generation) in the period from 5K to 20K generation of the evolution carried out by Lenski's group [3]. These observations indicated that the elevated temperature triggered ∼10-fold acceleration of growth recovery in the gradual increasing phase.
Acceleration of the substitution rate has been predicted theoretically and investigated by experiments on mutators [21]–[25], although there have been few detailed reports regarding the precise genomic mutations that occur. We compare the mutation analysis of our evolutionary experiment with that of Lenski's group. Both Lenski's evolved clone 10K and the evolved 37L in this study that had experienced almost the same number of generations, showed approximately equivalent synonymous substitution rates of ∼1.0×10⁻¹⁰ per bp per generation (Table S4), although the two evolution experiments were performed independently in different laboratories with different E. coli strains under different growth selection pressures. The results agreed well with the general spontaneous substitution rate of 5.4×10⁻¹⁰ per bp per generation [16]. The endpoint clones, 40K (40,000 generations in ref. 3) [3] and 45L (this study, 7,560 generations) both showed similar mutation rates (Table S4), indicating that the mutator phenotypes appeared regardless of both selection pressure and the evolutionary process.
The transition from positive to near neutral of mutation fixation was mostly due to the accelerated spontaneous mutation rate. The Ka/Ks ratio was larger than unity from Anc to 45A, similar to that in the previous report (Table S4). Intriguingly, it was nearly unity from 45A to 45L, but was significantly larger than unity (P<0.01) from 20K to 40K in Lenski's experiment (Table S4). The fitness increase rate from 20K to 40K was expected to be not larger than to that from 10K to 20K, which was accompanied by neutrality of the fixed substitutions dependent on the specific classification of mutations [3]. The fitness increase rate from 45A to 45L was 10-fold higher accompanying nearly neutrality of fixed mutations regardless of the mutation category. Although difficulties in distinguishing between selective and neutral evolutionary processes have been noted [26], the study represents the first experimental verification of the positive to neutral transition of fixed mutation accompanying a continuous increase in growth fitness in a single evolutionary route. This result may have resulted from the temperature elevation before the cessation of fitness improvement in the evolution experiment.
The accelerated fixation rate of nonsynonymous mutation implied substantial genetic diversity in the population. The genetic diversity (f) of neutral substitution rate (u) show a difference at a single site based on the assumption of neutrality [27], [28]. The average number of nonsynonymous substitutions between the two cells over the whole genome is expected to be determined by the genetic diversity (f) and the number of all nonsynonymous sites in the genome. As Ka/Ks is nearly neutral from 45A to 45L, the synonymous substitution rate (u), 5.3×10⁻⁹ per base per generation, can be taken as the rate of neutral nonsynonymous substitution. When the population (Ne) is 106 cells, the average number of nonsynonymous substitutions in the whole genome is approximately 3×10⁴. As this estimation of genetic diversity is based on the assumption that heterozygosity is in balance between spontaneous neutral nonsynonymous substitution and its loss by genetic drift in the population, the genetic diversity will decrease temporarily if specific mutants are amplified by positive selection or be overestimated if the population size is smaller than 106. The high genetic diversity in the whole genome may have brought a burden from the negative contribution of nonsynonymous mutations to the population. However, the nearly neutral Ka/Ks value indicated that the burden was not so high. The mutation in groEL (Table S1), which appeared in the period from 43B to 45A, may have prompted the buffering performance that released misfolding and/or mutagenic stress [29], [31], or have modulated the codon adaptation [32] under the high temperature, thus allowing a large number of nonsynonymous mutations occurring after 45A to be nearly neutral. Additionally, the mutation was only detected in GroEL but not in other molecular chaperones strongly suggested the central role of chaperonin played in evolution.
The thermal adaptive process described here and the results of genome-wide mutation analysis showed that while cells increased their fitness in response to severe selection pressure, a substantial number of non-beneficial substitutions could be fixed. Thus, the neutrality observed in phylogenetic analysis on genes or proteins does not always mean that the fitness was in a stationary phase. Instead, in the changing environment, cells may accumulate nonsynonymous mutations to adopt the neutral path [33], [34] connecting multiple routes for adaptation to upcoming environmental changes [35], with accelerated nonsynonymous mutations as a robust survival strategy for sustainability. Further studies are required to determine the order of occurrence of all mutations and for quantitative evaluation of transcriptional alterations to investigate the molecular mechanism of the thermal adaptation in real-time. Evolution experiments in which gene mutations occur in various periods are not only valuable for investigating the genetic basis of adaptation and the relation between physiology and genetics, but are also valuable for molecular biologists to consider possible novel functions of these mutated genes or proteins involved in the evolutionary changes.
Materials and Methods
Bacterial strains
The bacterial strain DH1ΔleuB::(gfpuv5-kmr) used for laboratory evolution was constructed from the wild-type E. coli strain DH1 (National BioResource Project, National Institute of Genetics, Shizuoka, Japan), by replacing the chromosomal leuB with a foreign DNA fragment, PtetA-gfpuv5-kmr, comprised of a reporter gene (gfp) and the kanamycin resistance gene (kmr). The DNA fragment was amplified by PCR towards the plasmid, pGAG-2 [36], using the following primers: leuB-kanIG-f (5′-GCTCAACACAACGAAAACAACAAGGAAACCGTGTGATTAGAAAAACTCATCGAGCA-3′) and leuB-IGkan-r (5′-CGTCGAACAATTTTTCGTATAACGTCTTAGCCATGAATTATCATTTGTAGAGCTCA-3′). Homologous recombination was performed as described previously [37], [38].
Cell culture
Bacterial cells were cultured in 5 mL of modified M63 medium (62 mM K2HPO4, 39 mM KH2PO4, 15 mM ammonium sulfate, 1.8 mM FeSO47H2O, 15 mM thiamine hydrochloride, 0.2 mM MgSO47H2O, and 22 mM glucose) [38] supplemented with 2 mM leucine (Wako) and 25 µg/mL of kanamycin sulphate (Sigma) with shaking at 130 rpm. Cell culture was carried out at 36.9°C, 41.2°C, 43.2°C and 44.8°C using water bath shakers (EYELA NTS-4000A, EYELA NTS-4000E; Tokyo Rikakikai) and Personal-11 (Taitec). The water bath temperatures were measured using a Platinum Resistance Thermometer 5615 (Fluke). Serial transfer culture was performed by daily transfer of the cell culture with dilution in fresh medium prewarmed at 37°C. To avoid the pause of cell growth in the stationary phase, the serial transfer was tried to be carried out in the exponential phase. The dilution rate was theoretically determined to keep cell growth within log phase, i.e., the cell concentration controlled as OD600 was 0.1–0.2 after 24 h in culture, according to the growth rate the day before. Such exponential growth occupied the majority of the evolutionary process. During the temperature upshift periods and the first 1–2 days of the culture restarted from the glycerol stock, the cell cultures were usually kept at the a relatively high concentration, e.g., . When the OD600 of the 24-h culture was below 0.1, another 24-h culture was performed instead of dilution or serial transfer. On the other hand, once the cell growth was paused, relatively higher OD600 value was adopted, for instance, during the periods at temperature rising point. This evolutionary culture process applied selection pressure on growth rate of E. coli cells. Note that during the laboratory evolution process, 5 cycles (10 days) of daily shuffling culture at 36.8°C and 43.2°C, and 2 cycles (4 days) at 36.8°C and 44.8°C were carried out due to the considerably slow growth after the temperature upshift from 41.2°C to 43.2°C and from 43.2°C to 44.8°C, respectively. Daily cell cultures were all stocked at –80°C. If the serial transfer culture was paused for any reason, it was restarted from the frozen stock. The growth rate was calculated according to the following formula: . Note that OD600_0h was calculated in accordance with the OD600_24h of the culture used for serial transfer and its dilution rate, i.e. . The dilution rate was determined by the growth rate the day before. Detail information on serial transfer and cell growth was summarized in Table S5.
Thermal niche analysis
Anc, 37S, 37L, 41B, 41S, 43B, 43S, 45S and 45L cells were inoculated from the glycerol stock, and cultured at the corresponding adaptive temperature (36.8°C, 41.2°C, 43.2°C and 44.8°C, respectively). Following preculture at the described adaptive temperature for 24 h, all cell cultures were transferred to fresh medium and incubated at 15.0°C, 20.1°C, 30.1°C, 36.9°C, 41.2°C, 43.2°C, 44.8°C, 45.9°C or 46.8°C for 24 h. The thermal niche experiment was performed twice, and the growth rate at each culture temperature was calculated as the average value of a total of 5 or 6 replicates. Culture conditions, water bath shakers, thermometers and culture transfer (dilution) were applied as described in the “Cell culture” section.
Mutagenesis assay
Mutation rate was determined according to previous reports [3], [39] with the following modifications. Cells were kept in the exponential growth phase under the same culture conditions as described in the “Cell culture” section. Cell concentration was counted by flow cytometry (FC500; Beckman) and verified by colony forming units (cfu assay). Approximately 1,000 cells (∼200 cells per mL) were inoculated into 5 mL of fresh mM63 medium supplemented with 2 mM leucine. Thirty cultures were used for each test. Cell culture was performed at the corresponding temperatures (36.9°C or 44.8°C) with shaking at 130 rpm for 20–28 h, and stopped once the cell concentration reached ∼1.0×10⁷ (for 45L) or ∼2.0 – 3.0×10⁸ (for Anc) cells per mL. The total cells in each tube were collected by centrifugation at 5,000 × g for 5 min and plated on agar mM63 plates with 2 mM leucine and 20 µg/mL of streptomycin. As the appropriate initial cell density on the agar plates (or inoculation in liquid medium) may vary with antibiotic concentration, we repeated the experiments with varied cell numbers for plating (108 or 109 cells per plate for Anc and 107 or 108 cells per plate for 45L). The plates were incubated at 37°C for 2 days. The numbers of plates without resistant colonies were counted, and the resultant probability was applied to estimate the spontaneous mutation rate.
Genomic DNA preparation and microarray
The glycerol stocked cells were inoculated into mM63 medium supplied with 2 mM leucine, and grown until OD600 was approximately 0.5 with shaking at 130 rpm. The cell cultures were subsequently diluted to with fresh medium, and grown to stationary phase. Rifampicin (final concentration 300 µg/mL) was subsequently added and culture was continued for a further 3 h, to block initiation of DNA replication [40]. The cells were collected by centrifugation at 25°C at 16,000× g for 5 min, and the pelleted cells were stored at –80°C prior to use. Genomic DNAs were isolated and purified using a DNeasy Blood Tissue kit (Qiagen) for 37L and 45L, Aqua Pure Genomic DNA Isolation kit (Bio-Rad) for Anc, and Wizard Genomic DNA Purification kit (Promega) for 41B and 43B, in accordance with the respective manufacturer's instructions. Mutation detection by high-density oligonucleotide microarray analysis was performed using an Affymetrix GeneChip system. For preparation of genomic DNA, the assay procedures for use with the GeneChip E. coli Antisense Genome Array were carried out essentially according to the Affymetrix GeneChip Expression Analysis Technical Manual with slight modifications. To improve the efficiency of labelling, the incubation time was increased to 2 h.
Design of genome-wide array-based resequencing
A fine-tuned resequencing array, covering the whole genome of E. coli W3110 strain (GenoBase, Japan, http://ecoli.naist.jp/GB6/search.jsp), was newly developed according to the Affymetrix CustomExpress Arrays [41]–[43]. Both strands of the genome were alternately tiled at single-base resolution using 21-mer perfectly matching (PM) probes. Furthermore, for each PM probe, we prepared three mismatching (MM) probes the centre bases of which (11th base of the 21-mer oligo) were replaced by one of the possible three substitutions. Finally, a library consisting of a total of 18.6 million probes was arranged on three GeneChips for microarray analysis, covering four types of probe (1 PM and 3 MM) throughout the 4.6-Mb E. coli genome. The accuracy of the developed high-density oligonucleotide array is close to other next generation resequencing technologies (Ono et al., manuscript in preparation).
Mutation detection
Mutations were identified by detecting differences in probe intensity between the ancestral (Anc) and thermal adaptive strains (41B, 43B and 45L). Single-nucleotide substitutions were identified by both loss of signal (reduced intensity of probes covering the substituted base) and gain of signal (increased intensity of any MM probes the centre bases of which matched the substitution). When the intensity of a number of neighbouring probes showed a significant decrease without any gain signals from MM probes, the region covered by these probes was considered a deletion. The deleted regions (Table S2) were excluded from the mutation rate calculation. In addition, as microarray-based resequencing is unreliable for the detection of either transposition or repeated sequences (multiple copies), we neglected the signals in the regions of rRNA, tRNA and insertions.
The precise single substitutions were determined by maximum likelihood estimation. Probe intensity was given as I(i, b), where i and b represent the position on the genome and the nucleotide type of the central base in the probe, respectively. The average of the squared error between two strains was calculated by the following equation (1):(1)
where IMut and IAnc denote the intensity of mutant and ancestor, respectively, and M is the number of probes in the averaged window. Followed by filtering the candidate regions {Λl} of mutation where R(Λl) >τ, we evaluated the logarithmic likelihood ratio L(i) of all possible positions and the types of substitution within the range of each candidate region Λl. L(i) was defined by the average of the squared error between the expected and observed intensity ratios. The expected intensity was computed as a function of the hybridisation free energy estimated according to the nearest neighbour model [41], [44] modified by introducing the mismatch effect to predict the intensity of mismatched probes. The position and base type of the substitution were identified (P<10−4) and re-evaluated using the likelihood ratio test.
Supporting Information
Zdroje
1. FongSS
JoyceAR
PalssonBO
2005 Parallel adaptive evolution cultures of Escherichia coli lead to convergent growth phenotypes with different gene expression states. Genome Res 15 1365 1372
2. HerringCD
RaghunathanA
HonischC
PatelT
ApplebeeMK
2006 Comparative genome sequencing of Escherichia coli allows observation of bacterial evolution on a laboratory timescale. Nat Genet 38 1406 1412
3. BarrickJE
YuDS
YoonSH
JeongH
OhTK
2009 Genome evolution and adaptation in a long-term experiment with Escherichia coli. Nature 461 1243 1247
4. KimuraM
1983 The neutral theory of molecular evolution. Cambridge Oxford Univeristy Press
5. YuraT
NagaiH
MoriH
1993 Regulation of the heat-shock response in bacteria. Annu Rev Microbiol 47 321 350
6. BukauB
WeissmanJ
HorwichA
2006 Molecular chaperones and protein quality control. Cell 125 443 451
7. HartlFU
Hayer-HartlM
2002 Molecular chaperones in the cytosol: from nascent chain to folded protein. Science 295 1852 1858
8. BradfordMA
DaviesCA
FreySD
MaddoxTR
MelilloJM
2008 Thermal adaptation of soil microbial respiration to elevated temperature. Ecol Lett 11 1316 1327
9. MongoldJA
BennettAF
LenskiRE
1999 Evolutionary adaptation to temperature. VII. Extension of the upper thermal limit of Escherichia coli. Evolution 53 386 394
10. BennettAF
LenskiRE
2007 An experimental test of evolutionary trade-offs during temperature adaptation. Proc Natl Acad Sci U S A 104 Suppl 1 8649 8654
11. BergthorssonU
OchmanH
1999 Chromosomal changes during experimental evolution in laboratory populations of Escherichia coli. J Bacteriol 181 1360 1363
12. RiehleMM
BennettAF
LongAD
2001 Genetic architecture of thermal adaptation in Escherichia coli. Proc Natl Acad Sci U S A 98 525 530
13. RiehleMM
BennettAF
LenskiRE
LongAD
2003 Evolutionary changes in heat-inducible gene expression in lines of Escherichia coli adapted to high temperature. Physiol Genomics 14 47 58
14. LenskiRE
TravisanoM
1994 Dynamics of adaptation and diversification: a 10,000-generation experiment with bacterial populations. Proc Natl Acad Sci U S A 91 6808 6814
15. AzumaY
HosoyamaA
MatsutaniM
FuruyaN
HorikawaH
2009 Whole-genome analyses reveal genetic instability of Acetobacter pasteurianus. Nucleic Acids Res 37 5768 5783
16. DrakeJW
CharlesworthB
CharlesworthD
CrowJF
1998 Rates of spontaneous mutation. Genetics 148 1667 1686
17. NeiM
GojoboriT
1986 Simple methods for estimating the numbers of synonymous and nonsynonymous nucleotide substitutions. Mol Biol Evol 3 418 426
18. NeiM
2005 Selectionism and neutralism in molecular evolution. Mol Biol Evol 22 2318 2342
19. ComeronJM
1995 A method for estimating the numbers of synonymous and nonsynonymous substitutions per site. J Mol Evol 41 1152 1159
20. BennettAF
LenskiRE
MittlterJE
1992 Evolutionary adaptation to temperature. I. Fitness responses of Escherichia coli to changes in its thermal environment. Evolution 46 16 30
21. SniegowskiPD
GerrishPJ
LenskiRE
1997 Evolution of high mutation rates in experimental populations of E. coli. Nature 387 703 705
22. TaddeiF
RadmanM
Maynard-SmithJ
ToupanceB
GouyonPH
1997 Role of mutator alleles in adaptive evolution. Nature 387 700 702
23. OchmanH
ElwynS
MoranNA
1999 Calibrating bacterial evolution. Proc Natl Acad Sci U S A 96 12638 12643
24. LenskiRE
WinkworthCL
RileyMA
2003 Rates of DNA sequence evolution in experimental populations of Escherichia coli during 20,000 generations. J Mol Evol 56 498 508
25. DenamurE
MaticI
2006 Evolution of mutation rates in bacteria. Mol Microbiol 60 820 827
26. DuretL
2002 Evolution of synonymous codon usage in metazoans. Curr Opin Genet Dev 12 640 649
27. MaruyamaT
KimuraM
1980 Genetic variability and effective population size when local extinction and recolonization of subpopulations are frequent. Proc Natl Acad Sci U S A 77 6710 6714
28. BergOG
1996 Selection intensity for codon bias and the effective population size of Escherichia coli. Genetics 142 1379 1382
29. DePristoMA
WeinreichDM
HartlDL
2005 Missense meanderings in sequence space: a biophysical view of protein evolution. Nat Rev Genet 6 678 687
30. Maisnier-PatinS
RothJR
FredrikssonA
NystromT
BergOG
2005 Genomic buffering mitigates the effects of deleterious mutations in bacteria. Nat Genet 37 1376 1379
31. TokurikiN
TawfikDS
2009 Chaperonin overexpression promotes genetic variation and enzyme evolution. Nature 459 668 673
32. WarneckeT
HurstLD
2010 GroEL dependency affects codon usage—support for a critical role of misfolding in gene evolution. Mol Syst Biol 6 340
33. FontanaW
SchusterP
1998 Continuity in evolution: on the nature of transitions. Science 280 1451 1455
34. SchultesEA
BartelDP
2000 One sequence, two ribozymes: implications for the emergence of new ribozyme folds. Science 289 448 452
35. DePristoMA
HartlDL
WeinreichDM
2007 Mutational reversions during adaptive protein evolution. Mol Biol Evol 24 1608 1610
36. SuzukiT
KashiwagiA
UrabeI
YomoT
2006 Inherent characteristics of gene expression for buffering environmental changes without the corresponding transcriptional regulations. Biophysics 2 63 77
37. DatsenkoKA
WannerBL
2000 One-step inactivation of chromosomal genes in Escherichia coli K-12 using PCR products. Proc Natl Acad Sci U S A 97 6640 6645
38. KashiwagiA
SakuraiT
TsuruS
YingBW
MoriK
2009 Construction of Escherichia coli gene expression level perturbation collection. Metab Eng 11 56 63
39. BjedovI
TenaillonO
GerardB
SouzaV
DenamurE
2003 Stress-induced mutagenesis in bacteria. Science 300 1404 1409
40. SkarstadK
BoyeE
SteenHB
1986 Timing of initiation of chromosome replication in individual Escherichia coli cells. EMBO J 5 1711 1717
41. OnoN
SuzukiS
FurusawaC
AgataT
KashiwagiA
2008 An improved physico-chemical model of hybridization on high-density oligonucleotide microarrays. Bioinformatics 24 1278 1285
42. SuzukiS
OnoN
FurusawaC
KashiwagiA
YomoT
2007 Experimental optimization of probe length to increase the sequence specificity of high-density oligonucleotide microarrays. BMC Genomics 8 373
43. FurusawaC
OnoN
SuzukiS
AgataT
ShimizuH
2009 Model-based analysis of non-specific binding for background correction of high-density oligonucleotide microarrays. Bioinformatics 25 36 41
44. ZhangL
MilesMF
AldapeKD
2003 A model of molecular interactions on short oligonucleotide microarrays. Nat Biotechnol 21 818 821
Štítky
Genetika Reprodukční medicínaČlánek vyšel v časopise
PLOS Genetics
2010 Číslo 10
- Kazuistika – Perspektivy využití precizované medicíny v rámci personalizované specifické terapie onkologických pacientů
- Nobelova cena za chemii pro genetické nůžky: Objev, který změní naši budoucnost?
- Technologie na bázi RNA v klinické praxi: od přebarvených petúnií k terapii vzácných a dosud jen obtížně léčitelných chorob u lidí
- „Nepředstavovali jsme si, že náš výzkum povede přímo ke vzniku nových léků, dokonce ještě za našeho života“
- Bezplatné služby pro diagnostiku ATTRv amyloidózy pro kardiology
Nejčtenější v tomto čísle
- Genome-Wide Identification of Targets and Function of Individual MicroRNAs in Mouse Embryonic Stem Cells
- Common Genetic Variants and Modification of Penetrance of -Associated Breast Cancer
- Allele-Specific Down-Regulation of Expression Induced by Retinoids Contributes to Climate Adaptations
- β-Actin and γ-Actin Are Each Dispensable for Auditory Hair Cell Development But Required for Stereocilia Maintenance
Zvyšte si kvalifikaci online z pohodlí domova
Mazová zátka a její řešení
nový kurzVšechny kurzy