-
Články
Top novinky
Reklama- Vzdělávání
- Časopisy
Top články
Nové číslo
- Témata
Top novinky
Reklama- Kongresy
- Videa
- Podcasty
Nové podcasty
Reklama- Kariéra
Doporučené pozice
Reklama- Praxe
Top novinky
ReklamaCost-effectiveness of multidisciplinary care in mild to moderate chronic kidney disease in the United States: A modeling study
Using a modeling approach, Eugene Lin and colleageus examine the cost-effectiveness of multi-disciplinary care in mild to moderate chronic kidney disease in the US.
Published in the journal: . PLoS Med 15(3): e32767. doi:10.1371/journal.pmed.1002532
Category: Research Article
doi: https://doi.org/10.1371/journal.pmed.1002532Summary
Using a modeling approach, Eugene Lin and colleageus examine the cost-effectiveness of multi-disciplinary care in mild to moderate chronic kidney disease in the US.
Introduction
Chronic kidney disease (CKD) affects approximately 10% of Medicare beneficiaries in the US but accounts for a disproportionate 20% of expenditures [1]. Patients with end-stage renal disease (ESRD) are more costly, representing 1.6% of Medicare beneficiaries and responsible for 7.2% of costs [1]. At the same time, life expectancy is substantially lower in patients with CKD than in the general population [1–3].
Multidisciplinary care (MDC) has been proposed as a way to mitigate the high costs and mortality associated with CKD. It has led to successful outcomes in other settings, including heart failure [4], intensive care [5], and cancer [6]. In CKD, researchers have investigated a variety of strategies, including nurse and advanced practitioner coordinated models [7–12], use of dieticians and social workers [7–9,12,13], and education programs [14–19]. Several systematic reviews have shown that MDC slows CKD progression [20], delays the onset of dialysis, and decreases mortality [21].
Little is known about the cost-effectiveness of MDC in a US CKD population. Although prior studies have suggested that MDC is cost-effective, these studies were performed in other countries and did not use validated models for CKD progression [22,23]. Developing an accurate model is challenging because CKD progression is associated with mortality, and previous studies did not account for this relationship. Furthermore, these studies did not consider heterogeneity in CKD. Many patients with mild to moderate CKD do not progress to ESRD and may not benefit from an intensive disease management program [24]. Determining the subgroups that benefit the most from MDC may help providers more effectively treat vulnerable patients with CKD.
In this study, we performed a cost-effectiveness analysis of a theoretical Medicare MDC program for US populations of differing CKD severity. We did so after developing a novel CKD progression model that incorporates disease heterogeneity and mortality risk. To account for inefficiencies in a nationally funded and broadly applied MDC program, we also tested if more expensive and less effective programs remained cost-effective. We hypothesized that MDC is more cost-effective in patients with more severe CKD. We also hypothesized that even an inefficiently deployed program would be cost-effective by conventional thresholds.
Methods
Overview and non-technical modeling summary
To model the cost-effectiveness of MDC in CKD, our analysis involved 3 elements: (1) we constructed and calibrated a CKD progression model; (2) we modeled the cost-effectiveness of MDC; and (3) we performed multiple sensitivity analyses. Because the effectiveness of MDC varies for different types of patients, we performed these analyses in US patients of different ages (45–64, 65–74, and 75–84 years old), sexes (female and male), races (white, black, and other), estimated glomerular filtration rates (eGFRs ranging from 20 to 59 ml/min/1.73 m2 in 5-ml/min/1.73 m2 increments), and approximate albuminuria levels (urine albumin to creatinine ratio [UACR] 1, 300, 1,000, and 3,000 mg/g).
For our CKD progression model, we used a deterministic Markov model that simulates the disease course of patients with CKD as they experience progressive CKD, ESRD, and death. The model accounts for population-level heterogeneity, including differences in age, sex, and race as well as eGFR and albuminuria. For instance, patients with lower eGFRs and patients with higher levels of albuminuria are more likely to develop ESRD in our model. Similarly, older patients have higher mortality rates in our model. To ensure that our model accurately simulated CKD progression and mortality, we calibrated it to long-term mortality rates and ESRD incidence rates, which we obtained from published literature. We show results from our calibration procedure in S2 Appendix to demonstrate that our progression model accurately reflects published literature for different subpopulations with CKD.
To estimate the cost-effectiveness of a theoretical Medicare-funded MDC program in the US, we used our CKD progression model to simulate the total lifetime costs and outcomes (as measured by quality-adjusted life years [QALYs]) of medical care for patients under MDC versus under usual care. After discounting total accrued costs and QALYs by an annual rate of 3%, we computed the incremental cost-effectiveness ratio (ICER), the difference in discounted costs divided by the difference in discounted QALYs. Conceptually, the ICER is the number of dollars that Medicare must spend on MDC to gain 1 QALY. We assumed that a cost-effective program would have an ICER of no more than $150,000 per QALY, which corresponds roughly to the 2017 inflation-adjusted ICER for dialysis ($129,000 per QALY in 2009) [25].
In the literature, MDC spans different interventions and has been used in patients of varying disease severities. The aims of MDC programs have ranged from slowing the progression of CKD to ESRD, to preventing cardiovascular events such as myocardial infarction and stroke, to optimizing decision-making at the onset of ESRD. We limited our study to MDC programs that aimed to slow the progression of CKD to ESRD. We did not incorporate the reduction of cardiovascular hospitalizations or prevention of acute kidney injury into our model because it is not clear from the literature whether MDC is effective in preventing these outcomes. It is important to note that our study assessed reductions in all-cause mortality and thus implicitly assessed reductions in cardiovascular mortality. However, given the absence of data on the effect of MDC on intermediate cardiovascular endpoints, we were unable to incorporate cardiovascular or other hospitalizations into our cost-effectiveness estimates directly.
Additionally, the literature often conflates MDC programs aimed at slowing the progression of CKD with MDC programs aimed at optimizing dialysis planning through reducing the use of tunneled dialysis catheters and improving the use of home dialysis. However, these programs are operationally distinct and are meant for different populations: the former are typically used in patients with stage 3 and 4 CKD, while the latter are reserved for patients on the cusp of needing dialysis, with late stage 4 or early stage 5 CKD. Our interest was in earlier interventions focused on slowing the progression of CKD to ESRD in patients with stage 3 and 4 CKD.
These MDC programs typically comprise periodic visits with nephrologists, advanced practitioners, educators, dieticians, and social workers, which ramp up in frequency as CKD becomes more severe. We assumed that MDC increased the use of medications and laboratory tests routinely used to manage anemia and derangements in bone-mineral metabolism, common in patients with CKD.
Using a recently published systematic review, we constructed a model that estimated the effectiveness of MDC in reducing mortality and in preventing ESRD [21]. This review, and the published literature in general, provided an estimate of the average effectiveness of MDC across many severities of CKD, without accounting for population-level heterogeneity. To incorporate the clinical intuition that many patients with earlier stages of CKD do not progress to ESRD and thus may not benefit from an MDC program, we assumed that MDC was less effective in patients with less severe CKD.
Because a Medicare-funded MDC program would likely have a large range of effectiveness and cost, we performed a wide array of sensitivity analyses varying our assumptions. We did so by repeating our analyses under different scenarios, where MDC was down to only 25% as effective as the base case or up to 5 times more expensive. We also simulated scenarios where MDC did not have any effect on CKD progression. For each scenario, we performed a probabilistic sensitivity analysis, which allowed us to produce cost-effectiveness acceptability curves and 95% confidence intervals.
Below, we describe the technical specifications of our modeling technique.
Analysis 1: CKD progression model, construction, and calibration
Target population and setting
We limited our study to US patients because we investigated a Medicare-based intervention. Since managing advanced CKD and ESRD is substantially different from managing mild to moderate CKD, we limited our analysis to CKD stages 3 and 4.
To better understand MDC’s effects on CKD subpopulations, we divided our population by age (45–64, 65–74, and 75–84 year olds), sex (female and male), race (black, white, and other), eGFR (5-ml/min/1.73 m2 increments from 20 to 59 ml/min/1.73 m2), and approximate albuminuria level (UACR roughly 1, 300, 1,000, and 3,000 mg/g). We studied middle-aged and elderly patients because they represent nearly all Medicare beneficiaries with CKD. Even though patients 85 years and older are an important subset of Medicare beneficiaries, we excluded them because data on CKD progression and associated mortality are sparse in this subpopulation, making projections less reliable. We chose to study 75–84 year olds separate from 65–74 year olds because they have different outcomes and because many in the former group do not progress to ESRD prior to death [26,27]. We combined 45–54 year olds with 55–64 year olds because they do not constitute a large proportion of Medicare beneficiaries with CKD.
Study perspective and time horizon
We took Medicare’s perspective as our reference case because it ultimately absorbs the majority of ESRD costs in the US [1]. By limiting our study population to Medicare beneficiaries with CKD, this perspective is equivalent to taking the healthcare sector perspective, since Medicare beneficiaries remain on Medicare after developing ESRD. In accordance with the recommendations from the Second Panel on Cost-Effectiveness in Health and Medicine, our analysis incorporated all aspects of healthcare sector effects and costs, including longevity effects, health-related quality of life effects, future related and unrelated healthcare costs, and out-of-pocket costs [28,29].
We considered using the societal perspective as a second reference case. However, the societal perspective requires cost estimates that are not readily available in the literature. For instance, the added cost due to caregiver burden from MDC is not known and would require additional assumptions. Likewise, it is unclear whether MDC would improve patient productivity through improved health or reduce patient productivity through increased time spent interacting with healthcare providers. Even though we ultimately decided not to include the societal perspective, we varied the costliness of MDC widely in sensitivity analysis, and this variation likely captures additional costs that would be incorporated into a societal perspective.
Since CKD progression can take years, we modeled patients over their remaining lifetime.
CKD progression model
We developed a deterministic Markov model of CKD progression for each subpopulation (see S1 Appendix for modeling and calibration details). For each model, we allowed age and eGFR to vary over time, while sex and race remained constant. We accounted for albuminuria at baseline but did not incorporate longitudinal changes because we did not have sufficient data to model changes over time. Specifically, we created individual models for each combination of sex, race, and starting level of albuminuria. Within each of these models, we allowed probabilities to change depending on age and eGFR. This allowed us to incorporate population-level heterogeneity in our analysis and to separate patients with a high probability of developing ESRD (e.g., those with high levels of albuminuria and low eGFRs) from patients with a low probability of developing ESRD (e.g., those with no albuminuria and relatively high eGFRs).
Our model simulated CKD progression by modeling changes to eGFR through monthly cycles (Fig 1). Although CKD progression is a continuous process, we made 3 simplifications to improve the identification of model parameters and to reduce the risk of overfitting. First, we used eGFR decrements of 5 ml/min/1.73 m2. We did so because CKD progression is slow in most patients (a recent study reported a decline in eGFR of 4.8 ml/min/1.73 m2 per year in the upper tertile of patients) [30] and because health-related outcomes likely do not change materially at smaller eGFR decrements. Second, we did not allow patients to skip stages in a cycle given how slowly patients progress. Third, our model does not accommodate improvements in eGFR, even though kidney function can improve in a minority of patients [31]. We did this because Markov models simulate the expected outcome for the average patient, and CKD is progressive on average. Notably, our model was still able to capture population-level heterogeneity despite these assumptions because we modeled each subgroup separately. For instance, the majority of patients with low levels of albuminuria do not develop ESRD in their lifetime [32,33]. Because we modeled patients with different levels of albuminuria separately, populations at low risk for developing ESRD (e.g., those with no albuminuria) have a low ESRD incidence rate when compared to populations at high risk for developing ESRD (e.g., those with UACR of approximately 3,000 mg/g).
Fig. 1. Markov model for simulating chronic kidney disease (CKD) progression. 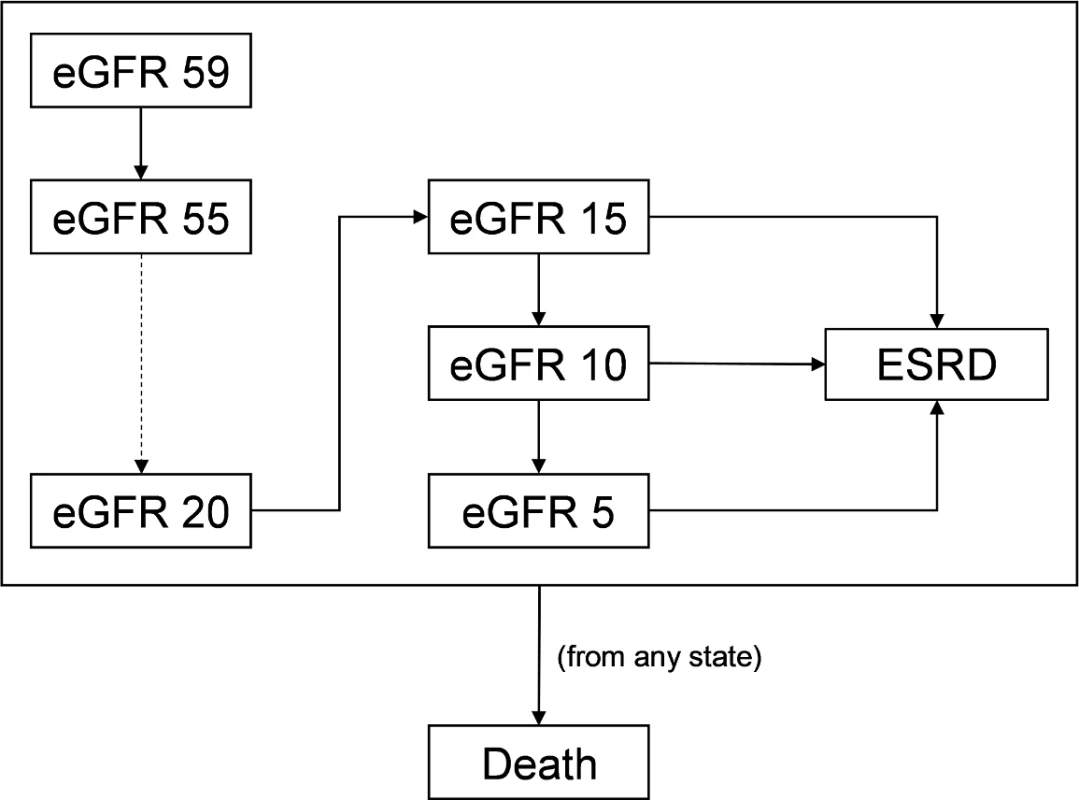
We modeled progression of CKD using levels of estimated glomerular filtration rate (eGFR). For simplicity, we modeled each level of eGFR in increments of 5 ml/min/1.73 m2. Each cycle, patients have a probability of staying at the same eGFR level or dropping to the next eGFR. Between eGFRs of 5 and 15 ml/min/1.73 m2, patients also have the possibility of progressing to end-stage renal disease (ESRD). We modeled ESRD as a single health state. Death can occur at any point. Once patients reach an eGFR of 15 ml/min/1.73 m2, they face the possibility of developing ESRD. Since many patients do not require renal replacement therapy at this eGFR, our model also allows progression to a minimum of 5 ml/min/1.73 m2 prior to developing ESRD [34]. ESRD represents many health states that have substantially different costs and outcomes, such as hemodialysis with a tunneled dialysis catheter, hemodialysis with a permanent vascular access, peritoneal dialysis, and kidney transplant. In our study, we modeled ESRD as a single health state. We did so because we limited our study to MDC programs aimed only at slowing CKD progression. Although MDC has been used to impact ESRD-related decisions, including the use of tunneled dialysis catheters, peritoneal dialysis, and transplant, we did not include these types of MDC in our analysis, and thus we did not incorporate this degree of granularity into our model.
At every health state, patients have a probability of death. To more accurately reflect expected lifetime health outcomes and costs, our model employed a standard half-cycle correction.
Calibration strategy
Directly computing transition probabilities is challenging because CKD progression and mortality are associated. Prior models have not considered this, likely inflating the risk of death for patients with more severe CKD [22,23].
To address this concern, we calibrated each model to long-term probabilities of mortality and progression to ESRD (Table 1). We calculated the 2-year and 5-year risk of developing ESRD as a function of age, sex, eGFR, and albuminuria, using a model developed by Tangri et al. [32]. For long-term probabilities of death, we obtained baseline mortality risks (conditional on age, sex, and race) from the Centers for Disease Control and Prevention (CDC) life tables [35] and applied hazard ratios based on eGFR and albuminuria [2]. We used the United States Renal Data System (USRDS), a database of Medicare claims for patients with ESRD, to estimate the proportion of patients starting hemodialysis with a tunneled catheter and the mortality risk of patients with ESRD [36].
Tab. 1. Base case parameter inputs for model calibration targets, MDC effectiveness, healthcare costs, and QALYs. 
*Varies by age, sex, UACR, and eGFR; see S1 Appendix. Using a constrained Nelder–Mead minimization algorithm, we calculated transition probabilities that minimized the sum of squared percent differences between actual and computed mortality and progression [39]. We chose the Nelder–Mead algorithm because it allowed us to numerically minimize our objective function without relying on partial derivatives, which may be undefined in this type of nonlinear model. We manually inspected each calibrated model to ensure that it yielded reasonable long-term estimates of mortality and progression to ESRD for each subpopulation of interest (S1 Appendix).
Analysis 2: Modeling the cost-effectiveness of MDC
Description of base case
For our base case, we evaluated a theoretical Medicare-funded MDC program for CKD. As described in the overview, we evaluated a program that uses a combination of nephrologists, advanced practitioners, educators, dieticians, and social workers. It increases in intensity through increased provider visits as kidney function worsens and stops once patients progress to ESRD.
Most of the studies included in the systematic review published by Wang et al. did not explicitly describe each activity performed, making it difficult to disentangle the effect of each component within MDC [21]. Furthermore, some of the studies were substantially less extensive, using only nurses or 1 additional provider type. Because of this uncertainty, we made 2 assumptions to ensure that our cost-effectiveness estimates were conservative. First, we took effectiveness estimates from Wang et al., which represent the average effectiveness of MDC. Second, we assumed that the MDC program mirrored the most expensive program documented [16].
Specifically, we assumed that MDC operates as services above and beyond usual CKD care (Table 2). Patients entering the MDC program have an initial, comprehensive 2-hour visit with the multidisciplinary team of healthcare providers. Subsequently, patients attend regular visits with the MDC team. Patients with stage 3 CKD see a nephrologist or advanced practitioner twice a year, a CKD educator once a year, and a dietician and social worker twice a year. Patients with stage 4 CKD see a nephrologist or advanced practitioner 4 times a year, a CKD educator once a year, and a dietician and social worker 4 times a year. Patients with stage 5 CKD see a nephrologist or advanced practitioner 6 times a year, a CKD educator twice a year, and a dietician and social worker 4 times a year.
We compared MDC to usual CKD care.
Tab. 2. Components of the MDC program. 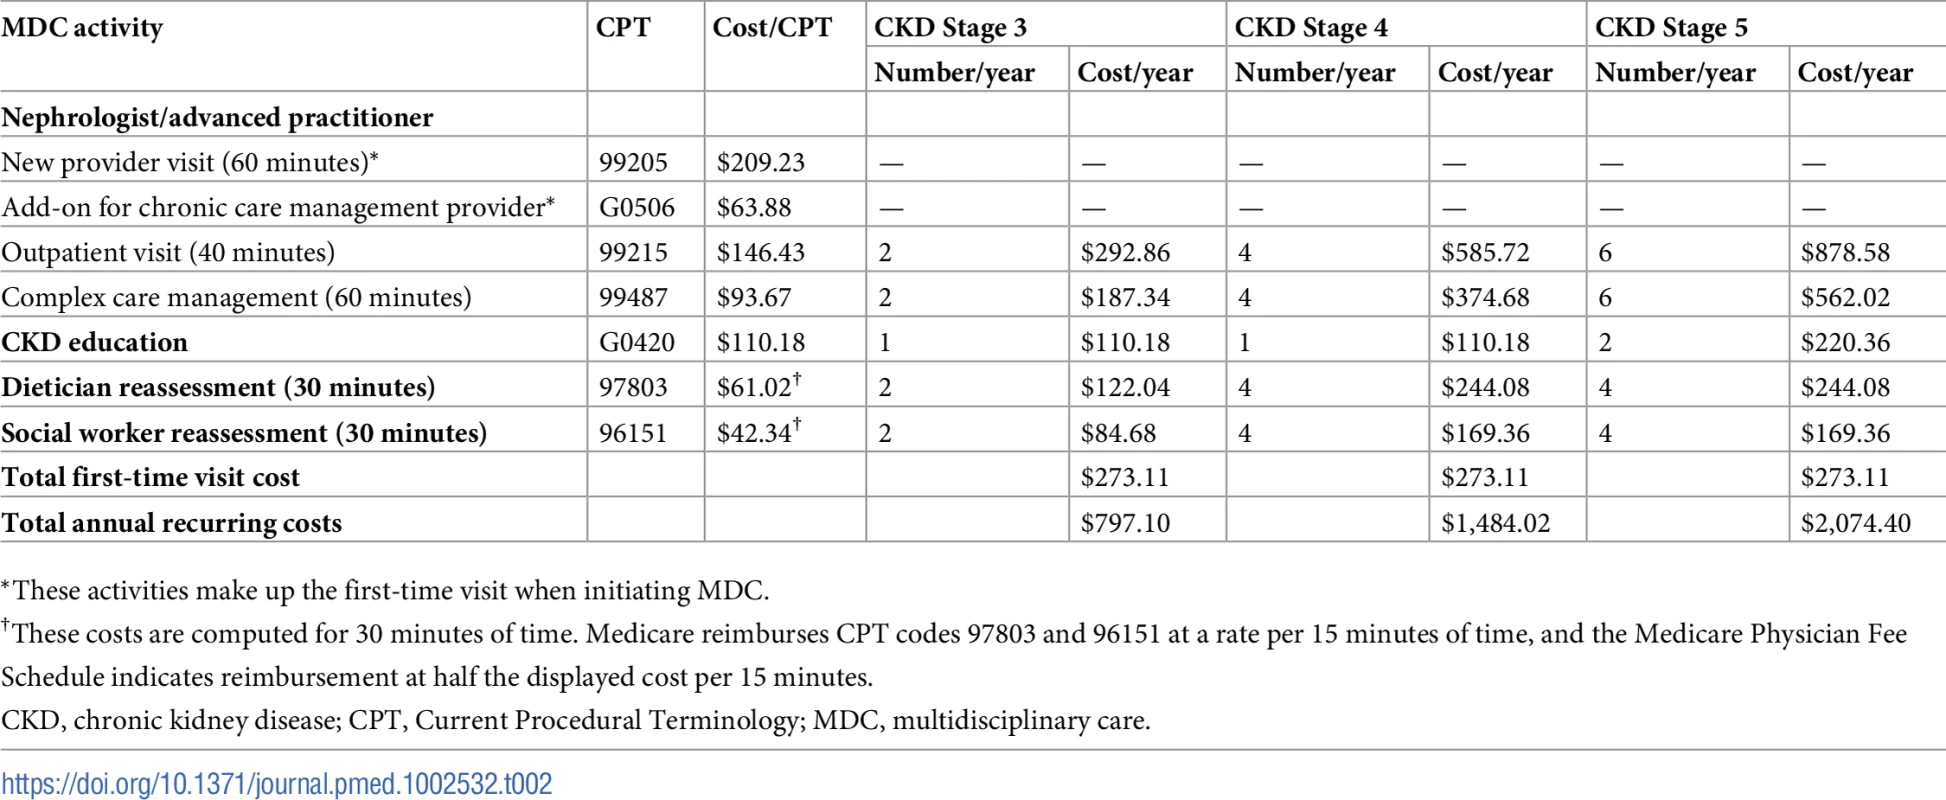
*These activities make up the first-time visit when initiating MDC. Estimating the effectiveness of MDC
Precisely estimating the program’s effectiveness is difficult because the quality of published studies is limited. The Wang et al. study showed that MDC programs were effective in CKD populations overall [21]. However, most of the included studies were observational or single-center randomized trials. Although the majority were published in the last decade, some were published 10 to 20 years ago. Furthermore, none of the studies stratified the effect of MDC by CKD stage, even though in aggregate, they included patients with stage 3 through 5 CKD.
Given these limitations, we discounted the effectiveness of MDC in earlier CKD stages, using the intuition that MDC is less effective in milder forms of CKD. We first calibrated a 100% effective MDC program to odds ratios from Wang et al.: 0.62 for mortality and 0.59 for progression to ESRD over a 4.9-year follow-up (Table 1) [21]. To adjust for a specific effectiveness of MDC, we took the differences in transition probabilities between the 100% effective MDC model and usual care and discounted these differences by the assumed effectiveness. In our base case, we assumed that MDC was 25% as effective as the literature in stage 3 CKD, 50% as effective in stage 4 CKD, and 100% as effective in stage 5 CKD. We applied the same level of effectiveness for all subgroups within a specific CKD stage.
We were unable to incorporate estimates of patient adherence to MDC in our model because prior studies, including those identified in Wang et al. [21], did not identify the proportion of patients that did not adhere to treatment. Implicitly, our initial estimates of MDC’s effectiveness incorporate the average rate of adherence reported in the literature. It is likely that a nationally implemented program would have a lower rate of adherence than that reported from controlled trials. Our uncertainty of the program’s effectiveness and of patients’ adherence prompted us to vary these assumptions widely in sensitivity analyses.
To make results more tangible, we computed hazard ratios for death and progression to ESRD using 10,000 simulated people and estimated a Cox proportional hazards model for each outcome.
Estimating costs
We estimated healthcare costs in US dollars and inflation adjusted them to their January 2017 value [40]. To estimate the annual cost of usual CKD and ESRD care, we used 2012 and 2013 Medicare Parts A and B claims data from the USRDS [36]. We used the 2016 annual data report from the USRDS to obtain Part D cost estimates [1].
For MDC costs, we identified the Current Procedural Terminology (CPT) codes for each MDC activity and obtained their costs from the 2017 Medicare Physician Fee Schedule (Tables 1 and 2) [37]. This resulted in an initial MDC visit cost of $273.11 and subsequent recurring costs that increased with progression of CKD. In general, published studies did not investigate whether MDC increased other healthcare expenses, such as medications and laboratory tests. For our base case, we assumed that MDC increased the use of erythropoietin and activated vitamin D in 25% of patients with an eGFR of 30 ml/min/1.73 m2 and below (Tables 1 and 3). Although many patients receive oral vitamin D, we priced the injectable version because it is more expensive and because we did not have access to oral medication prices in Medicare. We also assumed that MDC increased laboratory testing in 25% of patients with an eGFR of 45 ml/min/1.73 m2 and below. We varied these assumptions widely in sensitivity analyses. We discounted accrued costs at an annual rate of 3%.
Tab. 3. Medications and laboratory tests increased by MDC in the base case. 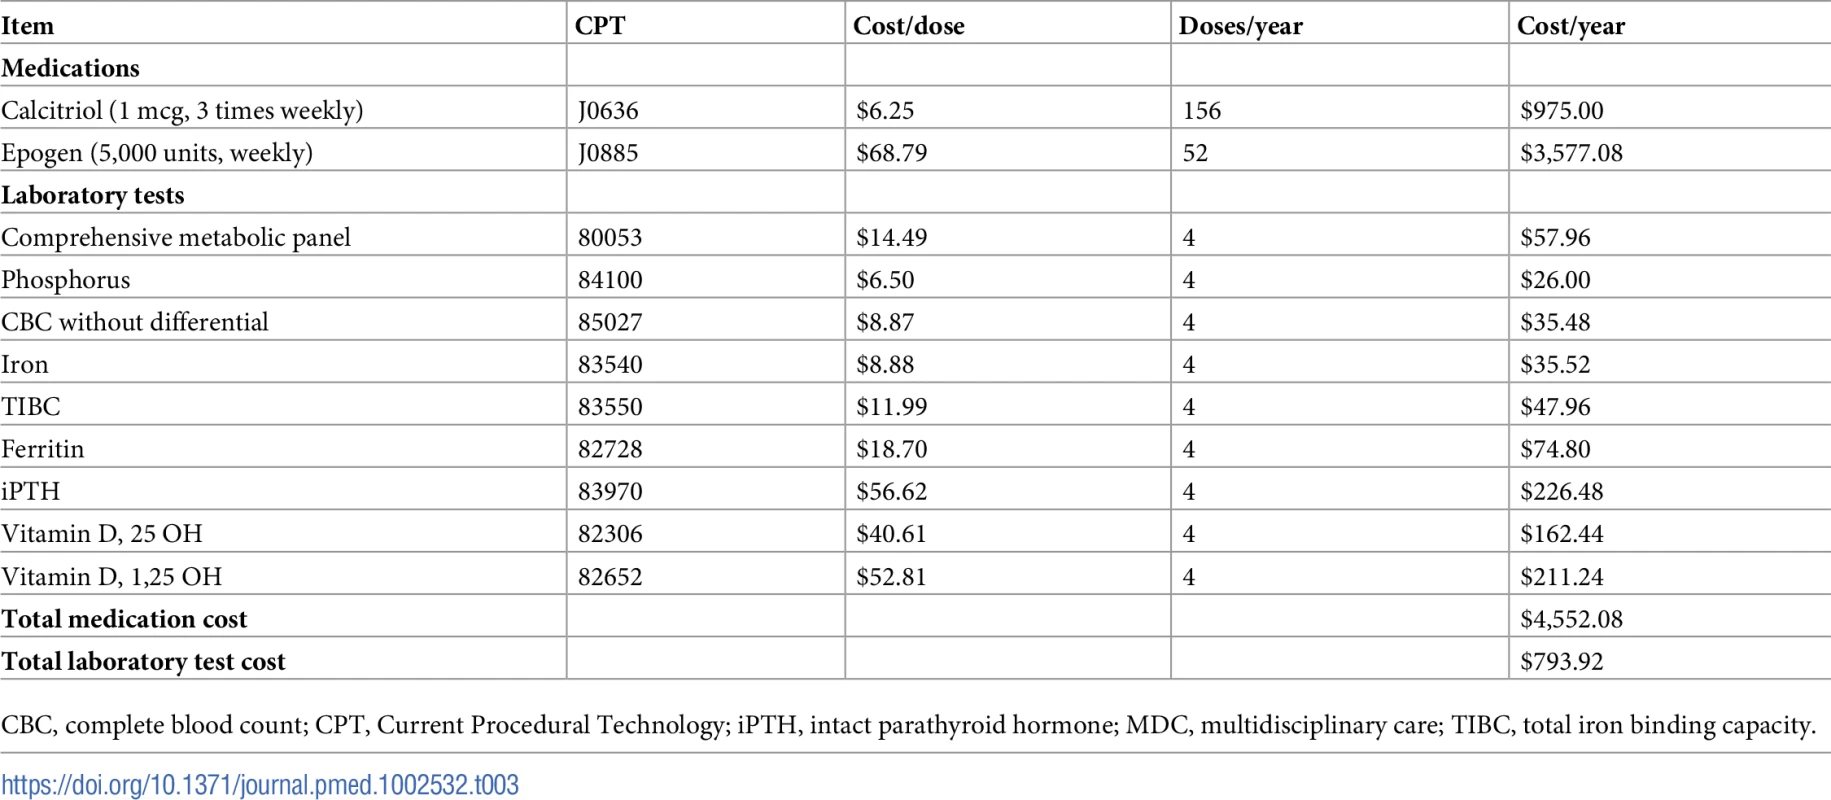
CBC, complete blood count; CPT, Current Procedural Technology; iPTH, intact parathyroid hormone; MDC, multidisciplinary care; TIBC, total iron binding capacity. Health outcomes and their valuation
As indicated above, we assumed that the only benefits to MDC were slowing of CKD progression and mortality reduction. Although MDC has been proposed as a way to mitigate the risk of hospitalization due to cardiovascular disease or acute kidney injury, data are mixed on its effectiveness [16–19,21,41–48]. Given this uncertainty, we did not believe our model could accurately capture MDC’s effects on these outcomes. MDC in patients with later stages of CKD has also focused on dialysis planning, with the goal of reducing the likelihood of starting hemodialysis with a tunneled dialysis catheter and increasing the use of home dialysis [21]. Because our intervention focused on stage 3 and 4 CKD, before most patients consider dialysis planning, we assumed the program did not influence tunneled dialysis catheter rates or likelihood of home dialysis use.
We used QALYs from a recent systematic review by Wyld et al. to estimate the utilities associated with CKD and ESRD [38]. This study aggregated all studies that directly measured utilities (using time trade-off or standard gamble), converted health-related quality of life into utilities (EQ-5D, 15D, or SF-6D), or translated short-form surveys (SF-36 or SF-12) into EQ-5D scores [49,50]. Although Wyld et al. did not differentiate among different stages of CKD, the published literature does not show substantial differences in health-related quality of life across different CKD stages [51,52]. We therefore used the estimate of 0.80 QALYs for CKD and 0.71 QALYs for ESRD (Table 1). We discounted accrued QALYs at a rate of 3% per year.
For cost-effectiveness estimates, we computed the ICER, or the difference in total lifetime cost divided by the difference in total lifetime QALYs. We assumed a willingness to pay (WTP) of $150,000 per QALY gained.
Analysis 3: Sensitivity analyses
Adjusting the effectiveness and cost of MDC
To test our effectiveness assumptions, we investigated the cost-effectiveness under different scenarios (Table 4). We varied the effectiveness of MDC using the previously described method of discounting the difference in transition probabilities. First, we studied programs that were 50% and 25% as effective as the base case. This corresponded to MDC programs that were 12.5% and 6.25% as effective as the literature in stage 3 CKD, 25% and 12.5% as effective in stage 4 CKD, and 50% and 25% as effective in stage 5 CKD, respectively. Next, we tested programs that were equally effective across all CKD stages, at 100%, 50%, and 25% of estimates published in Wang et al. [21]. We call these scenarios “non-discounted.” Finally, we investigated programs that decreased only mortality (not progression to ESRD) at 100%, 50%, and 25% the effectiveness of the base case. This corresponded to effectiveness levels (for mortality) of 25%, 12.5%, and 6.25% in stage 3 CKD; 50%, 25%, and 12.5% in stage 4 CKD; and 100%, 50%, and 25% in stage 5 CKD, respectively.
Tab. 4. Sensitivity analyses: Varying the effectiveness and cost of MDC. 
*Same as base case. Although we were unable to directly model patient adherence to MDC therapy in our model, this is a major aspect of an MDC program’s effectiveness. By varying effectiveness levels widely, we implicitly tested the cost-effectiveness of MDC at different levels of adherence.
We also tested our assumptions of the cost. We first varied the proportion of patients receiving more medications and laboratory tests under MDC: 0%, 10%, 50%, and 100% of patients in the MDC arm. Next, we estimated the cost-effectiveness when all aspects of MDC were 2 times and 5 times costlier than the base case.
Probabilistic sensitivity analysis
For all scenarios, we conducted probabilistic sensitivity analyses by fitting all parameters to probability distributions so that 95% of the probability density fell within the 95% confidence interval (Table 5). In general, we followed standard practice for modeling these distributions by fitting parameters bounded by 0 and 1 (probabilities, QALYs) to beta distributions, odds ratios (positive numbers) to log-normal distributions, and costs (positive numbers) to gamma distributions [53]. This ensured that 95% of random draws occurred within the 95% confidence interval. We drew 5,000 total samples from these distributions for each subpopulation. We induced correlations while preserving marginal distributions, ensuring that ordered probabilities retained their order for each draw (e.g., patients with more severe kidney disease progress faster than patients with less severe kidney disease) [54].
Tab. 5. Probability distributions for probabilistic sensitivity analysis. 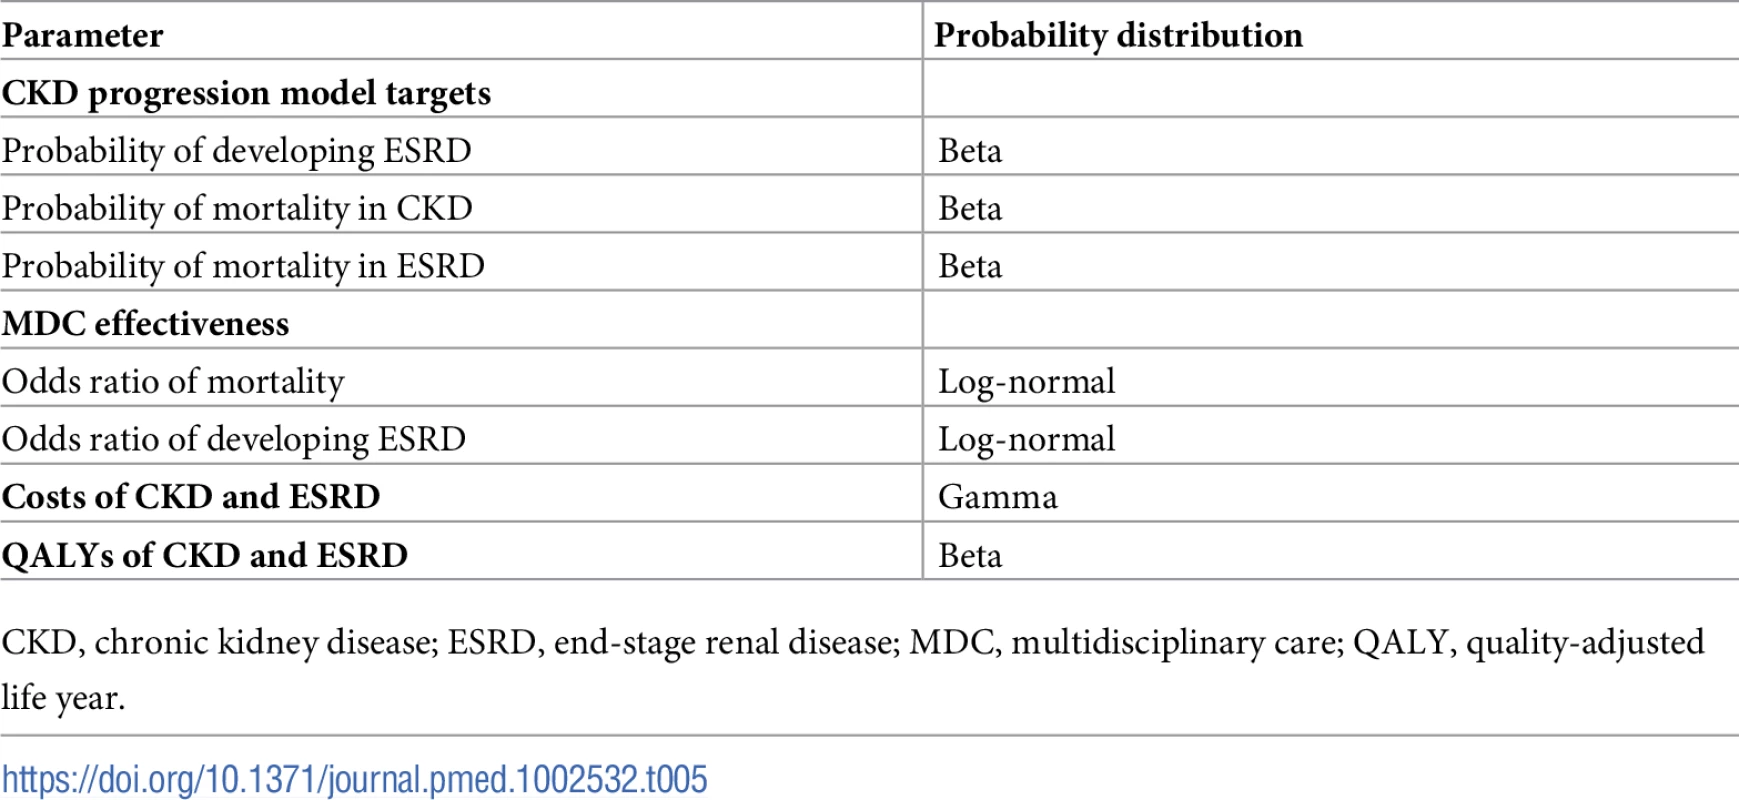
CKD, chronic kidney disease; ESRD, end-stage renal disease; MDC, multidisciplinary care; QALY, quality-adjusted life year. For each probability draw, we solved for control and MDC transition probabilities using the previously described algorithm. We used these distributions to calculate the probability of cost-effectiveness at different WTP thresholds and for different subpopulations. We did not use ICERs to compute these probabilities because negative ICERs are difficult to interpret as they can imply a reduced cost with gain in QALYs (preferred) or an increased cost with a loss of QALYs (not preferred). Therefore, we computed an equivalent measure, the net monetary benefit to determine if a probability draw was cost-effective [55]. For a given WTP threshold, the net monetary benefit is the product of the WTP threshold and the number of QALYs gained minus the cost of the intervention. A positive net monetary benefit implies a cost-effective intervention at that WTP threshold. The probabilistic sensitivity analyses also enabled us to estimate 95% confidence intervals for all costs, QALYs, hazard ratios, and net monetary benefits by taking the 2.5% and 97.5% quantiles.
Statistical software
We used Matlab version R2016b (MathWorks, Natlick, MA) for modeling. We used Stata version 14.1 (StataCorp, College Station, TX) and SAS version 9.4 (SAS Institute, Cary, NC) to estimate costs and target probabilities.
Ethics statement
The Stanford University Institutional Review Board approved of this study and the use of the USRDS database (IRB-17804).
All work using the USRDS was conducted under a data use agreement between Dr. Tara Chang and the National Institute of Diabetes and Digestive and Kidney Diseases (NIDDK). An NIDDK officer reviewed the manuscript and approved it for submission.
CHEERS guidelines
Our study conformed to the Consolidated Health Economic Evaluation Reporting Standards (CHEERS) guidelines (S1 Text) [56].
Results
Incremental costs and outcomes
We found that MDC improved health by 0.23 (95% CI: 0.08, 0.42) QALYs per person over usual care, from 1.78 to 2.01 QALYs (Tables 6–9). This translated to hazard ratios of 0.77 (95% CI: 0.63, 0.92) for death and 0.62 (95% CI: 0.43, 0.86) for progression to ESRD (Tables 10–13). The improvement in outcomes was more pronounced for younger patients, with 45–64 year olds seeing a higher increase in QALYs (95% CI: 0.31–0.76) than 75–84 year olds (95% CI: 0.09–0.31). Across different races, sexes, and eGFRs, the gain in health was similar. Patients with higher levels of albuminuria generally gained fewer QALYs than those with lower levels of albuminuria. For example, patients with a UACR of approximately 3,000 mg/g gained fewer QALYs (95% CI: 0.09–0.33) than patients with no albuminuria (UACR approximately 1 mg/g) (95% CI: 0.22–0.76). However, relative gains in QALYs were similar across different levels of albuminuria (a 9% to 33% increase versus a 10% to 19% increase, respectively).
Tab. 6. Cost-effectiveness of MDC by severity of kidney disease. 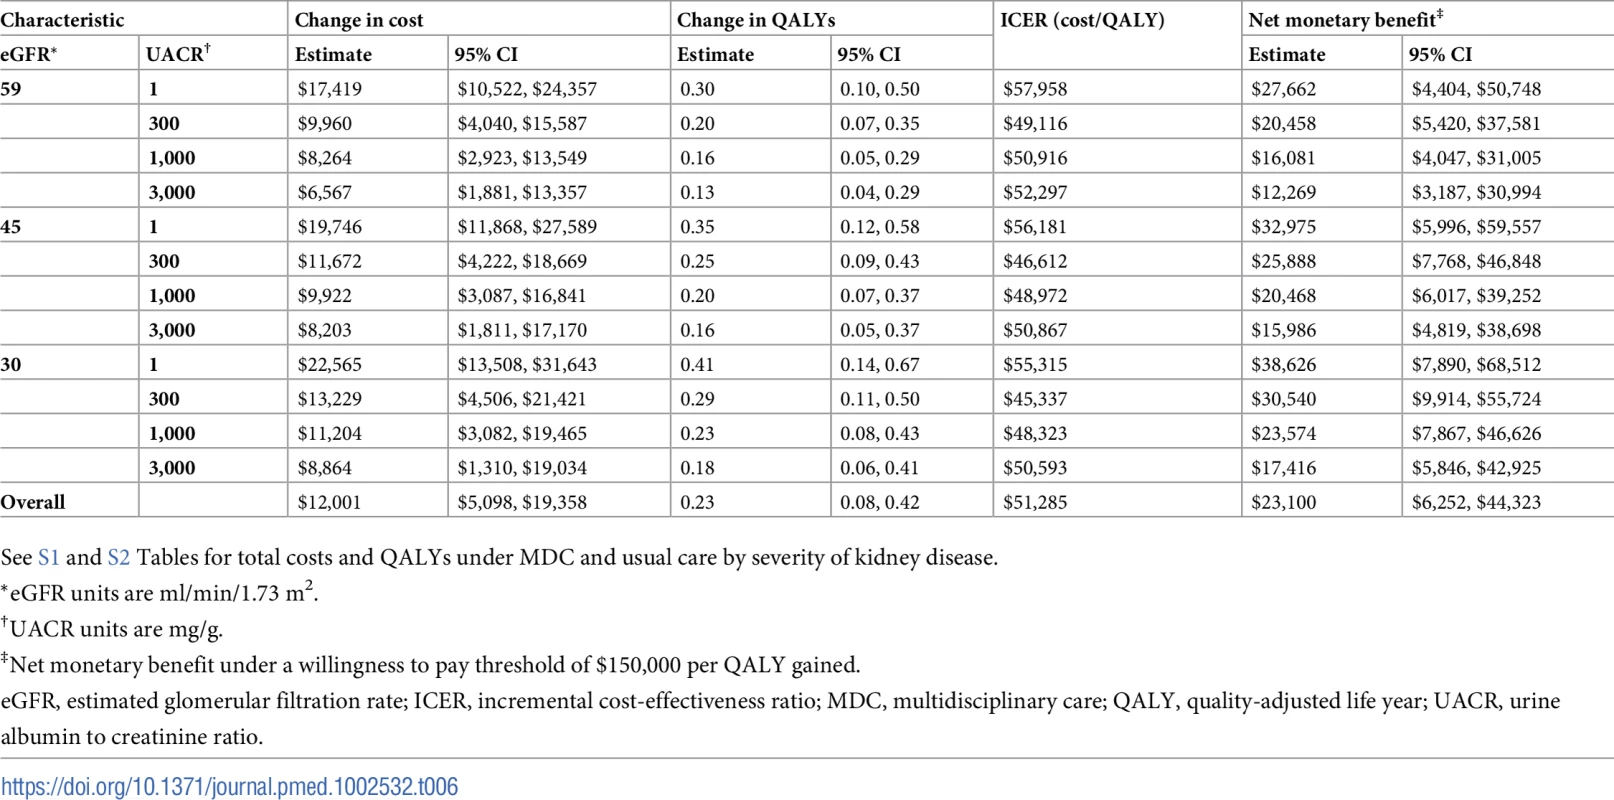
See S1 and S2 Tables for total costs and QALYs under MDC and usual care by severity of kidney disease. Tab. 7. Cost-effectiveness of MDC by age. 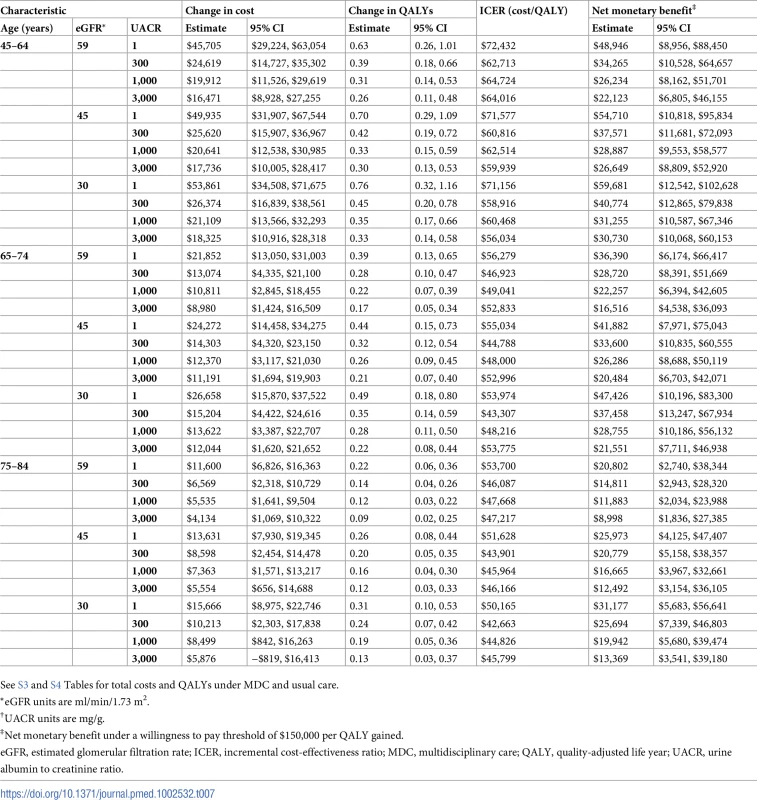
See S3 and S4 Tables for total costs and QALYs under MDC and usual care. Tab. 8. Cost-effectiveness of MDC by sex. 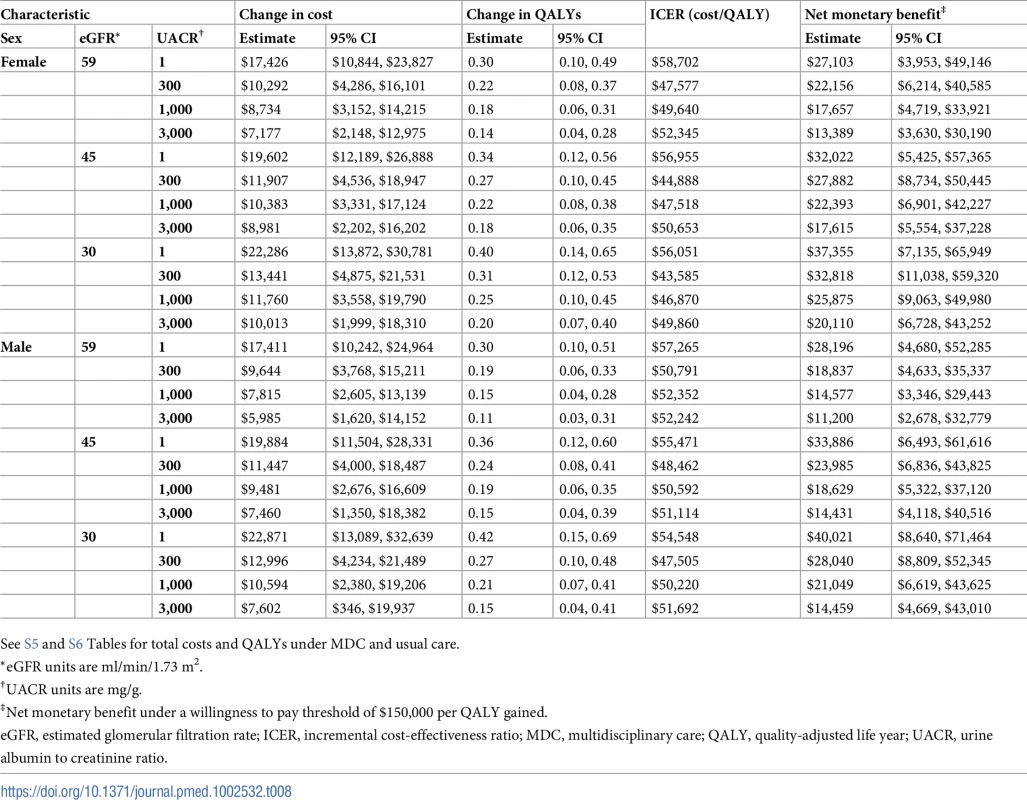
See S5 and S6 Tables for total costs and QALYs under MDC and usual care. Tab. 9. Cost-effectiveness of MDC by race. 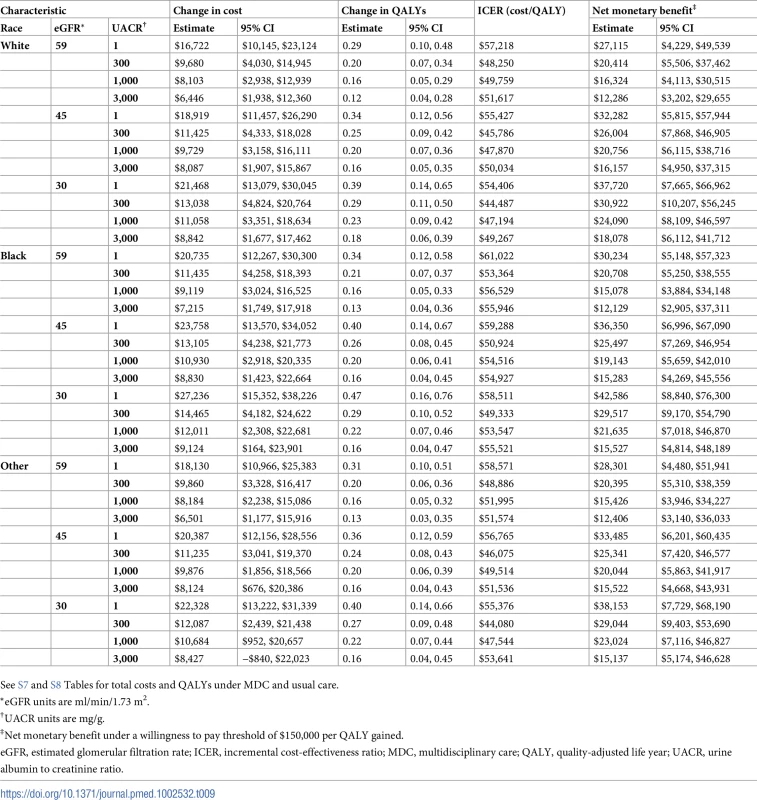
See S7 and S8 Tables for total costs and QALYs under MDC and usual care. Tab. 10. Hazard ratios of multidisciplinary care by severity of kidney disease. 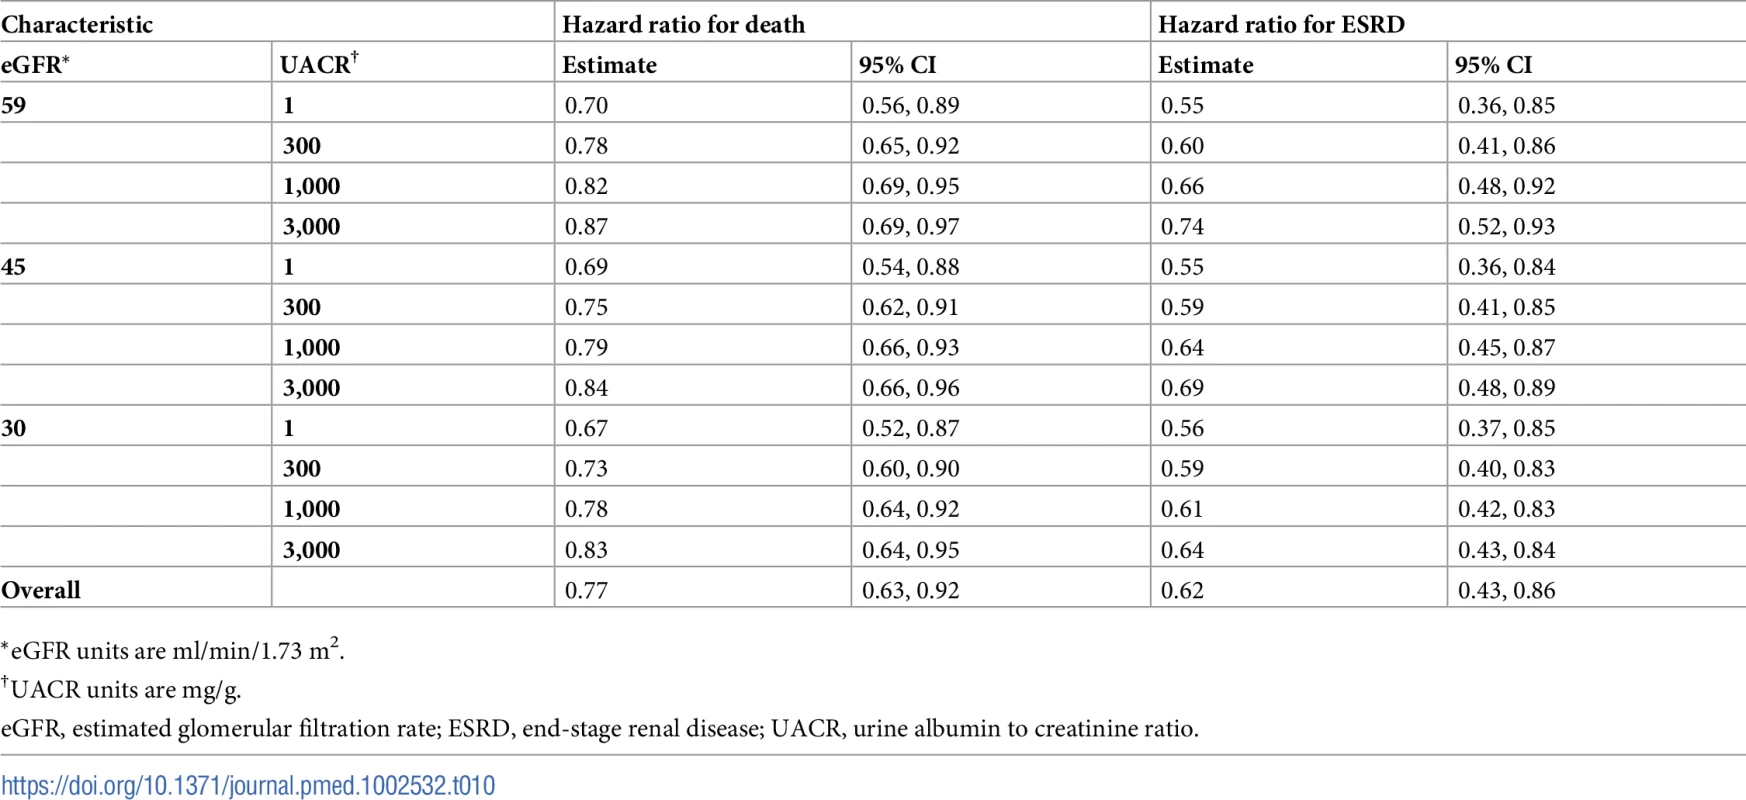
*eGFR units are ml/min/1.73 m2. Tab. 11. Hazard ratios of multidisciplinary care by age. 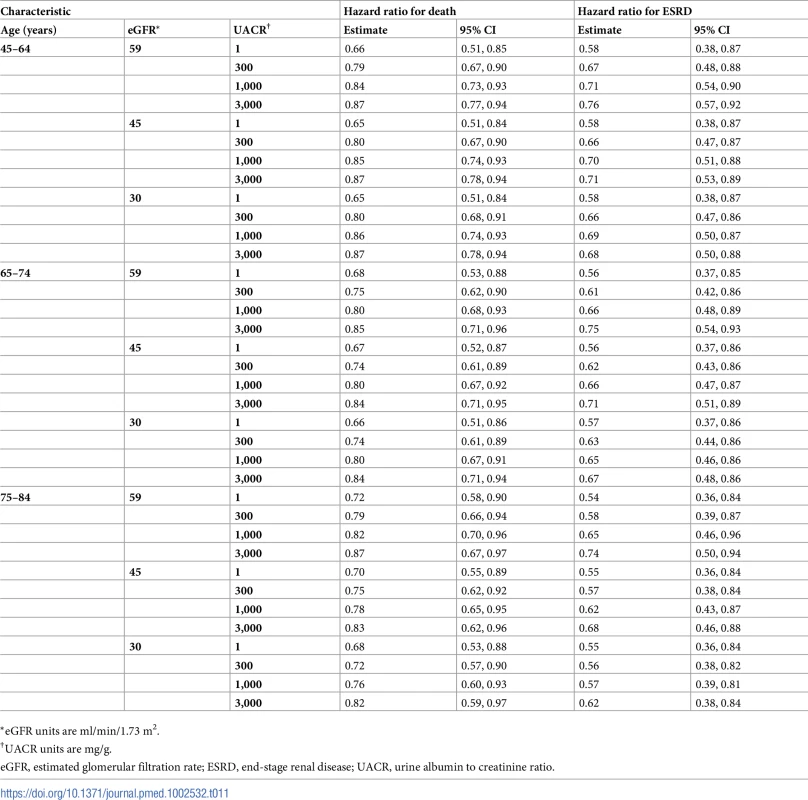
*eGFR units are ml/min/1.73 m2. Tab. 12. Hazard ratios of multidisciplinary care by sex. 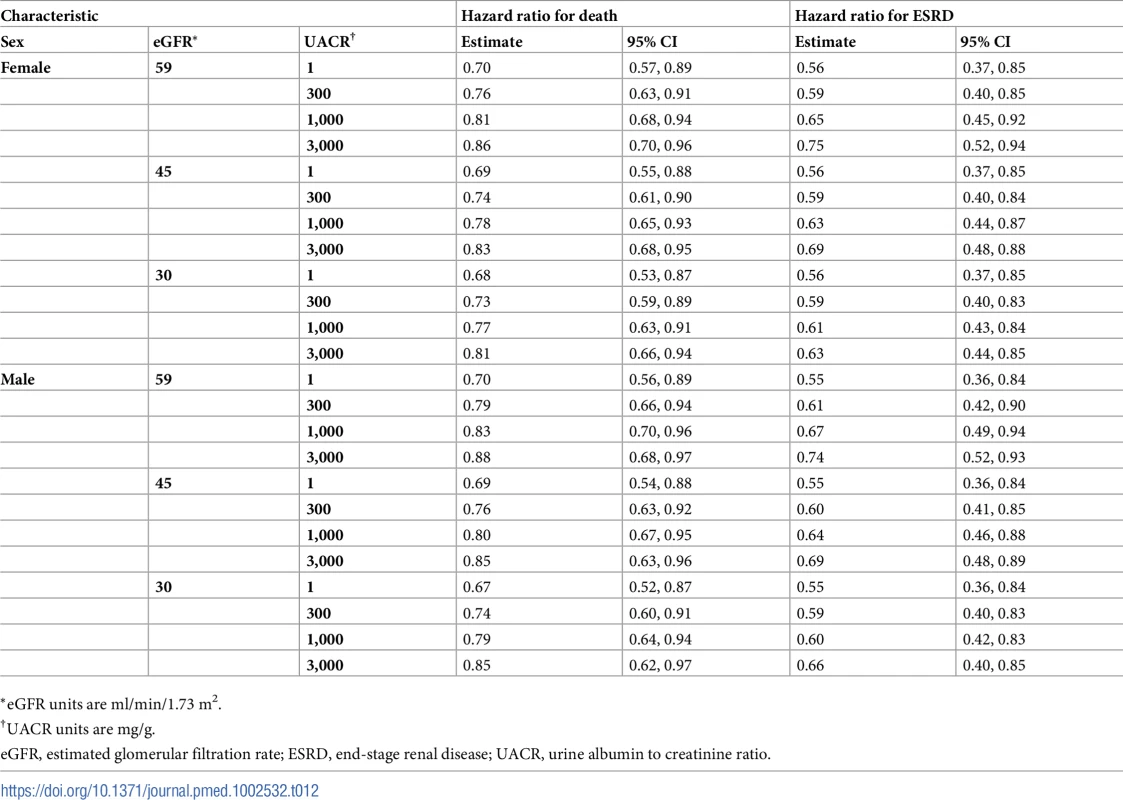
*eGFR units are ml/min/1.73 m2. Tab. 13. Hazard ratios of multidisciplinary care by race. 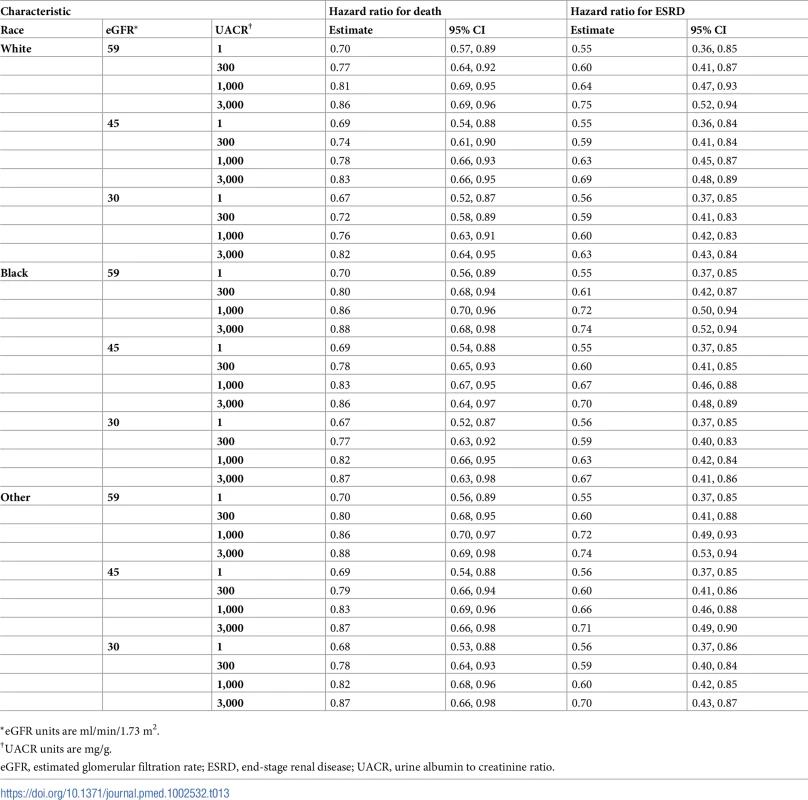
*eGFR units are ml/min/1.73 m2. On average, MDC cost $12,001 (95% CI: $5,098, $19,358) more than usual care per patient over the lifetime, an increase from $68,571 to $80,572 (Tables 6–9). The corresponding ICER was $51,285 per QALY gained, which was cost-effective at a threshold of $150,000 per QALY (net monetary benefit of $23,100; 95% CI: $6,252, $44,323). The ICERs ranged from $42,663 to $72,432 per QALY gained in all subgroups. In general, MDC was more expensive in patients with lower levels of albuminuria. For instance, patients with a UACR of 1 mg/g had ICERs of $55,315 to $57,958 per QALY gained versus $48,323 to $50,916 per QALY gained in patients with a UACR of 1,000 mg/g. Similarly, younger patients tended to have higher ICERs, though these higher relative expenses brought forth greater improvements in health.
Effectiveness sensitivity analyses
MDC remained cost-effective at the WTP threshold of $150,000 per QALY in most sensitivity analyses where we varied its effectiveness (Tables 14 and S9–S11). Even when the program was only 25% as effective as the base case, MDC was cost-effective on average in the entire population, with an ICER of $127,927 per QALY gained, though the 95% confidence interval for net monetary benefit did cross $0 (net monetary benefit of $1,076; 95% CI: −$2,194, $4,088). This corresponded to hazard ratios of 0.95 for death and 0.91 for progression to ESRD. Notably, MDC was not cost-effective when operating at 25% effectiveness in patients with an eGFR of 59 ml/min/1.73 m2 and UACR of 1 mg/g (ICER $151,869 per QALY) (S9 Table). When we assumed that MDC did not attenuate progression to ESRD and was only 25% as effective as the base case in preventing death (hazard ratios of 0.93–0.97 for death and 1.00–1.02 for progression to ESRD), the program was not cost-effective in all subgroups.
Tab. 14. Cost-effectiveness when varying the effectiveness of MDC—whole population. 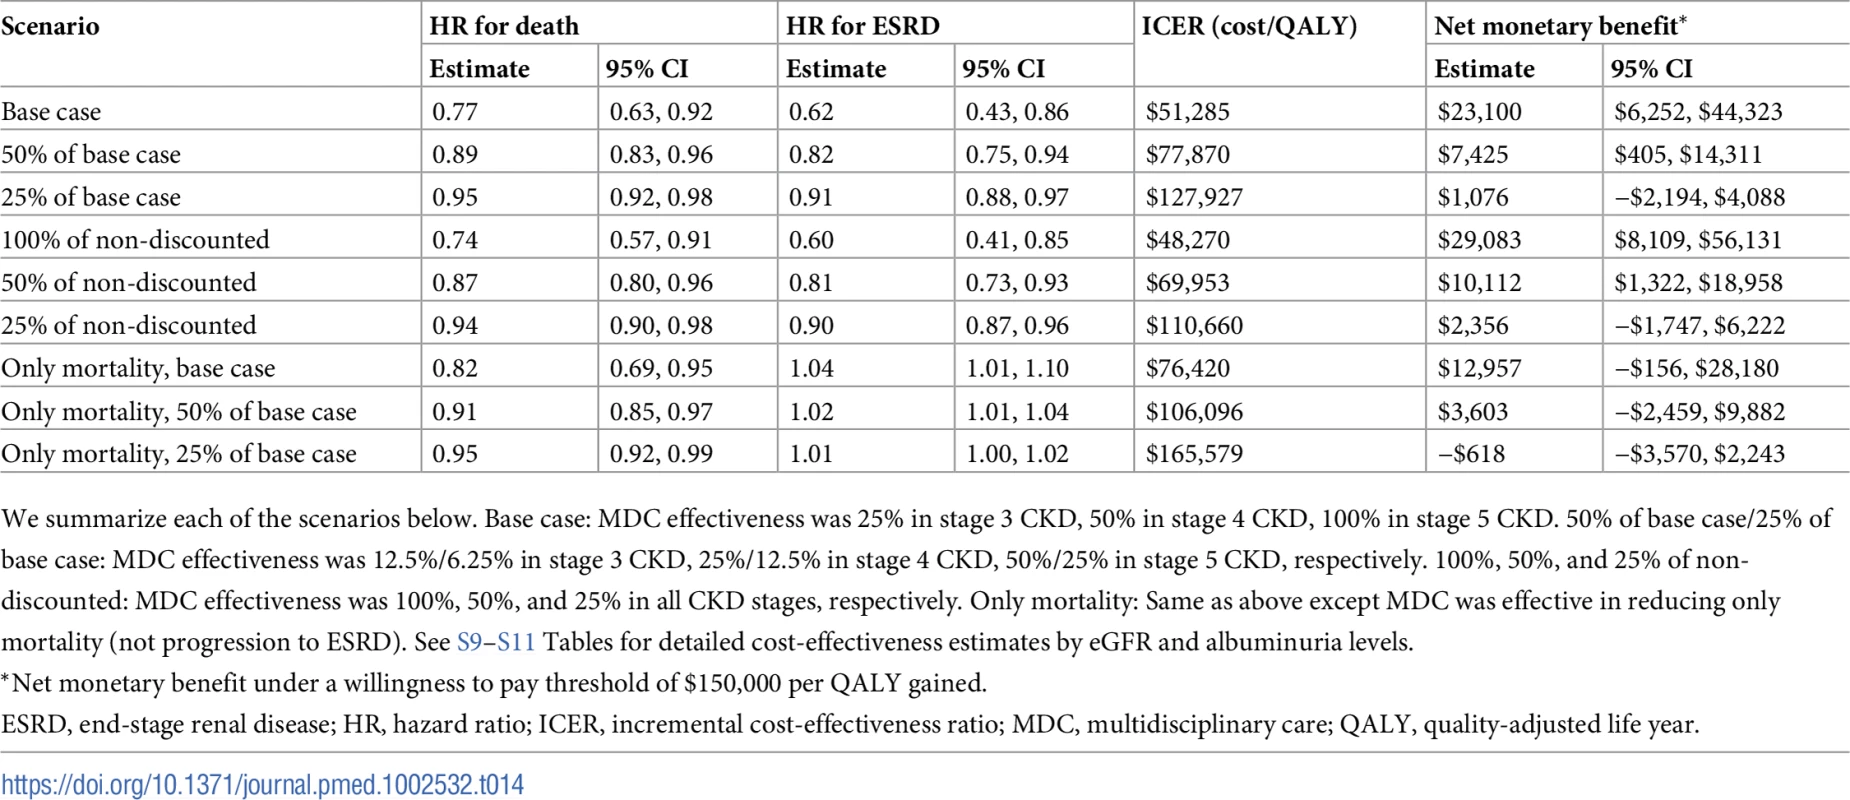
We summarize each of the scenarios below. Base case: MDC effectiveness was 25% in stage 3 CKD, 50% in stage 4 CKD, 100% in stage 5 CKD. 50% of base case/25% of base case: MDC effectiveness was 12.5%/6.25% in stage 3 CKD, 25%/12.5% in stage 4 CKD, 50%/25% in stage 5 CKD, respectively. 100%, 50%, and 25% of non-discounted: MDC effectiveness was 100%, 50%, and 25% in all CKD stages, respectively. Only mortality: Same as above except MDC was effective in reducing only mortality (not progression to ESRD). See S9–S11 Tables for detailed cost-effectiveness estimates by eGFR and albuminuria levels. Cost sensitivity analyses
In all scenarios that varied the cost, we found that point estimates for the ICERs were less than $150,000 per QALY gained (Fig 2). MDC remained cost-effective even when we increased the monthly cost 5-fold, although the upper end of the 95% confidence interval exceeded our threshold for cost-effectiveness. Additionally, MDC remained cost-effective when it increased the use of medications and laboratory tests in 100% of the population. In this case, the upper end of the 95% confidence interval for patients without albuminuria exceeded $150,000 per QALY gained. For patients with higher levels of albuminuria, the 95% confidence interval remained less than $150,000 per QALY gained. In all cost sensitivity analyses, we found that MDC was more expensive in patients without albuminuria versus those with UACR of 300 or 1,000 mg/g.
Fig. 2. Varying the cost of multidisciplinary care (MDC). 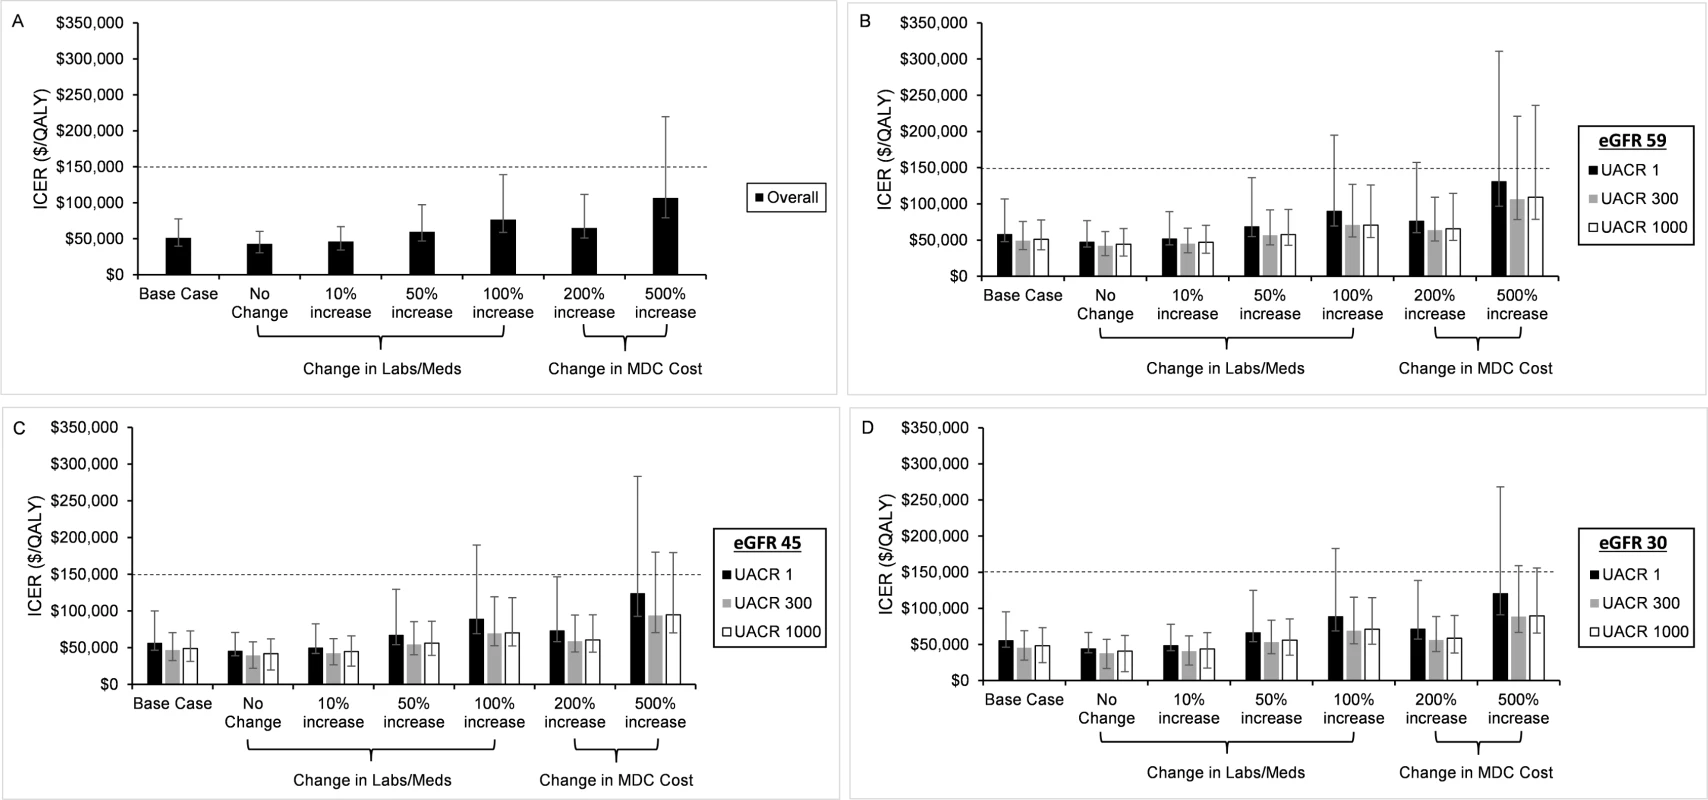
In sensitivity analyses, we varied the cost of MDC. We depict the incremental cost-effectiveness ratios (ICERs) for the entire population (A) and stratified by estimated glomerular filtration rate (eGFR) and urine albumin to creatinine ratio (UACR) (B–D). Our base case assumed that MDC increased the use of chronic kidney disease–specific medications (Meds) and laboratory tests (Labs) in 25% of the population. In subsequent analyses, we assumed that MDC increased the use of these medications and laboratory tests in 0%, 10%, 50%, and 100% of the population. We also increased the cost of the entire program 2-fold and 5-fold. In all analyses, we found that MDC remained cost-effective, but the upper end of the 95% confidence intervals exceeded the willingness to pay threshold of 0,000 per QALY in the most expensive cases. The program was more expensive (higher ICERs) in patients with UACR of 1 mg/g when compared to patients with UACR of 300 or 1,000 mg/g. Probabilistic sensitivity analysis
In the base case, we found that MDC was cost-effective in over 99% of probabilistic sensitivity analyses at a threshold of $87,500 per QALY and in over 95% of probabilistic sensitivity analyses at a threshold of $70,000 per QALY (Fig 3A–3D). In all subgroups, we found that MDC cost less than $150,000 per QALY in over 99% of probabilistic sensitivity analyses. Although findings were similar across eGFR levels, MDC tended to have a lower probability of cost-effectiveness for patients with less albuminuria.
Fig. 3. Cost-effectiveness acceptability curves for multidisciplinary care (MDC). 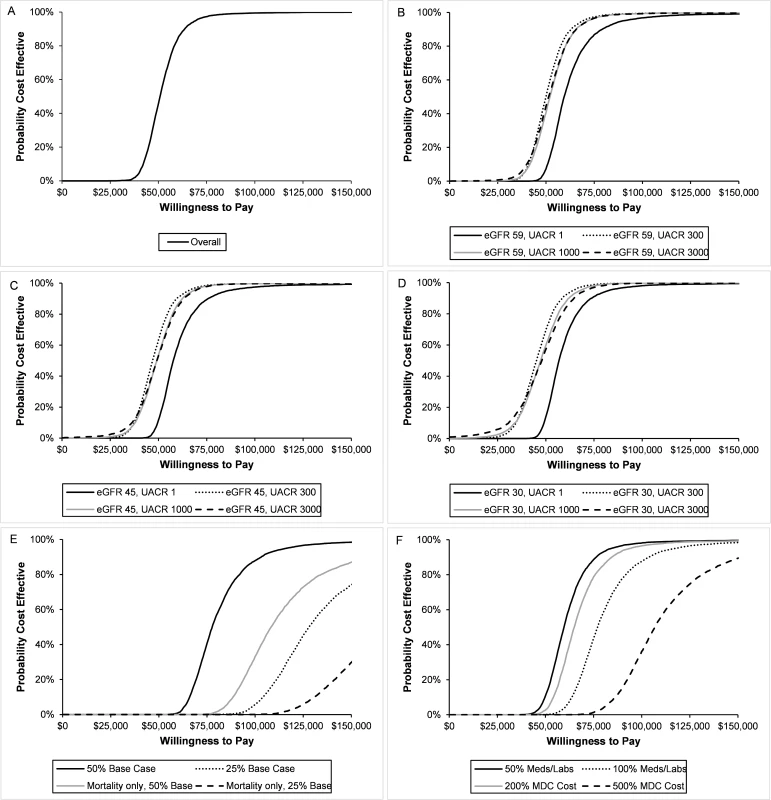
We estimated the probability that the MDC program was cost-effective in different populations and with all sensitivity analyses. We show the acceptability curves for the overall population (A) and stratified by estimated glomerular filtration rate (eGFR) and urine albumin to creatinine ratio (UACR) (B–D). In all populations, greater than 95% of probability sensitivity analyses costed less than ,000 per QALY, and greater than 99% of analyses costed less than 0,000 per QALY. In general, MDC was less likely to be cost-effective in populations with no albuminuria (UACR 1 mg/g) and higher eGFR (59 ml/min/1.73 m2). We also assessed the probability when varying effectiveness (E) and cost (F). When MDC was 50% as effective as the base case, it was cost-effective with 98% probability at a willingness to pay (WTP) threshold of 0,000 per QALY. This probability dropped with other effectiveness scenarios. For most cost scenarios, MDC was cost-effective with 95% probability at a WTP of 0,000, though this probability dropped to 89% when MDC cost 5 times the base case. When we decreased the effectiveness of MDC to 50% of the base case, we found that the program was cost-effective with 98% probability at a threshold of $150,000 per QALY (Fig 3E). However, the probability dropped to 74% under the scenario where the program was 25% as effective as the base case. The probability of cost-effectiveness dropped further when we assumed MDC only affected mortality and not progression to ESRD.
In most cost sensitivity analyses, the probability that MDC was cost-effective was greater than 95% at a threshold of $150,000 per QALY gained (Fig 3F). However, once we increased the cost of MDC 5-fold (relative to the base case), the probability declined to 89%.
Discussion
Using data from literature, we developed and calibrated a deterministic Markov model that accurately models disease progression of patients with stage 3 and 4 CKD and accounts for population heterogeneity including age, sex, race, severity of kidney disease, and albuminuria. From this model, we found that a Medicare-funded MDC program in non-dialysis-requiring (eGFR 20 to 59 ml/min/1.73 m2) CKD is cost-effective in middle-aged to elderly patients. Although cost-effective in all subgroups, the program is more cost-effective in patients with more advanced CKD, particularly those with higher levels of albuminuria. Provision of MDC to younger patients was more expensive, but younger patients gained the most in health outcomes, as measured by QALYs. Notably, MDC remained cost-effective even if it was 5 times more expensive or one-quarter as effective as our base case.
Treating CKD requires effective management across multiple dimensions. Blood pressure control, especially the use of ACE inhibitors and angiotensin receptor blockers, is a mainstay of care [57,58]. Reducing cardiovascular risk factors and managing diet, fluid, and electrolyte balance are also important adjuncts [59,60]. Medication and dietary non-adherence are prevalent and can limit the success of CKD treatment [61,62].
MDC in CKD could help bridge the gap between successful scientific advances and lagging population health. Since CKD is a heterogeneous disease, determining subgroups that benefit most is important. Younger patients and those with less albuminuria gained the most QALYs. These findings are likely due to longer baseline life expectancy, since we found similar relative gains in health in all subpopulations. This probably explains why MDC is more expensive in younger patients and patients with less albuminuria, since a longer lifespan leads to additional healthcare spending, including on MDC. Importantly, we found that MDC represents excellent value potential for patients with higher levels of albuminuria, where slowing kidney progression can delay the onset of dialysis. Our study could help providers and program developers identify the subgroups of patients most likely to benefit from MDC.
Surprisingly, MDC was cost-effective, albeit more expensive, in patients without albuminuria, suggesting that MDC may be worthwhile in this population. The added expense is likely due to poor generalizability of MDC to patients without albuminuria who are at low risk for developing ESRD [33]. Even though MDC was cost-effective in this group on average, many such patients probably would not benefit from an intensive MDC program, especially one that aims to slow progression to ESRD. In patients without albuminuria, benefits from MDC probably reflect reduced mortality from cardiovascular disease rather than slowed CKD progression [63]. This finding was corroborated by our sensitivity analysis in which we assumed that MDC did not attenuate progression to ESRD. Here, MDC remained cost-effective, except under the most pessimistic scenario. Future studies of MDC could focus on disentangling the components of MDC that reduce cardiovascular complications and mortality from those that slow progression to ESRD, which would increase its applicability to patients without albuminuria.
Few studies have attempted to assess the economic impact of MDC in CKD, and none to our knowledge has used a CKD progression model incorporating disease heterogeneity. Several simulation studies have suggested that more optimally managing CKD could lead to up to $20,000 of savings per patient (€17,700 per patient) [22] and $60 billion annually [13]. Because these studies aimed to quantify only the savings associated with slowing progression to ESRD, they did not consider the cost of the intervention used to improve CKD management. We found that the cost of an MDC program would likely exceed potential savings from preventing the onset of ESRD, but that these excess costs would be relatively modest. Other studies using data from MDC trials also reported that MDC could lead to cost savings [10,17,41]. However, these studies did not incorporate the cost of anemia and bone-mineral metabolism management, which can be expensive, and none accrued costs over patients’ lifetimes.
Our results indicate that a US Medicare-funded MDC program would likely have significant costs. Thus, it is unlikely that healthcare providers would independently deploy such a program without reimbursement, since MDC could cost a provider seeing 100 patients with CKD $800,000 to $2,000,000 annually, assuming Medicare reimburses at marginal cost. This could explain why MDC has not had widespread adoption, especially as Medicare has begun rewarding providers for demonstrating cost savings [64–66]. While we did not show a reduction in Medicare expenditures, we found that modest investment in CKD care management could yield substantial gains in health. Additionally, our findings in patients 45–64 years of age could be extended to non-Medicare US healthcare payers because the vast majority of patients do not qualify for Medicare until they turn 65. Beneficiaries of these healthcare payers potentially have the most to gain, since MDC is especially beneficial for younger patients.
Other countries could also see improvements in health with small investments in MDC programs. The global prevalence of CKD is reported to be 8%–16% worldwide and continues to grow [67–69]. MDC in CKD has been successfully tested in non-US populations, including in Canada [7,15,16,42,46,70], the United Kingdom [43], France [44], Italy [70], the Netherlands [11], South Korea [14], and Taiwan [17,19,41,45,47,48], and could reduce the growing need for renal replacement at reasonable cost. In developing countries with poor access to renal replacement, MDC could be an inexpensive alternative to providing dialysis, which requires additional investment in infrastructure and capital [71,72].
Although Wang et al. reported that MDC reduces mortality and ESRD in CKD [21], we believe that their effectiveness estimates were inflated. Many of the included studies were not randomized controlled trials, and probably reflected populations likely to benefit. Additionally, providers actively investigating MDC are probably among the best at care management. Implementing a national program may be less efficient, especially if adherence to the program is modest or poor. It seems unlikely that a large-scale MDC program would be as effective as our base case. However, when we tested programs with much smaller effect sizes, MDC remained cost-effective, particularly in more severe kidney disease. Testing MDC programs that were less effective than our base case also allowed us to capture scenarios where patient adherence is poor. Nevertheless, Medicare would probably benefit from pursuing a cautious approach. Our most pessimistic scenario was not cost-effective, especially in patients with mild to moderate, non-proteinuric CKD. Implementing a pilot program for patients vulnerable to progressing to ESRD could increase the certainty that a nationally implemented program would be cost-effective.
Our study had some important limitations. First, the literature likely overestimates the effectiveness of MDC. We attempted to address this issue by using conservative estimates for our base case and by extensively testing changes in cost and effectiveness. We found that substantially less effective programs remained cost-effective. Second, our simulations relied on a calibrated model based on reported CKD progression and mortality rates. Results from published literature have limited generalizability, and although we accounted for population-level heterogeneity, our model cannot fully incorporate differences in patient factors. Third, although our model was novel in that it accounted for aspects of population-level heterogeneity, including age, sex, race, and severity of kidney disease, our model was unable to capture other known determinants of CKD progression such as socioeconomic status [73–75]. Fourth, our analysis relied on prior studies that did not generally stratify effectiveness by CKD stage. We accounted for this by assuming that MDC was less effective in milder stages of CKD and by varying its effectiveness in different CKD stages. Finally, we limited our investigation to patients with mild to moderate CKD and only studied the effect of MDC on CKD progression and all-cause mortality. Given the absence of data on the effect of MDC on intermediate endpoints, we were unable to incorporate cardiovascular or other hospitalizations into our cost-effectiveness estimates.
Strengths of our study include our development and calibration of a novel CKD progression model, which was able to reliably reproduce long-term rates of mortality and progression to ESRD in many different subpopulations. Using this model, we were able to detect variation in the cost-effectiveness of MDC that incorporates heterogeneity in the population. Our model is also flexible enough to allow investigators to test other interventions in patients with CKD. Additionally, we tested a wide swath of effectiveness and cost scenarios, and our results were robust to these changes except in the most pessimistic scenarios. Finally, our probabilistic sensitivity analysis allowed us to simultaneously test variation in all our parameters while accounting for correlations. By fitting our parameters to probability distributions, we were able to ensure that the joint distribution of our model fit parameters reported in literature.
In conclusion, our model estimates suggest that a Medicare-funded MDC program, even if implemented with modest efficiency, is likely to be cost-effective in middle-aged to elderly patients with mild to moderate CKD. Reimbursing providers for intensive disease management could be a relatively inexpensive way to improve the health of patients with CKD.
Supporting Information
Zdroje
1. United States Renal Data System. Annual data report 2016: epidemiology of kidney disease in the United States. Bethesda (MD): National Institutes of Health National Institute of Diabetes and Digestive and Kidney Diseases; 2016.
2. van der Velde M, Matsushita K, Coresh J, Astor BC, Woodward M, Levey A, et al. Lower estimated glomerular filtration rate and higher albuminuria are associated with all-cause and cardiovascular mortality. A collaborative meta-analysis of high-risk population cohorts. Kidney Int. 2011;79 : 1341–52. doi: 10.1038/ki.2010.536 21307840
3. Tonelli M. Chronic kidney disease and mortality risk: a systematic review. J Am Soc Nephrol. 2006;17 : 2034–47. doi: 10.1681/ASN.2005101085 16738019
4. Inglis SC, Pearson S, Treen S, Gallasch T, Horowitz JD, Stewart S. Extending the horizon in chronic heart failure: effects of multidisciplinary, home-based intervention relative to usual care. Circulation. 2006;114 : 2466–73. doi: 10.1161/CIRCULATIONAHA.106.638122 17116767
5. Kim MM, Barnato AE, Angus DC, Fleisher LA, Fleisher LF, Kahn JM. The effect of multidisciplinary care teams on intensive care unit mortality. Arch Intern Med. 2010;170 : 369–76. doi: 10.1001/archinternmed.2009.521 20177041
6. Sidhom MA, Poulsen MG. Multidisciplinary care in oncology: medicolegal implications of group decisions. Lancet Oncol. 2006;7 : 951–4. doi: 10.1016/S1470-2045(06)70942-1 17081921
7. Barrett BJ, Garg AX, Goeree R, Levin A, Molzahn A, Rigatto C, et al. A nurse-coordinated model of care versus usual care for stage 3/4 chronic kidney disease in the community: a randomized controlled trial. Clin J Am Soc Nephrol. 2011;6 : 1241–7. doi: 10.2215/CJN.07160810 21617090
8. Bayliss EA, Bhardwaja B, Ross C, Beck A, Lanese DM. Multidisciplinary team care may slow the rate of decline in renal function. Clin J Am Soc Nephrol. 2011;6 : 704–10. doi: 10.2215/CJN.06610810 21273376
9. Harris LE, Luft FC, Rudy DW, Kesterson JG, Tierney WM. Effects of multidisciplinary case management in patients with chronic renal insufficiency. Am J Med. 1998;105 : 464–71. 9870830
10. Hopkins RB, Garg AX, Levin A, Molzahn A, Rigatto C, Singer J, et al. Cost-effectiveness analysis of a randomized trial comparing care models for chronic kidney disease. Clin J Am Soc Nephrol. 2011;6 : 1248–57. doi: 10.2215/CJN.07180810 21617091
11. Peeters MJ, van Zuilen AD, van den Brand JAJG, Bots ML, van Buren M, Ten Dam MAGJ, et al. Nurse practitioner care improves renal outcome in patients with CKD. J Am Soc Nephrol. 2014;25 : 390–8. doi: 10.1681/ASN.2012121222 24158983
12. Thanamayooran S, Rose C, Hirsch DJ. Effectiveness of a multidisciplinary kidney disease clinic in achieving treatment guideline targets. Nephrol Dial Transplant. 2005;20 : 2385–93. doi: 10.1093/ndt/gfi024 16046506
13. Trivedi HS, Pang MMH, Campbell A, Saab P. Slowing the progression of chronic renal failure: economic benefits and patients’ perspectives. Am J Kidney Dis. 2002;39 : 721–29. doi: 10.1053/ajkd.2002.31990 11920337
14. Cho EJ, Park HC, Yoon HB, Ju KD, Kim H, Oh YK, et al. Effect of multidisciplinary pre-dialysis education in advanced chronic kidney disease: propensity score matched cohort analysis. Nephrology (Carlton). 2012;17 : 472–9. doi: 10.1111/j.1440-1797.2012.01598.x 22435951
15. Devins GM, Mendelssohn DC, Barré PE, Binik YM. Predialysis psychoeducational intervention and coping styles influence time to dialysis in chronic kidney disease. Am J Kidney Dis. 2003;42 : 693–703. 14520619
16. Levin A, Lewis M, Mortiboy P, Faber S, Hare I, Porter EC, et al. Multidisciplinary predialysis programs: quantification and limitations of their impact on patient outcomes in two Canadian settings. Am J Kidney Dis. 1997;29 : 533–40. 9100041
17. Wu I-W, Wang S-Y, Hsu K-H, Lee C-C, Sun C-Y, Tsai C-J, et al. Multidisciplinary predialysis education decreases the incidence of dialysis and reduces mortality—a controlled cohort study based on the NKF/DOQI guidelines. Nephrol Dial Transplant. 2009;24 : 3426–33. doi: 10.1093/ndt/gfp259 19491379
18. Yeoh HH, Tiquia HS, Abcar AC, Rasgon SA, Idroos ML, Daneshvari SF. Impact of predialysis care on clinical outcomes. Hemodial Int. 2003;7 : 338–41. doi: 10.1046/j.1492-7535.2003.00059.x 19379385
19. Yu Y-J, Wu I-W, Huang C-Y, Hsu K-H, Lee C-C, Sun C-Y, et al. Multidisciplinary predialysis education reduced the inpatient and total medical costs of the first 6 months of dialysis in incident hemodialysis patients. PLoS ONE. 2014;9:e112820. doi: 10.1371/journal.pone.0112820 25398129
20. Strand H, Parker D. Effects of multidisciplinary models of care for adult pre-dialysis patients with chronic kidney disease: a systematic review. Int J Evid Based Healthc. 2012;10 : 53–9. doi: 10.1111/j.1744-1609.2012.00253.x 22405416
21. Wang S-M, Hsiao L-C, Ting I-W, Yu T-M, Liang C-C, Kuo H-L, et al. Multidisciplinary care in patients with chronic kidney disease: a systematic review and meta-analysis. Eur J Intern Med. 2015;26 : 640–5. doi: 10.1016/j.ejim.2015.07.002 26186813
22. Gandjour A, Tschulena U, Steppan S, Gatti E. A simulation model to estimate cost-offsets for a disease-management program for chronic kidney disease. Expert Rev Pharmacoecon Outcomes Res. 2015;15 : 341–7. doi: 10.1586/14737167.2015.972375 25434825
23. Black C, Sharma P, Scotland G, McCullough K, McGurn D, Robertson L, et al. Early referral strategies for management of people with markers of renal disease: a systematic review of the evidence of clinical effectiveness, cost-effectiveness and economic analysis. Health Technol Assess. 2010;14 : 1–184. doi: 10.3310/hta14210 20441712
24. Eriksen BO, Ingebretsen OC. The progression of chronic kidney disease: a 10-year population-based study of the effects of gender and age. Kidney Int. 2006;69 : 375–82. doi: 10.1038/sj.ki.5000058 16408129
25. Lee CP, Chertow GM, Zenios SA. An empiric estimate of the value of life: updating the renal dialysis cost-effectiveness standard. Value Health. 2009;12 : 80–7. doi: 10.1111/j.1524-4733.2008.00401.x 19911442
26. Kurella M, Covinsky KE, Collins AJ, Chertow GM. Octogenarians and nonagenarians starting dialysis in the United States. Ann Intern Med. 2007;146 : 177–83. 17283348
27. Kurella Tamura M, Covinsky KE, Chertow GM, Yaffe K, Landefeld CS, McCulloch CE. Functional status of elderly adults before and after initiation of dialysis. N Engl J Med. 2009;361 : 1539–47. doi: 10.1056/NEJMoa0904655 19828531
28. Neumann PJ, Sanders GD, Basu A, Brock DW, Feeny D, Krahn M, et al. Recommendations on perspectives for the reference case. cost-effectiveness in health and medicine. 2nd edition. New York: Oxford University Press; 2017.
29. Sanders GD, Neumann PJ, Basu A, Brock DW, Feeny D, Krahn M, et al. Recommendations for conduct, methodological practices, and reporting of cost-effectiveness analyses: Second Panel on Cost-Effectiveness in Health and Medicine. JAMA. 2016;316 : 1093–103. doi: 10.1001/jama.2016.12195 27623463
30. Perkins RM, Bucaloiu ID, Kirchner HL, Ashouian N, Hartle JE, Yahya T. GFR decline and mortality risk among patients with chronic kidney disease. Clin J Am Soc Nephrol. 2011;6 : 1879–86. doi: 10.2215/CJN.00470111 21685022
31. Levin A, Djurdjev O, Beaulieu M, Er L. Variability and risk factors for kidney disease progression and death following attainment of stage 4 CKD in a referred cohort. Am J Kidney Dis. 2008;52 : 661–71. doi: 10.1053/j.ajkd.2008.06.023 18805347
32. Tangri N, Grams ME, Levey AS, Coresh J, Appel LJ, Astor BC, et al. Multinational assessment of accuracy of equations for predicting risk of kidney failure: a meta-analysis. JAMA. 2016;315 : 164–74. doi: 10.1001/jama.2015.18202 26757465
33. Hallan SI. International comparison of the relationship of chronic kidney disease prevalence and ESRD risk. J Am Soc Nephrol. 2006;17 : 2275–84. doi: 10.1681/ASN.2005121273 16790511
34. Cooper BA, Branley P, Bulfone L, Collins JF, Craig JC, Fraenkel MB, et al. A randomized, controlled trial of early versus late initiation of dialysis. N Engl J Med. 2010;363 : 609–19. doi: 10.1056/NEJMoa1000552 20581422
35. Arias E. United States life tables, 2011. Natl Vital Stat Rep. 2015;64 : 1–63. Available from: https://www.cdc.gov/nchs/data/nvsr/nvsr64/nvsr64_11.pdf.
36. United States Renal Data System. Annual data report 2105: epidemiology of kidney disease in the United States. Bethesda (MD): National Institutes of Health National Institute of Diabetes and Digestive and Kidney Diseases; 2015.
37. Department of Health and Human Services Centers for Medicare & Medicaid Services. Medicare program; revisions to payment policies under the physician fee schedule and other revisions to part B for CY 2017; Medicare advantage bid pricing data release; Medicare advantage and part D medical loss ratio data release; Medicare advantage provider network requirements; expansion of Medicare diabetes prevention program model; Medicare shared savings program requirements. Federal Register. 2016 Nov 15;81(220):80170–562. Available from: https://www.gpo.gov/fdsys/pkg/FR-2016-11-15/pdf/2016-26668.pdf. 27906531
38. Wyld M, Morton RL, Hayen A, Howard K, Webster AC. A systematic review and meta-analysis of utility-based quality of life in chronic kidney disease treatments. PLoS Med. 2012;9:e1001307. doi: 10.1371/journal.pmed.1001307 22984353
39. Nelder JA, Mead R. A simplex method for function minimization. Comput J. 1965;7 : 308–13. doi: 10.1093/comjnl/7.4.308
40. Bureau of Labor Statistics. CPI inflation calculator. Washington (DC): Bureau of Labor Statistics; 2018 [cited 2018 Feb 22]. Available from: http://data.bls.gov/cgi-bin/cpicalc.pl.
41. Chen PM, Lai TS, Chen PY, Lai CF, Yang SY, Wu V, et al. Multidisciplinary care program for advanced chronic kidney disease: reduces renal replacement and medical costs. Am J Med. 2015;128 : 68–76. doi: 10.1016/j.amjmed.2014.07.042 25149427
42. Goldstein M, Yassa T, Dacouris N, McFarlane P. Multidisciplinary predialysis care and morbidity and mortality of patients on dialysis. Am J Kidney Dis. 2004;44 : 706–14. 15384022
43. Fenton A, Sayar Z, Dodds A, Dasgupta I. Multidisciplinary care improves outcome of patients with stage 5 chronic kidney disease. Nephron Clin Pract. 2010;115:c283–8. doi: 10.1159/000313487 20424479
44. Rognant N, Alamartine E, Aldigier JC, Combe C, Vendrely B, Deteix P, et al. Impact of prior CKD management in a renal care network on early outcomes in incident dialysis patients: a prospective observational study. BMC Nephrol. 2013;14 : 41. doi: 10.1186/1471-2369-14-41 23425313
45. Wei S-Y, Chang Y-Y, Mau L-W, Lin M-Y, Chiu H-C, Tsai J-C, et al. Chronic kidney disease care program improves quality of pre-end-stage renal disease care and reduces medical costs. Nephrology (Carlton). 2010;15 : 108–115. doi: 10.1111/j.1440-1797.2009.01154.x 20377778
46. Hemmelgarn BR, Manns BJ, Zhang J, Tonelli M, Klarenbach S, Walsh M, et al. Association between multidisciplinary care and survival for elderly patients with chronic kidney disease. J Am Soc Nephrol JASN. 2007;18 : 993–999. doi: 10.1681/ASN.2006080860 17267742
47. Chen Y-R, Yang Y, Wang S-C, Chou W-Y, Chiu P-F, Lin C-Y, et al. Multidisciplinary care improves clinical outcome and reduces medical costs for pre-end-stage renal disease in Taiwan. Nephrology (Carlton). 2014;19 : 699–707. doi: 10.1111/nep.12316 25066407
48. Chen Y-R, Yang Y, Wang S-C, Chiu P-F, Chou W-Y, Lin C-Y, et al. Effectiveness of multidisciplinary care for chronic kidney disease in Taiwan: a 3-year prospective cohort study. Nephrol Dial Transplant. 2013;28 : 671–82. doi: 10.1093/ndt/gfs469 23223224
49. Ara R, Brazier J. Deriving an algorithm to convert the eight mean SF-36 dimension scores into a mean EQ-5D preference-based score from published studies (where patient level data are not available). Value Health. 2008;11 : 1131–43. doi: 10.1111/j.1524-4733.2008.00352.x 18489495
50. Lawrence WF, Fleishman JA. Predicting EuroQoL EQ-5D preference scores from the SF-12 Health Survey in a nationally representative sample. Med Decis Making. 2004;24 : 160–9. doi: 10.1177/0272989X04264015 15090102
51. Gorodetskaya I, Zenios S, McCulloch CE, Bostrom A, Hsu C-Y, Bindman AB, et al. Health-related quality of life and estimates of utility in chronic kidney disease. Kidney Int. 2005;68 : 2801–8. doi: 10.1111/j.1523-1755.2005.00752.x 16316356
52. Cruz MC, Andrade C, Urrutia M, Draibe S, Nogueira-Martins LA, Sesso Rde CC. Quality of life in patients with chronic kidney disease. Clinics (Sao Paulo). 2011;66 : 991–5.
53. Briggs AH. Handling uncertainty in economic evaluation and presenting the results. In: Drummond M, McGuire A, editors. Economic evaluation in health care: merging theory with practice. New York: Oxford University Press; 2001. pp. 172–214.
54. Goldhaber-Fiebert JD, Jalal HJ. Some health states are better than others: using health state rank order to improve probabilistic analyses. Med Decis Making. 2016;36 : 927–40. doi: 10.1177/0272989X15605091 26377369
55. Suen S, Goldhaber-Fiebert JD. An efficient, noniterative method of identifying the cost-effectiveness frontier. Med Decis Making. 2016;36 : 132–6. doi: 10.1177/0272989X15583496 25926282
56. Husereau D, Drummond M, Petrou S, Carswell C, Moher D, Greenberg D, et al. Consolidated Health Economic Evaluation Reporting Standards (CHEERS)—explanation and elaboration: a report of the ISPOR Health Economic Evaluation Publication Guidelines Good Reporting Practices Task Force. Value Health. 2013;16 : 231–50. doi: 10.1016/j.jval.2013.02.002 23538175
57. Kidney Disease: Improving Global Outcomes (KDIGO) Blood Pressure Work Group. KDIGO clinical practice guideline for the management of blood pressure in chronic kidney disease. Kidney Int Suppl. 2012;2 : 337–414.
58. James PA, Oparil S, Carter BL, Cushman WC, Dennison-Himmelfarb C, Handler J, et al. 2014 evidence-based guideline for the management of high blood pressure in adults: report from the panel members appointed to the Eighth Joint National Committee (JNC 8). JAMA. 2014;311 : 507–20. doi: 10.1001/jama.2013.284427 24352797
59. Kidney Disease: Improving Global Outcomes (KDIGO) Lipid Work Group. KDIGO clinical practice guideline for lipid management in chronic kidney disease. Kidney Int Suppl. 2013;3 : 259–305.
60. Kidney Disease: Improving Global Outcomes (KDIGO) CKD Work Group. KDIGO 2012 clinical practice guideline for the evaluation and management of chronic kidney disease. Kidney Int Suppl. 2013;3 : 1–150.
61. Muntner P, Judd SE, Krousel-Wood M, McClellan WM, Safford MM. Low medication adherence and hypertension control among adults with CKD: data from the REGARDS (Reasons for Geographic and Racial Differences in Stroke) Study. Am J Kidney Dis. 2010;56 : 447–57. doi: 10.1053/j.ajkd.2010.02.348 20471734
62. Rifkin DE, Laws MB, Rao M, Balakrishnan VS, Sarnak MJ, Wilson IB. Medication adherence behavior and priorities among older adults with CKD: a semistructured interview study. Am J Kidney Dis. 2010;56 : 439–46. doi: 10.1053/j.ajkd.2010.04.021 20674113
63. Gansevoort RT, Correa-Rotter R, Hemmelgarn BR, Jafar TH, Heerspink HJL, Mann JF, et al. Chronic kidney disease and cardiovascular risk: epidemiology, mechanisms, and prevention. Lancet. 2013;382 : 339–52. doi: 10.1016/S0140-6736(13)60595-4 23727170
64. American Academy of Family Physicians. FAQ on MACRA and Medicare payment reform. Leawood (KS): American Academy of Family Physicians; 2017 [cited 2017 May 4]. Available from: http://www.aafp.org/practice-management/payment/medicare-payment/faq.html.
65. Centers for Medicare & Medicaid Services. The quality payment program overview fact sheet. Baltimore: Centers for Medicare & Medicaid Services; 2016 [cited 2018 Feb 26]. Available from: http://www.cmanet.org/files/pdf/ces/macra-final-rule-fact-sheet.pdf.
66. Department of Health and Human Services Centers for Medicare & Medicaid Services. Medicare program; Merit-based Incentive Payment System (MIPS) and Alternative Payment Model (APM) incentive under the physician fee schedule, and criteria for physician-focused payment models. Federal Register. 2016 Nov 4;81(214):77008–831. Available from: https://www.gpo.gov/fdsys/pkg/FR-2016-11-04/pdf/2016-25240.pdf. 27905815
67. Jha V, Garcia-Garcia G, Iseki K, Li Z, Naicker S, Plattner B, et al. Chronic kidney disease: global dimension and perspectives. Lancet. 2013;382 : 260–72. doi: 10.1016/S0140-6736(13)60687-X 23727169
68. Hill NR, Fatoba ST, Oke JL, Hirst JA, O’Callaghan CA, Lasserson DS, et al. Global prevalence of chronic kidney disease—a systematic review and meta-analysis. PLoS ONE. 2016;11:e0158765. doi: 10.1371/journal.pone.0158765 27383068
69. Jha V, Wang AY-M, Wang H. The impact of CKD identification in large countries: the burden of illness. Nephrol Dial Transplant. 2012;27:iii32–8. doi: 10.1093/ndt/gfs113 23115140
70. Curtis BM, Barrett BJ, Djurdjev O, Singer J, Levin A. Evaluation and treatment of CKD patients before and at their first nephrologist encounter in Canada. Am J Kidney Dis. 2007;50 : 733–42. doi: 10.1053/j.ajkd.2007.08.004 17954286
71. Obrador GT, Rubilar X, Agazzi E, Estefan J. The challenge of providing renal replacement therapy in developing countries: the Latin American perspective. Am J Kidney Dis. 2016;67 : 499–506. doi: 10.1053/j.ajkd.2015.08.033 26709109
72. Aviles-Gomez R, Luquin-Arellano VH, Garcia-Garcia G, Ibarra-Hernandez M, Briseño-Renteria G. Is renal replacement therapy for all possible in developing countries? Ethn Dis. 2006;16(2 Suppl 2):S2-70–2.
73. Bruce MA, Beech BM, Crook ED, Sims M, Wyatt SB, Flessner MF, et al. Association of socioeconomic status and CKD among African Americans: the Jackson Heart Study. Am J Kidney Dis. 2010;55 : 1001–8. doi: 10.1053/j.ajkd.2010.01.016 20381223
74. Merkin SS, Diez Roux AV, Coresh J, Fried LF, Jackson SA, Powe NR. Individual and neighborhood socioeconomic status and progressive chronic kidney disease in an elderly population: the Cardiovascular Health Study. Soc Sci Med. 2007;65 : 809–21. doi: 10.1016/j.socscimed.2007.04.011 17499411
75. Norris K, Nissenson AR. Race, gender, and socioeconomic disparities in CKD in the United States. J Am Soc Nephrol. 2008;19 : 1261–70. doi: 10.1681/ASN.2008030276 18525000
Štítky
Interní lékařství
Článek vyšel v časopisePLOS Medicine
Nejčtenější tento týden
2018 Číslo 3- S prof. Vladimírem Paličkou o racionální suplementaci kalcia a vitaminu D v každodenní praxi
- S doc. Janou Hirmerovou o tromboprofylaxi v břišní či onkologické chirurgii a jak k ní správně přistupovat
- Open abdomen
- INTERAKTIVNÍ KAZUISTIKA: Žilní trombóza v graviditě
- Není statin jako statin aneb praktický přehled rozdílů jednotlivých molekul
-
Všechny články tohoto čísla
- What is the value of multidisciplinary care for chronic kidney disease?
- 2017 Reviewer and Editorial Board Thank You
- Delays in completion and results reporting of clinical trials under the Paediatric Regulation in the European Union: A cohort study
- Surveillance of antimicrobial consumption in animal production sectors of low- and middle-income countries: Optimizing use and addressing antimicrobial resistance
- Causes of death and infant mortality rates among full-term births in the United States between 2010 and 2012: An observational study
- Time for high-burden countries to lead the tuberculosis research agenda
- The importance and challenges of shared decision making in older people with multimorbidity
- Trajectories of functional decline in older adults with neuropsychiatric and cardiovascular multimorbidity: A Swedish cohort study
- Mortality, ethnicity, and country of birth on a national scale, 2001–2013: A retrospective cohort (Scottish Health and Ethnicity Linkage Study)
- Validation of a genetic risk score for atrial fibrillation: A prospective multicenter cohort study
- Multimorbidity and survival for patients with acute myocardial infarction in England and Wales: Latent class analysis of a nationwide population-based cohort
- Integration of postpartum healthcare services for HIV-infected women and their infants in South Africa: A randomised controlled trial
- Cost-effectiveness of multidisciplinary care in mild to moderate chronic kidney disease in the United States: A modeling study
- Role of heme in lung bacterial infection after trauma hemorrhage and stored red blood cell transfusion: A preclinical experimental study
- Patterns and temporal trends of comorbidity among adult patients with incident cardiovascular disease in the UK between 2000 and 2014: A population-based cohort study
- Global child and adolescent mental health: The orphan of development assistance for health
- Cardiovascular disease and multimorbidity: A call for interdisciplinary research and personalized cardiovascular care
- Forced anal examinations to ascertain sexual orientation and sexual behavior: An abusive and medically unsound practice
- Primary prevention of cardiovascular disease: The past, present, and future of blood pressure- and cholesterol-lowering treatments
- Physical activity levels in adults and older adults 3–4 years after pedometer-based walking interventions: Long-term follow-up of participants from two randomised controlled trials in UK primary care
- Effect and cost-effectiveness of educating mothers about childhood DPT vaccination on immunisation uptake, knowledge, and perceptions in Uttar Pradesh, India: A randomised controlled trial
- Comorbidity health pathways in heart failure patients: A sequences-of-regressions analysis using cross-sectional data from 10,575 patients in the Swedish Heart Failure Registry
- Multimorbidity in patients with heart failure from 11 Asian regions: A prospective cohort study using the ASIAN-HF registry
- Antiviral efficacy of favipiravir against Ebola virus: A translational study in cynomolgus macaques
- Transmission of HIV-1 drug resistance mutations within partner-pairs: A cross-sectional study of a primary HIV infection cohort
- A clinical decision support tool for improving adherence to guidelines on anticoagulant therapy in patients with atrial fibrillation at risk of stroke: A cluster-randomized trial in a Swedish primary care setting (the CDS-AF study)
- Integrating HIV and hypertension management in low-resource settings: Lessons from Malawi
- The epidemiology of adolescents living with perinatally acquired HIV: A cross-region global cohort analysis
- Polycystic ovary syndrome, androgen excess, and the risk of nonalcoholic fatty liver disease in women: A longitudinal study based on a United Kingdom primary care database
- Blood pressure-lowering treatment strategies based on cardiovascular risk versus blood pressure: A meta-analysis of individual participant data
- Cerebral white matter disease and functional decline in older adults from the Northern Manhattan Study: A longitudinal cohort study
- HIV treatment eligibility expansion and timely antiretroviral treatment initiation following enrollment in HIV care: A metaregression analysis of programmatic data from 22 countries
- The current and potential health benefits of the National Health Service Health Check cardiovascular disease prevention programme in England: A microsimulation study
- Cardiovascular disease: The rise of the genetic risk score
- Comparative analysis of the association between 35 frailty scores and cardiovascular events, cancer, and total mortality in an elderly general population in England: An observational study
- Progression of diabetes, heart disease, and stroke multimorbidity in middle-aged women: A 20-year cohort study
- PLOS Medicine
- Archiv čísel
- Aktuální číslo
- Informace o časopisu
Nejčtenější v tomto čísle- Forced anal examinations to ascertain sexual orientation and sexual behavior: An abusive and medically unsound practice
- Polycystic ovary syndrome, androgen excess, and the risk of nonalcoholic fatty liver disease in women: A longitudinal study based on a United Kingdom primary care database
- The current and potential health benefits of the National Health Service Health Check cardiovascular disease prevention programme in England: A microsimulation study
- Cardiovascular disease and multimorbidity: A call for interdisciplinary research and personalized cardiovascular care
Kurzy
Zvyšte si kvalifikaci online z pohodlí domova
Autoři: prof. MUDr. Vladimír Palička, CSc., Dr.h.c., doc. MUDr. Václav Vyskočil, Ph.D., MUDr. Petr Kasalický, CSc., MUDr. Jan Rosa, Ing. Pavel Havlík, Ing. Jan Adam, Hana Hejnová, DiS., Jana Křenková
Autoři: MUDr. Irena Krčmová, CSc.
Autoři: MDDr. Eleonóra Ivančová, PhD., MHA
Autoři: prof. MUDr. Eva Kubala Havrdová, DrSc.
Všechny kurzyPřihlášení#ADS_BOTTOM_SCRIPTS#Zapomenuté hesloZadejte e-mailovou adresu, se kterou jste vytvářel(a) účet, budou Vám na ni zaslány informace k nastavení nového hesla.
- Vzdělávání


