
Blood pressure-lowering treatment strategies based on cardiovascular risk versus blood pressure: A meta-analysis of individual participant data
In an individual participant data meta-analysis, Kazem Rahimi and colleagues compare blood pressure lowering treatment strategies based on cardiovascular risk versus blood pressure.
Published in the journal:
. PLoS Med 15(3): e32767. doi:10.1371/journal.pmed.1002538
Category:
Research Article
doi:
https://doi.org/10.1371/journal.pmed.1002538
Summary
In an individual participant data meta-analysis, Kazem Rahimi and colleagues compare blood pressure lowering treatment strategies based on cardiovascular risk versus blood pressure.
Introduction
Clinical practice guidelines for hypertension treatment have traditionally relied primarily on blood pressure levels to guide use of blood pressure-lowering medications [1–4]. However, single risk factor levels, like blood pressure, incompletely capture risk. Furthermore, blood pressure-lowering medications provide a fairly consistent relative risk reduction across a range of blood pressure levels, leading to large variations in absolute benefit from blood pressure treatment observed among individuals [5–7].
In contrast to hypertension guidelines, cholesterol treatment guidelines have moved away from single risk factor levels to guide treatment and instead advocate for multivariable absolute cardiovascular disease (CVD) risk assessment to guide treatment decision-making [8–10]. Updates to some cholesterol guidelines have moved even further by eliminating cholesterol goals altogether and identifying CVD risk thresholds to guide clinician–patient risk discussions about statin initiation in primary prevention [8,10].
Recently, an analysis from the Blood Pressure Lowering Treatment Trialists’ Collaboration (BPLTTC) demonstrated similar relative risk reductions from blood pressure-lowering medications across a range of predicted risk strata with correspondingly greater absolute risk reductions in those with higher predicted risk [11]. Those results provide support for the role of CVD risk assessment in guiding blood pressure-lowering treatment decisions. Although simulation studies have modeled the benefits of a CVD risk strategy for blood pressure-lowering treatment compared with traditional hypertension guidelines [12,13], to date, there has not been a direct comparison of the two strategies using clinical trial data with actual outcome events. Such evidence is needed to move CVD risk-based treatment strategies into clinical practice.
Individual participant data from trials in the BPLTTC provide an ideal opportunity to compare these two treatment strategies across a range of possible treatment thresholds in a group of individuals who were randomly assigned to blood pressure-lowering therapy in a clinical trial setting. In this study, we sought to compare outcomes using a treatment strategy based on predicted CVD risk (CVD risk strategy) with one based on systolic blood pressure (SBP) level (SBP strategy).
Methods
This analysis followed a prespecified protocol that was presented to the BPLTTC Steering committee in April 2013.
Trial eligibility and comparisons
This meta-analysis includes individual participant data from the BPLTTC from 1995 to 2013. Trials were eligible for this analysis if they met the original inclusion criteria for the Collaboration overviews and were part of the subset of trials that randomly allocated participants to blood pressure-lowering drug or placebo or to a more intensive versus less intensive blood pressure drug treatment regimen [14]. Eligible trials were also required to have a minimum of 1,000 patient years of planned follow-up in each randomized group and to have not presented their main results before the Collaboration protocol was finalized in July 1995 [14]. For this analysis, we analysed data from all eligible trials that provided sufficient information to enable absolute CVD risk estimation.
We included the following treatment comparisons: angiotensin-converting enzyme (ACE) inhibitors versus placebo; calcium channel blockers versus placebo; diuretics versus placebo; and more intensive versus less intensive blood pressure-lowering regimens (regardless of drug class). We combined these comparisons to maximize statistical power, since prior analyses have demonstrated that most of the treatment effects were dependent on the amount of blood pressure reduction achieved with few drug-specific effects [15].
Outcomes
We analyzed outcomes prespecified in the original BPLTTC protocol [14]. Our primary outcome was total major CVD events, defined as a composite of stroke (nonfatal stroke or death from cerebrovascular disease), coronary heart disease (nonfatal myocardial infarction or death from coronary heart disease, including sudden death), heart failure (causing death or resulting in admission to hospital), or CVD death.
Cardiovascular risk estimation
We used a multivariable Weibull model previously developed in this dataset from the placebo groups. This model uses age, sex, body mass index, systolic and diastolic blood pressure (DBP), prior blood pressure-lowering treatment, smoking status, diabetes mellitus status, and history of CVD to estimate 5-y CVD risk. Details of the derivation and validation of this model have been previously published [11].
Cardiovascular events avoided by treatment
To estimate the number of CVD events avoided by the CVD risk and SBP strategies, we ranked all eligible participants by decreasing levels of baseline CVD risk and then by decreasing levels of baseline SBP. Next, we considered a potential treatment threshold for each percentile of CVD risk or SBP observed in the dataset. For each strategy, we assumed that all participants with a level above a given threshold would be treated and everyone below would be untreated. We then noted the number of persons above the threshold (“N treated”) and the Kaplan-Meier estimated 5-y risks in the control groups above the threshold (“untreated 5-y risk”) at each percentile for each treatment strategy. In the subgroup of participants above the threshold, we calculated the relative risk reduction from blood pressure-lowering therapy. For that purpose, we used a one-step meta-analysis approach, fitting Weibull models with shared frailty for each trial, thereby preserving the randomized structure of the trials [16]. To estimate the risk among the treated (“treated 5-y risk”), we applied the obtained hazard ratios to the Kaplan–Meier 5-y risk among control group participants above the threshold using the following formula: treated 5-y risk = 1 − exp(hazard ratio * ln(1 − untreated 5-y risk)). We thereafter applied this to the total number of persons above the threshold to calculate the number of events avoided with 5 y of treatment: avoided events = n treated * (untreated 5-y risk − treated 5-y risk)).
The number of events avoided was graphically presented against the number and proportion of treated persons. We then calculated the areas under the curves to estimate treatment effectiveness (i.e., number of events avoided per persons treated) for each strategy, where greater area reflects more events avoided per persons treated. Areas were calculated as integrals using the trapezoidal rule and were expressed as the ratio of the obtained area to the maximum possible area (maximum number of cardiovascular events avoided multiplied by the maximum number of persons treated); treatment given at random to half the sample without consideration of any treatment thresholds corresponding to an area of 0.5. We used bias-corrected 95% bootstrap estimates from 10,000 repetitions to generate confidence intervals (CIs). We also calculated numbers needed to treat for 5 y to avoid 1 cardiovascular event as 1/(number of events avoided/number of treated persons for 5 y) at each threshold for each treatment strategy.
Secondary analyses
We evaluated the expected outcomes of each treatment strategy in subgroups based on presence or absence of previous blood pressure-lowering treatment, diabetes mellitus, and prevalent CVD. The risk equation was well calibrated in all subgroups (S1 Fig). In a 2-stage meta-analysis combining estimates in complementary pairs of subgroups, heterogeneity of results between subgroups was assessed using I2 with corresponding 95% CIs. To determine if any differences in cardiovascular events avoided were related to differences in magnitude of SBP reduction, we quantified mean observed SBP reduction with blood pressure-lowering treatment using a mixed-effects generalized linear model with the participant as the unit of analysis and a random intercept for trial. Using these estimates, we standardized hazard ratios for each threshold and for each treatment strategy to a 5 mmHg SBP reduction. Given the strong effect of age on 5-y predicted CVD risk, we performed a sensitivity analysis comparing the CVD risk strategy and SBP strategy with an age-based treatment strategy. For the age-based strategy, we ranked all eligible participants by decreasing levels of age in a manner similar to what was done for baseline SBP in the SBP strategy. Lastly, in a subsample without previous CVD, we performed a sensitivity analysis using the Framingham total CVD risk equation [17]. We recalibrated the published equation to the observed survival rates and risk factor levels (means and proportions) in the BPLTTC dataset, substituting body mass index when trials were missing lipid values.
We used Stata version 14 (Stata Corporation, College Station, TX, United States of America) for all analyses.
Results
Baseline characteristics
We included 11 trials consisting of 47,872 participants (35,671 participants without prevalent CVD) in our analysis (some trials were factorial or included more than two groups) (S5 Fig) [18–28]. Pooled baseline characteristics of participants are shown in Table 1. Mean systolic and DBP differences between the active/more intense treatment versus placebo/less intense treatment were 5.7/3.2 mmHg (95% CIs 5.5–6.0 mmHg and 3.0–3.3 mmHg, respectively). Baseline characteristics and achieved blood pressure reduction by trial are included in Table 2 and S1 Table.


Cardiovascular events avoided with treatment
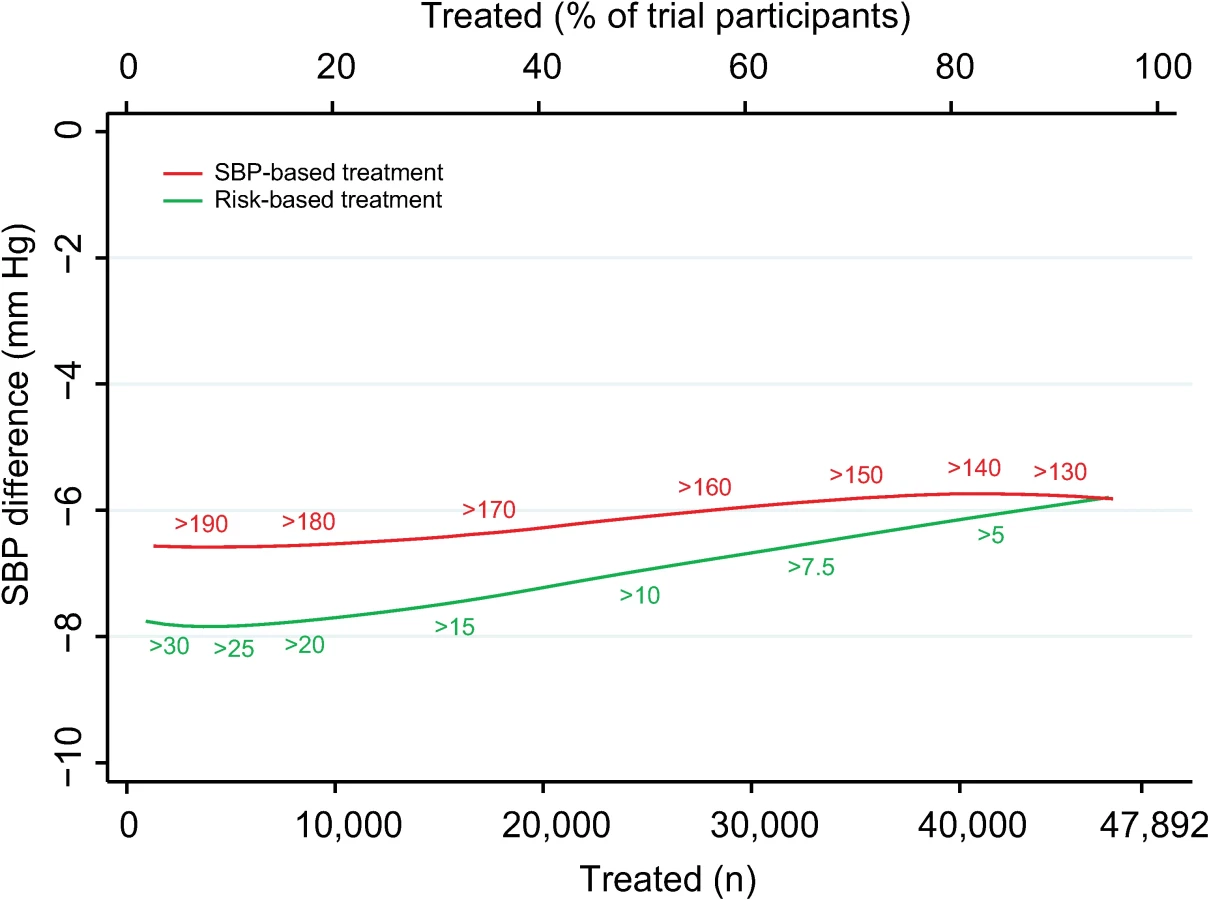
There were 3,566 (7.5%) participants who experienced an incident CVD event during a median follow-up of 4.0 y (IQR 1.0, S2 Table). We estimated the number of CVD events avoided over 5 y per person treated according to a CVD risk strategy compared with an SBP strategy (Fig 1). The CVD risk strategy would result in a greater number of events avoided per person treated compared with the SBP strategy. Similarly, for a given number of cardiovascular events avoided, a smaller proportion of the sample is treated using a CVD risk strategy compared with the SBP strategy. Areas under the curve comparing the two treatment strategies throughout the range of possible thresholds for CVD risk and SBP demonstrated that, on average, a greater number of CVD events would be avoided for a given number of persons treated with the CVD risk strategy compared with the SBP strategy (area under the curve 0.71 [95% CI 0.70–0.72] for the CVD risk strategy versus 0.54 [95% CI 0.53–0.55] for the SBP strategy) (Fig 1).

The number needed to treat for 5 y to prevent 1 CVD event was lower with the CVD risk strategy across a broad range of thresholds until overlapping with the SBP strategy at the 80th percentile treatment rate (Fig 2). Hence, the CVD risk strategy was superior to the SBP strategy in terms of identifying the persons with the highest absolute treatment benefit across a broad range of plausible treatment thresholds.

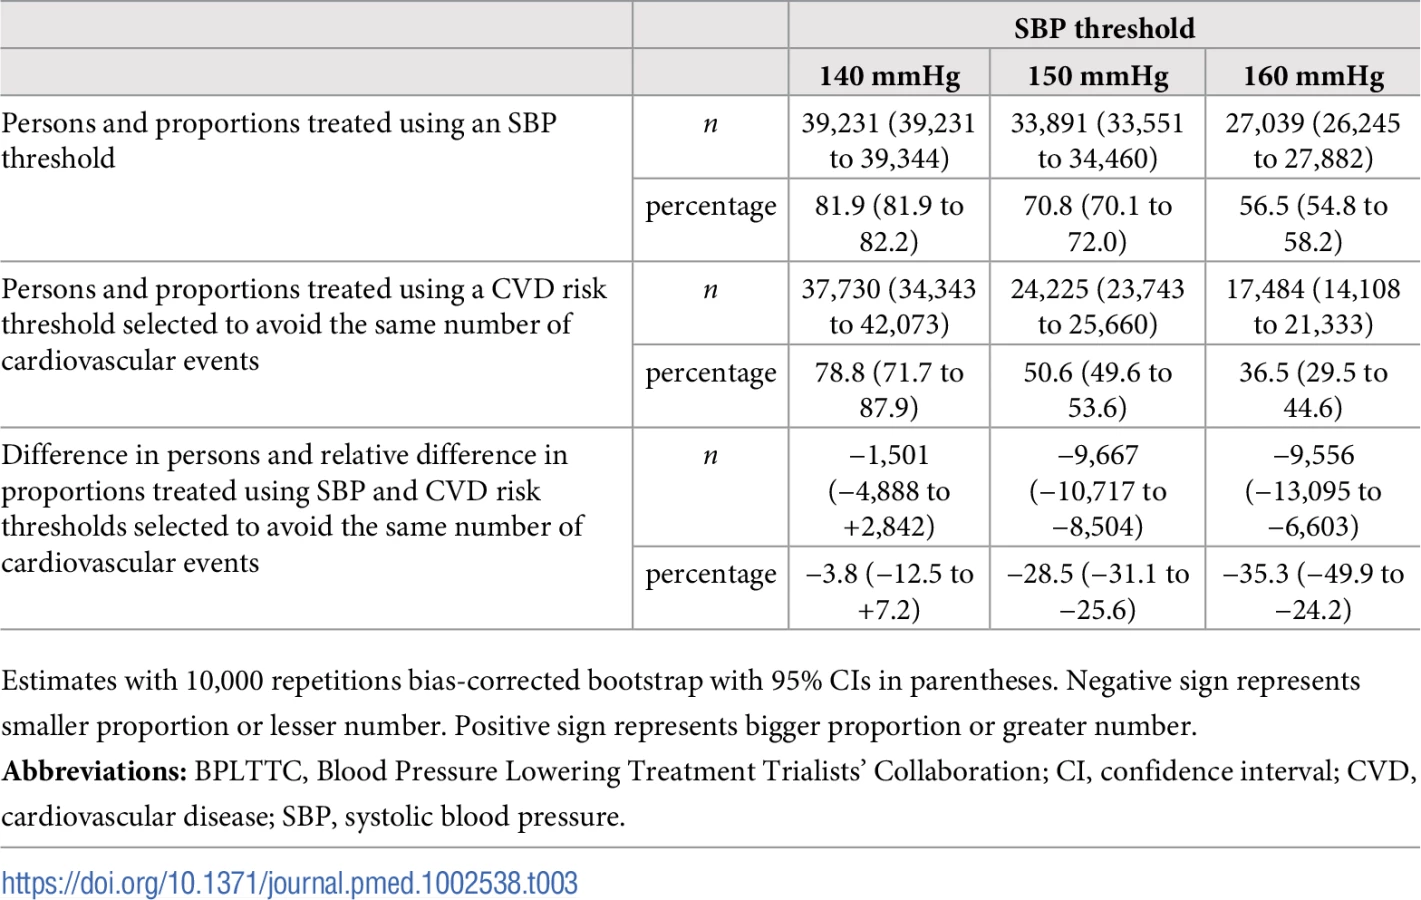
More specifically, we selected three commonly proposed SBP treatment thresholds for direct comparison with the CVD risk strategy (Tables 3 and 4). Compared with treatment at an SBP threshold of 150 mmHg, a CVD risk threshold would require the treatment of 29% (95% CI 26%–31%) fewer individuals to prevent the same number of CVD events (Table 3). Alternatively, it could prevent 16% (95% CI 14%–18%) more CVD events for the same number of persons treated (Table 4). Similarly, compared with an SBP threshold of 160 mmHg, using a CVD risk threshold would require treatment of 35% (95% CI 50%–24%) fewer persons to prevent the same number of CVD events, or it could prevent 38% (95% CI 29%–40%) more CVD events for the same number of treated persons. Results at an SBP threshold of 140 mmHg were imprecise due to the nature of our comparisons. At this threshold, the CVD risk strategy would prevent 3% (95% CI 1.5%–5%) more CVD events for the same number of persons treated and require 3.8% fewer (12.5% fewer to 7.2% more) persons to be treated for the same number of events prevented, although this result was not statistically significant.

Secondary analyses
Results were similar in subgroups with and without prior blood pressure-lowering medication use, without diabetes mellitus, and without prevalent CVD (Fig 3). For those with baseline diabetes mellitus, the CVD risk strategy did not appear to be superior, while for those with prior CVD, the SBP strategy appeared to be best (Fig 3).

Mean achieved SBP reductions and observed relative risk reductions for both the SBP strategy and CVD risk strategy were similar across the range of possible CVD risk and SBP thresholds (Fig 4 and Fig 5).

Results were similar for analyses standardized to a 5-mmHg SBP reduction (S2 Fig and S3 Fig), but differences were smaller. Furthermore, analyses comparing the two treatment strategies with an age-based treatment strategy confirmed that the CVD risk strategy remained superior in terms of events avoided per person treated compared with the SBP strategy (difference in areas under the curves 0.17 [95% CI 0.15–0.19]) and age-based strategy (difference in areas under the curves 0.13 [95% CI 0.09–0.14]) (S4 Fig).
For analyses using the Framingham total CVD risk equation, a greater number of CVD events would be avoided for a given number of persons treated with the CVD risk strategy compared with the SBP strategy (area under the curve 0.66 [95% CI 0.65–0.72] for CVD risk strategy versus 0.59 [95% CI 0.57–0.61] for the SBP strategy), although differences were smaller than in analyses using the internally derived risk prediction equation.
Discussion
This analysis of nearly 50,000 persons studied in clinical trials demonstrated that a blood pressure-lowering treatment strategy based on predicted CVD risk could prevent more events for the same number of persons treated compared with a strategy based on SBP levels. The benefit of the CVD risk strategy was particularly evident at higher SBP thresholds and for persons without prevalent CVD or diabetes mellitus.
The superiority of the CVD risk strategy relative to the SBP strategy can be explained by recent lessons from blood pressure epidemiology. First, the relative treatment benefit from blood pressure-lowering medications is fairly consistent across different blood pressure levels, including nonhypertensive levels [6,7]. Second, the absolute risk of an individual at a given blood pressure level can vary as much as 20-fold based on the presence of other vascular risk factors such as age, sex, dyslipidemia, and diabetes mellitus [5,29]. Third, a previous meta-analysis of individual participant data from the BPLTTC has shown that the relative benefit from blood pressure-lowering treatment is similar across risk strata and that, therefore, the absolute benefit from blood pressure-lowering treatment is greater in those with higher risk [11]. Therefore, the expected absolute risk reduction achieved with blood pressure-lowering treatment is better determined by the combination of risk factors contributing to CVD risk rather than an isolated blood pressure level. In the present study, we quantified the benefits of such a risk-based strategy and determined which groups of patients might experience those benefits.
Indirect comparisons of CVD risk and SBP treatment strategies have previously been performed using observational cohorts and modeled treatment effects. These analyses suggest that treatment strategies based on absolute risk could prevent more cardiovascular events, save more quality-adjusted life-years, use fewer medications, and lower overall costs compared with treatment based on blood pressure level [12,13,30,31]. Our results confirm, quantify, and extend these findings in a large group of persons who actually received blood pressure-lowering medications in randomized clinical trials across a broad range of CVD risk and SBP levels.
It should be noted that this is a proof-of-principle study. The results of the two strategies will, by design, appear to converge at the upper and lower ends of the CVD risk and SBP distributions that are determined by the composition of this sample and findings at the ends of the distributions are uncertain. Therefore, although the results of the present study illustrate the principle that a CVD risk strategy outperforms an SBP strategy over a broad range of SBPs and CVD risks, there is a need for further studies elucidating the differences between these two strategies at the lower ends of the blood pressure and CVD risk distributions, particularly because these are values that are taken into consideration when discussing thresholds for therapeutic intervention. The Systolic Blood Pressure Intervention Trial (SPRINT) and the Heart Outcomes Prevention Evaluation-3 (HOPE-3) study provide data that complement our analyses and support these results [32,33]. In SPRINT, blood pressure reduction in a high-risk group (annual event rate of 2.2%/y) below conventional targets led to a 25% reduction in cardiovascular events and a 27% reduction in all-cause deaths [32]. In contrast, HOPE-3 did not demonstrate a cardiovascular benefit from blood pressure reduction in a lower-risk group (annual event rate 0.8%/y) where the majority of participants had SBP below conventional targets [33].
In subgroup analyses, we found no evidence of a benefit for a CVD risk strategy compared with SBP strategy in patients with diabetes mellitus or existing CVD. This may reflect that “high risk” is already captured in these groups, independent of the predicted CVD risk estimate. In addition, the relatively weaker performance of CVD risk prediction among persons with existing CVD could also be explained by phenomena like index event bias [34] or observations that consequences of a cardiovascular event are often stronger predictors of a subsequent event than traditional risk factors [35–37]. Given the more uniformly high-risk status of persons with prevalent CVD or diabetes mellitus, a “treat-all” strategy may be better than selective treatment based on predicted CVD risk or blood pressure level. Thus, utilizing predicted CVD risk to guide treatment decisions may be best suited in primary prevention for individuals without diabetes mellitus or CVD where baseline risks and expected benefits from blood pressure-lowering treatment are more heterogeneous. This study, therefore, provides clinical guidance for treatment decisions in a broad segment of the general population.
Clinical implications
Our results support the use of absolute risk assessment in guiding blood pressure-lowering treatment decisions. Although risk-based treatment has been a cornerstone of cholesterol management [9,10], blood pressure treatment guidelines like those from the US have historically emphasized blood pressure thresholds and targets [1,38]. The present study challenges this paradigm and instead highlights the merits of using predicted CVD risk to guide intensity of blood pressure-lowering with medications, a framework recently embraced by the 2017 American College of Cardiology (ACC)/American Heart Association (AHA) Hypertension guidelines [39]. The limited trial experience with treatment to SBP below 120 mmHg necessarily limits the scope of an entirely risk-based treatment strategy. Nevertheless, our results support the principle that treatment decisions that are based on absolute CVD risk compared with blood pressure alone are superior for identifying persons with the highest expected benefit from blood pressure-lowering treatment, especially in primary prevention. This assessment can form the basis for a shared clinician–patient discussion to contextualize expected benefits and harms of blood pressure treatment with individual values and preferences to personalize treatment decisions.
Strengths and limitations
A key strength of this analysis is the use of a high-quality dataset of persons who were actually treated with blood pressure-lowering medications as part of a randomized clinical trial with rigorous follow-up and adjudicated outcomes (S5 Fig). Furthermore, our calculation of relative risk reductions from blood pressure-lowering treatment at each potential threshold preserves the randomized structure of the trials and maximizes the information within this dataset. There are, however, important limitations to acknowledge in this analysis. First, most trial participants were hypertensive at baseline, were receiving background blood pressure-lowering therapy, and had an estimated 5-y CVD risk greater than 5%. Therefore, the majority of the difference between the two strategies was seen among participants with SBP 150 to 170 mmHg or 5-y CVD risk 7.5% to 15%. As such, we were unable to detect a difference between the two treatment strategies at a 5-y CVD risk level of less than 5% or at an SBP threshold of 140 mmHg. The inability of this method to provide information at the ends of the risk and blood pressure distributions motivates future studies in other samples that include individuals with lower blood pressures or risk. Second, trials were of relatively short duration, and therefore, these results do not account for the potential long-term benefits (or harms) of sustained blood pressure management over the course of a lifetime [40]. Third, the utility of a CVD risk strategy depends on the performance of the prediction algorithm employed. For this study, we chose a previously validated, internally derived prediction algorithm to optimize model performance. Thus, these results have high internal but unknown external validity. To account for this limitation, we performed sensitivity analyses using the Framingham total CVD risk equation. The results, while qualitatively similar, had a lower area under the curve, suggesting worse performance of the CVD risk strategy using an externally derived prediction algorithm. It should be noted that modifying the used risk equation to prediction of 10 - instead of 5-y risks would yield the same ranking of participants and hence produce the same relative results. Finally, this is a post-hoc analysis of data from clinical trials that had different objectives and entry criteria and with numerical results driven by the composition of the study sample. Therefore, prospective validation in a new trial would be the ideal way to confirm our findings, but given the large number of participants required, such a trial is unlikely to be performed. These limits notwithstanding, these results should serve as a proof of principle of the relative merits of a CVD risk blood pressure treatment strategy in a high-quality dataset of persons treated with blood pressure-lowering medications.
Conclusion
In conclusion, this individual participant data analysis of blood pressure-lowering trial participants supports the principle that a treatment strategy based on predicted CVD risk, compared with one based on SBP levels, would result in prevention of more cardiovascular events for the same number of treated persons across a wide range of potential treatment thresholds. These results support use of cardiovascular risk assessment to guide blood pressure-lowering treatment decision-making in moderate - to high-risk individuals, especially in primary prevention settings.
Supporting Information
Zdroje
1. James PA, Oparil S, Carter BL, Cushman WC, Dennison-Himmelfarb C, Handler J, et al. 2014 evidence-based guideline for the management of high blood pressure in adults: report from the panel members appointed to the Eighth Joint National Committee (JNC 8). JAMA. 2014;311(5):507–20. Epub 2013/12/20. doi: 10.1001/jama.2013.284427 24352797.
2. Krause T, Lovibond K, Caulfield M, McCormack T, Williams B. Management of hypertension: summary of NICE guidance. BMJ. 2011;343:d4891. Epub 2011/08/27. doi: 10.1136/bmj.d4891 21868454.
3. Weber MA, Schiffrin EL, White WB, Mann S, Lindholm LH, Kenerson JG, et al. Clinical practice guidelines for the management of hypertension in the community: a statement by the American Society of Hypertension and the International Society of Hypertension. J Clin Hypertens (Greenwich). 2014;16(1):14–26. Epub 2013/12/18. doi: 10.1111/jch.12237 24341872.
4. Mancia G, Fagard R, Narkiewicz K, Redon J, Zanchetti A, Bohm M, et al. 2013 ESH/ESC guidelines for the management of arterial hypertension: the Task Force for the Management of Arterial Hypertension of the European Society of Hypertension (ESH) and of the European Society of Cardiology (ESC). Eur Heart J. 2013;34(28):2159–219. Epub 2013/06/19. doi: 10.1093/eurheartj/eht151 23771844.
5. Jackson R, Lawes CM, Bennett DA, Milne RJ, Rodgers A. Treatment with drugs to lower blood pressure and blood cholesterol based on an individual's absolute cardiovascular risk. Lancet. 2005;365(9457):434–41. Epub 2005/02/01. doi: 10.1016/S0140-6736(05)17833-7 15680460.
6. Ettehad D, Emdin CA, Kiran A, Anderson SG, Callender T, Emberson J, et al. Blood pressure lowering for prevention of cardiovascular disease and death: a systematic review and meta-analysis. Lancet. 2016;387(10022):957–67. Epub 2016/01/03. doi: 10.1016/S0140-6736(15)01225-8 26724178.
7. Thomopoulos C, Parati G, Zanchetti A. Effects of blood pressure lowering on outcome incidence in hypertension: 3. Effects in patients at different levels of cardiovascular risk—overview and meta-analyses of randomized trials. J Hypertens. 2014;32(12):2305–14. Epub 2014/09/27. doi: 10.1097/HJH.0000000000000380 25259548.
8. Joint British Societies' consensus recommendations for the prevention of cardiovascular disease (JBS3). Heart. 2014;100 Suppl 2:ii1–ii67. Epub 2014/03/29. doi: 10.1136/heartjnl-2014-305693 24667225.
9. Catapano AL, Graham I, De Backer G, Wiklund O, Chapman MJ, Drexel H, et al. 2016 ESC/EAS Guidelines for the Management of Dyslipidaemias. Eur Heart J. 2016;37(39):2999–3058. Epub 2016/08/28. doi: 10.1093/eurheartj/ehw272 27567407.
10. Stone NJ, Robinson JG, Lichtenstein AH, Bairey Merz CN, Blum CB, Eckel RH, et al. 2013 ACC/AHA guideline on the treatment of blood cholesterol to reduce atherosclerotic cardiovascular risk in adults: a report of the American College of Cardiology/American Heart Association Task Force on Practice Guidelines. Circulation. 2014;129(25 Suppl 2):S1–45. Epub 2013/11/14. doi: 10.1161/01.cir.0000437738.63853.7a 24222016.
11. Sundstrom J, Arima H, Woodward M, Jackson R, Karmali K, Lloyd-Jones D, et al. Blood pressure-lowering treatment based on cardiovascular risk: a meta-analysis of individual patient data. Lancet. 2014;384(9943):591–8. Epub 2014/08/19. doi: 10.1016/S0140-6736(14)61212-5 25131978.
12. Eddy DM, Adler J, Patterson B, Lucas D, Smith KA, Morris M. Individualized guidelines: the potential for increasing quality and reducing costs. Ann Intern Med. 2011;154(9):627–34. Epub 2011/05/04. doi: 10.7326/0003-4819-154-9-201105030-00008 21536939.
13. Sussman J, Vijan S, Hayward R. Using benefit-based tailored treatment to improve the use of antihypertensive medications. Circulation. 2013;128(21):2309–17. Epub 2013/11/06. doi: 10.1161/CIRCULATIONAHA.113.002290 24190955; PubMed Central PMCID: PMCPmc4026201.
14. Protocol for prospective collaborative overviews of major randomized trials of blood-pressure-lowering treatments. World Health Organization-International Society of Hypertension Blood Pressure Lowering Treatment Trialists' Collaboration. J Hypertens. 1998;16(2):127–37. Epub 1998/04/16. 9535138.
15. Neal B, MacMahon S, Chapman N. Effects of ACE inhibitors, calcium antagonists, and other blood-pressure-lowering drugs: results of prospectively designed overviews of randomised trials. Blood Pressure Lowering Treatment Trialists' Collaboration. Lancet. 2000;356(9246):1955–64. Epub 2000/12/29. 11130523.
16. Reilly BM, Evans AT. Translating clinical research into clinical practice: impact of using prediction rules to make decisions. Ann Intern Med. 2006;144(3):201–9. Epub 2006/02/08. 16461965.
17. D'Agostino RB Sr., Vasan RS, Pencina MJ, Wolf PA, Cobain M, Massaro JM, et al. General cardiovascular risk profile for use in primary care: the Framingham Heart Study. Circulation. 2008;117(6):743–53. Epub 2008/01/24. doi: 10.1161/CIRCULATIONAHA.107.699579 18212285.
18. Estacio RO, Jeffers BW, Hiatt WR, Biggerstaff SL, Gifford N, Schrier RW. The effect of nisoldipine as compared with enalapril on cardiovascular outcomes in patients with non-insulin-dependent diabetes and hypertension. N Engl J Med. 1998;338(10):645–52. Epub 1998/03/05. doi: 10.1056/NEJM199803053381003 9486993.
19. Schrier RW, Estacio RO, Esler A, Mehler P. Effects of aggressive blood pressure control in normotensive type 2 diabetic patients on albuminuria, retinopathy and strokes. Kidney Int. 2002;61(3):1086–97. Epub 2002/02/19. doi: 10.1046/j.1523-1755.2002.00213.x 11849464.
20. Ruggenenti P, Fassi A, Ilieva AP, Bruno S, Iliev IP, Brusegan V, et al. Preventing microalbuminuria in type 2 diabetes. N Engl J Med. 2004;351(19):1941–51. Epub 2004/11/02. doi: 10.1056/NEJMoa042167 15516697.
21. Hansson L, Zanchetti A, Carruthers SG, Dahlof B, Elmfeldt D, Julius S, et al. Effects of intensive blood-pressure lowering and low-dose aspirin in patients with hypertension: principal results of the Hypertension Optimal Treatment (HOT) randomised trial. HOT Study Group. Lancet. 1998;351(9118):1755–62. 9635947.
22. Beckett NS, Peters R, Fletcher AE, Staessen JA, Liu L, Dumitrascu D, et al. Treatment of hypertension in patients 80 years of age or older. N Engl J Med. 2008;358(18):1887–98. Epub 2008/04/02. doi: 10.1056/NEJMoa0801369 18378519.
23. MacMahon S, Sharpe N, Gamble G, Clague A, Mhurchu CN, Clark T, et al. Randomized, placebo-controlled trial of the angiotensin-converting enzyme inhibitor, ramipril, in patients with coronary or other occlusive arterial disease. PART-2 Collaborative Research Group. Prevention of Atherosclerosis with Ramipril. J Am Coll Cardiol. 2000;36(2):438–43. Epub 2000/08/10. 10933355.
24. Pitt B, Byington RP, Furberg CD, Hunninghake DB, Mancini GB, Miller ME, et al. Effect of amlodipine on the progression of atherosclerosis and the occurrence of clinical events. PREVENT Investigators. Circulation. 2000;102(13):1503–10. Epub 2000/09/27. 11004140.
25. Randomised trial of a perindopril-based blood-pressure-lowering regimen among 6,105 individuals with previous stroke or transient ischaemic attack. Lancet. 2001;358(9287):1033–41. Epub 2001/10/09. doi: 10.1016/S0140-6736(01)06178-5 11589932.
26. Patel A, MacMahon S, Chalmers J, Neal B, Woodward M, Billot L, et al. Effects of a fixed combination of perindopril and indapamide on macrovascular and microvascular outcomes in patients with type 2 diabetes mellitus (the ADVANCE trial): a randomised controlled trial. Lancet. 2007;370(9590):829–40. Epub 2007/09/04. doi: 10.1016/S0140-6736(07)61303-8 17765963.
27. Teo KK, Burton JR, Buller CE, Plante S, Catellier D, Tymchak W, et al. Long-term effects of cholesterol lowering and angiotensin-converting enzyme inhibition on coronary atherosclerosis: The Simvastatin/Enalapril Coronary Atherosclerosis Trial (SCAT). Circulation. 2000;102(15):1748–54. Epub 2000/10/12. 11023927.
28. Staessen JA, Fagard R, Thijs L, Celis H, Arabidze GG, Birkenhager WH, et al. Randomised double-blind comparison of placebo and active treatment for older patients with isolated systolic hypertension. The Systolic Hypertension in Europe (Syst-Eur) Trial Investigators. Lancet. 1997;350(9080):757–64. Epub 1997/09/23. 9297994.
29. Anderson KM, Odell PM, Wilson PW, Kannel WB. Cardiovascular disease risk profiles. Am Heart J. 1991;121(1 Pt 2):293–8. Epub 1991/01/01. 1985385.
30. Gaziano TA, Steyn K, Cohen DJ, Weinstein MC, Opie LH. Cost-effectiveness analysis of hypertension guidelines in South Africa: absolute risk versus blood pressure level. Circulation. 2005;112(23):3569–76. Epub 2005/12/07. doi: 10.1161/CIRCULATIONAHA.105.535922 16330698.
31. Montgomery AA, Fahey T, Ben-Shlomo Y, Harding J. The influence of absolute cardiovascular risk, patient utilities, and costs on the decision to treat hypertension: a Markov decision analysis. J Hypertens. 2003;21(9):1753–9. Epub 2003/08/19. doi: 10.1097/01.hjh.0000084708.87421.d1 12923409.
32. Wright JT Jr., Williamson JD, Whelton PK, Snyder JK, Sink KM, Rocco MV, et al. A Randomized Trial of Intensive versus Standard Blood-Pressure Control. N Engl J Med. 2015;373(22):2103–16. Epub 2015/11/10. doi: 10.1056/NEJMoa1511939 26551272; PubMed Central PMCID: PMCPMC4689591.
33. Lonn EM, Bosch J, Lopez-Jaramillo P, Zhu J, Liu L, Pais P, et al. Blood-Pressure Lowering in Intermediate-Risk Persons without Cardiovascular Disease. N Engl J Med. 2016;374(21):2009–20. Epub 2016/04/05. doi: 10.1056/NEJMoa1600175 27041480.
34. Dahabreh IJ, Kent DM. Index event bias as an explanation for the paradoxes of recurrence risk research. JAMA. 2011;305(8):822–3. Epub 2011/02/24. doi: 10.1001/jama.2011.163 21343582; PubMed Central PMCID: PMCPmc4115579.
35. Clayton TC, Lubsen J, Pocock SJ, Voko Z, Kirwan BA, Fox KA, et al. Risk score for predicting death, myocardial infarction, and stroke in patients with stable angina, based on a large randomised trial cohort of patients. BMJ. 2005;331(7521):869. Epub 2005/10/08. doi: 10.1136/bmj.38603.656076.63 16210253; PubMed Central PMCID: PMCPmc1255789.
36. Dorresteijn JA, Visseren FL, Wassink AM, Gondrie MJ, Steyerberg EW, Ridker PM, et al. Development and validation of a prediction rule for recurrent vascular events based on a cohort study of patients with arterial disease: the SMART risk score. Heart. 2013;99(12):866–72. Epub 2013/04/12. doi: 10.1136/heartjnl-2013-303640 23574971.
37. Bhatt DL, Eagle KA, Ohman EM, Hirsch AT, Goto S, Mahoney EM, et al. Comparative determinants of 4-year cardiovascular event rates in stable outpatients at risk of or with atherothrombosis. JAMA. 2010;304(12):1350–7. Epub 2010/09/02. doi: 10.1001/jama.2010.1322 20805624.
38. Chobanian AV, Bakris GL, Black HR, Cushman WC, Green LA, Izzo JL Jr., et al. The Seventh Report of the Joint National Committee on Prevention, Detection, Evaluation, and Treatment of High Blood Pressure: the JNC 7 report. JAMA. 2003;289(19):2560–72. Epub 2003/05/16. doi: 10.1001/jama.289.19.2560 12748199.
39. Whelton PK, Carey RM, Aronow WS, Casey DE Jr., Collins KJ, Dennison Himmelfarb C, et al. 2017 ACC/AHA/AAPA/ABC/ACPM/AGS/APhA/ASH/ASPC/NMA/PCNA Guideline for the Prevention, Detection, Evaluation, and Management of High Blood Pressure in Adults: A Report of the American College of Cardiology/American Heart Association Task Force on Clinical Practice Guidelines. Hypertension. 2017;Epub ahead of print. Epub 2017/11/15. doi: 10.1161/hyp.0000000000000065 29133356.
40. Allen N, Berry JD, Ning H, Van Horn L, Dyer A, Lloyd-Jones DM. Impact of blood pressure and blood pressure change during middle age on the remaining lifetime risk for cardiovascular disease: the cardiovascular lifetime risk pooling project. Circulation. 2012;125(1):37–44. Epub 2011/12/21. doi: 10.1161/CIRCULATIONAHA.110.002774 22184621; PubMed Central PMCID: PMCPmc3310202.
Štítky
Interní lékařstvíČlánek vyšel v časopise
PLOS Medicine
2018 Číslo 3
- Srovnání vlivu omeprazolu a pantoprazolu na antiagregační účinek klopidogrelu
- Fixní kombinace kandesartan/amlodipin v terapii arteriální hypertenze
- Současné postavení a přínos sartanů v klinické praxi
- Prognostický význam hladiny natriuretických peptidů při léčbě empagliflozinem
- Hypertrofická obstrukční kardiomyopatie ve světle moderní farmakoterapie – kazuistika
Nejčtenější v tomto čísle
- Forced anal examinations to ascertain sexual orientation and sexual behavior: An abusive and medically unsound practice
- Polycystic ovary syndrome, androgen excess, and the risk of nonalcoholic fatty liver disease in women: A longitudinal study based on a United Kingdom primary care database
- The current and potential health benefits of the National Health Service Health Check cardiovascular disease prevention programme in England: A microsimulation study
- Cardiovascular disease and multimorbidity: A call for interdisciplinary research and personalized cardiovascular care
Zvyšte si kvalifikaci online z pohodlí domova
Mazová zátka a její řešení
nový kurzVšechny kurzy