
Cerebral white matter disease and functional decline in older adults from the Northern Manhattan Study: A longitudinal cohort study
Using data from the Northern Manhattan Study, Mandip and colleagues examine the association between cerebral white matter disease and functional decline in older adults.
Published in the journal:
. PLoS Med 15(3): e32767. doi:10.1371/journal.pmed.1002529
Category:
Research Article
doi:
https://doi.org/10.1371/journal.pmed.1002529
Summary
Using data from the Northern Manhattan Study, Mandip and colleagues examine the association between cerebral white matter disease and functional decline in older adults.
Introduction
Functional status reflects performance in activities of daily living (ADLs) and instrumental ADLs, which are outcomes that are of primary importance to elderly patients and funding agencies. Although the determinants of functional status among the elderly have been extensively studied, there is a relative lack of understanding about the influence of subclinical cerebrovascular disease on the course of functional status over years. In particular, there is little data regarding the time course of change in functional trajectories in relation to white matter hyperintensities (WMHs) and the specific aspects of function that are compromised by white matter disease. Also, few studies have accounted for the effects of clinically evident vascular events intervening during follow-up in a reliable manner.
Cerebral white matter lesions likely represent white matter structural damage due to vascular disease. WMHs are most probably caused by traditional vascular risk factors [1], and they have been associated with vascular outcomes, including stroke [2] and mortality [3], as well as cognitive impairment [4] and functional impairment [5–8]. In a prior cross-sectional analysis in the Northern Manhattan Study (NOMAS) [9], higher whole brain white matter hyperintensity volume (WMHV) was associated with poorer episodic memory, processing speed, and semantic memory. In a prior longitudinal analysis in NOMAS, we found that asymmetry of WMHV was independently associated with long-term functional decline [10]. In this study, we hypothesized that whole brain WMHV was independently associated with worse baseline functional status and slope of change over time in those free of stroke at baseline. There are several novel approaches of this analysis. First, we estimated 2 components of functional trajectories: baseline function and change over time. Estimating trajectories may reveal courses of change and specific predictors that are not captured with crude analysis of change over 2 time points. Also, we analyzed the components of function using subdomains of a functional scale.
Methods
The NOMAS MRI study is a substudy of the NOMAS prospective cohort [11] that began in 2003 and included 1,290 individuals who were: 1) of an age ≥50 years, 2) without contraindications to MRI, 3) without clinical stroke, and 4) able to provide written informed consent. Imaging was performed on a 1.5T MRI system (Philips Medical Systems, Best, Netherlands) and included axial T1, axial T2, and Fluid Attenuated Inversion Recovery sequences. An operator traced dura mater, and non-brain structures were manually removed from images. Using a custom-designed image analysis package, modeling of pixel-intensity histograms for cerebral spinal fluid (CSF) and brain white and gray matter was performed. Semiautomated measurements of pixel distributions were made to identify the optimal pixel-intensity threshold to distinguish CSF from brain matter. Total cranial volume (TCV) constituted the sum of whole brain volume voxels from the T1 segmentation process. Whole brain WMHV was calculated as the sum of voxels ≥3.5 standard deviations (SD) above mean image intensity multiplied by pixel dimensions and section thickness [9]. WMHV was divided by TCV, multiplied by 100 to yield percent TCV, subtracted from the mean, and divided by the SD. Subclinical brain infarcts (SBIs) were lesions >3 mm, distinct from the circle of Willis in the basal ganglia, and of similar intensity as CSF. Columbia University and University of Miami IRBs approved the study. This study is reported as per the Strengthening the Reporting of Observational Studies in Epidemiology (STROBE) guidelines (S1 Text).
Baseline evaluation
Standardized questions captured the following conditions: hypertension, diabetes mellitus, hypercholesterolemia, cigarette smoking, alcohol use, and cardiac conditions [12]. Baseline examination included comprehensive medical history, physical examination, medical record review, functional status assessed by the Barthel index (BI), quality of life (QOL) assessed by the Spitzer QOL index, cognitive performance measured by the mini-mental state examination (MMSE) [13], and fasting blood samples.
Follow-up
Participants were followed up with annually via phone to detect death, capture new neurological or cardiac symptoms and events and interval hospitalizations, and measure functional status via the BI. Only 2 subjects were lost to follow-up after their baseline examination, and the average annual contact rate was 99%.
A potential cardiac or neurological event was followed by an in-person assessment to determine whether a vascular outcome occurred. All admissions and discharges of NOMAS study participants to Columbia University Medical Center (CUMC) were additionally screened for possible outcome events. Nearly 70% of vascular events in the cohort lead to hospitalizations at CUMC. Hospital records were reviewed to classify outcomes as previously reported [14]. Stroke included ischemic stroke, intracerebral hemorrhage, and subarachnoid hemorrhage. At least 2 stroke neurologists verified and classified stroke cases. Myocardial infarction (MI) required ≥2 of these criteria: (a) typical angina ischemic cardiac pain; (b) abnormal CK-MB fraction or troponin-I values; (c) ischemic ECG abnormalities. Cardiologists adjudicated MI diagnoses.
Study outcome
The BI [15,16] measures 10 ADLs and ranges from 0–100, with 100 indicating normal functioning. The 10 ADLs and the range of possible scores for each are as follows: Feeding (0, 5, 10), Bathing (0, 5), Grooming (0, 5), Dressing (0, 5, 10), Bowels (0, 5, 10), Bladder (0, 5, 10), Toilet use (0, 5, 10), Transfers (0, 5, 10, 15), Mobility (0, 5, 10, 15), and Stairs (0, 5, 10). Previous research has demonstrated the reliability of phone BI assessments [17]. The scale may be analyzed as a continuous variable for increased power to detect associations, ability to describe the course of change over time in linear form, and avoidance of potential misclassification due to crude categorization [18–20]. BI measurements from the time of MRI forward were included.
Covariates
Analytic models were adjusted for: demographic variables (age, sex, race/ethnicity), medical risk factors (body mass index [body weight in kilograms divided by the square of height in meters], hypercholesterolemia [defined by self-report, lipid-lowering therapy use, or fasting total cholesterol level >240 mg/dL], diabetes mellitus [defined by self-report, fasting blood glucose level ≥126 mg/dL, or insulin/oral hypoglycemic use], hypertension [defined as a systolic blood pressure recording ≥140 mmHg or a diastolic blood pressure recording ≥90 mm Hg based on the average of 2 blood pressure measurements or the participant’s self-report of a history of hypertension or antihypertensive use]), smoking (defined as either nonsmoker or smoker within the last year), alcohol use (with moderate alcohol use classified as 1 drink/month to 2 drinks/day), any physical activity (versus none), social variables (marital status, insurance status [classified uninsured/Medicaid versus Medicare/private insurance], number of friends [individuals whom the participant knows well enough to visit in their homes], years living in the community), and cognitive/mood factors (depressed mood, performance on MMSE [analyzed as a continuous variable], and Spitzer QOL index score).
Statistical analysis
We have followed a prospective analysis plan without alteration (S2 Text). We calculated variable distributions using means and SDs for continuous variables and frequency and percentage for categorical variables.
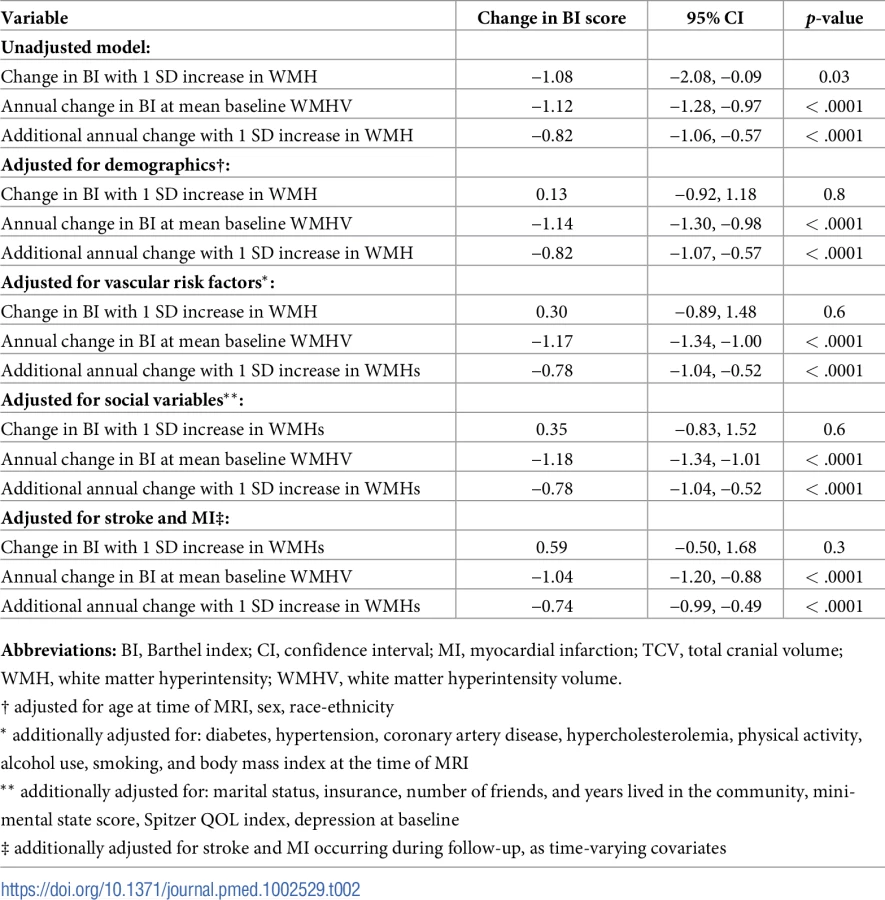
We then analyzed associations of whole brain WMHV with baseline BI (Fig 1) and slope of decline over time (Fig 2). Due to within-individual correlations among repeated BI measures, regression models using generalized estimating equations (GEEs) with an identity link function were used to assess the association between whole brain WMHV and repeated measurements of BI, adjusting sequentially for: baseline demographic variables, medical risk factors, smoking and alcohol use and physical activity, social variables, and cognitive/mood factors, as defined above.

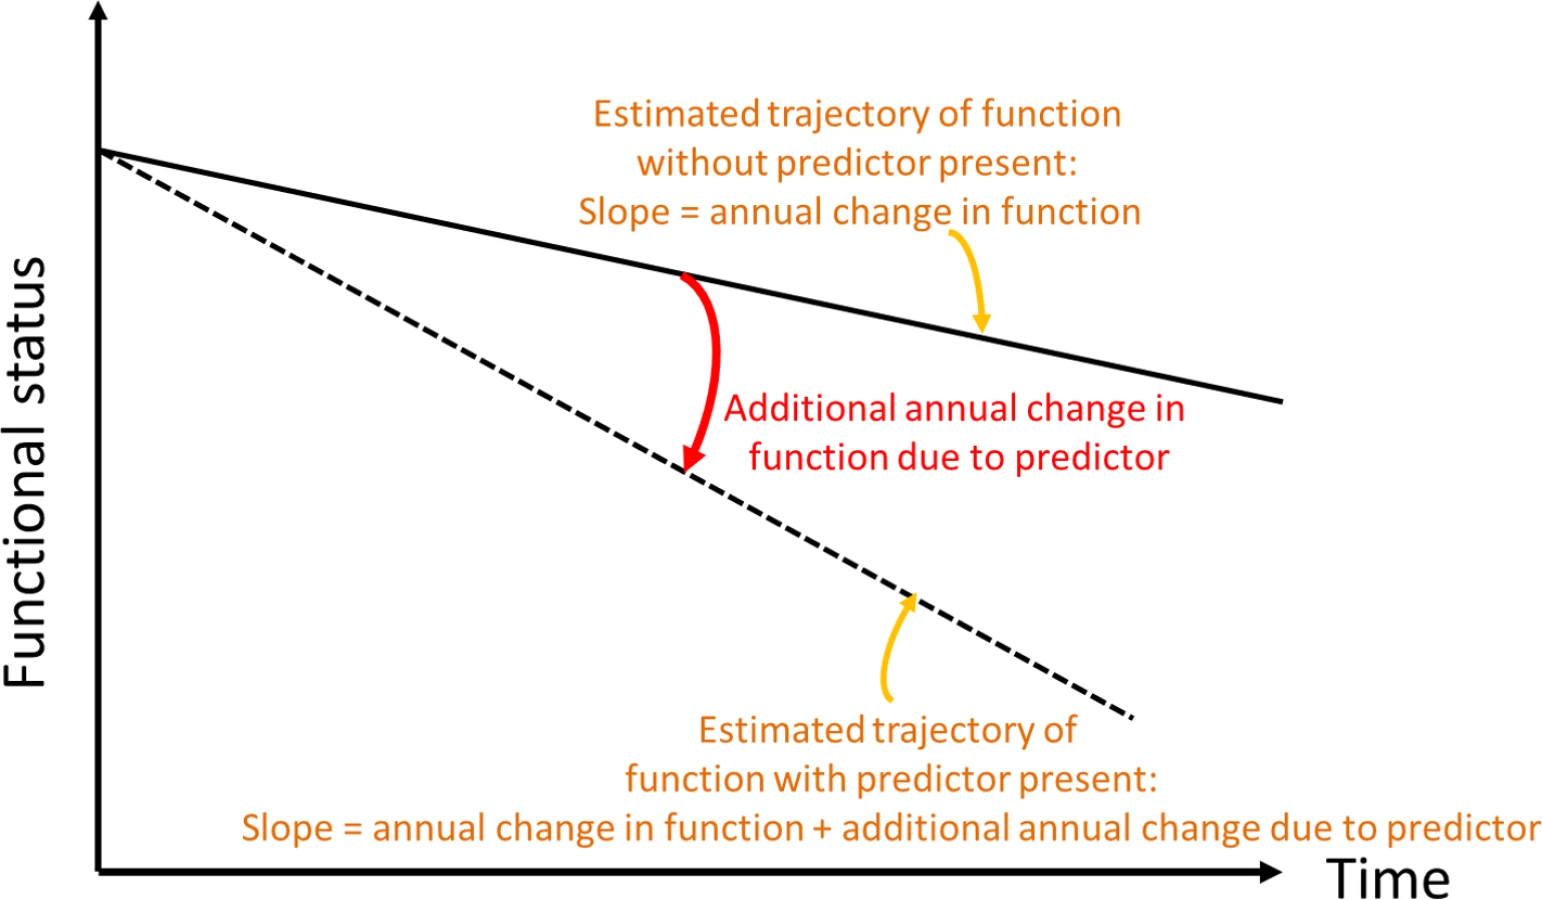
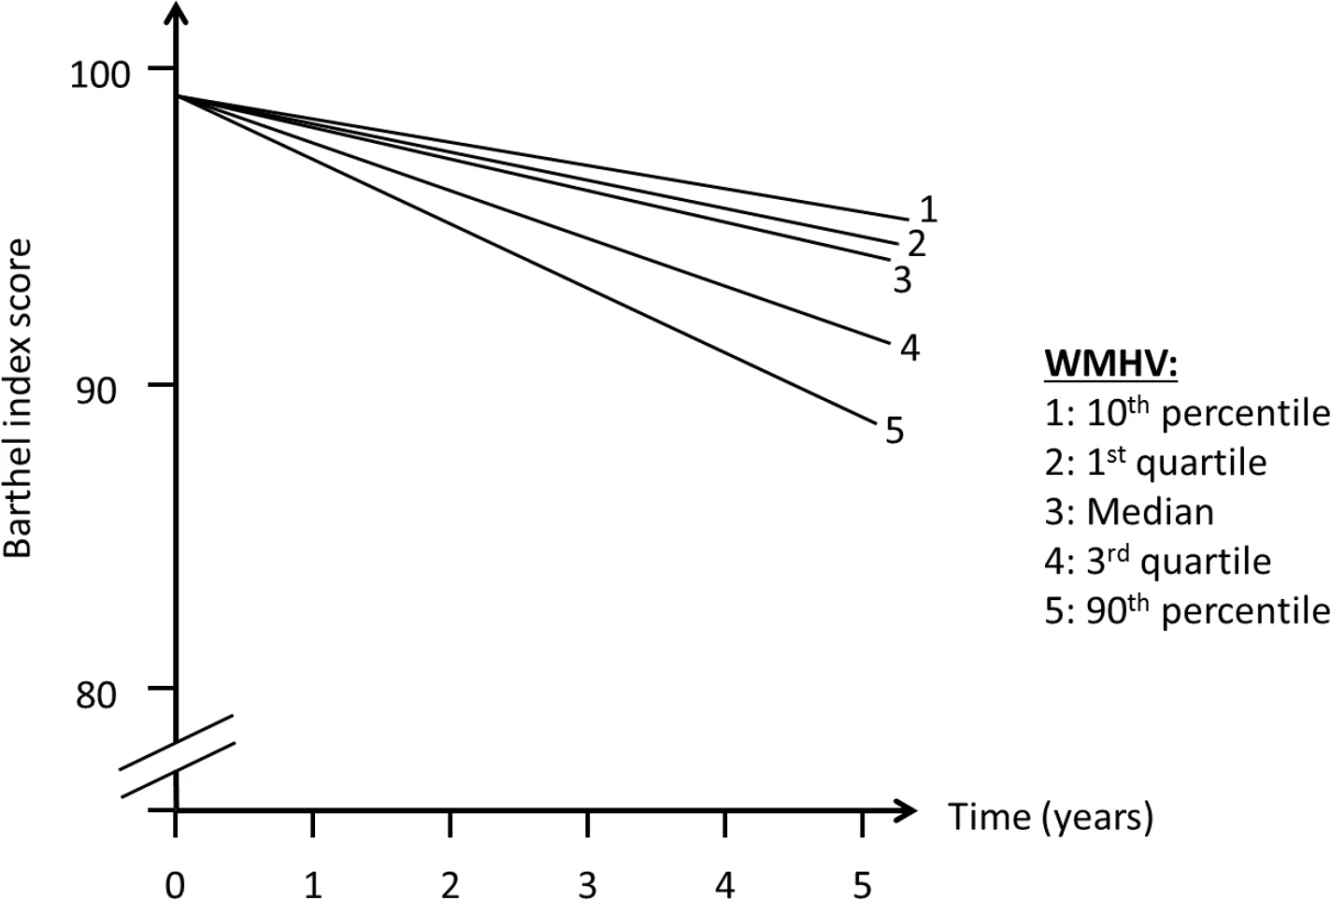
In order to assess whether MRI variables were associated with change in outcomes over time (slope, Fig 2), we included interaction terms between time of follow-up assessment and the main predictor variable. We used quasi-likelihood under the independence model criterion (QIC) as the model selection criterion after considering candidate final models. Various model diagnostics, including tests of linearity, residual plots, and goodness of fit measures, were used to evaluate the final model. There was no evidence to suggest lack of linearity of BI trajectories in the final models. As a working correlation structure for the GEE models, we chose the exchangeable (intraclass) structure and compared the QIC obtained with this model with one using the unstructured working correlation structure. In order to assess whether interval vascular events were implicated in the trajectory of functional status, we ran a second set of models in which stroke and MI were included as time-varying covariates. We tested whether the relationship between whole brain WMHVs and functional status remained even after adjusting for these events. Using the fully adjusted model, we created a graph of functional trajectories for exemplars with mean age, BMI, MMSE, and Spitzer QOL score; we show 5 estimated trajectories, based on amount of whole brain WMHV: minimum, first quartile, median, third quartile, and maximum.
Next, we examined whether the relationship between whole brain WMHVs and functional status differed for mobility (transfers, mobility, and stair use) and non-mobility (feeding, bathing, grooming, dressing, bowels, bladder, and toilet use) BI domains, which we analyzed separately in unadjusted and fully adjusted models. We also compared trajectories among those with BI 95 or 100 at baseline versus those with baseline BI <95 in order to see if the association was independent of baseline function. The primary models above were additionally adjusted for presence or absence of SBI. Finally, we incorporated mortality into the outcome by performing proportional hazards regression of the relationship between standardized whole brain WMHV and time to the first occurrence of BI score of 60 or death in unadjusted and fully adjusted models. SAS version 9.3 (Cary, NC) was used for all analyses.
Results
Table 1 shows baseline characteristics of the cohort. The mean age was 64.5 years; the cohort was predominantly female (60.5%) and Hispanic (65.7%); and the prevalence of diabetes was 19.0%, hypercholesterolemia 61.8%, and coronary artery disease 13.7%. There were 1,136 individuals (88.8%) who had BI of 95 or 100 at baseline. Mean whole brain WMHVs (as percentage of TCV) was 0.68% (SD 0.84, median 0.36; distribution of whole brain WMHV values in Fig 3), and 193 (15.6%) had SBI. Mean follow-up time per person, from MRI to last follow-up assessment, was 7.3 years (SD 2.1). Out of 1,258 participants with >1 follow-up assessment after MRI, 818 (64.6%) experienced a decline in BI of at least 5 points during follow-up. Of 1,136 participants with BI of 95 or 100 at baseline, 690 (61.7%) experienced a decline in BI. Through the end of 2014, there were 53 first definite and probable MIs during follow-up, and 64 first strokes (59 infarcts, 3 intracerebral hemorrhages, and 2 subarachnoid hemorrhages).


There was an annual decline in functional status overall of −1.12 BI points per year (95% CI −1.28, −0.97) in an unadjusted model and −1.04 points per year (95% CI −1.20, −0.88) in a fully adjusted model (Table 2). Standardized whole brain WMHV was associated with accelerated functional decline, with −0.82 additional BI points per year (95% CI −1.06, −0.57) per SD greater whole brain WMHV in an unadjusted model and −0.74 additional points per year (95% CI −0.99, −0.49) in a fully adjusted model. The magnitude of this effect varied little with additional adjustment, even after adjusting for intervening clinical stroke and MI. Whole brain WMHV had a consistent effect on mobility and non-mobility domains of the BI (Table 3), proportional to the portion of the BI comprising each domain. In adjusted models, whole brain WMHV was not associated with baseline BI. Fig 4 shows estimated trajectories of functional status based on fully adjusted models (Table 2), stratified by whole brain WMHV.

We compared functional trajectories among those with a baseline BI score of 95 or 100 (n = 1,136) versus those with baseline BI < 95 (n = 144, Table 4). Although an interaction term between baseline BI score and annual change in BI was significant (p <0.0001), in both groups, whole brain WMHV was associated with an additional annual decline of −0.68 points per year (95% CI −0.94, −0.41) among those with baseline BI of 95 or 100 and of −0.86 points per year (95% CI −1.49, −0.23) among those with baseline BI <95.

Next, the primary models were additionally adjusted for SBI, in order to assess whether the association between whole brain WMHV and functional trajectories was independent of the presence of SBI. In the fully adjusted model, there was an annual decline in functional status overall of −1.04 BI points per year (95% CI −1.20, −0.88), and standardized whole brain WMHV was still associated with accelerated functional decline, with −0.74 additional BI points per year (95% CI −0.99, −0.49) per SD higher whole brain WMHV.
When we incorporated mortality into the outcome using proportional hazards regression, there was an increased hazard of the occurrence of a BI of 60 or death with higher whole brain WMHV, with HR of 1.52 per SD increase in whole brain WMHV (95% CI 1.42,1.64) in an unadjusted model and 1.31 (95% CI 1.19,1.44) in a fully adjusted model.
Discussion
In this large population-based MRI study with over 7 years of follow-up and annual functional measurements, there was a strong, consistent, and independent association of greater whole brain WMHV with accelerated decline in function over time equivalent to an almost doubling of the mean annual decline per SD whole brain WMHV increase. This decline was also seen when mobility and non-mobility domains of the BI were examined as separate outcomes and even after adjusting for SBI. Also, these associations were seen even among those with no disability at baseline, which emphasizes the “subclinical” nature of these predictors and yet their strong predictive power on trajectories of functional status. In a sensitivity analysis that incorporated mortality, we found that every SD increase in whole brain WMHV was associated with approximately 30% increased hazard of poor functional outcome or death. Although there was an unadjusted association between greater whole brain WMHV and lower baseline BI score, we did not observe an association between whole brain WMHV and baseline BI in adjusted models. This suggests that demographic variables, primarily age, confounded the relationship between whole brain WMHV and baseline functional status.
Several studies have examined associations between patient-centered outcomes and WMHV. In a prior analysis in the NOMAS MRI cohort [21], greater whole brain WMHV and smaller TCV were associated with poorer performance in learning a list of words and greater decline in global cognition [22]. The current analysis expands upon this previous research by analyzing longitudinal trends of repeated measures of functional status and confirming a long-term effect of whole brain WMHV on functional decline. Among 619 participants [23], risk of transition to ≥2 ADL impairments at 1 year was higher with more WMHV. After a mean of 2.42 years of follow-up, these trends were maintained [24], with an HR for transition to disability or death of 2.36 (95% CI 1.65–3.81). When gait and balance were examined yearly over 3 years of follow-up, more WMHV predicted greater decline over time, especially among older adults [25]. Among 287 community-dwelling individuals aged 70–90 years [26], greater WMHV was associated with physical decline over 1 year (odds ratio [OR] 3.02, 95% CI 1.02–8.95). Among 99 individuals 75–89 years of age, global WMHV was associated with urinary incontinence, mobility deficits, and executive dysfunction [27].
Multiple prior studies have shown relationships between subclinical ischemic injury and patient-centered outcomes. However, a minority of prior studies has examined trajectories of these outcomes over time, describing not only change between 2 time points but also slopes of change over time with multiple repeated measures per individual. Trajectory analysis is more sensitive to the course of change in outcomes over time and can reliably estimate this slope, thereby describing the natural history of functional status and factors that influence it. Also, we controlled for adjudicated vascular outcomes occurring during follow-up, allowing the estimation of associations independent of clinical events.
WMHV, SBI, microbleeds, and atrophy have been associated with declines in gait speed, cadence of gait, and stride length [28,29], which would affect ADLs dependent on mobility aspects of functioning. WMHV and its progression have been associated with neurological examination findings such as gait and stance abnormalities, upper motor signs, and slowing of finger taps [30], and the presence and number of neurological deficits have an independent impact on performance of ADLs [31]. Silent deep infarcts and WMHV have been associated with gait variability, which has been associated with falls and disability [32].
Strengths of this study include the large population-based cohort, accurate assessment of follow-up events, minimal loss to follow-up, state-of-the-art imaging and measurement of subclinical brain vascular disease, and repeated measures of functional outcomes that allow trajectory analysis. A limitation is that NOMAS participants enrolled in the MRI cohort were able to return for follow-up and undergo MRI, reflecting a healthy survivor bias, which may have reduced power to detect declines in functional status and resulted in the lack of association between whole brain WMHV and baseline functional status. Also, in terms of intervening conditions or events that could affect functional trajectories, we focused on the vascular events of stroke and MI but did not adjust for nonvascular intervening conditions. Similarly, we did not measure or assess time-dependent alterations on MRI in measures such as atrophy, which could have an effect on functional status over time.
There are several implications of this research. With an exclusive focus on short-term events—traditionally the approach of many observational studies and clinical trials—the long-term declines seen in these analyses would be missed, and the burden of disease would be underestimated. Also, few studies have analyzed not only single time points but trajectories over time, which allows for a more detailed characterization of the relationship between whole brain WMHV and disability trajectories. This research highlights the likely central role that “subclinical” disease plays in functional ability and health.
Supporting Information
Zdroje
1. Hofer E, Cavalieri M, Bis JC, DeCarli C, Fornage M, et al. (2015) White Matter Lesion Progression: Genome-Wide Search for Genetic Influences. Stroke 46 : 3048–3057. doi: 10.1161/STROKEAHA.115.009252 26451028
2. Ntaios G, Lip GY, Lambrou D, Papavasileiou V, Manios E, et al. (2015) Leukoaraiosis and stroke recurrence risk in patients with and without atrial fibrillation. Neurology 84 : 1213–1219. doi: 10.1212/WNL.0000000000001402 25695964
3. Kuller LH, Arnold AM, Longstreth WT Jr., Manolio TA, O'Leary DH, et al. (2007) White matter grade and ventricular volume on brain MRI as markers of longevity in the cardiovascular health study. Neurobiol Aging 28 : 1307–1315. doi: 10.1016/j.neurobiolaging.2006.06.010 16857296
4. Longstreth WT Jr., Dulberg C, Manolio TA, Lewis MR, Beauchamp NJ Jr., et al. (2002) Incidence, manifestations, and predictors of brain infarcts defined by serial cranial magnetic resonance imaging in the elderly: the Cardiovascular Health Study. Stroke 33 : 2376–2382. 12364724
5. Baune BT, Schmidt WP, Roesler A, Berger K (2009) Functional consequences of subcortical white matter lesions and MRI-defined brain infarct in an elderly general population. J Geriatr Psychiatry Neurol 22 : 266–273. doi: 10.1177/0891988709342722 19690323
6. Pohjasvaara TI, Jokinen H, Ylikoski R, Kalska H, Mantyla R, et al. (2007) White matter lesions are related to impaired instrumental activities of daily living poststroke. J Stroke Cerebrovasc Dis 16 : 251–258. doi: 10.1016/j.jstrokecerebrovasdis.2007.08.001 18035242
7. Rosano C, Kuller LH, Chung H, Arnold AM, Longstreth WT Jr., et al. (2005) Subclinical brain magnetic resonance imaging abnormalities predict physical functional decline in high-functioning older adults. J Am Geriatr Soc 53 : 649–654. doi: 10.1111/j.1532-5415.2005.53214.x 15817012
8. Poggesi A, Pantoni L, Grp LS (2011) 2001–2011: A Decade of the LADIS (Leukoaraiosis And DISability) Study: What Have We Learned about White Matter Changes and Small-Vessel Disease? Cerebrovascular Diseases 32 : 577–588.
9. Dong C, Nabizadeh N, Caunca M, Cheung YK, Rundek T, et al. (2015) Cognitive correlates of white matter lesion load and brain atrophy: the Northern Manhattan Study. Neurology 85 : 441–449. doi: 10.1212/WNL.0000000000001716 26156514
10. Dhamoon MS, Cheung YK, Bagci A, Alperin N, Sacco RL, et al. (2017) Differential Effect of Left vs. Right White Matter Hyperintensity Burden on Functional Decline: The Northern Manhattan Study. Front Aging Neurosci 9 : 305. doi: 10.3389/fnagi.2017.00305 28970793
11. Elkind MS, Sciacca R, Boden-Albala B, Rundek T, Paik MC, et al. (2006) Moderate alcohol consumption reduces risk of ischemic stroke: the Northern Manhattan Study. Stroke 37 : 13–19. doi: 10.1161/01.STR.0000195048.86810.5b 16306464
12. Gentry EM, Kalsbeek WD, Hogelin GC, Jones JT, Gaines KL, et al. (1985) The behavioral risk factor surveys: II. Design, methods, and estimates from combined state data. Am J Prev Med 1 : 9–14. 3870927
13. Folstein MF, Folstein SE, McHugh PR (1975) "Mini-mental state". A practical method for grading the cognitive state of patients for the clinician. J Psychiatr Res 12 : 189–198. 1202204
14. Sacco RL, Anand K, Lee HS, Boden-Albala B, Stabler S, et al. (2004) Homocysteine and the risk of ischemic stroke in a triethnic cohort: the NOrthern MAnhattan Study. Stroke 35 : 2263–2269. doi: 10.1161/01.STR.0000142374.33919.92 15345803
15. Mahoney FI, Barthel DW (1965) Functional Evaluation: The Barthel Index. Md State Med J 14 : 61–65.
16. Granger CV, Dewis LS, Peters NC, Sherwood CC, Barrett JE (1979) Stroke rehabilitation: analysis of repeated Barthel index measures. Arch Phys Med Rehabil 60 : 14–17. 420565
17. Shinar D, Gross CR, Bronstein KS, Licata-Gehr EE, Eden DT, et al. (1987) Reliability of the activities of daily living scale and its use in telephone interview. Arch Phys Med Rehabil 68 : 723–728. 3662782
18. Bath PM, Gray LJ, Collier T, Pocock S, Carpenter J (2007) Can we improve the statistical analysis of stroke trials? Statistical reanalysis of functional outcomes in stroke trials. Stroke 38 : 1911–1915. doi: 10.1161/STROKEAHA.106.474080 17463316
19. Saver JL (2011) Optimal end points for acute stroke therapy trials: best ways to measure treatment effects of drugs and devices. Stroke 42 : 2356–2362. doi: 10.1161/STROKEAHA.111.619122 21719772
20. Song F, Jerosch-Herold C, Holland R, Drachler Mde L, Mares K, et al. (2006) Statistical methods for analysing Barthel scores in trials of poststroke interventions: a review and computer simulations. Clin Rehabil 20 : 347–356. doi: 10.1191/0269215506cr948oa 16719033
21. Glazer H, Dong C, Yoshita M, Rundek T, Elkind MS, et al. (2015) Subclinical cerebrovascular disease inversely associates with learning ability: The NOMAS. Neurology 84 : 2362–2367. doi: 10.1212/WNL.0000000000001657 26002489
22. Wright CB, Dong C, Caunca M, Rundek T, Elkind MSV, et al. (2016) White Matter Hyperintensity Burden is associated with Cognitive Decline: The Northern Manhattan Study. Journal of the American Geriatrics Society in press.
23. Inzitari D, Simoni M, Pracucci G, Poggesi A, Basile AM, et al. (2007) Risk of rapid global functional decline in elderly patients with severe cerebral age-related white matter changes: the LADIS study. Arch Intern Med 167 : 81–88. doi: 10.1001/archinte.167.1.81 17210882
24. Inzitari D, Pracucci G, Poggesi A, Carlucci G, Barkhof F, et al. (2009) Changes in white matter as determinant of global functional decline in older independent outpatients: three year follow-up of LADIS (leukoaraiosis and disability) study cohort. Bmj 339: b2477. doi: 10.1136/bmj.b2477 19581317
25. Kreisel SH, Blahak C, Bazner H, Inzitari D, Pantoni L, et al. (2013) Deterioration of gait and balance over time: the effects of age-related white matter change—the LADIS study. Cerebrovasc Dis 35 : 544–553. doi: 10.1159/000350725 23838682
26. Zheng JJ, Delbaere K, Close JC, Sachdev P, Wen W, et al. (2012) White matter hyperintensities are an independent predictor of physical decline in community-dwelling older people. Gerontology 58 : 398–406. doi: 10.1159/000337815 22614074
27. Wakefield DB, Moscufo N, Guttmann CR, Kuchel GA, Kaplan RF, et al. (2010) White matter hyperintensities predict functional decline in voiding, mobility, and cognition in older adults. J Am Geriatr Soc 58 : 275–281. doi: 10.1111/j.1532-5415.2009.02699.x 20374403
28. Callisaya ML, Beare R, Phan TG, Blizzard L, Thrift AG, et al. (2013) Brain structural change and gait decline: a longitudinal population-based study. J Am Geriatr Soc 61 : 1074–1079. doi: 10.1111/jgs.12331 23796055
29. Choi P, Ren M, Phan TG, Callisaya M, Ly JV, et al. (2012) Silent infarcts and cerebral microbleeds modify the associations of white matter lesions with gait and postural stability: population-based study. Stroke 43 : 1505–1510. doi: 10.1161/STROKEAHA.111.647271 22442168
30. Poggesi A, Gouw A, van der Flier W, Pracucci G, Chabriat H, et al. (2013) Cerebral white matter changes are associated with abnormalities on neurological examination in non-disabled elderly: the LADIS study. J Neurol 260 : 1014–1021. doi: 10.1007/s00415-012-6748-3 23180181
31. Poggesi A, Gouw A, van der Flier W, Pracucci G, Chabriat H, et al. (2014) Neurological abnormalities predict disability: the LADIS (Leukoaraiosis And DISability) study. J Neurol 261 : 1160–1169. doi: 10.1007/s00415-014-7332-9 24723116
32. Rosano C, Brach J, Studenski S, Longstreth WT Jr., Newman AB (2007) Gait variability is associated with subclinical brain vascular abnormalities in high-functioning older adults. Neuroepidemiology 29 : 193–200. doi: 10.1159/000111582 18043004
Štítky
Interní lékařstvíČlánek vyšel v časopise
PLOS Medicine
2018 Číslo 3
- Srovnání vlivu omeprazolu a pantoprazolu na antiagregační účinek klopidogrelu
- Fixní kombinace kandesartan/amlodipin v terapii arteriální hypertenze
- Současné postavení a přínos sartanů v klinické praxi
- Prognostický význam hladiny natriuretických peptidů při léčbě empagliflozinem
- Hypertrofická obstrukční kardiomyopatie ve světle moderní farmakoterapie – kazuistika
Nejčtenější v tomto čísle
- Forced anal examinations to ascertain sexual orientation and sexual behavior: An abusive and medically unsound practice
- Polycystic ovary syndrome, androgen excess, and the risk of nonalcoholic fatty liver disease in women: A longitudinal study based on a United Kingdom primary care database
- The current and potential health benefits of the National Health Service Health Check cardiovascular disease prevention programme in England: A microsimulation study
- Cardiovascular disease and multimorbidity: A call for interdisciplinary research and personalized cardiovascular care
Zvyšte si kvalifikaci online z pohodlí domova
Mazová zátka a její řešení
nový kurzVšechny kurzy