
Cell Cycle Regulates Nuclear Stability of AID and Determines the Cellular Response to AID
AID (Activation Induced Deaminase) deaminates cytosines in DNA to initiate immunoglobulin gene diversification and to reprogram the genome in early development. AID is potentially highly mutagenic, as it deaminates C to U within single-stranded regions. Here we show that AID abundance is regulated by cell cycle, and that high levels of nuclear AID are tolerated only in G1 phase. These results identify an unanticipated role for spatiotemporal regulation in balancing demands of AID-initiated mutagenesis and its potentially pathological outcomes.
Published in the journal:
. PLoS Genet 11(9): e32767. doi:10.1371/journal.pgen.1005411
Category:
Research Article
doi:
https://doi.org/10.1371/journal.pgen.1005411
Summary
AID (Activation Induced Deaminase) deaminates cytosines in DNA to initiate immunoglobulin gene diversification and to reprogram the genome in early development. AID is potentially highly mutagenic, as it deaminates C to U within single-stranded regions. Here we show that AID abundance is regulated by cell cycle, and that high levels of nuclear AID are tolerated only in G1 phase. These results identify an unanticipated role for spatiotemporal regulation in balancing demands of AID-initiated mutagenesis and its potentially pathological outcomes.
Introduction
Activation-induced cytosine deaminase (AID) initiates immunoglobulin (Ig) gene diversification in activated B cells by deaminating C to U [1,2]. Either UNG2 or MSH2/6 recognize and process this damage, and repair via error-prone pathways results in somatic hypermutation (SHM), class switch recombination (CSR) or gene conversion. AID-initiated damage can have pathological outcomes, evident as the chromosomal translocations associated B cell malignancies [3–7]. AID also participates in erasing CpG methylation to reprogram the genome in early development [8–12], promotes B cell tolerance [13,14], and limits autoimmunity [15,16].
AID is tightly regulated. AID localizes predominately to the cytoplasm but requires access to the nucleus to function. Posttranslational modifications and interactions with other proteins modulate cytoplasmic retention and nuclear import [17–19]. AID persistence in the nucleus is limited by proteosomal degradation [20,21] and by CRM1-dependent nuclear export [22–24]. Catalytic activity of AID can be improved by active site point mutations, but while those mutations accelerate Ig gene diversification they also stimulate translocation and compromise cell viability [25]. Mutation or deletion of the C-terminal region that includes the nuclear export signal (NES) can diminish AID stability and the efficiency of CSR, but compromises cell fitness [26,27].
AID abundance is constant during cell cycle [20,26], but several kinds of observations have suggested that cell cycle may regulate AID activity. In DT40 chicken B cells, brief treatment with leptomycin B (LMB), an inhibitor of CRM1-dependent nuclear export, increases nuclear AID signal in G1 phase cells [28]; Polη, which copies donor DNA in AID-initiated gene conversion, co-localizes with the diversifying IgλR allele predominately in G1 phase [29]; UNG2 removes uracils produced upon deamination by AID predominately in G1 phase [30]; and RPA initially accumulates at Ig switch regions in G1 phase [31].
We have now asked if cell cycle regulates subcellular localization, stability or physiological activity of AID. We demonstrate that nuclear degradation occurs more slowly in G1 phase than in S-G2/M phase cells. We show that mutations that affect regulatory phosphorylation or catalytic activity can alter AID stability and abundance. We directly test the role of cell cycle regulation by fusing AID to tags derived from cell cycle regulators CDT1 and Geminin [32] to destroy nuclear protein outside G1 or S-G2/M phase. We show that nuclear AID accelerates SHM and CSR, and is tolerated by cells in G1 phase, but compromises viability in S-G2/M phase. These results establish that cell cycle regulates abundance of nuclear AID and determines the ability of cells to respond to AID-initiated DNA damage. The AID derivatives that we have generated may be useful tools for engineering genes by iterative mutagenesis and selection, and cell cycle tags may be generally useful for studying DNA repair and recombination and RNA biogenesis, and for genome engineering.
Results
Nuclear AID is destabilized by ubiquitin-dependent proteolysis
We analyzed subcellular distribution of AID in the human B cell line, Ramos, transduced with a lentiviral construct expressing human AID fused at the C-terminus to the mCherry fluorescent protein (AID-mCherry). Ramos B cells express endogenous AID and actively hypermutate their Ig genes, so the pathways that regulate and respond to damage by AID are intact; and both endogenous and exogenous protein will contribute to total AID abundance. Cells were analyzed by high content screening (HCS) microscopy [33], a flow-based approach that automatically quantifies signals per unit area (pixels) in each compartment of each cell (Fig 1A; see Materials and Methods). Control experiments verified that cell cycle was not perturbed significantly by up to 4 hr of culture with MG132, an inhibitor of the ubiquitin-dependent 26S proteasome; LMB; or MG132+LMB (S1 Fig). MG132 treatment had little effect on nuclear and cytoplasmic signals in populations of AID-mCherry transductants; while treatment with LMB or both LMB+MG132 rapidly increased nuclear signal in most cells (Fig 1B). Quantification established that nuclear signal was unaffected by MG132 treatment; rapidly increased (1.5-fold) and then declined in response to LMB treatment; and increased (1.7-fold) and plateaued in response to treatment with both LMB+MG132 (S1 Table and Fig 1C and 1D). Cytoplasmic signal was unaffected by MG132 treatment, but diminished upon treatment with LMB or LMB+MG132, paralleling the increase in nuclear signal (S1 Table and Fig 1C and 1D). Similarly, the ratio of nuclear to cytoplasmic AID (N/C) was unaffected by treatment with MG132 alone; and increased and plateaued in response to LMB or LMB+MG132 treatment (Fig 1D, right). These results are consistent with previous reports that AID undergoes nuclear proteolysis [20,21].

Nuclear AID is more stable in G1 phase than in S or G2/M phases
We used HCS to quantify AID-mCherry subcellular distribution in Ramos B cells in each phase of cell cycle, and the response to inhibitors of proteolysis and nuclear export (Fig 2). G1, S, and G2/M phase cells were distinguished by ranking DNA content as determined by total DAPI signal, and specific fractions of the population assigned to G1, S and G2/M phases (S2A Fig). HCS results were expressed in terms of average signal, to ensure independence of cell size, which increases during cell cycle (S2B Fig); and total and average mCherry signal both increased with DNA content (S2C, S2D, and S2E Fig).

Treatment with MG132 (Fig 2A) had little effect on nuclear or cytoplasmic AID-mCherry signals in any phase of cell cycle. Treatment with LMB or LMB+MG132 (Fig 2A) caused the cytoplasmic signal to drop by 50% in all stages of cell cycle, evidence of the importance of nuclear export in maintaining cytoplasmic signal. Treatment with LMB caused the nuclear AID-mCherry signal to increase (0–1 hr) and then drop, while treatment with LMB+MG132 caused this signal to increase and then plateau; thus the drop in nuclear signal following treatment with LMB alone was due to proteolysis. Notably, LMB treatment caused a sharper initial increase and more gradual decrease in nuclear signal in G1 phase than S or G2/M phase cells; while LMB+MG132 treatment resulted in a significantly higher relative signal in G1 phase than S or G2/M phase cells (at 2 hr, G1 vs. S, p = 1.4x10⁻³; G1 vs. G2/M, p = 1.8 x10⁻⁵; Fig 2A, right and S2 Table). Thus, nuclear stability of AID-mCherry is cell cycle dependent, and stability is highest in G1 phase.
Comparison of the slopes of the LMB response curves between the 1 and 2 hr time points (Fig 2A, center) suggested that degradation occurred more rapidly in S-G2/M phase than G1 phase. To quantify the difference, we calculated the average rate of loss of nuclear signal between 1–2 hr of treatment, as defined by the slope of the line between these time points, for 4 independent experiments (Figs 2A and S3). Rates of initial degradation were 1.56-fold and 1.54-fold higher in S and G2/M phases (p = 0.02 and 0.03, respectively; Fig 2B) than in G1 phase. We conclude that nuclear AID-mCherry is degraded more rapidly in S and G2/M phase than in G1 phase.
AID phosphorylation and catalytic activity regulate nuclear abundance
AID undergoes phosphorylation on at least five different residues: Ser3, Thr27, Ser38, Thr140, Tyr184. To ask how abundance might be regulated in the course of cell cycle, we focused on two of them, Ser3 and S38, sites of negative and positive regulation, respectively. Phosphorylation of AID on Ser3 downregulates SHM and CSR, and protein phosphatase 2A (PP2A) removes this modification [34]. PP2A is a tumor suppressor that controls cell cycle progression by modulating phosphorylation of G1/S cyclins to maintain appropriate levels [35], making Ser3 modification of interest as a target of cell cycle regulation. Phosphorylation of AID on Ser38 by protein kinase A (PKA) promotes robust SHM and CSR, in part by enabling interaction with RPA [36–40], which is in turn cell cycle-regulated [41]. The fifth derivative analyzed was AIDH56A-mCherry, mutant at a conserved histidine that is one of three residues that coordinates an active site zinc ion essential for deaminase activity [42].
We quantified mCherry signals in nuclei and cytoplasm of Ramos cells expressing WT AID-mCherry or AID point mutants (Fig 3A). The AIDS3A-mCherry signal was comparable to that of AID-mCherry, while the signal of the corresponding phosphomimetic mutant, AIDS3D-mCherry, was reduced to approximately 60–70% that of WT. The nuclear AIDS38A-mCherry signal was slightly lower than that of AID-mCherry, while the signal of the corresponding phosphomimetic mutant, AIDS38D-mCherry, was slightly higher. These results suggest that phosphorylation at Ser3 regulates AID abundance.

The nuclear and cytoplasmic signals of AIDH56A-mCherry were much lower than those of WT AID-mCherry (25–30%; Fig 3A). While we cannot rule out the possibility that the reduced signal is due to perturbation of overall structure by the H56A mutation, mutation of His to Ala at the corresponding residue of the highly related active site of mouse adenosine deaminase has been shown to reduce catalytic activity but not affect secondary or tertiary structure [43]. Reduced abundance was not B cell specific, as mutation of His to Arg at this position (AIDH56R-mCherry) also reduced abundance (S4A Fig). Furthermore, reduced abundance was not an artifact of cloning, as the signal of a reversion mutant (AIDH56A-H) was comparable to that of the AID-mCherry control (S4B Fig).
To ask if differences in AID abundance reflected relative rates of degradation, we assayed nuclear and cytoplasmic signals of each mutant over the course of 4 hr treatment with LMB, and plotted signals in treated relative to untreated cells (Fig 3B). At 1–2 hr following LMB treatment, the nuclear degradation rate of AIDS3D-mCherry was more rapid than that of AIDS3A-mCherry or AID-mCherry, consistent with the lower abundance of AIDS3D-mCherry. The nuclear degradation rates of AIDS38A-mCherry and AIDS38D-mCherry exhibited no clear differences (Fig 3B). The nuclear degradation rate of AIDH56A-mCherry was apparently lower than that of WT AID-mCherry (Fig 3B). This was surprising in light of the low abundance of AIDH56A-mCherry (Fig 3A), and may reflect difficulty in measuring small differences in relative signals of a low-abundance protein.
We asked if cell cycle affected degradation rates by comparing signals in G1, S and G2/M phase cells, untreated or treated with LMB (Figs 3C and S5). At 1–2 hr post-treatment with LMB, AIDS3D-mCherry exhibited more rapid nuclear degradation in G1 phase than AIDS3A-mCherry, consistent with negative regulation by phosphorylation at Ser3. AIDS38A-mCherry and AIDS38D-mCherry did not exhibit clear differences (Fig 3C). The rate of loss of the AIDH56A-mCherry signal did not vary among G1, S and G2/M phases (Fig 3C). These results show that phosphorylation at Ser3 may contribute to cell cycle regulation of AID by increasing the rate of degradation in G1 phase.
Cell cycle regulation conferred by CDT1 and GEM tags
With the goal of restricting the presence of AID-mCherry in the nucleus to G1 or S/G2-M phases, we fused AID-mCherry to tags derived from the CDT1 and GEM cell cycle regulators, which target a fused protein for destruction in the nucleus in S-G2/M phase (CDT1) or G1/early S phase (GEM) [32]. Control experiments confirmed that, in Ramos B cells, these tags fused to monomeric Kusabira Orange 2 (mKO2) or monomeric Azami-Green (mAG) promoted nuclear localization (S6A Fig) and conferred the predicted cell cycle regulation: signals from mKO2-CDT1 or mAG-GEM were restricted to G1 phase or late G1/S-G2/M phase, respectively (S4B Fig). Expression of AID-mCherry-CDT1 or AID-mCherry-GEM did not disrupt the cell cycle profile of Ramos B cells (Fig 4A). However, regulation directed toward AID appeared to override some predicted effects of each tag. FACS analysis showed that restriction of the AID-mCherry-CDT1 signal to G1 phase was incomplete (Fig 4A), in contrast to G1 phase restriction evident for an analogous CDT1 tagged fluorescent protein not fused to AID, mKO2-CDT1 (S4B Fig). Furthermore, immunofluorescence microscopy identified no nuclear signal among cells expressing AID-mCherry-GEM (Fig 4B), in contrast to the strong nuclear signal among some (but not all) cells expressing AID-mCherry-CDT1 (Fig 4B) or mAG-GEM (S6B Fig). Nonetheless both the CDT1 and GEM tags did target the fusion protein for nuclear degradation during a portion of cell cycle, as predicted, as HCS analysis showed that total and cytoplasmic mCherry signals were significantly lower in AID-mCherry-CDT1 and AID-mCherry-GEM relative to AID-mCherry transductant populations (p = 0; S3 Table and Fig 4C). Active nuclear export was confirmed by showing that treatment with LMB or LMB+MG132 caused a comparable increase in nuclear signal (relative to untreated cells) in AID-mCherry, AID-mCherry-CDT1 and AID-mCherry-GEM transductants (S7 Fig).

The nuclear localization of AID-mCherry-CDT1 could reflect more rapid nuclear import. However, while the nuclear signal and the ratio of nuclear to cytoplasmic signal (N/C) peaked more quickly in AID-mCherry-CDT1 than in AID-mCherry or AID-mCherry-GEM transductants following treatment with LMB (S7 Fig), this modest increase does not fully explain the strong nuclear signal in a significant fraction of AID-mCherry-CDT1 transductants. In addition, HCS analysis showed that while the AID-mCherry-CDT1 nuclear signal was greatest in G1 phase cells, it was also evident in S phase cells. This suggested that AID-mCherry-CDT1 exported from the nucleus in G1 phase may re-enter in S phase to create a signal before it is targeted for proteolysis by the CDT1 tag. This possibility is addressed experimentally below.
HCS analysis also showed that AID-mCherry and AID-mCherry-GEM signals were exclusively cytoplasmic, independent of cell cycle (S4 Table and Fig 4D). Combined with the evidence that AID is degraded more rapidly in S and G2-M phases than in G1 phase (Fig 3), the absence of nuclear signal in AID-mCherry-GEM transductants suggests that mechanisms targeted to the GEM tag may promote its nuclear proteolysis in G1 phase, while mechanisms targeted to AID promote its proteolysis or nuclear export in other stages of cell cycle.
AID-mCherry-CDT1 expression reduced viability and accelerated Ig gene diversification
The distinctive spatiotemporal regulation of AID-mCherry, AID-mCherry-CDT1 and AID-mCherry-GEM allowed us to analyze the physiological consequences of nuclear AID at different stages of cell cycle. Strikingly, AID-mCherry-CDT1 transductants exhibited diminished cell viability relative to AID-mCherry or AID-mCherry-GEM transductants (Fig 4E). This suggested that nuclear AID can compromise fitness.
sIgM loss frequency was 7.9% in AID-mCherry transductants, 41.1% (p = 0.003) in AID-mCherry-CDT1 transductants, and 6.5% in AID-mCherry-GEM transductants, in all cases above frequencies in transductants expressing the AIDH56A-mCherry catalytic mutant or mock transductants (Figs 4F and S8). Similar results were obtained in assays of Ramos AID-mKO2-CDT1 and AID-mKO2-GEM transductants, which carry an mKO2 fluorescent tag which is degraded more rapidly than the mCherry tag (S8 Fig). Thus, the CDT1 tag accelerated AID-initiated SHM in Ramos B cells.
We assayed the effects of the tagged AID derivatives on CSR by transducing primary murine B cells with AID-mCherry, AID-mCherry-CDT1 or AID-mCherry-GEM retroviral expression constructs, and culturing cells in vitro with IL-4 and anti-CD40 to stimulate CSR. The mCherry signal in transduced primary B cells proved to be barely 10-fold higher than the background for FACS analysis (S9A Fig). This was not sufficiently high to permit HCS analysis, so instead we assayed the physiological outcome of expression of the tagged proteins. Among AID-mCherry-CDT1 transductants of primary stimulated B cells, a significantly greater average fraction of cells switched to IgG1+ (27%) than among AID-mCherry transductants (21%; p = 0.006) or AID-mCherry-GEM (18%; p = 0.026) transductants (Figs 4G and S9B). Thus, AID-mCherry-CDT1 expression accelerated Ig gene diversification, as evident by both an increased frequency of SHM in Ramos transductants and an increased frequency of CSR in primary B cell transductants.
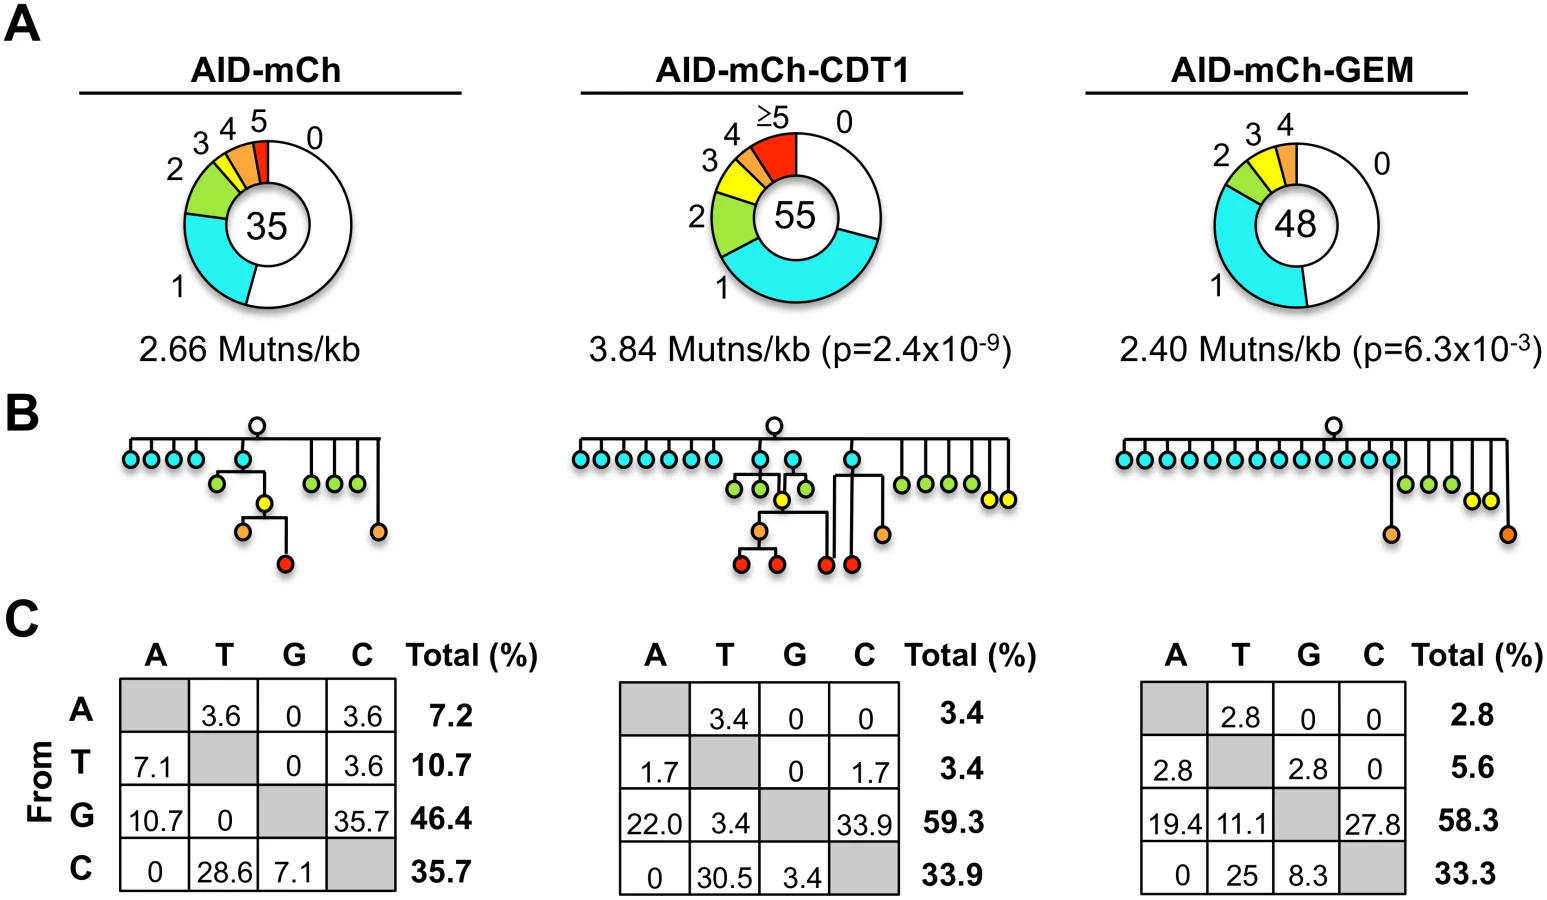
To determine frequencies and spectra of SHM, we sequenced IgVH regions amplified from single Ramos B cells (S10 Fig). AID-mCherry-CDT1 transductants accumulated more mutations and more mutations per V region than AID-mCherry transductants (p = 2.4x10⁻⁹; Fig 5A). Point mutations at G or C accounted for over 80% of mutations in all transductants, accompanied by a few deletions and insertions (S11 Fig), similar to other analyses of SHM in Ramos B cells and derivatives expressing AID-GFP [44–46]. Accelerated SHM was further evident in diagrams of mutant lineages (Fig 5B). Even though the total numbers of sequences analyzed was relatively small, some interesting features are still worth noting. There were fewer mutations at A or T in AID-mCherry-CDT1 or AID-mCherry-GEM transductants relative to AID-mCherry transductants (6.8%, 8.4% and 17.9%, respectively; Fig 5C); and the fraction of transversion mutations from G to T was greater in AID-mCherry-GEM than AID-mCherry or AID-mCherry-CDT1 transductants (11.1%, 0% and 3.4% respectively; Fig 5C).
Elevated nuclear AID is tolerated in G1 phase but not in S-G2/M phase cells
A nuclear AID-mCherry-CDT1 signal was evident in both G1 and S phase cells (Fig 4D). As AID is actively exported from the nucleus, this signal was likely to derive from protein that had been exported in G1 phase and re-entered in S phase and escaped proteolysis long enough to produce a signal. To test this, we analyzed spatiotemporal localization of derivatives carrying the well-characterized AIDF193A mutation which prevents nuclear export, and also reduces protein abundance and accelerates SHM [26]. Flow cytometry showed that expression of AIDF193A-mCherry, AIDF193A-mCherry-CDT1 or AIDF193A-mCherry-GEM did not disrupt the cell cycle profile in Ramos B cells (Fig 6A). Fluorescence microscopy identified clear nuclear signals in each transductant population, consistent with inhibition of nuclear export (Fig 6B). In the AIDF193A-mCherry-CDT1 transductant population, essentially no S-G2/M phase cells exhibited mCherry signal, in contrast to AID-mCherry-CDT1 transductants (cf. Figs 4A, 4D, 6A and 6D and S4 Table). This establishes that nuclear export and re-entry is the source of the AID-mCherry-CDT1 nuclear signal in S phase cells.

HCS analysis showed that total and cytoplasmic mCherry signals were significantly lower in AIDF193A-mCherry-CDT1 and AIDF193A-mCherry-GEM transductants than in AIDF193A-mCherry transductants, as predicted for tags that target the protein for nuclear degradation during a portion of cell cycle (S3 Table and Fig 6C). Comparison of AID-mCherry vs. AIDF193A-mCherry and AID-mCherry-GEM vs. AIDF193-mCherry-GEM transductants showed that the F193A mutation reduced total and cytoplasmic signals several-fold or more, and greatly increased nuclear signals; while signals were reduced to a lesser extent in AID-mCherry-CDT1 relative to AIDF193-mCherry-CDT1 transductants (cf. Figs 4C and 6C and S3 Table).
HCS further showed persistent nuclear localization of AIDF193A-mCherry and AIDF193A-mCherry-GEM in all phases of cell cycle, while nuclear localization of AIDF193A-mCherry-CDT1 occurred exclusively in G1 phase (S4 Table and Fig 6D). AIDF193A-mCherry and AIDF193A-mCherry-GEM transductants exhibited diminished cell viability, but AIDF193A-mCherry-CDT1 transductants proliferated robustly in several independent analyses (Figs 6E and S12). We conclude that cells tolerate high levels of nuclear AID in G1 phase, but not at other stages of cell cycle.
The Ramos AIDF193A-mCherry, AIDF193A-mCherry-CDT1 and AIDF193A-mCherry-GEM transductants all exhibited greatly elevated sIgM loss rates (Fig 6F), as previously documented for AIDF193A mutants [26]. CSR requires an intact AID C-terminal region [26,47], and consistent with this CSR to IgG1 was not accelerated in primary B cells expressing AID derivatives bearing the F193A mutation (Figs 6G and S9C). Notably, AIDF193A-mCherry-CDT1 was distinguished by its ability to accelerate SHM without vastly compromising cell viability. This will make AIDF193A-mCherry-CDT1 a useful tool for accelerating mutagenesis in platforms designed to optimize evolution of antibodies and other targets.
Discussion
We have shown that cell cycle regulates AID nuclear stability, and we have confirmed the importance of G1 phase in Ig gene diversification, previously suggested by several kinds of evidence [28–31]. We have identified regulatory phosphorylation at Ser3 as one determinant of nuclear stability, and we have shown that catalytic activity is one determinant of AID abundance. The CDT1 and GEM tags that we have used to regulate AID nuclear stability may be useful for studying other proteins, and they may have practical applications in engineering genes and proteins. The importance of cell cycle in normal regulation of AID suggests that dysregulation of this control could promote AID-initiated mutagenesis in cancer.
G1 phase is the sweet spot for AID-initiated mutagenesis
G1 phase nuclear AID accelerates SHM and CSR without compromising cell viability in G1 phase, but is not well-tolerated in S-G2/M phases. The ability of G1 phase cells to tolerate nuclear AID may reflect the relative efficiency of repair of AID-initiated nicks in G1 phase compared to later phases of cell cycle, as well as the potential for nicks to be converted to potentially deleterious replicative DSBs in S phase (Fig 7). AID deaminates C to generate U, which is repaired by UNG2 - or MSH2/6-dependent pathways which generate nicks (single-strand breaks) as critical intermediates (Fig 7A). The evidence that Ig gene diversification occurs in G1 phase [28–31] suggests that unrepaired nicks do not persist into S phase. DNA replication in S phase will convert a nick into a replicative DSB (Fig 7B), which can initiate a DNA damage response and activate checkpoints that prevent cell cycle progression [48]. S phase nuclear AID is therefore a potential source of replicative DSBs, and if these exceed the capacity for repair they can compromise cell proliferation.

The resilience of G1 phase cells to AID-initiated damage was especially evident in the AIDF193A-mCherry-CDT1 transductants. The design of this construct completely restricted nuclear AID to G1 phase, by combining the effect of the CDT1 tag with the F193A mutation, which prevents exported AID from re-entering the nucleus in S-G2/M phase. In contrast, other AID derivatives designed to accelerate SHM have exhibited a negative impact on cell viability, including other NES mutants [26,47], AID mutants selected for increased deamination activity [25,26,47] and the naturally occurring human AIDΔE5 dominant negative mutant [27].
Reduced viability was associated with the presence of nuclear AID in S phase, in AIDF193A-mCherry and AIDF193A-mCherry-GEM transductants (Fig 6D and 6E). We note that even though the GEM tag was predicted to restrict nuclear protein to S-G2/M phases, there was no nuclear AID-mCherry-GEM signal in any stage of cell cycle. In light of the evidence that nuclear AID is degraded more slowly in G1 than S or G2/M phase (Fig 2), it is likely that the AID-mCherry-GEM fusion protein was eliminated from the nucleus in G1 phase by degradation targeted to the GEM tag, and in S phase by degradation targeted to AID itself. AID has eight lysine targets for ubiquitination [20], and differential ubiquitination may be one source of temporal regulation.
Cell cycle regulation of the error-prone pathways that promote SHM may enhance repair of AID-initiated damage in G1 phase, and also explain some apparent differences in the SHM spectra of the different transductants. An especially high fraction of transversion mutations from G to T was evident in AID-mCherry-GEM transductants (11.1%) relative to AID-mCherry (0%) or AID-mCherry-CDT1 transductants (3.4%; Fig 5D), a class of mutations that can be generated by activity of Rev1 [49] or Polη [50]. In addition, a reduced frequency of mutations at A and T was evident in AID-mCherry-CDT1 (6.8%) and AID-mCherry-GEM (8.4%) relative to AID-mCherry transductants (17.9%; Fig 5). The reduced frequency of mutations at A and T argues against a predominant role for Polη, which is especially active at mutating at A and T [51], and makes Rev1 a more likely candidate for the G to T transversions in AID-mCherry-GEM transductants. This suggests that Rev1 may function late in cell cycle. Consistent with this, Rev1 has been shown to repair UV damage at gaps that persist into G2 phase [52].
The CDT1 tag destabilizes nuclear protein outside G1 phase [32] and would not be predicted to increase nuclear abundance at any stage of cell cycle. Nonetheless, AID-mCherry-CDT1 nuclear signal exceeded that of AID-mCherry (Fig 4C). This somewhat paradoxical result could be explained if the CDT1 tag prevented cytoplasmic retention [19] or enabled more efficient nuclear import. Consistent with the latter possibility, treatment with LMB or LMB+MG132 did cause a slightly more rapid increase in nuclear signal in AID-mCherry-CDT1 than AID-mCherry transductants (S7 Fig). In addition, AID may be regulated by feedback loops that determine nuclear levels in G1 phase based on the level in another compartment or stage of cell cycle. In that case, low levels of AID in G2/M phase may lead to elevated nuclear levels in the next G1 phase, as was evident in the AID-mCherry-CDT1 transductants (Fig 4D), favoring a cell that has not carried out Ig gene diversification in one cell cycle to do so in the next.
Phosphorylation and catalytic activity regulate AID abundance
AID Ser3 is a site of negative regulation, and phosphorylation at this position was previously shown to downregulate SHM and CSR [34]. By analysis of the phosphomimetic mutant, AIDS3D, we showed that modification at this position regulates AID nuclear abundance and the rate of AID nuclear degradation in G1 phase (Fig 3). Phosphorylation at this site is modulated by the protein phosphatase, PP2A, a key signaling molecule, targets of which include cell cycle regulators.
AID abundance also appears to be regulated by its catalytic activity. Both the nuclear and cytoplasmic signals of the AIDH56A-mCherry catalytic mutant were well below signals of wild type AID-mCherry (Fig 3). The Ramos AIDH56A-mCherry transductants express endogenous AID and hypermutate actively, so the reduced signal of the catalytic mutant must reflect a protein-intrinsic mechanism directed to the mutant protein. It is possible that sort of quality control mechanism may contribute to AID stability. Catalytically inactive AID may, for example, be a better target for ubiquitination.
The possibility that AID might be regulated by a feedback mechanism that reported on AID-induced DSBs was previously raised by Chaudhuri and collaborators, who claimed that a catalytically inactive AID double mutant, AIDH56R E58Q, was a poor substrate for Ser38 phosphorylation in B cells carrying out CSR [53]. Central to that claim was evidence of apparently reduced recovery of the Ser38-phosphorylated derivative of AIDH56R E58Q. AIDH56R E58Q bears amino acid substitutions at two residues at the catalytic active site. Reduced abundance of the AIDH56R E58Q was evident in data included in supplementary data accompanying that report but not commented on by the authors [53]. Our evidence for reduced abundance of the AIDH56A-mCherry catalytic mutant (Fig 3) provides an alternative explanation for poor recovery of Ser38-phosphorylated AIDH56R E58Q. It would be appropriate to revisit the claim that an ATM-dependent signal necessary for AID Ser38 phosphorylation requires DNA damage for induction [53] in experiments in which results are subjected to more rigorous quantification.
Several groups have reported that treatments that cause DSBs (ionizing radiation, etoposide) can induce nuclear localization of AID [24,53,54]. A DSB-dependent signal may be relevant to CSR, but unlikely to be relevant to SHM. The DNA intermediates in CSR carry DSBs, which initiate a DNA damage response mediated by γ-H2AX, which is essential to CSR [41,55]. In contrast, SHM intermediates contain DNA nicks, not DSBs (Fig 7); and γ-H2AX is not essential for SHM [56] or induced in hypermutating B cells.
Cell cycle tags are a powerful and practical tool
The CDT1 and GEM tags can be readily adapted to study repair in other contexts, and they also have potential practical utility. It has long been apparent that AID-initiated mutagenesis coupled with selection can in principle be used to optimize affinity or specificity of a variety of target proteins, including B and T cell receptors. However the complex regulation of AID has previously thwarted attempts to do so effectively. AIDF193A-mCherry-CDT1 and analogous AID derivatives should be useful in strategies that seek to evolve antibodies and other proteins ex vivo by iterative cycles of hypermutation and selection. Cell cycle tags may also be useful for optimizing activities of enzymes that act on DNA or RNA in the nuclease, including CRISPR/Cas9 and other nucleases used for genome engineering and gene correction.
Materials and Methods
Ethics statement
All experiments involving primary murine B cells were approved by the University of Washington Institutional Animal Care and Use Committee.
Expression constructs
The pEGFP-N3 construct for expression of AID-GFP was a gift from Dr. Javier Di Noia (Department of Microbiology and Immunology, University of Montreal, Montreal, Quebec, Canada). We substituted mCherry for a region of GFP flanked by ApaI and BsrGI restriction sites in the pEGFP-N3 construct to generate an AID-mCherry expression construct, pAID-mCh. Cell cycle reporter constructs p-mKO2-CDT1 CSII and p-mAG-GEM CSII, in a lentiviral vector, were a gift from Dr. Atsushi Miyawaki (Brain Science Institute, RIKEN, Hirosawa, Wako-city, Saitama 351–0198, Japan)
pAID-mCh CSII: We amplified AID-mCherry from pAID-mCh with primers PQL31, 5’-ATATCAATTGAGATCCCAAATGGACAGCC-3’ and PQL32, 5’-ATATTCTAGATTACTTGTACAGCTCGTCCATGC-3’, and inserted it between EcoRI and XbaI sites in p-mAG-GEM CSII, thereby replacing mAG-GEM with AID-mCherry.
pAID-mCh-CDT1 and pAID-mCh-GEM: We amplified CDT1 with primers PQL44 5’-TATATGTACAAGGGATATCCATCACACTGGCGGCC-3’ and PQL45 5’-TATATGTACATCTAGATTAGATGGTGTCCTGGTCC-3’ from p-mKO2-CDT1 CSII, and GEM with primers PQL44 5’-TATATGTACAAGGGATATCCATCACACTGGCGGCC-3’ and PQL46 5’ - TATATGTACATCTAGATTACAGCGCCTTTCTCCG-3’ from p-mAG-GEM CSII, and inserted the resulting fragments between BsrGI and XbaI restriction sites of pAID-mCh CSII.
pAID-mKO2-CDT1 and pAID-mKO2-GEM: We amplified mKO2 with primers mKO2 FOR 5’-ATATGGATCCATCGCCACCATGGTGAGTGTG-3’ and mKO2 REV 5’-ATATGCGGCCGCCAGTGTGATGGATATCCGC-3’, and inserted the resulting fragment between BamHI and NotI restriction sites in pAID-mCh-CDT1 or pAID-mCh-GEM CSII, respectively.
pAIDF193A-mCh-CDT1, pAIDF193A-mCh-CDT1 and pAIDF193A-mCh-GEM: F193A mutants were generated using QuikChange II XL Site-Directed Mutagenesis Kit (Agilent) with primer set, F193A FOR 5’-CTTACGAGACGCAGCTCGTACTTTGGGAC-3’ and F193A REV 5’-GTCCCAAAGTACGAGCTGCGTCTCGTAAG-3’.
pAIDS3A-mCh, pAIDS3D-mCh, pAIDS38A-mCh, pAIDS38D-mCh, pAIDH56A-mCh, pAIDH56R-mCh: Mutants were generated using QuikChange II XL Site-Directed Mutagenesis Kit (Agilent) with primer sets, S3A FOR 5’ - GATCCCAAATGGACGCCCTCTTGATGAACC -3’ and S3A REV 5’ - GGTTCATCAAGAGGGCGTCCATTTGGGATC -3’; S3D FOR 5’ - GATCCCAAATGGACGACCTCTTGATGAAC -3’ and S3D REV 5’ - GTTCATCAAGAGGTCGTCCATTTGGGATC -3’; S38A FOR 5’ - GTGAAGAGGCGTGACGCTGCTACATCCTTTTC -3’ and S38A REV 5’ - GAAAAGGATGTAGCAGCGTCACGCCTCTTCAC -3’; S38D FOR 5’ - GTGAAGAGGCGTGACGATGCTACATCCTTTTC -3’ and S38D REV 5’ - GAAAAGGATGTAGCATCGTCACGCCTCTTCAC -3’; H56A FOR 5’ - GAACGGCTGCGCCGTGGAATTGCTC -3’ and H56A REV 5’ - GAGCAATTCCACGGCGCAGCCGTTC -3’; H56R FOR 5’ - GAACGGCTGCCGCGTGGAATTGCTC -3’ and H56R REV 5’ - GAGCAATTCCACGCGGCAGCCGTTC -3’. The H56A catalytic mutant was shown to lack ability to initiate SHM using the sIgM loss assay (S8 Fig).
Lentivirus production
Lentiviral particles were produced using second-generation packaging plasmids in 293T cells. 293T cells were transfected with transfer vector, viral packaging vector (psPAX2), and viral envelope vector (pMD2G) at 4 : 2:1 ratio using Lipofectamine LTX (Life Technologies, Cat # 15338100) transfection as directed by manufacturer’s protocol. Viral particles were collected at 24hr and 48hr after transfection and passed through 0.22 μm membrane (Steriflip; EMD Millipore; Cat # SCGP00525). Virus particles were used without further concentration.
Cell culture and transduction
The human Burkitt lymphoma cell line, Ramos, was cultured in supplemented RPMI 1640 (Gibco), which contained 10% FBS, 2 mM L-glutamine, penicillin/ streptomycin, 1X non-essential amino acids (Gibco), 1 mM sodium pyruvate, and 10 mM HEPES. Lentiviral transductions used 2x10⁵ cells cultured in medium containing 8 μg/ml of polybrene. Following transduction, cells were cultured for 3–4 days and these recent transductants then sorted for mCherry+ to enrich for transduced cells, typically constituting 0.1–10% of the population. Cells were treated with leptomycin B (LMB; LC Laboratories) at 50 ng/ml and MG132 (Z-Leu-Leu-Leu-aldehyde; Sigma-Aldrich) at 50 μM.
Assays of cell cycle and viability
To determine cell cycle distribution by flow cytometry, cells were fixed, permeabilized with 0.5% Triton X-100, stained with DAPI (2 μg/ml) and analyzed by FACS. Viable cells were counted after trypan blue staining. Cell viability was confirmed by CellTiter-Glo Luminescent Cell Viability Assay (Promega).
High content screening (HCS) microscopy and analysis
Cells were fixed in 3.7% formaldehyde at a density of 2x10⁶ cells/ml and stained with whole cell stain (HCS CellMask, Invitrogen) and DAPI (0.2 μg/ml). Fixed cells were then washed, resuspended in PBS and spun down in a 96-well μclear microplate (Greiner Bio One) for imaging. Cells were imaged by Thermo Scientific ArrayScan VTI HCS reader, analyzing 3000–6000 cells in each treatment group. Cells with very low or very high mCherry signals were eliminated, gating based on the mock transduction control (low) and eliminating cells with signals more than 5 SD from the mean (high). Signal as determined by HCS is presented in arbitrary units, facilitating direct comparisons among different samples and different datasets.
The HCS Colocalization BioApplication protocol was used to determine nuclear and whole cell boundaries in individual cells as defined by DAPI and HCS CellMask, respectively, thereby defining the cytoplasmic region as the region between nuclear and whole cell boundaries. The average signal in the nuclear and cytoplasmic compartments was determined in individual cells by measuring the total intensity of mCherry signal divided by area within each compartment. The ratio of nuclear to cytoplasmic signal (N/C) was calculated as the ratio of the average signals of nuclear and cytoplasmic mCherry.
Confocal microscopy showed that AID-mCherry was mostly absent from the nucleus when out-of-focus signal was eliminated, regardless of the level of cytoplasmic signal (S13 Fig). HCS analysis of AID-mCherry transductants showed that nuclear AID-mCherry signals increased linearly with increasing cytoplasmic signals (slope of linear regression = 0.848; S14 Fig), consistent with a contribution of cytoplasmic signal from above or below the nucleus to the signal identified as nuclear by HCS. Thus in order to enable accurate comparisons of nuclear signals among AID-mCherry, AID-mCherry-CDT1, AID-mCherry-GEM, AIDF193A-mCherry, AIDF193A-mCherry-CDT1, and AIDF193A-mCherry-GEM transductants, the nuclear signal for each cell, as determined by HCS, was corrected by subtraction of the corresponding baseline value, as established by linear regression analysis of nuclear vs. cytoplasmic signals of untreated AID-mCherry transductants (S11 Fig), using the formula: Nuclear signal = (Nuclear signal)HCS - (0.848X +21.1).
Assays of sIgM loss frequency in Ramos B cell transductants
sIgM loss frequency provides a convenient surrogate assay for SHM (1, 2). To determine fractions of sIgM - cells, 2-5x10⁵ cells were fixed in 3.7% formaldehyde and stained with anti-human IgM (1 : 500, Southern Biotech), and sIgM - variants quantified by FACS as described [46]. To establish that selective pressure was not sufficient to affect the frequency of sIgM loss, we assayed loss of mCherry signal posttransduction (S15 Fig). There was modest loss of mCherry expression between days 3 and 7 in the AID-mCherry-CDT1 transductants (decrease from 37.2% to 31.3%), consistent with some selective pressure against AID-mCherry-CDT1 expression, but not sufficient to alter interpretation of the sIgM loss data.
Assay of CSR in primary splenic B cells
B cells were isolated from spleens of C57BL/6 mice and enriched through a negative selection in AUTOMACs with biotinylated anti-CD43 antibody (BD Pharmigen, Cat # 5532269) and streptavidin magnetic microbeads (Miltenyi Biotech, Cat # 130-048-102). Purified B cells were transduced for 24 hr in X-vivo medium (Lonza) containing 2 mM L-glutamine, 50 μM ß-mercaptoethanol, 5 ng/ml IL-4 (R&D Systems, cat# 404-ML-010) and 1 μg/mL anti-CD40 antibody (BioLegend, Cat# 102802) in 100 μl total volume in a round bottom 96-well plate, then transferred at 24 hr to supplemented RPMI (see above) containing 5 ng/ml IL-4 and 1 μg/ml anti-CD40 antibody. Cells were cultured for 4–5 days, stained with anti-IgG1 (FITC anti-mouse IgG1; BioLegend, Cat# 406605), and surface IgG1 quantified by flow-cytometry.
Single-cell PCR and sequencing of VH regions
At day 7 post sorting recent transductants for mCherry+ cells, single cells from AID-mCherry, AID-mCherry-CDT1 or AID-mCherry-GEM transductant populations were aliquoted, one cell per well, into 96-well plates containing 20 μl of Pfu reaction buffer (Agilent). Samples were frozen, thawed, and treated with 250 μg/ml proteinase K for 1 hr at 50°C then 5 min at 95°C, the primers and high-fidelity Pfu Turbo DNA polymerase (Agilent) were added and the rearranged VH region amplified by nested PCR with first round primers, RVHFOR QL 5’-TCCCAGGTGCAGCTACAGCAG-3’ and JOL48 QL 5’-GTACCTGAGGAGACGGTGACC-3’ [57]; followed by 1 : 30 dilution and second round amplification with primers 5’-AGGTGCAGCTACAGCAGTG-3’ and 5’-GCCCCAGACGTCCATACC-3’. Predicted sizes of PCR products were confirmed by gel electrophoresis and fragments purified and sequenced.
Supporting Information
Zdroje
1. Muramatsu M, Kinoshita K, Fagarasan S, Yamada S, Shinkai Y, Honjo T (2000) Class switch recombination and hypermutation require activation-induced cytidine deaminase (AID), a potential RNA editing enzyme. Cell 102 : 553–563. 11007474
2. Revy P, Muto T, Levy Y, Geissmann F, Plebani A, Sanal O, Catalan N, Forveille M, Dufourcq-Labelouse R, Gennery A, Tezcan I, Ersoy F, Kayserili H, Ugazio AG, Brousse N, Muramatsu M, Notarangelo LD, Kinoshita K, Honjo T, Fischer A, Durandy A (2000) Activation-induced cytidine deaminase (AID) deficiency causes the autosomal recessive form of the Hyper-IgM syndrome (HIGM2). Cell 102 : 565–575. 11007475
3. Maizels N (2005) Immunoglobulin gene diversification. Annu Rev Genet 39 : 23–46. 16285851
4. Di Noia JM, Neuberger MS (2007) Molecular mechanisms of antibody somatic hypermutation. Annu Rev Biochem 76 : 1–22. 17328676
5. Lee-Theilen M, Chaudhuri J (2010) Walking the AID tightrope. Nat Immunol 11 : 107–109. doi: 10.1038/ni0210-107 20084065
6. Gazumyan A, Bothmer A, Klein IA, Nussenzweig MC, McBride KM (2012) Activation-induced cytidine deaminase in antibody diversification and chromosome translocation. Adv Cancer Res 113 : 167–190. doi: 10.1016/B978-0-12-394280-7.00005-1 22429855
7. Robbiani DF, Nussenzweig MC (2013) Chromosome translocation, B cell lymphoma, and activation-induced cytidine deaminase. Annu Rev Pathol 8 : 79–103. doi: 10.1146/annurev-pathol-020712-164004 22974238
8. Morgan HD, Dean W, Coker HA, Reik W, Petersen-Mahrt SK (2004) Activation-induced cytidine deaminase deaminates 5-methylcytosine in DNA and is expressed in pluripotent tissues: implications for epigenetic reprogramming. J Biol Chem 279 : 52353–52360. 15448152
9. Popp C, Dean W, Feng S, Cokus SJ, Andrews S, Pellegrini M, Jacobsen SE, Reik W (2010) Genome-wide erasure of DNA methylation in mouse primordial germ cells is affected by AID deficiency. Nature 463 : 1101–1105. doi: 10.1038/nature08829 20098412
10. Bhutani N, Brady JJ, Damian M, Sacco A, Corbel SY, Blau HM (2010) Reprogramming towards pluripotency requires AID-dependent DNA demethylation. Nature 463 : 1042–1047. doi: 10.1038/nature08752 20027182
11. Munoz DP, Lee EL, Takayama S, Coppe JP, Heo SJ, Boffelli D, Di Noia JM, Martin DI (2013) Activation-induced cytidine deaminase (AID) is necessary for the epithelial-mesenchymal transition in mammary epithelial cells. Proc Natl Acad Sci U S A 110: E2977–2986. doi: 10.1073/pnas.1301021110 23882083
12. Kumar R, DiMenna L, Schrode N, Liu TC, Franck P, Munoz-Descalzo S, Hadjantonakis AK, Zarrin AA, Chaudhuri J, Elemento O, Evans T (2013) AID stabilizes stem-cell phenotype by removing epigenetic memory of pluripotency genes. Nature 500 : 89–92. doi: 10.1038/nature12299 23803762
13. Kuraoka M, Holl TM, Liao D, Womble M, Cain DW, Reynolds AE, Kelsoe G (2011) Activation-induced cytidine deaminase mediates central tolerance in B cells. Proc Natl Acad Sci U S A 108 : 11560–11565. doi: 10.1073/pnas.1102571108 21700885
14. Meyers G, Ng YS, Bannock JM, Lavoie A, Walter JE, Notarangelo LD, Kilic SS, Aksu G, Debre M, Rieux-Laucat F, Conley ME, Cunningham-Rundles C, Durandy A, Meffre E (2011) Activation-induced cytidine deaminase (AID) is required for B-cell tolerance in humans. Proc Natl Acad Sci U S A 108 : 11554–11559. doi: 10.1073/pnas.1102600108 21700883
15. Durandy A, Cantaert T, Kracker S, Meffre E (2013) Potential roles of activation-induced cytidine deaminase in promotion or prevention of autoimmunity in humans. Autoimmunity 46 : 148–156. doi: 10.3109/08916934.2012.750299 23215867
16. Zan H, Casali P (2013) Regulation of Aicda expression and AID activity. Autoimmunity 46 : 83–101. doi: 10.3109/08916934.2012.749244 23181381
17. Hasler J, Rada C, Neuberger MS (2012) The cytoplasmic AID complex. Semin Immunol 24 : 273–280. doi: 10.1016/j.smim.2012.05.004 22698843
18. Orthwein A, Di Noia JM (2012) Activation induced deaminase: how much and where? Semin Immunol 24 : 246–254. doi: 10.1016/j.smim.2012.05.001 22687198
19. Methot SP, Litzler LC, Trajtenberg F, Zahn A, Robert F, Pelletier J, Buschiazzo A, Magor BG, Di Noia JM (2015) Consecutive interactions with HSP90 and eEF1A underlie a functional maturation and storage pathway of AID in the cytoplasm. J Exp Med 212 : 581–596. doi: 10.1084/jem.20141157 25824822
20. Aoufouchi S, Faili A, Zober C, D'Orlando O, Weller S, Weill JC, Reynaud CA (2008) Proteasomal degradation restricts the nuclear lifespan of AID. J Exp Med 205 : 1357–1368. doi: 10.1084/jem.20070950 18474627
21. Orthwein A, Patenaude AM, Affar el B, Lamarre A, Young JC, Di Noia JM (2010) Regulation of activation-induced deaminase stability and antibody gene diversification by Hsp90. J Exp Med 207 : 2751–2765. doi: 10.1084/jem.20101321 21041454
22. McBride KM, Barreto V, Ramiro AR, Stavropoulos P, Nussenzweig MC (2004) Somatic hypermutation is limited by CRM1-dependent nuclear export of activation-induced deaminase. J Exp Med 199 : 1235–1244. 15117971
23. Ito S, Nagaoka H, Shinkura R, Begum N, Muramatsu M, Nakata M, Honjo T (2004) Activation-induced cytidine deaminase shuttles between nucleus and cytoplasm like apolipoprotein B mRNA editing catalytic polypeptide 1. Proc Natl Acad Sci U S A 101 : 1975–1980. 14769937
24. Brar SS, Watson M, Diaz M (2004) Activation-induced cytosine deaminase (AID) is actively exported out of the nucleus but retained by the induction of DNA breaks. J Biol Chem 279 : 26395–26401. 15087440
25. Wang M, Rada C, Neuberger MS (2010) Altering the spectrum of immunoglobulin V gene somatic hypermutation by modifying the active site of AID. J Exp Med 207 : 141–153. doi: 10.1084/jem.20092238 20048284
26. Geisberger R, Rada C, Neuberger MS (2009) The stability of AID and its function in class-switching are critically sensitive to the identity of its nuclear-export sequence. Proc Natl Acad Sci U S A 106 : 6736–6741. doi: 10.1073/pnas.0810808106 19351893
27. Zahn A, Eranki AK, Patenaude AM, Methot SP, Fifield H, Cortizas EM, Foster P, Imai K, Durandy A, Larijani M, Verdun RE, Di Noia JM (2014) Activation induced deaminase C-terminal domain links DNA breaks to end protection and repair during class switch recombination. Proc Natl Acad Sci U S A 111: E988–997. doi: 10.1073/pnas.1320486111 24591601
28. Ordinario EC, Yabuki M, Larson RP, Maizels N (2009) Temporal regulation of Ig gene diversification revealed by single-cell imaging. J Immunol 183 : 4545–4553. doi: 10.4049/jimmunol.0900673 19748985
29. Yabuki M, Ordinario EC, Cummings WJ, Fujii MM, Maizels N (2009) E2A acts in cis in G1 phase of cell cycle to promote Ig gene diversification. J Immunol 182 : 408–415. 19109172
30. Sharbeen G, Yee CW, Smith AL, Jolly CJ (2012) Ectopic restriction of DNA repair reveals that UNG2 excises AID-induced uracils predominantly or exclusively during G1 phase. J Exp Med 209 : 965–974. doi: 10.1084/jem.20112379 22529268
31. Yamane A, Robbiani DF, Resch W, Bothmer A, Nakahashi H, Oliveira T, Rommel PC, Brown EJ, Nussenzweig A, Nussenzweig MC, Casellas R (2013) RPA accumulation during class switch recombination represents 5'-3' DNA-end resection during the S-G2/M phase of the cell cycle. Cell Rep 3 : 138–147. doi: 10.1016/j.celrep.2012.12.006 23291097
32. Sakaue-Sawano A, Kurokawa H, Morimura T, Hanyu A, Hama H, Osawa H, Kashiwagi S, Fukami K, Miyata T, Miyoshi H, Imamura T, Ogawa M, Masai H, Miyawaki A (2008) Visualizing spatiotemporal dynamics of multicellular cell-cycle progression. Cell 132 : 487–498. doi: 10.1016/j.cell.2007.12.033 18267078
33. Li MM, Emerman M (2011) Polymorphism in human APOBEC3H affects a phenotype dominant for subcellular localization and antiviral activity. J Virol 85 : 8197–8207. doi: 10.1128/JVI.00624-11 21653666
34. Gazumyan A, Timachova K, Yuen G, Siden E, Di Virgilio M, Woo EM, Chait BT, Reina San-Martin B, Nussenzweig MC, McBride KM (2011) Amino-terminal phosphorylation of activation-induced cytidine deaminase suppresses c-myc/IgH translocation. Mol Cell Biol 31 : 442–449. doi: 10.1128/MCB.00349-10 21135131
35. Ciccone M, Calin GA, Perrotti D (2015) From the Biology of PP2A to the PADs for Therapy of Hematologic Malignancies. Front Oncol 5 : 21. doi: 10.3389/fonc.2015.00021 25763353
36. Basu U, Chaudhuri J, Alpert C, Dutt S, Ranganath S, Li G, Schrum JP, Manis JP, Alt FW (2005) The AID antibody diversification enzyme is regulated by protein kinase A phosphorylation. Nature 438 : 508–511. 16251902
37. Pasqualucci L, Kitaura Y, Gu H, Dalla-Favera R (2006) PKA-mediated phosphorylation regulates the function of activation-induced deaminase (AID) in B cells. Proc Natl Acad Sci U S A 103 : 395–400. 16387847
38. McBride KM, Gazumyan A, Woo EM, Schwickert TA, Chait BT, Nussenzweig MC (2008) Regulation of class switch recombination and somatic mutation by AID phosphorylation. J Exp Med 205 : 2585–2594. doi: 10.1084/jem.20081319 18838546
39. Basu U, Franklin A, Alt FW (2009) Post-translational regulation of activation-induced cytidine deaminase. Philos Trans R Soc Lond B Biol Sci 364 : 667–673. doi: 10.1098/rstb.2008.0194 19010772
40. Cheng HL, Vuong BQ, Basu U, Franklin A, Schwer B, Astarita J, Phan RT, Datta A, Manis J, Alt FW, Chaudhuri J (2009) Integrity of the AID serine-38 phosphorylation site is critical for class switch recombination and somatic hypermutation in mice. Proc Natl Acad Sci U S A 106 : 2717–2722. doi: 10.1073/pnas.0812304106 19196992
41. Polo SE, Jackson SP (2011) Dynamics of DNA damage response proteins at DNA breaks: a focus on protein modifications. Genes Dev 25 : 409–433. doi: 10.1101/gad.2021311 21363960
42. Conticello SG, Langlois MA, Yang Z, Neuberger MS (2007) DNA deamination in immunity: AID in the context of its APOBEC relatives. Adv Immunol 94 : 37–73. 17560271
43. Sideraki V, Wilson DK, Kurz LC, Quiocho FA, Rudolph FB (1996) Site-directed mutagenesis of histidine 238 in mouse adenosine deaminase: substitution of histidine 238 does not impede hydroxylate formation. Biochemistry 35 : 15019–15028. 8942668
44. Sale JE, Calandrini DM, Takata M, Takeda S, Neuberger MS (2001) Ablation of XRCC2/3 transforms immunoglobulin V gene conversion into somatic hypermutation. Nature 412 : 921–926. 11528482
45. Rada C, Jarvis JM, Milstein C (2002) AID-GFP chimeric protein increases hypermutation of Ig genes with no evidence of nuclear localization. Proc Natl Acad Sci U S A 99 : 7003–7008. 12011459
46. Yabuki M, Fujii MM, Maizels N (2005) The MRE11-RAD50-NBS1 complex accelerates somatic hypermutation and gene conversion of immunoglobulin variable regions. Nat Immunol 6 : 730–736. 15937485
47. Uchimura Y, Barton LF, Rada C, Neuberger MS (2011) REG-gamma associates with and modulates the abundance of nuclear activation-induced deaminase. J Exp Med 208 : 2385–2391. doi: 10.1084/jem.20110856 22042974
48. Mehta A, Haber JE (2014) Sources of DNA double-strand breaks and models of recombinational DNA repair. Cold Spring Harb Perspect Biol 6: a016428. doi: 10.1101/cshperspect.a016428 25104768
49. Jansen JG, Langerak P, Tsaalbi-Shtylik A, van den Berk P, Jacobs H, de Wind N (2006) Strand-biased defect in C/G transversions in hypermutating immunoglobulin genes in Rev1-deficient mice. J Exp Med 203 : 319–323. 16476771
50. Kano C, Hanaoka F, Wang JY (2012) Analysis of mice deficient in both REV1 catalytic activity and POLH reveals an unexpected role for POLH in the generation of C to G and G to C transversions during Ig gene hypermutation. Int Immunol 24 : 169–174. doi: 10.1093/intimm/dxr109 22223762
51. Masuda K, Ouchida R, Hikida M, Kurosaki T, Yokoi M, Masutani C, Seki M, Wood RD, Hanaoka F, OW J (2007) DNA polymerases eta and theta function in the same genetic pathway to generate mutations at A/T during somatic hypermutation of Ig genes. J Biol Chem 282 : 17387–17394. 17449470
52. Diamant N, Hendel A, Vered I, Carell T, Reissner T, de Wind N, Geacinov N, Livneh Z (2012) DNA damage bypass operates in the S and G2 phases of the cell cycle and exhibits differential mutagenicity. Nucleic Acids Res 40 : 170–180. doi: 10.1093/nar/gkr596 21908406
53. Vuong BQ, Herrick-Reynolds K, Vaidyanathan B, Pucella JN, Ucher AJ, Donghia NM, Gu X, Nicolas L, Nowak U, Rahman N, Strout MP, Mills KD, Stavnezer J, Chaudhuri J (2013) A DNA break - and phosphorylation-dependent positive feedback loop promotes immunoglobulin class-switch recombination. Nat Immunol 14 : 1183–1189. doi: 10.1038/ni.2732 24097111
54. Lambert LJ, Walker S, Feltham J, Lee HJ, Reik W, Houseley J (2013) Etoposide induces nuclear re-localisation of AID. PLoS One 8: e82110. doi: 10.1371/journal.pone.0082110 24324754
55. Ciccia A, Elledge SJ (2010) The DNA damage response: making it safe to play with knives. Mol Cell 40 : 179–204. doi: 10.1016/j.molcel.2010.09.019 20965415
56. Reina-San-Martin B, Difilippantonio S, Hanitsch L, Masilamani RF, Nussenzweig A, Nussenzweig MC (2003) H2AX is required for recombination between immunoglobulin switch regions but not for intra-switch region recombination or somatic hypermutation. J Exp Med 197 : 1767–1778. 12810694
57. Sale JE, Neuberger MS (1998) TdT-accessible breaks are scattered over the immunoglobulin V domain in a constitutively hypermutating B cell line. Immunity 9 : 859–869. 9881976
Štítky
Genetika Reprodukční medicínaČlánek vyšel v časopise
PLOS Genetics
2015 Číslo 9
- Kazuistika – Perspektivy využití precizované medicíny v rámci personalizované specifické terapie onkologických pacientů
- Nobelova cena za chemii pro genetické nůžky: Objev, který změní naši budoucnost?
- Technologie na bázi RNA v klinické praxi: od přebarvených petúnií k terapii vzácných a dosud jen obtížně léčitelných chorob u lidí
- „Nepředstavovali jsme si, že náš výzkum povede přímo ke vzniku nových léků, dokonce ještě za našeho života“
- Bezplatné služby pro diagnostiku ATTRv amyloidózy pro kardiology
Nejčtenější v tomto čísle
- Arabidopsis AtPLC2 Is a Primary Phosphoinositide-Specific Phospholipase C in Phosphoinositide Metabolism and the Endoplasmic Reticulum Stress Response
- Bridges Meristem and Organ Primordia Boundaries through , , and during Flower Development in
- KLK5 Inactivation Reverses Cutaneous Hallmarks of Netherton Syndrome
- XBP1-Independent UPR Pathways Suppress C/EBP-β Mediated Chondrocyte Differentiation in ER-Stress Related Skeletal Disease
Zvyšte si kvalifikaci online z pohodlí domova
Mazová zátka a její řešení
nový kurzVšechny kurzy