
Spatial Fluctuations in Expression of the Heterocyst Differentiation Regulatory Gene in Filaments
Under prolonged nitrogen deprivation, one-dimensional filaments of the multicellular cyanobacterium Anabaena undergo a process of development, forming a pattern consisting of cells specialized for nitrogen fixation-heterocysts-, separated by a chain of about ten photosynthetic vegetative cells. The developmental program uses activation, inhibition, and transport to create spatial and temporal patterns of gene expression, in the presence of unavoidable stochastic fluctuations in gene expression among cells. Using a chromosomally-encoded fluorescent marker, we followed the expression of the important regulator HetR in individual cells along filaments, both under abundant nitrogen conditions as well as at different times after nitrogen deprivation. The results of our statistical analysis of these fluctuations illuminate the fundamental role that positive feedback, lateral inhibition and cell-cell communication play in the developmental program, not only after exposure to the external cue that triggers differentiation but also under non-inducing conditions. Furthermore our results establish the spatial extent to which gene expression is correlated along filaments.
Published in the journal:
. PLoS Genet 11(4): e32767. doi:10.1371/journal.pgen.1005031
Category:
Research Article
doi:
https://doi.org/10.1371/journal.pgen.1005031
Summary
Under prolonged nitrogen deprivation, one-dimensional filaments of the multicellular cyanobacterium Anabaena undergo a process of development, forming a pattern consisting of cells specialized for nitrogen fixation-heterocysts-, separated by a chain of about ten photosynthetic vegetative cells. The developmental program uses activation, inhibition, and transport to create spatial and temporal patterns of gene expression, in the presence of unavoidable stochastic fluctuations in gene expression among cells. Using a chromosomally-encoded fluorescent marker, we followed the expression of the important regulator HetR in individual cells along filaments, both under abundant nitrogen conditions as well as at different times after nitrogen deprivation. The results of our statistical analysis of these fluctuations illuminate the fundamental role that positive feedback, lateral inhibition and cell-cell communication play in the developmental program, not only after exposure to the external cue that triggers differentiation but also under non-inducing conditions. Furthermore our results establish the spatial extent to which gene expression is correlated along filaments.
Introduction
In response to nitrogen deprivation, some nitrogen-fixing, photosynthetic cyanobacterial filaments such as those of the genera Anabaena and Nostoc undergo a process of development into a pattern consisting of single, specialized micro-oxic cells in which nitrogen fixation takes place-heterocysts-, separated by about 10–15 photosynthetic vegetative cells [1,2]. A one-dimensional, multicellular organism consisting of two types of cells with a clear division of labor is thereby formed. While neighboring cells can attain different developmental fates, cellular decisions may be driven by tiny differences in the concentrations of morphogens and other molecular species between cells [3]. These differences take place against the backdrop of the unavoidable cell-to-cell variability in gene expression between isogenic cells or noise [4,5]. Noise, extensively studied in unicellular organisms [6–8], has been shown to play a functional role in cellular decisions [9] and in the determination of developmental fates [10,11]. While noise may confer an advantage as an adaptive mechanism to changing environments [12], it must be tightly controlled during the development of a multicellular organism, in order to avoid its amplification and thus erroneous irreversible cell fates [13,14]. Unlike unicellular organisms, multicellular organisms can use cell-cell communication in order to control noise in gene expression. Evidence of such communication has been provided in the case of the Drosophila embryo, where spatial averaging in the level of the hunchback protein over ∼5 nuclei has been observed [15].
Intercellular communication is likely an important factor for determining heterocyst pattern formation [16–18]. Possible pathways for intercellular communication have recently been identified, and they include putative septal junction complexes of which the SepJ and FraC/FraD proteins are likely components [19,20].
The genetic cascade leading to heterocyst formation in cyanobacterial filaments is initiated by the NtcA transcription factor, which senses the low intracellular nitrogen concentration through the levels of 2-oxoglutarate [21]. The master regulator of differentiation HetR, which positively auto-regulates its own expression [22], is also induced early after nitrogen step-down in an NtcA-dependent way [23]. In contrast to those positive factors, an inhibitor of heterocyst differentiation at early times, PatS, and another inhibitor that is produced at later times, HetN, suppress the differentiation of vegetative cells into nitrogen-fixing heterocysts [18,24,25]. Both inhibitors share the amino acid motif ERGSGR in their sequence, which may act by inhibiting HetR [26–30]. Most work to date has focused on studying aspects of filament behavior following nitrogen deprivation, such as the changes in gene expression associated with the cellular differentiation decision, signal and metabolite transport along filaments, as well as the formation of the heterocyst pattern and its maintenance. In addition, statistical characterization of filaments following nitrogen deprivation has addressed primarily the fraction of heterocysts formed as well as the intervals between them, long after differentiation decisions have been made. The nature of the steady-state primordial fluctuations in gene expression along a filament under abundant nitrogen conditions, and those that build up on them at different times after combined nitrogen sources become scarce, eventually resulting in a fully developed pattern have not been studied to date.
In this paper we address these issues and characterize the noise of expression of the hetR gene, as well as the spatial correlations of expression between cells, in filaments of Anabaena sp. strain PCC 7120 (hereafter Anabaena) both under steady-state, abundant-nitrogen conditions, and at various times following nitrogen deprivation. To dissect the different contributions to variability, we studied expression fluctuations from a translational hetR-gfp fusion in wild-type filaments as well as in mutant backgrounds in which the PatS or HetN inhibitors are absent, backgrounds in which the transport between neighboring cells is potentially hindered, or when the positive auto-regulation of HetR is impaired. We found that key factors known to act during differentiation following nitrogen deprivation can also play a role before differentiation has been triggered, setting an underlying pattern of spatial correlations of gene expression along filaments, on which the developmental pattern may later be built. These correlations extend to two to three cells, setting the scale for cellular interactions along a filament. Moreover, we found evidence of the participation of an intercellular communication protein in setting these spatial correlations at specific times during differentiation.
Results
Experimental system
Our study was conducted using a chromosomal hetR-gfp fusion, thereby avoiding any contribution to fluctuations stemming from cell-cell variability in plasmid copy number, which would preclude accurate evaluation of both noise and cell-cell correlations in expression [18]. To study expression of the hetR gene, we have constructed a hetR-gfp fusion in which a DNA sequence encoding a tetra-glycine linker and the gfp-mut2 gene encoding a green fluorescent protein (GFP) were added after the 9th codon of the hetR gene in a DNA fragment containing about 1 kb 5’ from the hetR gene and the 5’ terminal 27 bp of hetR. As a reporter, a fusion to a fragment of the N-terminal part of the protein was constructed rather than a traditional transcriptional fusion because with the N-terminal translational fusion, expression of the gene with all its transcription and translation start signals is tested. This construct, cloned in vector pCSV3 that bears an SmR/SpR determinant (the Ω fragment [31]), was transferred by conjugation to different Anabaena strains with selection for resistance to streptomycin and spectinomycin. Recombination in the genomic region of homology results in the genomic structure shown in Fig. 1A, in which the fusion construct is placed downstream from the native hetR promoter and the hetR gene is located downstream from a 1-kb region that contains the whole hetR promoter [23,32]. Because the Ω fragment has transcriptional terminators at both its ends, no significant transcription comes out of pCSV3. The hetR-gfp fusion was transferred to wild-type Anabaena (WT) and mutant strains with deletions in the patS regulatory gene [33], in the hetN regulatory gene [27], in the sepJ gene encoding septal protein SepJ [19], and in the fraC and fraD genes encoding septal proteins FraC and FraD [20] (see Materials and Methods for details). In all the resulting strains, a native hetR gene is expressed. Additionally, the hetR-gfp fusion was transferred to a mutant lacking most of the hetR coding sequence, strain CSSC2 [34], permitting the study of hetR-gfp expression in the absence of a native HetR protein. As shown in Fig. 1B, readily appreciable green fluorescence was produced in the strain carrying the hetR-gfp fusion in a wild-type background. An important qualification for the interpretation of our results is that the GFP protein has been shown to remain in the cytoplasm of the producing cell [18,35]. GFPmut2 folds and matures within 5–30 min [36,37]. We will henceforth refer as WT or the corresponding gene mutations to the genetic backgrounds to which the hetR-gfp fusion has been added.

Distributions of hetR-gfp expression under nitrogen-rich conditions
A typical image of WT filaments exhibiting expression from the translational hetR-gfp fusion in cultures with ammonium as a nitrogen source is shown in Fig. 1B. Basal expression from a transcriptional hetR-gfp fusion under similar conditions has already been reported [38].
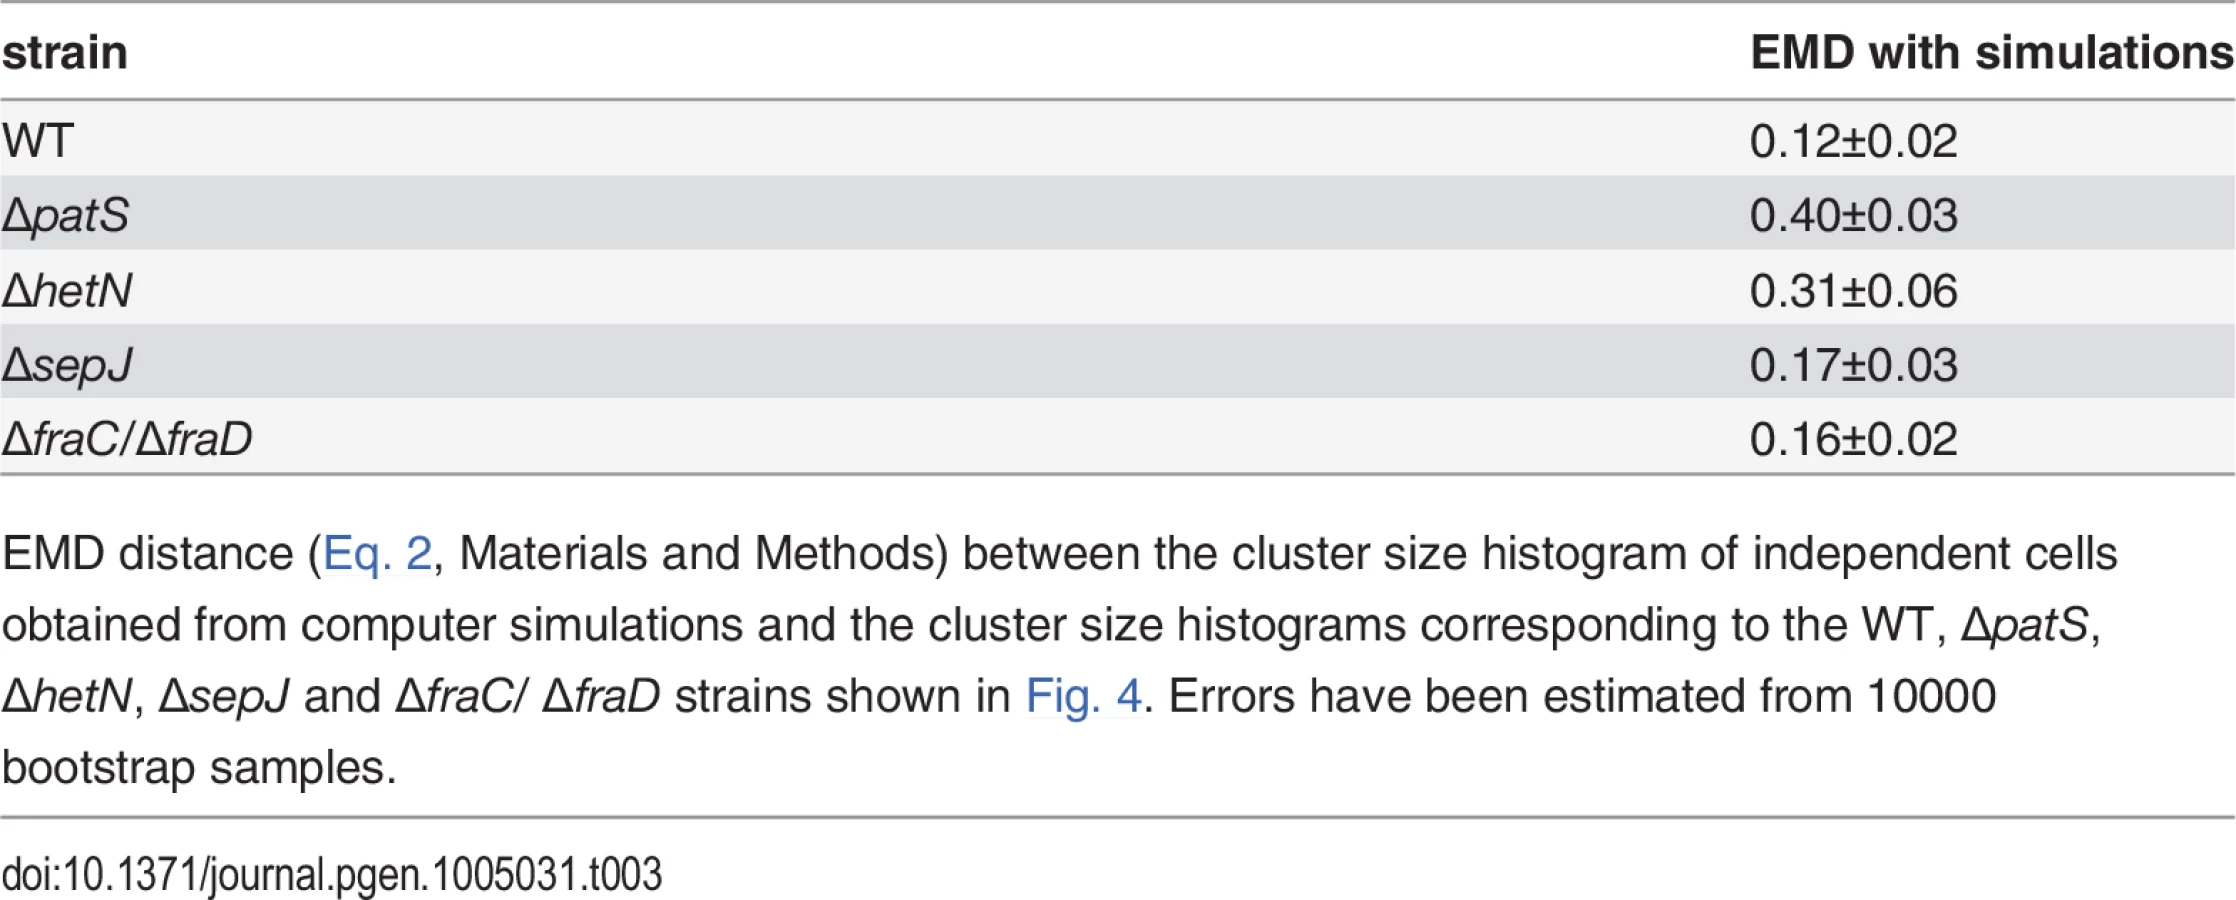
Normalized histograms of cell fluorescence of hetR-gfp under steady-state nitrogen-rich conditions are shown in Fig. 2 for a typical experimental run. The histograms of the ΔpatS and ΔsepJ mutants are significantly broader than the WT histogram, and their respective means ±std (18±8 and 19±7) larger than the WT’s (13±4). The histogram of ΔpatS exhibits a particularly long tail of high fluorescence values, which is consistent with a possible lack of inhibition of hetR expression. In contrast to the ΔpatS and ΔsepJ strains, mutants lacking either HetN, or the cell-cell junction proteins FraC/FraD, yield fluorescence distributions that are similar to that of the WT background. These similarities and differences are succinctly captured quantitatively by the Earth Mover’s Distance or EMD [39] (Table 1), a cross-bin metric to compare pairs of histograms (Eq. 2, Materials and Methods). The smaller the EMD, the larger is the similarity between the histograms. The histogram corresponding to the ΔhetR strain lacking HetR positive auto-regulation is narrower than that of the WT and all the other mutants, and the filaments display fluorescence values that are typically smaller than all other strains. This suggests that autoregulation of hetR is also at play under nitrogen-replete conditions.


Noise under nitrogen-rich conditions
The steady-state cell-to-cell variability in hetR expression, also called noise, is quantified by the non-dimensional ratio σp2/μp2 , where σp is the standard deviation and μp the mean hetR-gfp fluorescence distributions over filaments. The noise characterizing the different strains under the steady-state conditions of our experiments is shown in each panel in Fig. 2. The noise of hetR-gfp in the ΔpatS background is by far the largest among all strains, consistent with the wide range of hetR-gfp levels this strain displays (Fig. 2). The level of noise characterizing ΔsepJ filaments lies intermediate between those of the WT and the ΔpatS strains. In contrast, the strain lacking HetR exhibits the smallest level of noise. Lastly, the noise levels of expression of hetR-gfp in the strains ΔhetN and ΔfraC/ΔfraD are somewhat smaller from those of the WT background. We conclude that cell-to-cell fluctuations of the master regulator HetR in Anabaena are complex and include essential contributions from the developmental network even when the latter is not induced.
Correlations in the expression of HetR-GFP between neighboring cells under nitrogen-replete conditions
In contrast to unicellular organisms in which fluctuations in gene expression between different cells are independent [4], we expected to find correlations between the fluctuations in hetR-gfp expression in Anabaena along filaments (Fig. 1B). Spatial correlations are clearly brought out by scatter plots of the fluorescence f(n+1) of the n+1-th cell in a filament as function of the fluorescence f(n) of its nearest neighbor along all filaments, as shown for the different strains in Fig. 3A. The most salient feature in the scatter plots is the large spread of points in the cases of ΔpatS and ΔsepJ, relative to the WT, ΔhetN, ΔhetR and ΔfraC/ΔfraD, for which the scatter plots are rather similar. This similarity indicates that the effect of the basal activity of HetN on hetR-gfp expression is not significant under combined nitrogen, and that the possible distribution of a regulatory signal along filaments is not severely affected in the ΔfraC/ΔfraD mutant. The cigar shape of the scatter for ΔpatS (Pearson coefficient = 0.40) reveals a larger statistical tendency for nearest neighbors cells to have similar fluorescence than in the WT (Pearson coefficient = 0.25). In contrast, the observed tendency of some highly fluorescent cells to have weakly fluorescent neighbors in ΔsepJ filaments (Pearson coefficient = 0.05), suggests that expression fluctuations in this strain are less constrained than in the WT. However, the non-trivial distribution of points in the scatter plot for ΔsepJ hints that cells are not fully independent.
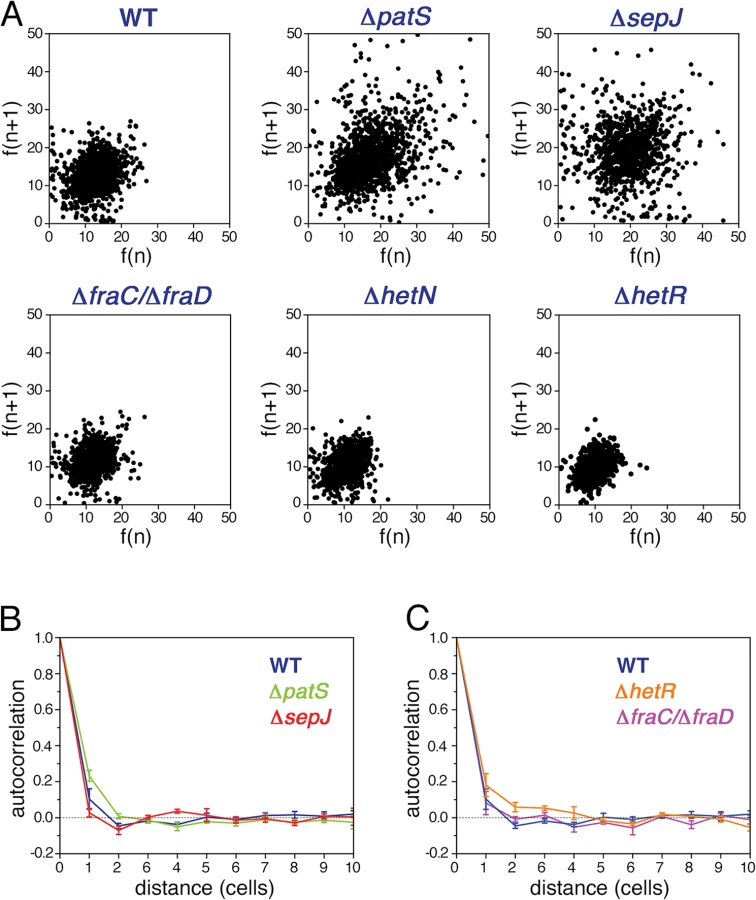
To measure the spatial extent over which fluctuations in different cells are correlated, we calculated the autocorrelation function of the HetR-GFP fluorescence g(n) as a function of the distance n between cells for each filament, and then averaged over all the filaments of the specific strain in the experimental run:

The small fluctuations of hetR-gfp expression that ΔhetR strain filaments display (Fig. 2) led us to expect a slower decay of its autocorrelation relative to the WT, as is indeed observed in Fig. 3C. Further analysis reveals that in this strain, differences of hetR-gfp expression between cells within individual filaments are so small that the principal contribution to expression variation across the cell population comes from inter-filament differences in expression. To quantify this, we first calculated the means of the fluorescence of all cells within each filament, and then computed the mean μf and standard deviation σf of these fluorescence means over all filaments to obtain the noise σf2/μf2 . We then compared σf2/μf2 to σp2/μp2f , obtained by calculating first the noise for each filament and then averaging over filaments. The ratio between σf2/μf2 and σp2/μp2f is 23±1% (mean±se) for all strains except for ΔhetR. In contrast, this ratio is equal to 61% for the ΔhetR strain. Thus, within ΔhetR filaments, cells display high similarity in hetR-gfp expression.
Spatial range of correlations in hetR-gfp expression
A two-point correlation function such as g(n) does not capture higher order correlations such as the recurrent observation of clusters of contiguous cells exhibiting GFP fluorescence values from hetR-gfp above a given threshold, as illustrated in the typical snapshot of WT in Fig. 1B. To investigate higher-order spatial correlations between contiguous cells, we made a binary representation of each filament by choosing a threshold value of fluorescence and dividing cells into two classes: those whose fluorescence is either smaller or larger than the threshold. Cells with fluorescence levels larger than the threshold were assigned the value of 1, while cells with smaller fluorescence levels than the threshold were assigned the value 0. We then evaluated the length of each cluster of contiguous 1’s and the distribution of cluster sizes. We show in Fig. 4 histograms of cluster sizes obtained when setting the fluorescence threshold as the value defining the upper 15 percentile of cells, for each of the histograms of Fig. 2 (this choice yields fluorescence threshold values that are close to those obtained when choosing the threshold as the value corresponding to the mean-plus-standard deviation of each distribution). The cluster size histograms for the WT, ΔhetN and ΔfraC/ΔfraD strains decay the fastest, whereas ΔpatS the slowest. To make a quantitative comparison between these histograms we calculated the statistic X2 (Eq. 3, Materials and Methods), which has approximately a χ2 distribution [41]. A perusal at Table 2 indicates that there is a significant likelihood that the cluster size histograms of the WT, ΔhetN and ΔfraC/ΔfraD come from the same distribution. In contrast, the cluster size histograms of the WT and ΔpatS differ significantly. The cluster size histogram of ΔsepJ is as different from that of the WT as from the ΔpatS histogram. Together, these facts highlight again the fundamental role that the PatS inhibitor plays in determining the fluctuations along a filament.


Comparing the fluctuations of cells in a WT filament with fluctuations in filaments consisting of independent cells
An alternative way to bring out the correlated character of hetR-gfp expression fluctuations along a filament is to measure the extent to which real filaments differ from filaments consisting of independent cells. To this end we simulated filaments of independent cells by generating finite strings of 20 cells, with ones thrown independently with probability p = 0.15 among zeroes (the Bernoulli problem, which in the infinite string limit yields the negative binomial distribution). We then calculated from the simulated filaments a cluster size histogram (Fig. 4). The EMD distance (Eq. 2, Materials and Methods) between this histogram and the histograms corresponding to the measured strains is shown in Table 3. We find that under nitrogen-replete conditions, the EMD distance between the independent-cell cluster size histogram and those of the WT and the strains in which septal proteins have been deleted are the smallest. In contrast, the EMD distance between the independent-cell cluster size histogram and that corresponding to ΔpatS is the largest.
Non-stationary fluctuations following nitrogen deprivation
To explore the possibility that the fluctuations in gene expression measured under nitrogen-replete conditions provide the background over which cell-to-cell variations build up during the development process, we have carried out an analysis of fluctuations of hetR-gfp expression at different times following nitrogen deprivation. Histograms of fluorescence values and scatter plots of nearest neighbors three hours following nitrogen deprivation (Figs. 5 and 6), display similar behavior to the corresponding histograms and scatter plots measured under nitrogen-replete conditions. However, seven hours after nitrogen step-down, changes in the spatial distribution of fluorescence values are clearly discernible: there is a marked tendency for some pairs of adjacent cells to display high and low fluorescence values, in contrast to the similar fluorescence values displayed by nearest-neighboring cells three hours after nitrogen step-down (Fig. 6A). It is also noteworthy that 7 hours after nitrogen step-down the behaviors of ΔsepJ and ΔfraC/ΔfraD are quite different: whereas ΔsepJ filaments have cells in which hetR-gfp is highly expressed and there is an anti-correlation between the fluorescence values of hetR-gfp in adjacent cells, the fluorescence values in ΔfraC/ΔfraD filaments are lower and comparable to the WT. Furthermore, in the ΔfraC/ΔfraD filaments, no anticorrelation is observed between the expression in nearest-neighbor cells as at 3 hours. The behaviors displayed by ΔsepJ and ΔfraC/ΔfraD strains become similar 24 hours after nitrogen step-down: both strains display long tails of high fluorescence values in their histograms and nearest-neighbor pairs of cells behave in a comparable fashion, in contrast to the different behavior displayed by the two strains in assays using non-physiological fluorescent molecules [20]. Moreover, the behavior of these mutants, which lack putative septal proteins, differs significantly from both the WT and the mutants ΔpatS and ΔhetN. Indeed, the EMD values between the WT and all the mutants, displayed in the panels corresponding to 24 hours (Fig. 5) confirm this. Finally, we note that in the ΔhetR strain, the expression of hetR-gfp following nitrogen step-down does not change significantly from that under nitrogen-replete conditions (S2 Fig.).

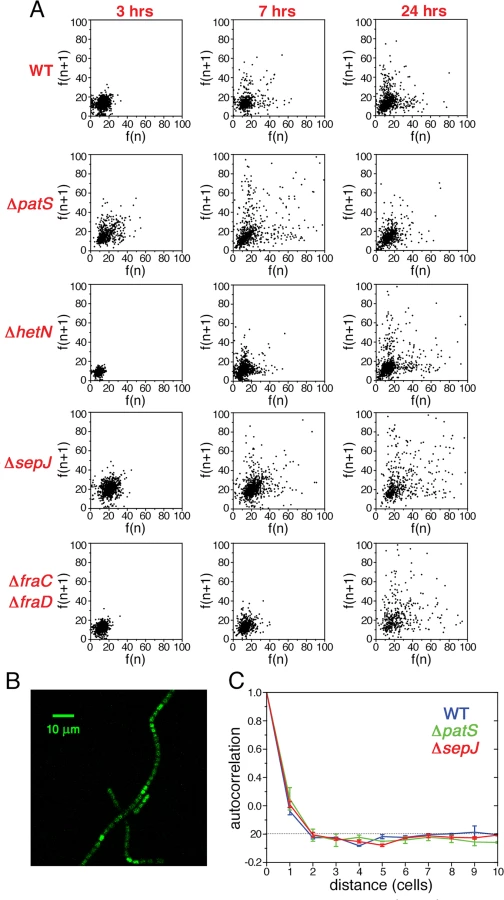
To capture the changes in expression fluctuations when a pattern commences to emerge, as illustrated in Fig. 6B, we have calculated the autocorrelation as a function of distance g(n) for the WT, ΔpatS and ΔsepJ strains, at 7 hours after nitrogen step-down (Fig. 6C). This time is close to the time of commitment to differentiation [24]. Remarkably, there is a significant increase in correlation both for the WT and the ΔsepJ strains for n ≤ 2, while not for the ΔpatS strain, when compared to ammonium-replete conditions. The respective autocorrelation functions are undistinguishable within experimental error, in spite of noticeable differences in the respective scatter plots.
Discussion
In an organism with no specific limit to the number of its cells and on which morphogen gradient fields are not imposed from the outside such as in Drosophila, a developmental pattern can arise from fluctuations in gene expression and activation-inhibition mechanisms such as originally envisioned by Turing [42]. Variations in gene expression between cells play a key role in determining cellular decisions during developmental processes [14,43]. Here we have characterized the variability and spatial distribution of hetR-gfp expression levels along Anabaena filaments, both under nitrogen-replete and nitrogen-poor conditions. We have further calculated for the first time correlations between the expression levels in cells along filaments and the spatial extent to which these levels are coupled. Several important features emerge from our study.
Notably, we found that the variability in the basal state of hetR expression under nitrogen-replete conditions is governed to a large extent by important factors of the developmental network, even if the latter is not induced. Many of our experimental observations support the notion of basal expression of a PatS-derived peptide and/or its transport between cells. First, the average expression level and the variability in the ΔpatS strain are higher than in the WT. While the higher mean in the ΔpatS strain points to an inhibitory effect of PatS, the broader distribution of expression can be accounted for by the fact that the negative feedback loop of PatS on HetR is broken. Second, the spatial autocorrelation of expression levels as function of the separation between cells decays slower in the ΔpatS strain than in the WT, showing that the effect of basal PatS expression is to anti-correlate the expression of hetR-gfp between neighboring cells. Third, the clusters of contiguous cells exhibiting hetR-gfp expression above a threshold are larger in the ΔpatS strain than in the WT. Together, these analyses support the notion that PatS or a derivative thereof is transferred between neighboring cells, consistently with results obtained with filaments that have already sensed nitrogen deprivation [18,30,33]. In contrast, basal expression of the long-term inhibitor HetN, if significant, does not show detectable effects on the expression of the hetR-gfp translational fusion and its fluctuations under combined nitrogen-rich conditions. At late times following nitrogen step-down, the effects of deleting patS or hetN are similar as seen in the respective fluorescence histograms. This is in line with the late-time activation of this gene for pattern maintenance purposes [25,27] (see Fig. 7).

We investigated two mutant strains, ΔsepJ and ΔfraC/ΔfraD, both of which lack proteins that are thought to contribute to intercellular septal junction complexes and cell-cell communication [19,20,44]. Specifically, we inquired whether the coupling of expression fluctuations of hetR-gfp between neighboring cells is impaired in these mutants, and if so, to what extent expression fluctuations in neighboring cells are independent of one another. We found that the ΔsepJ mutant’s behavior is markedly different from the wild type both under nitrogen-replete conditions, as well as at early and late times after nitrogen deprivation. The putative cell-cell transport of an active PatS-derived peptide would account for the behaviors of the ΔsepJ and the ΔpatS strains under nitrogen-rich conditions. In the ΔsepJ strain, transport hindrance of such peptide does not smooth out hetR-gfp expression fluctuations between cells, thereby increasing cell-to-cell variability relative to the WT, as observed. The transport of a PatS-derived signal may also account for the slower decay of the autocorrelation function in the ΔpatS background relative to the WT, while in the ΔsepJ strain it decays faster under nitrogen-rich conditions. We stress that the nature of the regulators transferred through the SepJ-containing septal junction complexes is as yet unknown and remains to be directly established. However, the behaviors of the ΔpatS and ΔsepJ strains observed in the present work are consistent with cell-cell transfer of the active PatS peptide through SepJ-containing septal junction complexes. It has been recently reported that inactivation of sepJ caused a significant decrease in the signal range of hetN expressed from source cells via an inducible promoter on plasmids, but not of patS [45]. The differences between these results and ours may be reconciled by the prolonged production of PatS in that study, whereas our results reflect native conditions.
In contrast to ΔsepJ, the ΔfraC/ΔfraD mutant strain’s behavior is very similar to the WT, both under nitrogen-replete conditions and at early times after nitrogen step-down (e.g at 7 hours). This is surprising given that FraC and FraD assist in focusing SepJ to cell-cell junctions [44]. It is possible that in a ΔfraC/ΔfraD background, the SepJ molecules still present in the septum suffice to allow the transfer necessary to establish the observed correlations under combined nitrogen conditions [20]. In contrast, the behavior of the ΔsepJ and ΔfraC/ΔfraD mutant strains becomes comparable 24 hours after nitrogen step-down. These data suggest that FraC/FraD proteins are involved in the late time transport of specific metabolic and/or regulatory factors that may be different from those transported by SepJ, negatively impacting hetR expression in neighboring cells (Fig. 7). Previous transport assays on both ΔsepJ and ΔfraC/ΔfraD mutant strains using calcein or 5-carboxyfluorescein have shown differences in the intercellular transfer of these fluorescent tracers [20]. Although deletion of septal proteins could be expected to result in filaments in which gene expression fluctuations in cells behave independently, we found that correlations consistently persist. This is supported by the fact that none of the autocorrelation functions corresponding to the different genetic backgrounds tested display behavior expected for filaments of independent cells.
The spatial autocorrelation function of hetR-gfp expression along filaments shows that correlations between neighboring cells die out after two to three cells, a range of correlations that is shorter than the characteristic scale of developmental patterns. This sets the scale for cellular interactions along a filament under nitrogen-replete conditions. We stress that the dominant part of the observed correlations must derive from intercellular molecular transfer: had the measured correlations been due exclusively to cell division, there would be no difference between the autocorrelation functions pertaining to the different mutant strains. No differences in growth under permissive conditions (in the presence of ammonium) between the mutants have been noticed. Moreover, following nitrogen deprivation, our experiments do not reach steady diazotrophic growth under which differences in growth rate among mutants would be observed. Importantly, at intermediate stages after the developmental cue e.g. 7 hours, this correlation length has not appreciably changed. For comparison, the diffusion gradients of a PatS-derived peptide, a candidate factor mediating correlations between cells were recently measured 8 hours after nitrogen step-down, yielding about five cells [33]. Note that hetR gene expression levels are not a proxy for a PatS signal. Interestingly, evidence for the transfer of a HetN-derived signal with a range of approximately 10 cells, measured in filaments engineered to produce HetN from an inducible promoter, has recently been reported [45]. Induction for 72 hours resulted in HetN production from a number of contiguous cells, most likely with higher levels than in a native system, which may explain the larger signal range reported. The direct evidence for correlated expression between neighboring cells in Anabaena, revealed here for the first time, precludes the usual decomposition of noise into intrinsic and extrinsic components that is common in studies of unicellular organisms such as bacteria and yeast [4,46]. Another manifestation of the correlations between cells is the expression of hetR-gfp in contiguous cells along filaments. Our observations show that these clusters already exist under nitrogen-rich conditions, whereas previous investigations had shown that the differentiation process initiates in small clusters of cells that are later resolved into single heterocysts, after the environmental cue is given [24].
A mutant lacking hetR exhibits a much lower level of fluctuations of hetR-gfp expression, both under nitrogen-rich and nitrogen-poor conditions. These results can be accounted for by an attribute of HetR, namely auto-regulation, a mechanism that enhances fluctuations [47,48], which is known to operate under nitrogen deprivation [22]. This notion is supported by the significant reduction in noise in the ΔhetR strain, the slow decay of the corresponding autocorrelation function, and by the fact that the distribution of fluorescence values does not change appreciably following nitrogen step-down. Together, these findings suggest that positive auto-regulation is essential to build up the large levels of HetR needed for progression of differentiation in some cells and not in others, consistent with the lack of heterocyst formation in this mutant [22,49].
Our measurements of the statistical properties of fluctuations in gene expression of hetR-gfp well after the developmental network has sensed nitrogen step-down, but possibly before a final commitment has been established show that the primordial fluctuations under nitrogen-rich conditions and those at early times after nitrogen step-down, e.g. 3 hours, are statistically similar. This suggests that there is continuity between the two, and fluctuations found once the developmental network has been triggered, build up from those under nitrogen-rich conditions. At later times, 7 hours after nitrogen step-down, alterations in the spatial pattern of expression fluctuations can be discerned. The significant increase observed at small distances in the autocorrelation functions for the WT and ΔsepJ strains points to enhanced, concerted hetR expression in small subsets of contiguous cells as a dominant feature. This effect may result in part by the amplification of hetR clusters of high expression already existing under nitrogen-replete conditions, through positive auto-regulation. In contrast, the correspondingly small increase of the autocorrelation function for ΔpatS may be due to the fact that clusters of high expression in this strain were already broader under nitrogen-replete conditions, given the lack of inhibition by PatS. A two-stage model of development in heterocyst-forming cyanobacteria has been proposed [50]. This model posits that during a first stage, only a subset of cells are transiently more likely than others to initiate differentiation prior or at the signal for nitrogen starvation [51]. During the second stage-competitive resolution - the competition between hetR expression and a PatS-derived peptide selects one cell among a cluster of contiguous cells of enhanced hetR expression to differentiate. The observed increase in positive correlations at small distances in the correlation functions provides direct statistical support for the existence of the second stage, namely competitive resolution.
To sum up, we have provided direct evidence for the coupling of gene expression fluctuations between cells in Anabaena filaments, prior and following nitrogen step-down. The range over which expression in neighboring cells is correlated, two to three cells, is smaller than the characteristic scale of fully developed patterns. Our results show that fluctuations can build up from an underlying pattern of expression under nitrogen-replete conditions in which important regulators are already expressed, and evolve to intermediate states in which fluctuations are positively correlated in clusters of cells. These latter resolve after commitment into single heterocysts using lateral inhibition, supporting a two-stage model of development. Therefore, expression fluctuations are key determinants in the decision of cells whether to differentiate or not, together with other factors such as cell division and biased inheritance of specific factors [51], as well as the marked tendency for heterocysts to form at the ends of finite filaments, thereby imposing a strong constraint on the phase of the patterns that form. We have further shown by a novel approach that important information can be garnered about functional properties of specific components of a developmental network, by characterizing the expression fluctuations of a master regulator under steady-state, non-induced conditions and after induction. The analysis brings out the different roles and specificity of inter-cellular communication proteins in setting spatial correlations, before and during development. Future studies of the coupling of gene expression fluctuations between cells in Anabaena and other organisms, using similar approaches, will shed light on other functions and on the way signals propagate during developmental processes as they occur.
Materials and Methods
Strains
Anabaena sp. (also known as Nostoc sp.) strain PCC 7120 and derived strains were grown photoautotrophically as described previously[33]. For construction of a fusion of hetR to the gfp-mut2 gene, a DNA fragment was amplified using Anabaena DNA as template and primer pair alr2339–12/alr2339–36, the latter containing a sequence encoding a GGGG linker preceded by a NheI site. (Primer sequences: alr2339–12, 5’ AACTCTGGACTTCTGGCT 3’; alr2339–36, 5’ GCTAGCACCTCCACCGCCCTTGATCAGATCGATGT 3’.) The PCR product was cloned in pSPARK (Canvax), corroborated by sequencing and transferred to pCSAL33, which bears the gfp-mut2 sequence preceded by a NheI site, and the resulting hetR-gfp-mut2 construct was transferred to pCSV3 to produce plasmid pCSL68. The final construct bears a sequence of 1025 bp that comprises the hetR promoter and 27 bp of the 5’ end of the hetR ORF linked to the gfp-mut2 gene by a sequence encoding four glycines. Plasmid pCSL68 was transferred to Anabaena sp. by conjugation, which was performed as described [52]. Clones resistant to streptomycin (Sm) and spectinomycin dihydrochloride pentahydrate (Sp) were selected and their genomic structure was tested by PCR. Periodically-performed PCR analysis indicated that the strains were stable, not showing wild-type chromosomes, in ammonium-containing medium supplemented with antibiotics. The Anabaena strains used as recipients in the conjugations were the wild-type PCC 7120, producing strain CSL64; CSVT20 (patS deletion mutant [33]), producing strain CSL65; CSL7 (hetN deletion mutant [27]), producing strain CSL66; CSSC2 (hetR deletion mutant[34]), producing strain CSL86; CSVM34 (sepJ deletion mutant [19]), producing strain CSVM10; and CSVT22 (fraC fraD deletion mutant [20]), producing strain CSVM11.
Experiments
For experiments carried out under steady-state nitrogen-rich conditions, cells were taken from bubbled batch cultures in BG110 medium with ammonium at 8–10 mM NH4Cl and, respectively, 16–20 mM TES-NaOH buffer (pH 7.5), and 10 mM NaHCO3 were supplemented with 1% CO2 in air. When required, antibiotics, streptomycin sulfate and spectinomycin dihydrochloride pentahydrate, were added to the media at final concentrations of 2 μg mL-1 for liquid and 5 μgmL-1 for solid media. Cultures were grown for 48 to 72 hrs in this medium as reported previously [27]. A sufficient concentration of ammonium (2–5 mM as determined with the Nessler reagent [53]) remained up to the time of sampling. For experimental runs performed under nitrogen deprivation, batch cultures grown with ammonium were harvested, washed with BG110 medium and incubated in this medium with bicarbonate and CO2 as above. No antibiotics were added to the cultures incubated without combined nitrogen.
Samples taken from the cultures were set atop a thin slice of solidified medium in order to visualize the cells of the filaments in the same plane. The filaments were visualized using an immersion objective CX PL APO lambda blue 63.0x1.40 OIL UV objective in Leica SP5 microscope. Samples were excited at 488 nm using an argon laser. Fluorescence was monitored in the range 500–540 nm (GFP imaging) and 630–700 nm (cyanobacterial autofluorescence).
Image segmentation. All image processing and data analysis were performed using MATLAB (MathWorks). Cell recognition was performed on fluorescent images of cells using a program developed in our laboratory. In short, the program applies an adaptive threshold on the fluorescent images and check for the size of each cell, if the cell is bigger than a typical sized cell, the program increase the threshold for this cell. Using the adaptive threshold enable cells to be segmented correctly even with large variations in fluorescent intensity within each frame. The program’s output was checked manually in all experiments using bright-field images of the same frames, and corrected for errors in recognition. After segmentation, cells were manually separated and ordered into filaments. The average fluorescent from each cell was then extracted into Origin for statistical analysis.
Data corpus: Each experimental run for each strain consisted of 1350±350 (mean±std) cells, comprising 104±35 (mean±std) filaments. The minimal filament length analyzed was of 8 cells or longer.
Statistical analysis. Statistical comparisons between histograms of fluorescence were carried out using the Earth Mover’s Distance algorithm [39]. For one-dimensional histograms {xi}, {yi} of n bins, the Earth Mover’s Distance EMD(X,Y) is given by:


DKS = supi|CDX(i) – CDY(i)| The EMD is therefore a more intuitive measure to compare two histograms.
Comparisons between non-normalized cluster size histograms were carried out by computing the statistic:

Supporting Information
Zdroje
1. Flores E, Herrero A. Compartmentalized function through cell differentiation in filamentous cyanobacteria. Nat Rev Microbiol. 2010; 8 : 39–50. doi: 10.1038/nrmicro2242 19966815
2. Kumar K, Mella-Herrera RA, Golden JW Cyanobacterial heterocysts. Cold Spring Harb Perspect Biol. pp. a000315. 2010.
3. Wolpert L. Positional information and the spatial pattern of cellular differentiation. J Theor Biol. 1969; 25 : 1–47. 4390734
4. Elowitz MB, Levine AJ, Siggia ED, Swain PS. Stochastic gene expression in a single cell. Science. 2002; 297 : 1183–1186. 12183631
5. Raser J, O'Shea E. Noise in gene expression: Origins, consequences, and control. Science. 2005; 309 : 2010–2013. 16179466
6. Arbel-Goren R, Tal A, Friedlander T, Meshner S, Costantino N, et al. Effects of Post-Transcriptional Regulation on Phenotypic Noise in E. coli. Nucleic Acids Res. 2013; 41 : 4825–4834. doi: 10.1093/nar/gkt184 23519613
7. Bar-Even A, Paulsson J, Maheshri N, Carmi M, O'Shea E, et al. Noise in protein expression scales with natural protein abundance. Nat Genet. 2006; 38 : 636–643. 16715097
8. Taniguchi Y, Choi PJ, Li GW, Chen H, Babu M, et al. Quantifying E. coli proteome and transcriptome with single-molecule sensitivity in single cells. Science. 2010; 329 : 533–538. doi: 10.1126/science.1188308 20671182
9. Zeng L, Skinner SO, Zong C, Sippy J, Feiss M, et al. Decision making at a subcellular level determines the outcome of bacteriophage infection. Cell. 2010; 141 : 682–691. doi: 10.1016/j.cell.2010.03.034 20478257
10. Suel GM, Kulkarni RP, Dworkin J, Garcia-Ojalvo J, Elowitz MB. Tunability and noise dependence in differentiation dynamics. Science. 2007; 315 : 1716–1719. 17379809
11. Wernet MF, Mazzoni EO, Celik A, Duncan DM, Duncan I, et al. Stochastic spineless expression creates the retinal mosaic for colour vision. Nature. 2006; 440 : 174–180. 16525464
12. Lopez-Maury L, Marguerat S, Bahler J. Tuning gene expression to changing environments: from rapid responses to evolutionary adaptation. Nat Rev Genet. 2008; 9 : 583–593. doi: 10.1038/nrg2398 18591982
13. Arias AM, Hayward P. Filtering transcriptional noise during development: concepts and mechanisms. Nat Rev Genet. 2006; 7 : 34–44. 16369570
14. Balazsi G, van Oudenaarden A, Collins JJ. Cellular decision making and biological noise: from microbes to mammals. Cell. 2011; 144 : 910–925. doi: 10.1016/j.cell.2011.01.030 21414483
15. Gregor T, Tank DW, Wieschaus EF, Bialek W. Probing the limits to positional information. Cell. 2007; 130 : 153–164. 17632062
16. Wolk CP. Physiological basis of the pattern of vegetative growth of a blue-green alga. Proc Natl Acad Sci U S A. 1967; 57 : 1246–1251. 5231730
17. Wolk CP, Quine MP. Formation of one-dimensional patterns by stochastic processes and by filamentous blue-green algae. Dev Biol. 1975; 46 : 370–382. 810378
18. Yoon HS, Golden JW. Heterocyst pattern formation controlled by a diffusible peptide. Science. 1998; 282 : 935–938. 9794762
19. Mariscal V, Herrero A, Nenninger A, Mullineaux CW, Flores E. Functional dissection of the three-domain SepJ protein joining the cells in cyanobacterial trichomes. Mol Microbiol. 2011; 79 : 1077–1088. doi: 10.1111/j.1365-2958.2010.07508.x 21299655
20. Merino-Puerto V, Schwarz H, Maldener I, Mariscal V, Mullineaux CW, et al. FraC/FraD-dependent intercellular molecular exchange in the filaments of a heterocyst-forming cyanobacterium, Anabaena sp. Mol Microbiol. 2011; 82 : 87–98. doi: 10.1111/j.1365-2958.2011.07797.x 21819458
21. Herrero A, Picossi S, Flores E. Gene expression during heterocyst differentiation. Adv Bot Res. 2013; 65 : 281–329.
22. Black TA, Cai Y, Wolk CP. Spatial expression and autoregulation of hetR, a gene involved in the control of heterocyst development in Anabaena. Mol Micro. 1993; 9 : 77–84.
23. Muro-Pastor AM, Valladares A, Flores E, Herrero A. Mutual dependence of the expression of the cell differentiation regulatory protein HetR and the global nitrogen regulator NtcA during heterocyst development. Mol Microbiol. 2002; 44 : 1377–1385. 12068814
24. Yoon HS, Golden JW. PatS and products of nitrogen fixation control heterocyst pattern. J Bacteriol. 2001; 183 : 2605–2613. 11274121
25. Callahan SM, Buikema WJ. The role of HetN in maintenance of the heterocyst pattern in Anabaena sp. PCC 7120. Mol Microbiol. 2001; 40 : 941–950. 11401701
26. Higa KC, Rajagopalan R, Risser DD, Rivers OS, Tom SK, et al. The RGSGR amino acid motif of the intercellular signalling protein, HetN, is required for patterning of heterocysts in Anabaena sp. strain PCC 7120. Mol Microbiol. 2012; 83 : 682–693. doi: 10.1111/j.1365-2958.2011.07949.x 22220907
27. Corrales-Guerrero L, Mariscal V, Nurnberg DJ, Elhai J, Mullineaux CW, et al. Subcellular localization and clues for the function of the HetN factor influencing heterocyst distribution in Anabaena sp. strain PCC 7120. J Bacteriol. 2014; 196 : 3452–3460. doi: 10.1128/JB.01922-14 25049089
28. Khudyakov IY, Golden JW. Different functions of HetR, a master regulator of heterocyst differentiation in Anabaena sp. PCC 7120, can be separated by mutation. Proc Natl Acad Sci USA. 2004; 101 : 16040–16045. 15520378
29. Huang X, Dong Y, Zhao J HetR homodimer is a DNA-binding protein required for heterocyst differentiation, and the DNA-binding activity is inhibited by PatS. Proc Natl Acad Sci; 2004.
30. Risser DD, Callahan SM. Genetic and cytological evidence that heterocyst patterning is regulated by inhibitor gradients that promote activator decay. Proc Natl Acad Sci USA. 2009; 106 : 19884–19888. doi: 10.1073/pnas.0909152106 19897721
31. Prentki P, Krisch HM. In vitro insertional mutagenesis with a selectable DNA fragment. Gene. 1984; 29 : 303–313. 6237955
32. Buikema WJ, Haselkorn R. Expression of the Anabaena hetR gene from a copper-regulated promoter leads to heterocyst differentiation under repressing conditions. Proc Natl Acad Sci. 2001; 98 : 2729–2734. 11226308
33. Corrales-Guerrero L, Mariscal V, Flores E, Herrero A. Functional dissection and evidence for intercellular transfer of the heterocyst-differentiation PatS morphogen. Mol Microbiol. 2013; 88 : 1093–1105. doi: 10.1111/mmi.12244 23663167
34. Camargo S, Valladares A, Flores E, Herrero A. Transcription activation by NtcA in the absence of consensus NtcA-binding sites in an anabaena heterocyst differentiation gene promoter. J Bacteriol. 2012; 194 : 2939–2948. doi: 10.1128/JB.05994-11 22467790
35. Mariscal V, Herrero A, Flores E. Continuous periplasm in a filamentous, heterocyst-forming cyanobacterium. Mol Micro. 2007; 65 : 1139–1145. 17645442
36. Zaslaver A, Bren A, Ronen M, Itzkovitz S, Kikoin I, et al. A comprehensive library of fluorescent transcriptional reporters for Escherichia coli. Nat Methods. 2006; 3 : 623–628. 16862137
37. Fisher AC, DeLisa MP. Laboratory evolution of fast-folding green fluorescent protein using secretory pathway quality control. PLoS One. 2008; 3: e2351. doi: 10.1371/journal.pone.0002351 18545653
38. Asai H, Iwamori S, Kawai K, Ehira S, Ishihara J, et al. Cyanobacterial cell lineage analysis of the spatiotemporal hetR expression profile during heterocyst pattern formation in Anabaena sp. PCC 7120. PLoS One. 2009; 4: e7371. doi: 10.1371/journal.pone.0007371 19823574
39. Rubner Y, Tomasi C, Guibas LJ. The Earth Mover's Distance as a metric for image retrieval. Int Jour Comp Vision. 2000; 40 : 99–121.
40. Fuller WA Introduction to Statistical Time Series. New York: Wiley; 1976.
41. Cramer H Mathematical Methods of Statistics. Princeton: Princeton University Press; 1999.
42. Turing AM. The chemical basis of morphogenesis. Philos Trans R Soc Lond B. 1952; 237 : 37–72.
43. Eldar A, Elowitz MB. Functional roles for noise in genetic circuits. Nature. 2010; 467 : 167–173. doi: 10.1038/nature09326 20829787
44. Merino-Puerto V, Mariscal V, Mullineaux CW, Herrero A, Flores E. Fra proteins influencing filament integrity, diazotrophy and localization of septal protein SepJ in the heterocyst-forming cyanobacterium Anabaena sp. Mol Micro. 2010; 75 : 1159–1170.
45. Rivers OS, Videau P, Callahan SM. Mutation of sepJ reduces the intercellular signal range of a hetN-dependent paracrine signal, but not of a patS-dependent signal, in the filamentous cyanobacterium Anabaena sp. strain PCC 7120. Mol Microbiol. 2014.
46. Raser JM, O'Shea EK. Control of stochasticity in eukaryotic gene expression. Science. 2004; 304 : 1811–1814. 15166317
47. Delbruck M. Statistical fluctuations in autocatalytic reactions. J Chem Phys. 1945; 8 : 120–124.
48. Epstein IR. The consequences of imperfect mixing in autocatalytic chemical and biological systems. Nature. 1995; 374 : 321–327. 7885470
49. Buikema WJ, Haselkorn R. Characterization of a gene controlling heterocyst differentiation in the cyanobacterium Anabaena 7120. Genes Dev. 1991; 5 : 321–330. 1840555
50. Meeks JC, Elhai J. Regulation of cellular differentiation in filamentous cyanobacteria in free-living and plant-associated symbiotic growth states. Microbiol Mol Biol R. 2002; 66 : 94–121. 11875129
51. Risser DD, Wong FC, Meeks JC. Biased inheritance of the protein PatN frees vegetative cells to initiate patterned heterocyst differentiation. Proc Natl Acad Sci U S A. 2012; 109 : 15342–15347. 22949631
52. Elhai J, Vepritskiy A, Muro-Pastor AM, Flores E, Wolk CP. Reduction of conjugal transfer efficiency by three restriction activities of Anabaena sp. strain PCC 7120. J Bacteriol. 1997; 179 : 1998–2005. 9068647
53. Conway EJ Microdiffusion Analysis and Volumetric Error. 5th ed. London: Crosby Lockwood; 1962.
Štítky
Genetika Reprodukční medicínaČlánek vyšel v časopise
PLOS Genetics
2015 Číslo 4
- Kazuistika – Perspektivy využití precizované medicíny v rámci personalizované specifické terapie onkologických pacientů
- Nobelova cena za chemii pro genetické nůžky: Objev, který změní naši budoucnost?
- Technologie na bázi RNA v klinické praxi: od přebarvených petúnií k terapii vzácných a dosud jen obtížně léčitelných chorob u lidí
- „Nepředstavovali jsme si, že náš výzkum povede přímo ke vzniku nových léků, dokonce ještě za našeho života“
- Bezplatné služby pro diagnostiku ATTRv amyloidózy pro kardiology
Nejčtenější v tomto čísle
- Lack of GDAP1 Induces Neuronal Calcium and Mitochondrial Defects in a Knockout Mouse Model of Charcot-Marie-Tooth Neuropathy
- Proteolysis of Virulence Regulator ToxR Is Associated with Entry of into a Dormant State
- Frameshift Variant Associated with Novel Hoof Specific Phenotype in Connemara Ponies
- Ataxin-2 Regulates Translation in a New BAC-SCA2 Transgenic Mouse Model
Zvyšte si kvalifikaci online z pohodlí domova
Mazová zátka a její řešení
nový kurzVšechny kurzy