
Genome-Wide Diet-Gene Interaction Analyses for Risk of Colorectal Cancer
High intake of red and processed meat and low intake of fruits, vegetables and fiber are associated with a higher risk of colorectal cancer. We investigate if the effect of these dietary factors on colorectal cancer risk is modified by common genetic variants across the genome (total of about 2.7 million genetic variants), also known as gene-diet interactions. We included over 9,000 colorectal cancer cases and 9,000 controls that were not diagnosed with colorectal cancer. Our results provide strong evidence for a gene-diet interaction and colorectal cancer risk between a genetic variant (rs4143094) on chromosome 10p14 near the gene GATA3 and processed meat consumption (p = 8.7E-09). This genetic locus may have interesting biological significance given its location in the genome. Our results suggest that genetic variants may interact with diet and in combination affect colorectal cancer risk, which may have important implications for personalized cancer care and provide novel insights into prevention strategies.
Published in the journal:
. PLoS Genet 10(4): e32767. doi:10.1371/journal.pgen.1004228
Category:
Research Article
doi:
https://doi.org/10.1371/journal.pgen.1004228
Summary
High intake of red and processed meat and low intake of fruits, vegetables and fiber are associated with a higher risk of colorectal cancer. We investigate if the effect of these dietary factors on colorectal cancer risk is modified by common genetic variants across the genome (total of about 2.7 million genetic variants), also known as gene-diet interactions. We included over 9,000 colorectal cancer cases and 9,000 controls that were not diagnosed with colorectal cancer. Our results provide strong evidence for a gene-diet interaction and colorectal cancer risk between a genetic variant (rs4143094) on chromosome 10p14 near the gene GATA3 and processed meat consumption (p = 8.7E-09). This genetic locus may have interesting biological significance given its location in the genome. Our results suggest that genetic variants may interact with diet and in combination affect colorectal cancer risk, which may have important implications for personalized cancer care and provide novel insights into prevention strategies.
Introduction
Colorectal cancer is the third most common neoplasm and the third leading cause of cancer death in both men and women across most ethnic-racial groups [1]. Intake of various dietary factors, most notably, meat, fruits/vegetables, and fiber, have been extensively investigated in relation to colorectal cancer risk. Overall, the evidence suggests that consumption of red and processed meat modestly increase the risk of colorectal cancer [2], [3]; and fruits [4], vegetables [4], [5], and fiber [6]–[8] decrease risk, although these associations have not been observed across all studies [2], [9], [10], perhaps due to methodological differences and unaccounted modifying effects.
More recently, studies have focused on the potential modifying effects of common genetic variants, single nucleotide polymorphisms (SNPs), on the relationship between dietary factors and risk of colorectal cancer. However, attention has largely focused on candidate SNPs in genes directly involved in the metabolism of selected nutrients; for example, metabolism of B-vitamins [11], key nutrients found in fruits and vegetables; or the metabolism of carcinogenic by-products resulting from cooking or processing of meat [12]. From these candidate gene/pathway-approaches, few genetic variants have been consistently identified and further investigation is warranted.
Large datasets from genome-wide association studies of colorectal cancer are now available for a comprehensive analysis of gene-diet interactions on the risk of colorectal cancer. To date, one genome-wide study of gene-diet interactions focusing on microsatellite stable/microsatellite-instability low colorectal cancer (1,191 cases, 990 controls) reported no statistically significant gene-diet interactions after replication in an independent dataset [13]. The authors highlighted the need for collaborative consortia to increase sample size, with central quality control procedures and careful standardization and harmonization of definitions and measurements. Hutter et al., using data from the Genetics and Epidemiology of Colorectal Cancer Consortium (GECCO) on 7,106 colorectal cancer cases and 9,723 controls from 9 studies focused on 10 previously identified colorectal cancer-susceptibility loci and conducted a systematic search for interaction with selected lifestyle and dietary factors. The strongest statistical evidence was observed for interaction for vegetable consumption and rs16892766, located on chromosome 8q23.3 near the EIF3H and UTP23 genes (p = 1.3E-04) [14].
In this large combined analysis using GECCO from 10 case-control and nested cohort studies comprising 9,287 colorectal cancer cases and 9,120 controls, we build upon these previous reports [13], [14] to examine over 2.7 million common polymorphisms for multiplicative interactions with selected dietary factors (red meat, processed meat, fiber, fruit and vegetables) and risk of colorectal cancer. For our primary analyses we used conventional case-control logistic regression that included an interaction term as well as our recently developed Cocktail method, which integrates several novel GxE methods to improve statistical power under various scenarios [15].
Results
Characteristics of the 10 studies are described in Table S1. Mean intake and quartile cut points of each dietary factor per study are provided in Table S2 and S3. Across all studies we observed an increase in colorectal cancer risk for red meat consumption (ORper quartile = 1.15,p = 1.6E-18) and processed meat consumption (ORper quartile = 1.11,p = 4.2E-09). Decreased colorectal cancer risk was observed for vegetable intake (ORper quartile = 0.93, p = 8.2E-05), fruit intake (ORper quartile = 0.93, p = 1.9E-05) and fiber intake (ORper quartile = 0.91, p = 5.6E-05, Figure 1).

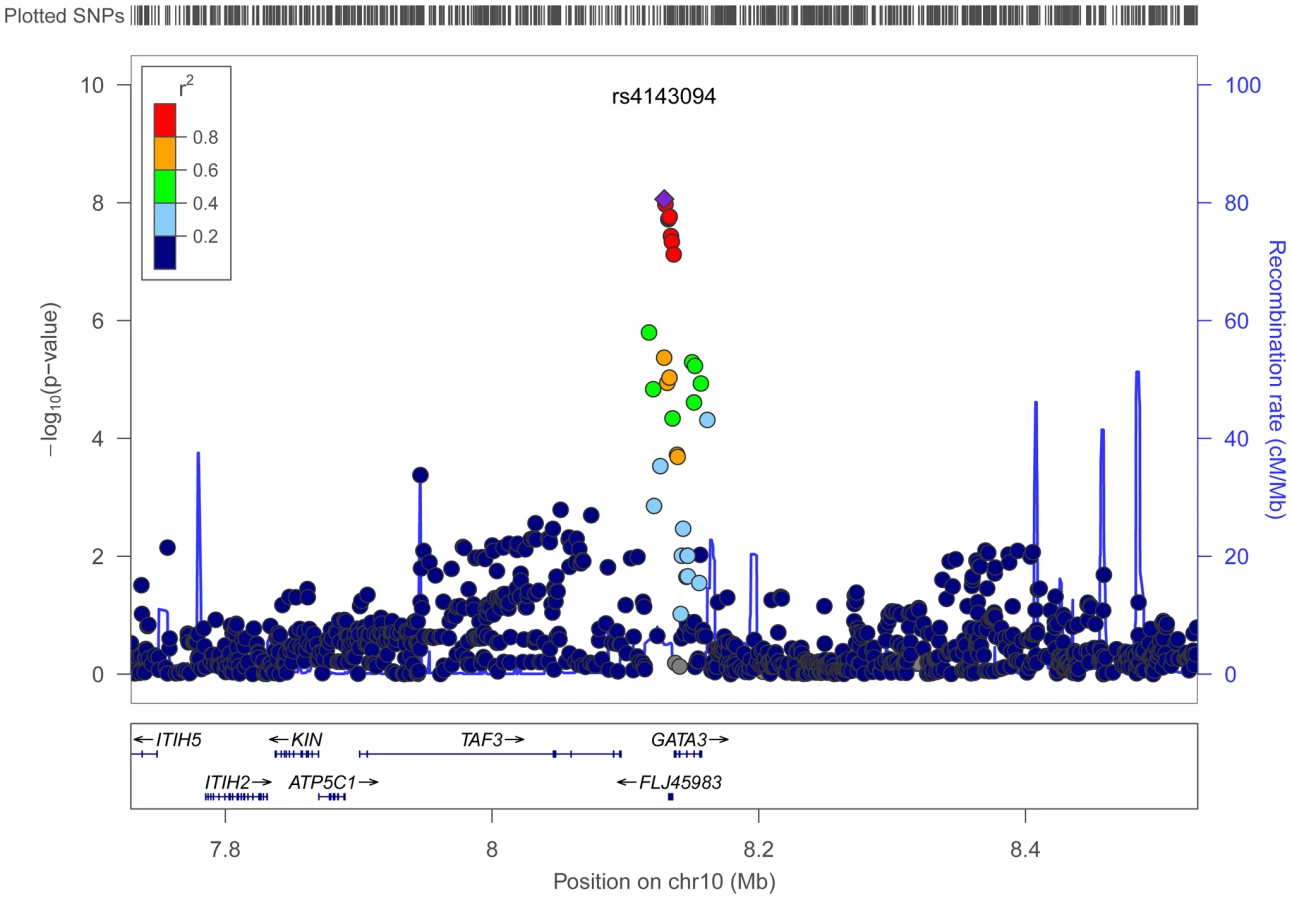
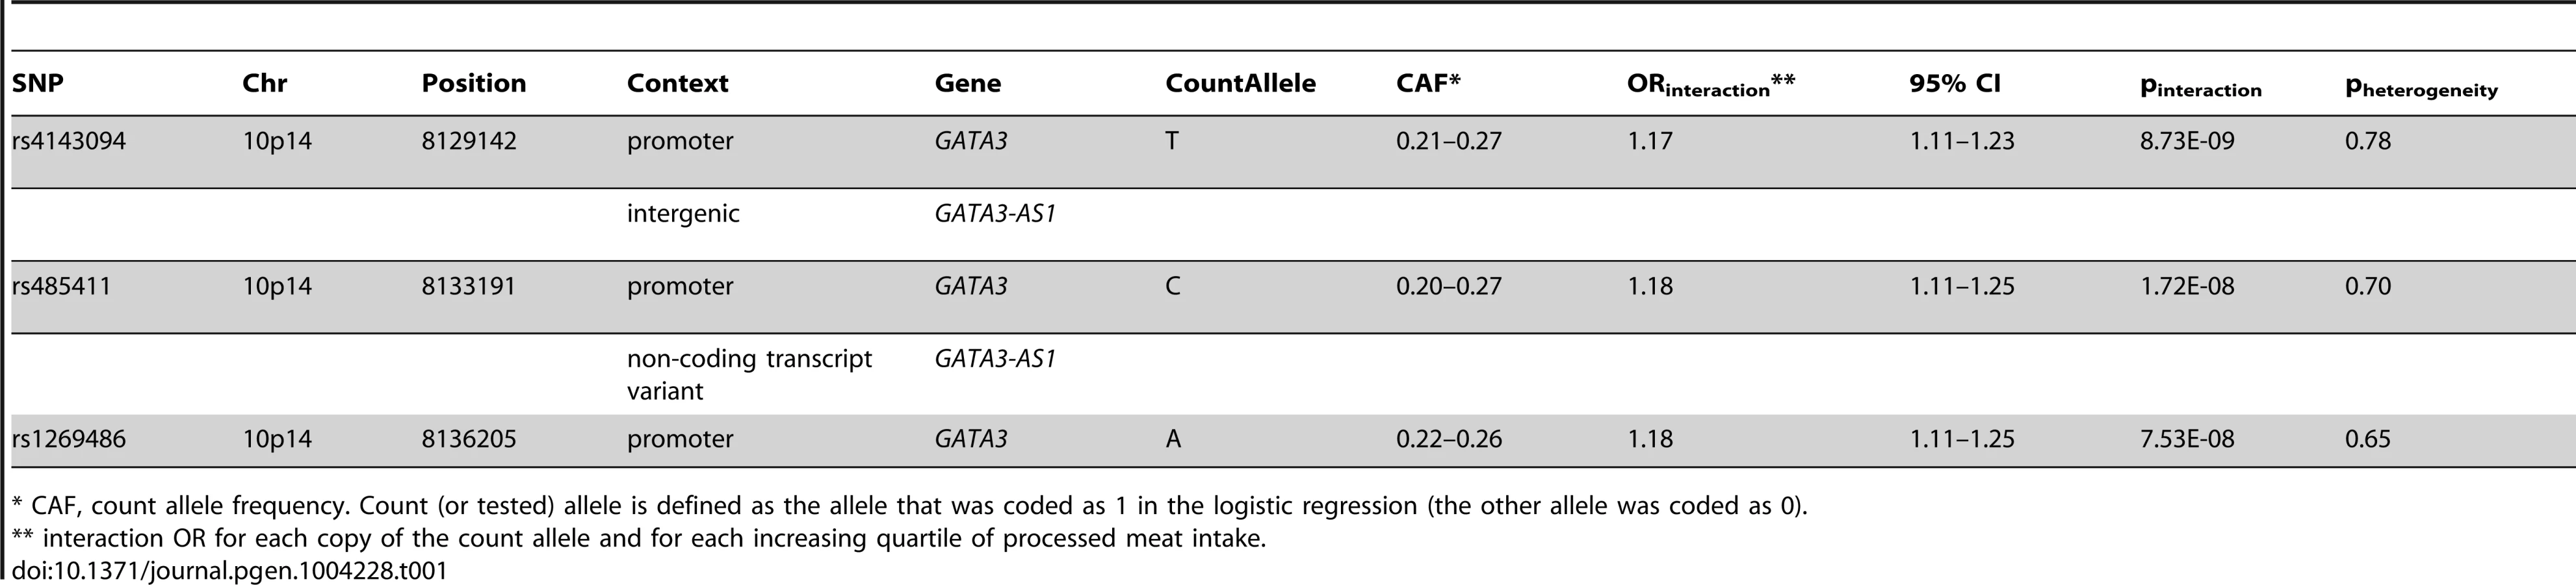
Using conventional case-control logistic regression to test for multiplicative interactions we identified a genome-wide significant interaction between variants at chromosome 10p14 and processed meat (Table 1). Within the 10p14 region rs4143094 showed the most significant interaction with processed meat (ORinteraction for each copy of T-allele and increasing quartile of processed meat = 1.17, p = 8.73E-09, Table 1 and Figure 2), with no evidence of heterogeneity (pheterogeneity = 0.78). This SNP (rs4143094), as well as correlated SNPs surrounding the rs4143094 SNP, indicate a strong signal peak in the 10p14 region near the GATA3 gene; as expected SNPs less correlated with rs4143094 show less significant interactions (Figure 3). Stratified by genotype, the risk for colorectal cancer associated with each increasing quartile of processed meat was increased in individuals with the rs4143094-TG and -TT genotypes (OR = 1.20, 95% CI = 1.13–1.26 and OR = 1.39, 95% CI = 1.22–1.59, respectively) and null in individuals with the rs4143096-GG genotype (OR = 1.03, 95% CI = 0.98–1.07, Table 2). Results are very similar for minimal and multivariable adjusted ORs. In addition, the stratified results Table S4 show interaction results using one common reference group. This common SNP (average allele frequency of T allele = 0.25) was directly genotyped in most studies or imputed with high accuracy (imputation r2>0.89). With the other dietary factors evaluated, no interactions using the conventional case-control logistic regression analysis reached the genome-wide significance threshold (Table S5).


With the other dietary factors, no interactions with any of the 2.7M SNPs were statistically significant using the conventional logistic regression analysis. Furthermore, we did not observe any novel interactions using our Cocktail method or the two exploratory statistical methods by Gauderman et al. [16] and Dai et al. [17] (data not shown).
Discussion
Genome-wide scans have successfully identified numerous risk loci for colorectal cancer; consortia pooling multiple studies for increased statistical power have continued to identify additional susceptibility loci [18]–[24]. However, only limited work has been pursued at a genome-wide scale to identify gene-diet interactions. Using individual-level data from ten studies with harmonized dietary intake variables on a total of over 9,000 cases and 9,000 controls, we have conducted a genome-wide analysis for GxE interactions. Using conventional statistical methods, as well as our novel method aiming to improve statistical power, we provide evidence for a novel interaction between rs4143094 and processed meat intake.
The variants in the 10p14 region interacting with processed meat consumption reside within and upstream of GATA binding protein 3 (GATA3) gene. GATA3 has long been associated with T cell development, specifically Th2 cell differentiation [25]. GATA3 is up-regulated in ulcerative colitis [26], which is associated with increased risk of colorectal cancer [27]. However, the role of GATA genes as transcription factors extends to epithelial structures with a known role in breast, prostate and other cancers [28]–[30]. GATA factors are involved in cellular maturation with proliferation arrest and cell survival. Loss of GATA genes or silencing of expression have been described for breast, colorectal and lung cancers [30].
To further explore this locus, we evaluated the potential functional impact of the most significant SNP in this locus as well as correlated SNPs querying multiple bioinformatics databases, such as Encode and NIH Roadmap (Table S6). The most significant SNP rs4143094 is about 7.2 kb upstream of GATA and resides in a 9.5 kb LD block (r2>0.8) containing 19 highly correlated SNPs, including rs1269486, which shows the third most significant interaction in this region (Table 1). The rs1269486 variant is located 1420 bases upstream of GATA3 in a region of open chromatin (DNase I hypersensitivity) with histone methylation patterns consistent with promoter activity in a colorectal cancer cell line (CACO2; Figure S1). As would be expected of a promoter region, experimental evidence supports Pol2 binding along with the transcription factors c-Fos, JunD, and c-Jun [31]. Many of the other SNPs upstream of GATA3 are located in GATA3-antisense RNA1 (GATA3-AS1) (formerly FLJ45983). GATA3-AS1 is a non-coding RNA that may regulate GATA3 transcript levels in the cell. Further studies are required to elucidate the relationship between GATA3 and GATA3-AS1 and determine whether variants in the 10p14 region cause perturbations in regulation.
A plausible though speculative biological basis for our findings is that processed meat triggers a pro-tumorigenic inflammatory or immunological response [32] that may necessitate proper GATA3 transcription levels. Nonetheless, the precise mechanism by which deregulation of GATA3 is linked to colorectal cancer upon consumption of high levels of processed meat remains unclear. Further study of the role of variants in GATA3 in colorectal cancer will yield more insight into their functional significance.
The interaction between variants in locus 10p14 and processed meat were identified by the conventional case-control logistic regression analysis. This locus was not identified through our Cocktail method or any of the other exploratory methods (Text S2). However, this is not surprising given that the SNPs in this locus are not strongly associated with colorectal cancer (p = 0.26 for rs4143094) and not strongly correlated with processed meat (p = 0.25 for rs4143094) and, accordingly, SNPs in this locus were not prioritized in the Cocktail analysis. However, we were somewhat surprised to not identify additional interactions with any of the dietary factors using our Cocktail method, given the expected improvement in power under various scenarios. We recognize that the field of GxE analyses is at an early stage compared with studies for marginal gene-diseases associations. It will be important to see more large-scale empirical GxE studies to judge the impact and potential power gain of the novel GxE methods.
Our analysis has some limitations and notable strengths. We adopted a flexible approach to data harmonization of dietary factors, in a similar fashion to those proposed by other projects [33], [34]. We focused on dietary variables that were collected in a similar manner and allowed for harmonization across a large subset of the studies. Ideally, our findings will be replicated in other populations. While a substantial larger number of GWAS have been conducted for colorectal cancer, limited studies have collected information on processed meat and other dietary variables. In the present study, we did not divide our large sample into discovery and replication sets, as it has been shown that the most powerful analytical approach is a combined analysis across all studies [35]. This approach is increasingly used as more samples with GWAS data are becoming available [36]. Importantly, we observed no evidence of heterogeneity in the estimates by study, which suggests that results are consistent across studies.
We not only used the conventional case-control logistic regression, but also took advantage of our recently developed Cocktail method as a second primary analysis approach to potentially improve statistical power. We note that even though for the Cocktail method different interaction tests (case-only and case-control) were used depending on the screening step, the overall genome-wide type I error is controlled at 0.05 (genome-wide level of α was set to 5E-08), just like the conventional case-control method. As we investigated five dietary factors and used two primary methods additional adjustment for multiple comparisons may be warranted. However, we want to point out that the dietary variables were correlated, e.g. correlation between fruits and vegetables was 0.38, between fruits and fiber was 0.52 or between red and processed meat was 0.62 adjustments for these not independent test is less straight forward. Similarly, the primary methods are not independent from each other, for instance the testing step of the Cocktail method used the case-control or case-only testing, which are consistent or correlated with the conventional case-control analysis. Accordingly, additional multiple comparison adjustment for 5 variables and 2 tests would be too conservative, nevertheless our interaction finding for 10p14 and processed meat would likely remain marginally significant.
With the investment of large GWAS consortium built on well-characterized studies, we are now well-positioned to identify potential interactions between genetic loci and environmental risk factors with respect to colorectal cancer risk. In this study, we have identified a novel interaction between rs4143094 and processed meat. This genetic locus may have interesting biological significance given its proximity to genes plausibly associated with pathways relevant to colorectal carcinogenesis. Nonetheless, further functional analysis is required to uncover the specific mechanisms by which this genetic locus modulates the association between intake of processed meat and colorectal cancer risk.
Materials and Methods
Study participants
This analysis uses data from the Colon Cancer Family Registry (CCFR) and the Genetics and Epidemiology of Colorectal Cancer Consortium (GECCO, Text S1 and Table S1) as described previously [14], [37]. All cases were defined as colorectal adenocarcinoma and confirmed by medical records, pathologic reports, or death certificate. All studies received ethical approval by their respective Institutional Review Boards and participants gave written informed consent.
Genotyping, quality assurance/quality control and imputation
Average sample and SNP call rates, and concordance rates for blinded duplicates have been previously published [37]. In brief, genotyped SNPs were excluded based on call rate (<98%), lack of Hardy-Weinberg Equilibrium in controls (HWE, p<1×10⁻⁴), and low minor allele frequency (MAF). We imputed the autosomal SNPs of all studies to the CEU population in HapMap II. SNPs were restricted based on per-study minor allele count >5 and imputation accuracy (R2>0.3) to avoid missing any interactions. After imputation and quality control (QC) analyses, approximately 2.7M SNPs were used in the analysis.
All analyses were restricted to individuals of European ancestry, defined as samples clustering with the Utah residents with Northern and Western European ancestry from the CEPH collection (CEU) population in principal component analysis [38], including the HapMap II populations as reference.
Harmonization of dietary factors
Information on basic demographics and environmental risk factors was collected by using in-person interviews and/or structured questionnaires, as detailed previously [39]–[48]. The multi-step data harmonization procedure applied in this study is described in detail by Hutter et al. [14]. Here we focus on selected dietary variables for intake of red and processed meat, fruits, vegetables (all measured in servings per day) and fiber (measured as g/day). These variables were coded as sex - and study-specific quartiles, where the quartile groups were coded 1 to 4 of the quartile within the controls of each study and sex. For studies that due to limited number of questions assessed dietary intake in categories rather than as continuous variables and had less than 4 intake categories, we assigned these categories to the 2nd and 3rd or 1st to 3rd quartile, as appropriate. The lowest category of exposure was used as the reference and each dietary factor was analyzed as an ordinal variable (e.g., 1, 2, 3, 4) in the model. Data harmonization was performed using SAS and T-SQL.
Statistical methods
Statistical analyses of all samples were conducted centrally at the GECCO coordinating center on individual-level data to ensure a consistent analytical approach. Unless otherwise indicated, we adjusted for age at the reference time, sex (when appropriate), center (when appropriate), total energy consumption (if available) and the first three principal components from EIGENSTRAT to account for potential population substructure. The dietary variables were coded as described above. Each directly genotyped SNP was coded as 0, 1, or 2 copies of the variant allele. For imputed SNPs, we used the expected number of copies of the variant allele (the “dosage”), which has been shown to give unbiased test statistics [49]. Genotypes were treated as continuous variables (i.e. log-additive effects). Each study was analyzed separately using logistic regression models and study-specific results were combined using fixed-effects meta-analysis methods to obtain summary odds ratios (ORs) and 95% confidence intervals (CIs) across studies. We calculated the heterogeneity p-values by Woolf's test [50]. Quantile-quantile (Q-Q) plots were assessed to determine whether the distribution of the p-values was consistent with the null distribution (except for the extreme tail).
To test for interactions between SNPs and dietary risk factors, we conduct two primary analyses: 1) conventional case-control logistic regression analysis including a multiplicative interaction term; 2)our newly developed Cocktail method [15]. For the conventional logistic regression analysis, we modeled the SNP by environment (GxE) interaction by the product of the SNP and the dietary variable (which is in this study the E), adjusting for age, sex, study site, energy, principal components and the main effects of the SNP and dietary variable. Adjustment for additional variables, smoking, alcohol, BMI and other dietary variables did not appreciably change the results. A two-sided p-value of 5×10⁻⁸ for a SNP-diet factor interaction was considered statistically significant, yielding a genome-wide significance level 0.05 assuming about 1 million independent tests across the genome (0.05/1,000,000 = 5×10⁻⁸) [51]–[56].
Motivated by recent advances in methods development for detecting GxE interaction [17], [57]–[60], our second approach was based on our recently developed Cocktail method. This statistical method combines the most appealing aspect of several newly developed GxE methods with the goal of creating a comprehensive and powerful test for genome-wide detection of GxE [15]. In brief, this method consists of two-steps: a screening step to prioritize SNPs and a testing step for GxE interaction. Specifically, for the screening step, we ranked and prioritized variants through a genome-wide screen of each of the 2.7M SNPs (referred to as “G”) by the maximum of the test statistics from marginal association of Gs on disease risk [58], and correlation between G and environmental/dietary variable (E) in cases and controls combined [59], a combination which allows for identifying variants with different interaction patterns.
Based on the ranks of these SNPs from screening, we used a weighted hypothesis framework to partition SNPs into groups with higher ranked groups having less stringent alpha-level cut-offs for interaction [60], [61]. We followed the grouping scheme used by Ionita et al. [61] such that for example, the first 3 groups consist of 5 SNPs (SNP 1 to 5), 10 SNPs (SNP 6 to 15) and 20 SNPs (SNP 16 to 36), and the corresponding cut-offs are αgroup 1 = α/(2*5) = 0.005, αgroup 2 = α/(4*10) = 0.00125 and αgroup 3 = α/(8*20) = 0.0003, respectively, so on and so forth, to maintain the overall genome-wide alpha level of 0.05. To avoid testing correlated SNPs, we pruned SNPs based on proximity (exclude any SNP within +/−50 kb of the selected SNP) given that LD pruning is difficult to implement for large number of SNPs. While the choice of the group size is arbitrary our simulation study showed that different group size did not impact the results substantially, and importantly, we chose the group size before looking at the results.
The second step of the Cocktail method is the testing step. We tested each of the G's for GxE interactions using the case-only (CO) logistic regression test. The use of the CO test is justified because we did not observe correlation between G and any of the tested dietary factors, and it has been shown that under the independence assumption the CO test provides substantial efficiency gain over the conventional CC test [62]. Since the CO is not independent of the correlation screening (a requirement to avoid inflation of type I error rates) [63], we used CO test only when the maximum screening test statistic came from the marginal association, and the case-control test otherwise.
In Text S2, we describe two secondary statistical GxE methods that we used to explore other novel GxE methods: the 2-step method by Gauderman et al. method [16] and a 2 degree of freedom joint test for marginal associations of G and GxE interaction by Dai et al. [17]. All analyses were conducted using the R programming language [64].
Supporting Information
Zdroje
1. SiegelR, NaishadhamD, JemalA (2012) Cancer statistics, 2012. CA Cancer J Clin 62 : 10–29.
2. AlexanderDD, CushingCA (2011) Red meat and colorectal cancer: a critical summary of prospective epidemiologic studies. Obes Rev 12: e472–493.
3. AlexanderDD, MillerAJ, CushingCA, LoweKA (2010) Processed meat and colorectal cancer: a quantitative review of prospective epidemiologic studies. Eur J Cancer Prev 19 : 328–341.
4. van DuijnhovenFJ, Bueno-De-MesquitaHB, FerrariP, JenabM, BoshuizenHC, et al. (2009) Fruit, vegetables, and colorectal cancer risk: the European Prospective Investigation into Cancer and Nutrition. The American journal of clinical nutrition 89 : 1441–1452.
5. WuQJ, YangY, VogtmannE, WangJ, HanLH, et al. (2013) Cruciferous vegetables intake and the risk of colorectal cancer: a meta-analysis of observational studies. Annals of oncology : official journal of the European Society for Medical Oncology/ESMO 24 : 1079–1087.
6. NomuraAM, HankinJH, HendersonBE, WilkensLR, MurphySP, et al. (2007) Dietary fiber and colorectal cancer risk: the multiethnic cohort study. Cancer causes & control : CCC 18 : 753–764.
7. ParkY, HunterDJ, SpiegelmanD, BergkvistL, BerrinoF, et al. (2005) Dietary fiber intake and risk of colorectal cancer: a pooled analysis of prospective cohort studies. JAMA : the journal of the American Medical Association 294 : 2849–2857.
8. DahmCC, KeoghRH, SpencerEA, GreenwoodDC, KeyTJ, et al. (2010) Dietary fiber and colorectal cancer risk: a nested case-control study using food diaries. Journal of the National Cancer Institute 102 : 614–626.
9. LinJ, ZhangSM, CookNR, RexrodeKM, LiuS, et al. (2005) Dietary intakes of fruit, vegetables, and fiber, and risk of colorectal cancer in a prospective cohort of women (United States). Cancer causes & control : CCC 16 : 225–233.
10. OllberdingNJ, WilkensLR, HendersonBE, KolonelLN, Le MarchandL (2012) Meat consumption, heterocyclic amines and colorectal cancer risk: the Multiethnic Cohort Study. International journal of cancer Journal international du cancer 131: E1125–1133.
11. LiuAY, SchererD, PooleE, PotterJD, CurtinK, et al. (2013) Gene-diet-interactions in folate-mediated one-carbon metabolism modify colon cancer risk. Molecular nutrition & food research 57 : 721–734.
12. CotterchioM, BoucherBA, MannoM, GallingerS, OkeyAB, et al. (2008) Red meat intake, doneness, polymorphisms in genes that encode carcinogen-metabolizing enzymes, and colorectal cancer risk. Cancer epidemiology, biomarkers & prevention : a publication of the American Association for Cancer Research, cosponsored by the American Society of Preventive Oncology 17 : 3098–3107.
13. FigueiredoJC, LewingerJP, SongC, CampbellPT, ContiDV, et al. (2011) Genotype-environment interactions in microsatellite stable/microsatellite instability-low colorectal cancer: results from a genome-wide association study. Cancer epidemiology, biomarkers & prevention : a publication of the American Association for Cancer Research, cosponsored by the American Society of Preventive Oncology 20 : 758–766.
14. HutterCM, Chang-ClaudeJ, SlatteryML, PflugeisenBM, LinY, et al. (2012) Characterization of gene-environment interactions for colorectal cancer susceptibility loci. Cancer research 72 : 2036–2044.
15. HsuL, JiaoS, DaiJY, HutterC, PetersU, et al. (2012) Powerful cocktail methods for detecting genome-wide gene-environment interaction. Genetic epidemiology 36 : 183–194.
16. GaudermanWJ, ZhangP, MorrisonJL, LewingerJP (2013) Finding novel genes by testing G×E interactions in a genome-wide association study. Genetic epidemiology 37 : 603–613.
17. DaiJY, KooperbergC, LeblancM, PrenticeRL (2012) Two-stage testing procedures with independent filtering for genome-wide gene-environment interaction. Biometrika 99 : 929–944.
18. TenesaA, FarringtonSM, PrendergastJG, PorteousME, WalkerM, et al. (2008) Genome-wide association scan identifies a colorectal cancer susceptibility locus on 11q23 and replicates risk loci at 8q24 and 18q21. Nat Genet 40 : 631–637.
19. TomlinsonIP, WebbE, Carvajal-CarmonaL, BroderickP, HowarthK, et al. (2008) A genome-wide association study identifies colorectal cancer susceptibility loci on chromosomes 10p14 and 8q23.3. Nat Genet 40 : 623–630.
20. BroderickP, Carvajal-CarmonaL, PittmanAM, WebbE, HowarthK, et al. (2007) A genome-wide association study shows that common alleles of SMAD7 influence colorectal cancer risk. Nat Genet 39 : 1315–1317.
21. TomlinsonI, WebbE, Carvajal-CarmonaL, BroderickP, KempZ, et al. (2007) A genome-wide association scan of tag SNPs identifies a susceptibility variant for colorectal cancer at 8q24.21. Nat Genet 39 : 984–988.
22. ZankeBW, GreenwoodCM, RangrejJ, KustraR, TenesaA, et al. (2007) Genome-wide association scan identifies a colorectal cancer susceptibility locus on chromosome 8q24. Nat Genet 39 : 989–994.
23. HoulstonRS, WebbE, BroderickP, PittmanAM, Di BernardoMC, et al. (2008) Meta-analysis of genome-wide association data identifies four new susceptibility loci for colorectal cancer. Nat Genet 40 : 1426–1435.
24. JiaWH, ZhangB, MatsuoK, ShinA, XiangYB, et al. (2012) Genome-wide association analyses in east Asians identify new susceptibility loci for colorectal cancer. Nature genetics 45 : 191–196.
25. HosoyaT, MaillardI, EngelJD (2010) From the cradle to the grave: activities of GATA-3 throughout T-cell development and differentiation. Immunol Rev 238 : 110–125.
26. ChristophiGP, RongR, HoltzapplePG, MassaPT, LandasSK (2012) Immune markers and differential signaling networks in ulcerative colitis and Crohn's disease. Inflammatory bowel diseases 18 : 2342–2356.
27. GuptaRB, HarpazN, ItzkowitzS, HossainS, MatulaS, et al. (2007) Histologic inflammation is a risk factor for progression to colorectal neoplasia in ulcerative colitis: a cohort study. Gastroenterology 133 : 1099–1105 quiz 1340-1091.
28. ChouJ, ProvotS, WerbZ (2010) GATA3 in development and cancer differentiation: cells GATA have it!. Journal of cellular physiology 222 : 42–49.
29. NguyenAH, TremblayM, HaighK, KoumakpayiIH, PaquetM, et al. (2013) Gata3 antagonizes cancer progression in Pten-deficient prostates. Human molecular genetics 22 : 2400–2410.
30. ZhengR, BlobelGA (2010) GATA Transcription Factors and Cancer. Genes Cancer 1 : 1178–1188.
31. RosenbloomKR, SloanCA, MalladiVS, DreszerTR, LearnedK, et al. (2013) ENCODE data in the UCSC Genome Browser: year 5 update. Nucleic acids research 41: D56–63.
32. HedlundM, Padler-KaravaniV, VarkiNM, VarkiA (2008) Evidence for a human-specific mechanism for diet and antibody-mediated inflammation in carcinoma progression. Proceedings of the National Academy of Sciences of the United States of America 105 : 18936–18941.
33. BennettSN, CaporasoN, FitzpatrickAL, AgrawalA, BarnesK, et al. (2011) Phenotype harmonization and cross-study collaboration in GWAS consortia: the GENEVA experience. Genetic epidemiology 35 : 159–173.
34. FortierI, DoironD, BurtonP, RainaP (2011) Invited commentary: consolidating data harmonization–how to obtain quality and applicability? American journal of epidemiology 174 : 261–264 author reply 265-266.
35. SkolAD, ScottLJ, AbecasisGR, BoehnkeM (2006) Joint analysis is more efficient than replication-based analysis for two-stage genome-wide association studies. Nature genetics 38 : 209–213.
36. PearceCL, RossingMA, LeeAW, NessRB, WebbPM, et al. (2013) Combined and interactive effects of environmental and GWAS-identified risk factors in ovarian cancer. Cancer epidemiology, biomarkers & prevention : a publication of the American Association for Cancer Research, cosponsored by the American Society of Preventive Oncology 22 : 880–890.
37. PetersU, JiaoS, SchumacherFR, HutterCM, AragakiAK, et al. (2013) Identification of Genetic Susceptibility Loci for Colorectal Tumors in a Genome-Wide Meta-analysis. Gastroenterology 144 : 799–e724, 799-807, e724.
38. PriceAL, PattersonNJ, PlengeRM, WeinblattME, ShadickNA, et al. (2006) Principal components analysis corrects for stratification in genome-wide association studies. Nat Genet 38 : 904–909.
39. NewcombPA, BaronJ, CotterchioM, GallingerS, GroveJ, et al. (2007) Colon Cancer Family Registry: an international resource for studies of the genetic epidemiology of colon cancer. Cancer Epidemiol Biomarkers Prev 16 : 2331–2343.
40. SlatteryML, PotterJ, CaanB, EdwardsS, CoatesA, et al. (1997) Energy balance and colon cancer–beyond physical activity. Cancer research 57 : 75–80.
41. ChristenWG, GazianoJM, HennekensCH (2000) Design of Physicians' Health Study II–a randomized trial of beta-carotene, vitamins E and C, and multivitamins, in prevention of cancer, cardiovascular disease, and eye disease, and review of results of completed trials. Annals of epidemiology 10 : 125–134.
42. ProrokPC, AndrioleGL, BresalierRS, BuysSS, ChiaD, et al. (2000) Design of the Prostate, Lung, Colorectal and Ovarian (PLCO) Cancer Screening Trial. Controlled clinical trials 21 : 273S–309S.
43. Design of the Women's Health Initiative clinical trial and observational study. The Women's Health Initiative Study Group. Controlled clinical trials 19 : 61–109.
44. HoffmeisterM, RaumE, KrtschilA, Chang-ClaudeJ, BrennerH (2009) No evidence for variation in colorectal cancer risk associated with different types of postmenopausal hormone therapy. Clinical pharmacology and therapeutics 86 : 416–424.
45. BrennerH, Chang-ClaudeJ, SeilerCM, RickertA, HoffmeisterM (2011) Protection from colorectal cancer after colonoscopy: a population-based, case-control study. Annals of internal medicine 154 : 22–30.
46. KuryS, BuecherB, Robiou-du-PontS, ScoulC, SebilleV, et al. (2007) Combinations of cytochrome P450 gene polymorphisms enhancing the risk for sporadic colorectal cancer related to red meat consumption. Cancer epidemiology, biomarkers & prevention : a publication of the American Association for Cancer Research, cosponsored by the American Society of Preventive Oncology 16 : 1460–1467.
47. ColditzGA, HankinsonSE (2005) The Nurses' Health Study: lifestyle and health among women. Nature reviews Cancer 5 : 388–396.
48. GiovannucciE, RimmEB, StampferMJ, ColditzGA, AscherioA, et al. (1994) Aspirin use and the risk for colorectal cancer and adenoma in male health professionals. Annals of internal medicine 121 : 241–246.
49. JiaoS, HsuL, HutterCM, PetersU (2011) The use of imputed values in the meta-analysis of genome-wide association studies. Genetic epidemiology 35 : 597–605.
50. WoolfB (1955) On estimating the relation between blood group and disease. Ann Hum Genet 19 : 251–253.
51. RischN, MerikangasK (1996) The future of genetic studies of complex human diseases. Science 273 : 1516–1517.
52. A haplotype map of the human genome. Nature 437 : 1299–1320.
53. Genome-wide association study of 14,000 cases of seven common diseases and 3,000 shared controls. Nature 447 : 661–678.
54. HoggartCJ, ClarkTG, De IorioM, WhittakerJC, BaldingDJ (2008) Genome-wide significance for dense SNP and resequencing data. Genetic epidemiology 32 : 179–185.
55. Pe'erI, YelenskyR, AltshulerD, DalyMJ (2008) Estimation of the multiple testing burden for genomewide association studies of nearly all common variants. Genetic epidemiology 32 : 381–385.
56. DudbridgeF, GusnantoA (2008) Estimation of significance thresholds for genomewide association scans. Genetic epidemiology 32 : 227–234.
57. MukherjeeB, ChatterjeeN (2008) Exploiting gene-environment independence for analysis of case-control studies: an empirical Bayes-type shrinkage estimator to trade-off between bias and efficiency. Biometrics 64 : 685–694.
58. KooperbergC, LeblancM (2008) Increasing the power of identifying gene×gene interactions in genome-wide association studies. Genetic epidemiology 32 : 255–263.
59. MurcrayCE, LewingerJP, GaudermanWJ (2009) Gene-environment interaction in genome-wide association studies. Am J Epidemiol 169 : 219–226.
60. RoederK, WassermanL (2009) Genome-Wide Significance Levels and Weighted Hypothesis Testing. Statistical science : a review journal of the Institute of Mathematical Statistics 24 : 398–413.
61. Ionita-LazaI, McQueenMB, LairdNM, LangeC (2007) Genomewide weighted hypothesis testing in family-based association studies, with an application to a 100K scan. American journal of human genetics 81 : 607–614.
62. PiegorschWW, WeinbergCR, TaylorJA (1994) Non-hierarchical logistic models and case-only designs for assessing susceptibility in population-based case-control studies. Statistics in medicine 13 : 153–162.
63. DaiJY, KooperbergC, LeblancM (submitted) On two-stage hypothesis testing procedures via asymptotically independent statistics. J R Stat Soc Series B Stat Methodol
64. (2010) R Development Core Team. R: A Language and Environment for Statistical Computing. Vienna, Austria.
Štítky
Genetika Reprodukční medicínaČlánek vyšel v časopise
PLOS Genetics
2014 Číslo 4
- Kazuistika – Perspektivy využití precizované medicíny v rámci personalizované specifické terapie onkologických pacientů
- Nobelova cena za chemii pro genetické nůžky: Objev, který změní naši budoucnost?
- Technologie na bázi RNA v klinické praxi: od přebarvených petúnií k terapii vzácných a dosud jen obtížně léčitelných chorob u lidí
- „Nepředstavovali jsme si, že náš výzkum povede přímo ke vzniku nových léků, dokonce ještě za našeho života“
- Bezplatné služby pro diagnostiku ATTRv amyloidózy pro kardiology
Nejčtenější v tomto čísle
- The Sequence-Specific Transcription Factor c-Jun Targets Cockayne Syndrome Protein B to Regulate Transcription and Chromatin Structure
- The Mechanism of Gene Targeting in Human Somatic Cells
- Genetic Predisposition to In Situ and Invasive Lobular Carcinoma of the Breast
- Widespread Use of Non-productive Alternative Splice Sites in
Zvyšte si kvalifikaci online z pohodlí domova
Mazová zátka a její řešení
nový kurzVšechny kurzy