
Sox5 Functions as a Fate Switch in Medaka Pigment Cell Development
How individual cell fates are specified from multipotent progenitor cells is a fundamental question in developmental and stem cell biology. Accumulating evidence indicates that stem cells develop into each of their final, diverse cell-types after progression through one or more partially-restricted intermediates, but the molecular mechanisms underlying final fate choice are largely unknown. Neural crest cells (NCCs) give rise to diverse cell-types including multiple pigment cells and thus are a favored model for understanding the mechanism of fate specification. We have investigated how a specific fate choice is made from partially-restricted pigment cell progenitors in medaka. We show that Sry-related transcription factor Sox5 is required for fate determination between yellow xanthophore and white leucophore, and its loss causes excessive formation of leucophores and absence of xanthophores. We demonstrate that Sox5 functions cell-autonomously in the xanthophore lineage in medaka. Furthermore, pax7a is expressed in the partially-restricted progenitor cells shared with xanthophore and leucophore lineages, and Sox5 acts in some of these cells to promote xanthophore lineage. Our work reveals the role of Sox5 as a molecular switch determining xanthophore versus leucophore fate choice from the shared progenitor, and identifies an important mechanism regulating pigment cell fate choice from NCCs.
Published in the journal:
. PLoS Genet 10(4): e32767. doi:10.1371/journal.pgen.1004246
Category:
Research Article
doi:
https://doi.org/10.1371/journal.pgen.1004246
Summary
How individual cell fates are specified from multipotent progenitor cells is a fundamental question in developmental and stem cell biology. Accumulating evidence indicates that stem cells develop into each of their final, diverse cell-types after progression through one or more partially-restricted intermediates, but the molecular mechanisms underlying final fate choice are largely unknown. Neural crest cells (NCCs) give rise to diverse cell-types including multiple pigment cells and thus are a favored model for understanding the mechanism of fate specification. We have investigated how a specific fate choice is made from partially-restricted pigment cell progenitors in medaka. We show that Sry-related transcription factor Sox5 is required for fate determination between yellow xanthophore and white leucophore, and its loss causes excessive formation of leucophores and absence of xanthophores. We demonstrate that Sox5 functions cell-autonomously in the xanthophore lineage in medaka. Furthermore, pax7a is expressed in the partially-restricted progenitor cells shared with xanthophore and leucophore lineages, and Sox5 acts in some of these cells to promote xanthophore lineage. Our work reveals the role of Sox5 as a molecular switch determining xanthophore versus leucophore fate choice from the shared progenitor, and identifies an important mechanism regulating pigment cell fate choice from NCCs.
Introduction
Elucidation of mechanisms that control cell fate specification from multipotent progenitors is one of the most important topics in developmental biology. The neural crest is a vertebrate-specific multipotent cell population that arises at the border of the neural plate and prospective epidermis. The neural crest cells (NCCs) migrate to various destinations along stereotyped pathways and thereby give rise to a diversity of different cell types, including sensory, enteric and autonomic neurons, glia of the peripheral nervous system, skeletogenic fates such as craniofacial cartilage, and pigment cells [1], [2]. Their stem cell-like characteristics, and potential therapeutic uses in regenerative medicine, make NCCs attractive as a model for studying fate specification of multipotent progenitor cells in stem cell biology.
Neural crest-derived pigment cells in vertebrates are classified into diverse cell types and each can be easily identified by its natural coloration. Whereas mammals and birds have a single type of pigment cell, melanocytes, fish have up to six [3]. Zebrafish has three distinct types of pigment cells, melanophores, yellow xanthophores and iridescent iridophores [4], [5]. In medaka and some other fish species, there is a fourth pigment cell type, the white leucophore [6]–[8]. The white coloration and auto-fluorescence of leucophores depend on light reflection from intracellular organellar crystals of uric acid, which is a purine-related substance similar to guanine and hypoxanthine in iridophores [9]. In addition, leucophores in medaka embryos and larvae appear to be orange, due to production of a pteridine pigment, drosopterin, during embryonic/larval stages [10]. Xanthophores contain a different pteridine, yellow sepiapterin. Biochemical studies suggest that both drosopterin and sepiapterin are generated via a common synthesis pathway for H4biopterine from GTP [11], indicating a possible close evolutionary relationship between xanthophores and leucophores, although the embryological/genetic relationship between these two cell-types has not been studied.
Previous studies by in vitro clonal analysis showed that multipotent NCCs become gradually restricted in their potential to generate certain derivatives, forming partially-restricted intermediate progenitors before eventually becoming specified to an individual fate [12]–[14]. However, the presence, identity and diversity of these intermediate progenitors in vivo remains unclear. Furthermore, the molecular mechanisms regulating fate specification from the intermediate progenitors are also incompletely understood. Previous genetic studies identified a few key transcription factors required for fate specification within NCCs [15]. Some of the best-known examples are transcription factors controlling development of melanocytes (functionally and genetically equivalent to melanophores in fish). Sox10 is required to drive transcription of Mitf, a master gene for melanocyte lineage in multipotent NCCs [16]–[21]. Pax3 acts synergistically with Sox10 to regulate the mouse Mitf promoter [22]–[25]. Whereas the molecular mechanisms driving melanocyte differentiation are relatively well understood, the equivalent mechanisms for other pigment cell-types remain largely mysterious, as do the interactions between these factors that control the balance of pigment cell fates. One exception comes from the demonstration in zebrafish and chick that Foxd3 functions to inhibit differentiation of melanocytes from NCCs by repressing Mitf function; in zebrafish, FoxD3 also promotes iridophore development [26]–[29].
The mutant collections in medaka provide models for investigating the genetic basis of fate choice in NCCs. A series of loci affecting both xanthophore and leucophore development in medaka offer novel insight into how these two pigment cell types are specified [30], [31]. Among them, leucophore free and leucophore free-2 (lf and lf-2) mutants have no discernible leucophores nor xanthophores in the embryo/larva, although lf-2 mutants have occasional escaper leucophores [31]. Our previous studies revealed that the lf-2 locus encodes pax7a, and lf-2 mutants failed to develop xanthophores and leucophores, suggesting a role of pax7a in fate specification of a shared, partially-restricted progenitor of the xanthophore and leucophore lineages (Kimura et al, unpublished data). We also revealed that lf locus is slc2a15b and this encodes a solute career (Slc) protein required for coloration of xanthophores and leucophores, consistent with the previous description that lf mutants have deficiently-colored xanthophores and leucophores. These genetic data also suggest that leucophores are closely related to xanthophores. This left the major unanswered question of what mechanism allows selection of xanthophore or leucophore fate from these intermediate progenitors.
Medaka many leucophores-3 (ml-3) mutant embryos exhibit excessive formation of leucophores and absence of visible xanthophores [30]–[32]. To elucidate the molecular mechanisms regulating the fate choices of xanthophore and leucophore, we have investigated medaka ml-3 mutant by genetic and developmental approaches. Here we report that ml-3 locus encodes medaka sox5 and that Sox5 functions cell-autonomously to control specification of xanthophores from the shared xanthophore-leucophore progenitor.
Results
ml-3 mutants show combined ectopic and excessive formation of leucophores and absence of xanthophores
Medaka ml-3 is a spontaneous mutant with excessive formation of leucophores, and a lack of visible xanthophore pigmentation in the embryo/larva [30], [31], but with no apparent phenotypes of other neural crest derivatives (Figures S1A–S1J). We first re-examined all pigment cell types during embryonic development in ml-3 mutant. In wild-type (WT) embryos, the first differentiating leucophores appear ventral to the hindbrain/midbrain (ventral head leucophores) by 18–19 somite stage (50 hours post fertilization: hpf, data not shown) [31], [33]. The other population of leucophores, found on the dorsal surface of the head and trunk, begin to differentiate at 3.5–4 days post fertilization (dpf) when a few are visible (Figure S2A). By hatching stage (9 dpf), these leucophores have increased to approximately 30 cells scattered on the dorsal head and 40 cells in the dorsal midline of the trunk (Figures 1A, 1C, 1I). In ml-3 homozygous mutants, formation of ventral head leucophores was not markedly altered (data not shown); in contrast, there is already an excess compared with WT of leucophores in the dorsal head and trunk at 4 dpf, (Figures S2A, S2B). By 7 dpf, the trunk leucophores are scattered more laterally than in WT, forming three lines (Figures 1D, S2C, S2D). Subsequently, leucophores in the central line of the three become gradually reduced, the number in the more lateral lines become substantially increased after hatching. The number of leucophores in ml-3 homozygotes was significantly larger in both head and dorsal trunk than that in WT (Figures 1I, S2P).

Pigmented xanthophores are first observed at 6 dpf in WT, but differentiating xanthophores are difficult to detect at early embryonic stages. In order to detect them more readily, we examined them using their auto-fluorescence upon UV-light exposure (Figures 1E–1H) [34]. In WT hatchlings, numerous xanthophores cover the dorsal trunk and others are scattered around the melanophores in the lateral stripe (see below, Figure 1G). In ml-3 homozygotes, no xanthophores were detected on the body surface (Figure 1H).
To further elucidate the effect of ml-3 deficiency, we investigated the phenotypes of ml-3 heterozygotes. The ml-3 heterozygous leucophores were normally positioned in the dorsal midline of the trunk at 5 dpf, but significantly increased, compared with WT leucophores (Figures 1K, S2E–S2G). Xanthophores, scattered over the trunk surface, were significantly fewer at 5 dpf in ml-3 heterozygotes than in WT (Figures 1L, S2H–S2J). These results indicate that ml-3 is a semi-dominant mutation and the increase of leucophores and the decrease of xanthophores are dependent on ml-3 gene dosage. These data suggest that the ml-3 locus acts as a fate-switch for xanthophore versus leucophore lineages within a shared progenitor cell. Further experiments below were carried out using ml-3 homozygotes (described as ml-3 mutants) unless otherwise specified.
We found no evidence for a change in the number of the other two pigment cell-types, melanophores or iridophores. Melanophores first appeared in the trunk region at 12 somite stage (41 hpf) and formed three stripes in trunk: dorsal stripe (DS), lateral stripe (LS), and ventral stripe (VS) (Figure 1E). Whereas most melanophores in WT were associated with leucophores in the DS and head region (Figures 1A, 1C), there are no melanophores associated with the ectopic leucophores in ml-3 hatchlings (Figures 1B, 1D, 1F). Consistent with this, the number of melanophores was not significantly different between WT and ml-3 in either of the DS, LS, VS or head region (Figures 1J, S2O). Iridophores appeared on the eyes and the yolk sac at 5 dpf and could be readily observed at later stages in WT (data not shown and Figures S2K, S2M). Although we were unable to count numbers of iridophores due to ambiguity in their cell borders, there was no marked difference in the areas covered by iridophores in WT and ml-3 (Figures S2L, S2N). These findings indicate that the ml-3 mutation specifically affects the formation of xanthophores and leucophores, but not of melanophores and iridophores.
Xanthophore specification is defective in ml-3 mutants
To address whether ml-3 mutation affects the specification of the xanthophore and leucophore lineages, we examined the expression of the earliest known markers for pigment cell precursors. GTP cyclohydrolase I (gch) converts GTP to dihydroneopterin triphosphate, which is a source material for pteridine pigments in xanthophore precursors [35], [36]. Dihydroneopterin triphosphate is also converted into H4biopterin, which functions as a cofactor for eumelanin synthesis in melanophores. Thus gch was reported to be expressed in both xanthophore and melanophore lineages in zebrafish [35]. Our in situ hybridization (ISH) analysis in WT embryos showed that gch (XM_004085058) was expressed in laterally migrating cells on the trunk surface and the ventral head leucophores at 24–27 somite stage (58–61 hpf) (Figures 2A, 2C, 2D). The gch-expressing cells were located on lateral (above somite) and dorsal (above neural tube) trunk surface at 34 somite stage (74 hpf, Figures 2H, 2H′). These cells included both unpigmented and differentiating pigment cells. Unlike in zebrafish, we saw no evidence for a transient overlap of gch expression with that the melanophore marker, dopachrome tautomerase (dct, XM_004081780) [37], indicating that medaka gch was not expressed in the melanophore lineage at the stages tested (Figures 2E, 2E′). Furthermore, at 7 dpf, gch mRNA was detected in all xanthophores and leucophores (Figures 2F, 2F′, 2G, 2G′). These data show that, in medaka, gch expression is a marker for xanthophore and leucophore linages from well before overt differentiation, but is not a marker for the melanophore lineage at these stages.

Similar results were obtained with xanthine dehydrogenase (xdh, XM_004066478), which is known as a xanthophore precursor marker in zebrafish (Figures S3A–S3D) [35]. Whereas xdh expression is specific to xanthophores in zebrafish, which do not have leucophores, xdh was clearly detectable in both xanthophores and leucophores in medaka. These observations are consistent with previous reports showing that medaka xanthophores and leucophores contain pteridines (sepiapterin in xanthophores and drosopterin in leucophores) and that the enzymes encoded by gch and xdh are required for pteridine synthesis [11]. Having defined gch (which was expressed more strongly than xdh) as an early marker of xanthophore and leucophore specification, we then used it to assess whether xanthophore specification, as opposed to visible differentiation, failed in ml-3 mutants.
At 24–27 somite stage (58–61 hpf), the ml-3 embryos lacked gch-expressing cells on the trunk although they had gch expression in the ventral head leucophores (Figure 2B). At 34 somite stage (74 hpf), many, but fewer than in WT embryos, gch-expressing cells were detected in ml-3 mutants (Figures 2H–2J). Transverse cross sections of these embryos revealed that, in ml-3 mutants, gch-expressing cells were detected on the dorsal trunk surface, but were fully absent from the lateral trunk surface (Figure 2I′). Differentiating leucophores and xanthophores are localized on the dorsal and lateral trunk surface, respectively, so that our data indicate that specification of the xanthophore lineage fails in ml-3 mutants. Expression of melanophore precursor markers, dct and mitfa (KC249980) was indistinguishable in ml-3 and WT siblings at 34 somite stage (74 hpf) (Figures 2K–2O), further confirming that ml-3 mutation specifically affects xanthophore/leucophore lineages.
ml-3 locus encodes sox5
To identify the ml-3 locus, we carried out positional cloning. The ml-3 locus was mapped within a 90-kbp region on linkage group 23. sox5 (AB856413) was the only known gene in this genomic region (Figure 3A). cDNA cloning identified a medaka sox5 gene that consists of 15 exons with a 2229 bp open reading frame encoding a 742 amino acid protein (Figures 3B, 3D). Medaka Sox5 protein displayed strong similarities to human SOX5 (NP_008871.3) and zebrafish Sox5 (AY730586.1), (66% and 79% amino acid identities, respectively). Like Sox5 in other vertebrate species, medaka Sox5 contained several conserved domains, such as an HMG box DNA-binding domain, a leucine-zipper, a Q-box and two coiled-coil domains (Figure 3D). RT-PCR and sequencing of the ml-3 mutant cDNA identified a 124-bp deletion corresponding precisely to skipping of exon 7 (Figures 3B, 3C). The ml-3 mutation introduces a premature stop codon and results in generation of a truncated Sox5 protein lacking the HMG box domain; this is predicted to result in loss-of-function of Sox5 (Figure 3D).

Despite sequencing introns 6 and 7 and exon 7 of the sox5 gene from ml-3 mutants, we were unable to identify any candidate mutations that might induce the aberrant splicing of exon 7. To confirm that sox5 is the causative gene for the ml-3 phenotype, we carried out knockdown of sox5 with an antisense morpholino (MO) targeted to the splice donor site of exon 7. The sox5 morphants exhibited the ectopic formation of leucophores at hatching stage while the control morphants injected with the standard control MO failed to mimic the ml-3 phenotypes (Figures 4A–4C). As expected, the severity of the morphants' pigment phenotype was dependent on the MO dosage, with higher doses resulting in a higher proportion of embryos closely resembling the ml-3 leucophore phenotype (Figure 4D). Sox5 morphants also mimicked the xanthophore phenotype of ml-3 (data not shown). To further confirm that ml-3 is sox5, we carried out TILLING screening for sox5 mutant alleles in medaka. We successfully isolated two mutant alleles that had a single nucleotide mutation in exon 13 causing an amino acid substitution in the HMG domain of Sox5 (sox5N541S and sox5F543I, Figure 4E). The homozygous mutants of both alleles were found to exhibit increased and ectopic formation of leucophores and complete absence of xanthophores, and thus closely phenocopied the ml-3 mutants (Figures 4F–4K). We conclude that the medaka sox5 gene is mutated in the ml-3 mutant.

sox5 is expressed in neural crest and xanthophore precursors
Medaka sox5 mRNA was detected throughout embryonic and early larval stages by RT-PCR (Figure S4). We used whole-mount ISH to determine the expression pattern of sox5. In WT embryos, sox5 mRNA was detected in head and tail bud regions before the onset of somite formation (data not shown). At the 12 somite stage (41 hpf), sox5 was expressed in the dorsal neural tube and premigratory NCCs (Figures 5A, 5A′). Slightly later sox5 expression was detected in migrating NCCs ventrally on a pathway between somite and neural tube (medial pathway). At 22–24 somite stage (54–58 hpf), some scattered sox5-expressing cells were observed on lateral trunk surface (Figures 5C–5C″). These signals became detectable before the onset of gch expression, but, at later stages, overlapped with that of gch in differentiating xanthophores on lateral trunk surface; in addition, a few gch-expressing sox5-negative cells were detectable on dorsal trunk surface (Figures 5E, 5E′, 5F, 5F′). We interpret these data as indicating that sox5-expressing cells on lateral trunk surface are differentiating xanthophores (xanthophore precursors), whereas leucophores (dorsal trunk cells) do not express sox5. The expression in the xanthophore lineages gradually faded after 4 dpf and became undetectable by 5 dpf. In ml-3 embryos, the sox5 expression was not significantly altered in the dorsal neural tube, premigratory NCCs, and the NCCs migrating on the medial pathway. However, the sox5-expressing cells on the lateral trunk surface were absent in ml-3 mutants (Figures 5B, 5B′, 5D–5D″). These results indicate that sox5 is expressed in the xanthophore precursors and sox5 is required exclusively for development of xanthophores.

Sox5 functions cell-autonomously in xanthophore lineage
To test the hypothesis that Sox5 functions cell-autonomously in xanthophore specification, we performed cell transplantation between WT and ml-3 embryos. In this experiment, we used transgenic medaka Tg(slc2a15b:GFP), as a donor, which expresses GFP in both of differentiated xanthophores and leucophores (Figures S5A–S5C). First, WT donor cells from Tg(slc2a15b:GFP) embryos were transplanted into ml-3 host embryos. In some of these WT→ml-3 transplants, xanthophores were partially restored in patches of the body surface (15/31, Figure 6A, Table S1). All xanthophores in the transplants had GFP signals (15/15, Figure 6C), indicating that only WT donor cells were able to differentiate into xanthophores in ml-3 hosts. Next, we transplanted ml-3 donor cells with slc2a15b:GFP transgene into WT hosts. Of 25 ml-3→WT transplants tested, no embryo had GFP-positive xanthophores (0/25, Figures 6B, 6D, Table S1). We next examined whether ml-3 donor cells could develop into leucophores in WT hosts. Since GFP fluorescence could not be distinguished from auto-fluorescence in leucophores, we examined GFP expression by immunostaining with diaminobenzidine (DAB). Of 25 ml-3→WT transplants, 9 had a few leucophores expressing GFP in the dorsal midline, indicating that ml-3 donor cells can differentiate into leucophores at the correct position in WT hosts (9/25, Figures 6G, 6J, Table S1). We also tested if WT→ml-3 transplants had WT donor-derived leucophores. WT→ml-3 transplants had GFP-positive leucophores at normal and ectopic positions (2/15, Figures 6E, 6F, 6H, 6I, TableS1), suggesting that Sox5 does not control positioning of leucophores cell-autonomously, but rather that absence of xanthophores in ml-3 mutants may indirectly affect localization of leucophores. To further test this possibility, we performed cell transplantation using lf-2 mutants, which completely lack xanthophores and leucophores. Of 12 ml-3→lf-2 transplants, 3 had a few ectopic leucophores and no xanthophore (Figures S6A, S6B). This result together with that from ml-3→WT transplants supports the idea that Sox5 controls leucophore positioning indirectly by regulating specification of the xanthophore lineage. Considered together with the sox5 expression in xanthophore precursors, our data indicate that Sox5 controls specification of xanthophores cell-autonomously.

Role of Sox5 and Pax7a in xanthophore specification
To begin to reveal the gene cascade underlying specification of xanthophore and leucophore lineages, we examined lf (slc2a15b) and lf-2 (pax7a) mutant embryos (Kimura et al, unpublished data), which each lacks discernible xanthophores and leucophores except for occasional escaper leucophores in lf-2 [30], [31]. gch expression was normal in lf but was absent in lf-2 at 34 somite stage (Figures 7A, 7B). This is consistent with our previous findings that slc2a15b is required for pigmentation of xanthophores and leucophores, whereas pax7a is required for specification of both xanthophore and leucophore lineages. We next examined the expression of pax7a (AB827303) in ml-3 and lf-2 mutants, and the expression of sox5 in lf and lf-2 mutants. Similar to sox5, pax7a was detected in the dorsal neural tube, premigratory NCCs, and migrating NCCs on the trunk surface in WT (Figures 7C–7C″). We found that pax7a was expressed in both differentiating xanthophores and leucophores, whereas sox5 expression was not detected in early leucophores (Figures 7C, 7C′, 7H, 7H′, 7I, 7I′). pax7a expression was absent in cells on the lateral trunk surface in ml-3 mutants (Figures 7D, 7D′), suggesting that the absence of pax7a on the trunk surface in ml-3 mutants reflects the absence of the xanthophore lineage. The pax7a-expressing premigratory NCCs were not altered in ml-3 mutants (Figure 7D″), whereas lf-2 mutants lack both of pax7a-expressing premigratory NCCs and differentiating xanthophores (Figures 7E, 7E′), suggesting that pax7a-positive premigratory NCCs are a shared precursor for both xanthophores and leucophores (shared xanthophore-leucophore progenitor).
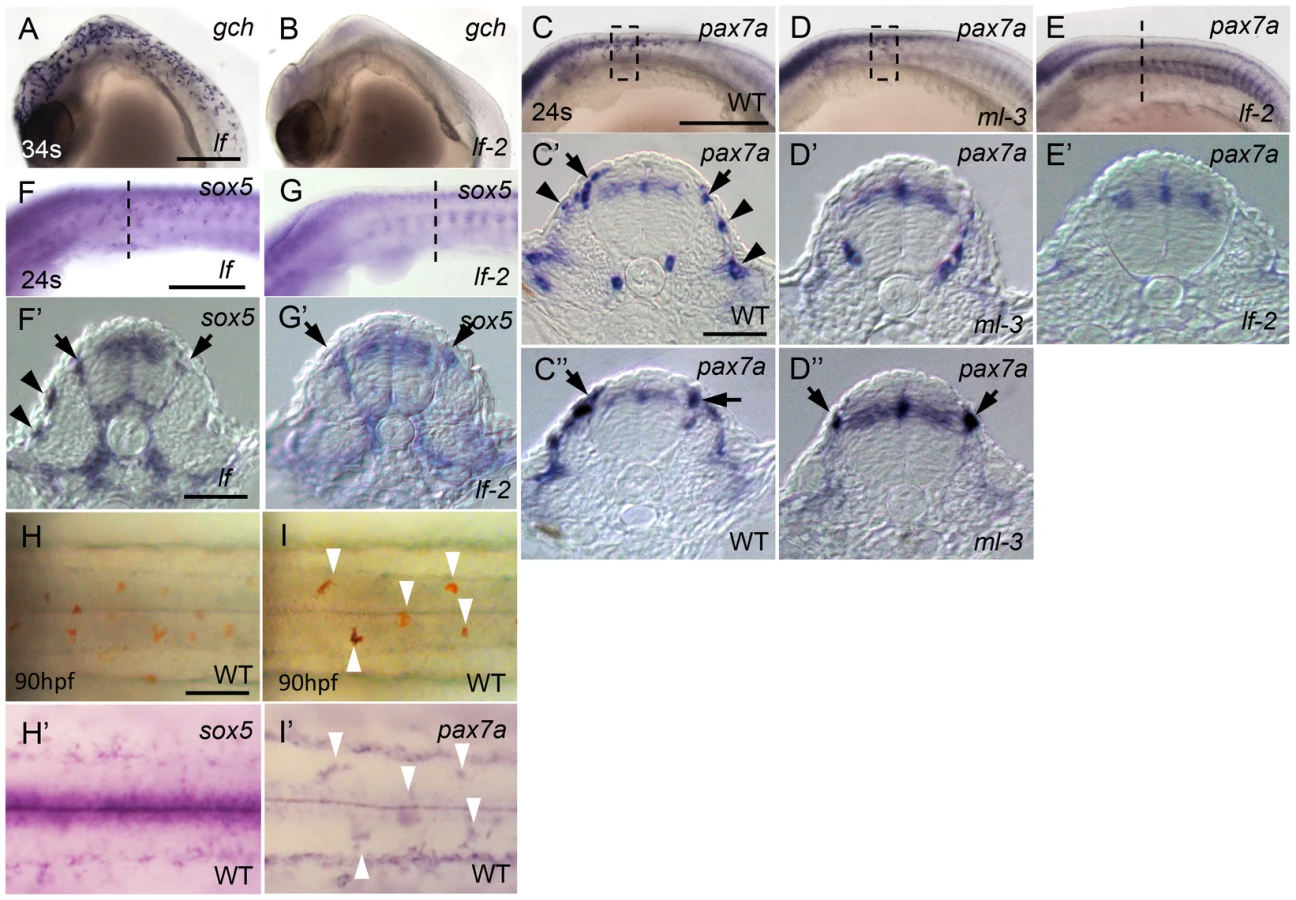
As expected, sox5 expression was normal in lf mutants but the sox5 expression in differentiating xanthophores on lateral trunk surface was not detected in lf-2 mutants (Figures 7F, 7F′, 7G, 7G′), suggesting sox5-expressing specified xanthophore precursors did not form in pax7a mutants. Although we expected that sox5-expressing premigratory NCCs would be absent in lf-2 (pax7a) mutants, sox5-expressing cells were observed at the premigratory position in lf-2. This is likely because sox5-positive premigratory NCCs contain other progenitor cells than the shared xanthophore-leucophore progenitors. In fact, sox5 was expressed prominently in cells on the medial pathway presumably giving rise to NCC derivatives other than xanthophores.
To test for genetic interaction between sox5 and pax7a, we generated compound mutants for sox5 and pax7a by crossing the sox5+/ml-3;pax7a+/lf-2 parents. The progeny could be categorized into three categories based on their leucophore phenotypes: WT (leucophore+, leucophores are positioned in the dorsal midline of the trunk, 128/233), ml-3 like (leucophore++, excess leucophores are ectopically located on the dorsal trunk surface, 36/233), lf-2 like (leucophore-, leucophores are completely absent, 69/233); we did not find any progeny showing phenotypes different from these three (Figures S7A–S7C). The ratio WT:ml-3 like:lf-2 like of the categorized larvae was approximately 9∶2.5∶4.8 (Figure S7D). According to Mendelian heredity, the expected ratio of WT:ml-3:lf-2:ml-3/lf-2 in the progeny is 9∶3∶3∶1. Our data suggest that sox5/pax7a double mutants showed the lf-2 (pax7a) type. Consistent with this, we confirmed that some of the lf-2 like larvae were homozygotes for the ml-3 mutation (Figure S7E). In sox5/pax7a double mutants, the shared xanthophore-leucophore progenitors did not form and therefore both xanthophores and leucophores did not develop. Our findings indicate that pax7a is required for development of the shared xanthophore-leucophore progenitors; sox5 is required for specification of xanthophore lineage from these progenitors.
Discussion
A diversity of pigment cell types in fish provides a unique opportunity to study the mechanisms controlling fate choices in multipotent NCCs. We take advantage of a novel trait in medaka, which have a fourth pigment cell type (leucophores), not seen in most fish species, to uncover the genetic basis for the greater complexity of fate choices. Our combination of studies using positional cloning, gene silencing and TILLING mutant screening have identified medaka sox5 as the gene responsible for the ml-3 mutant, which has no xanthophores but excess leucophores in the embryo/larva. Detailed observation of pigment cell phenotypes in sox5-deficient mutants revealed that the increase in leucophores and the decrease in xanthophores are sox5 dosage dependent. Our previous study revealed that pax7a is expressed in NCCs and required for development of both xanthophore and leucophore lineages (Kimura et al, unpublished data). In this study, we have demonstrated that sox5 is expressed in differentiating xanthophores and required cell-autonomously for development of the xanthophore lineage. Furthermore, the ISH analysis of pax7a in ml-3 and lf-2 mutants and the phenotype of sox5/pax7a double mutants suggest that pax7a is required for development of the shared xanthophore-leucophore progenitors from NCCs; sox5 then functions as a molecular switch for specification of xanthophores and leucophores from the progenitors, in which sox5-positive and sox5-negative cells become specified as and differentiate into xanthophores and leucophores, respectively (Figure 8).

It might be expected that loss of Sox5 activity does not affect total cell number of xanthophores and leucophores if Sox5 determines a fate choice of leucophores versus xanthophores. Our data, however, showed that gch-expressing cells, which include both differentiating xanthophores and leucophores, significantly reduced in ml-3 mutants. Different proliferation rate of xanthophores and leucophores could explain the data. There are fewer leucophores than xanthophores in WT, suggesting that leucophores proliferate less than xanthophores (Figures 1K, 1L). Consistent with this, the pax7a-positive progenitors on the dorsal surface were not affected initially (at 18 somite stage) but later during development become significantly reduced in ml-3 compared to WT (Figures S8A–S8C).
In fish, the three or four pigment cell types are generated from multipotent NCCs, most likely through a progressive restriction mechanism. In zebrafish embryos, sox10 is required for specification of all non-ectomesenchymal NCC fates, so that loss of Sox10 function disturbs development not only of melanophores but also of xanthophores, iridophores and neural derivatives [38], [39]. Studies in zebrafish show that melanophore/iridophore progenitors are generated from sox10-positive NCCs. They initially all express mitfa, which is maintained in those that commit to melanophores fate [40]. In the case of iridophore specification, Foxd3 expression promotes iridophore cell fate by repressing mitfa expression. A previous study investigating zebrafish shady (ltk) mutants showed that the receptor tyrosine kinase leukocyte tyrosine kinase (Ltk) is necessary for iridophore specification [41]. Recently, Lopes et al. also provided evidence that sox10-positive/ltk-positive cells are likely multipotent progenitors for pigment cells, including melanophores and iridophores [41]. Some of sox10-positive/ltk-positive cells maintain ltk expression and eventually give rise to iridophores. Thus, in zebrafish, it appears that melanophore and iridophore lineages both diverge from a common progenitor cell. Consistent with these insights, ml-3 mutants have no melanophore nor iridophore phenotype, indicating that, in medaka, the xanthophore/leucophore lineage is specified independently from the melanophore/iridophore lineage.
The leucophore is poorly characterized partly because it has been described in only a few fish species including medaka, but not zebrafish [6]–[8]. Leucophores have been considered to be closely related to iridophores as the hue of both cell types is generated from light reflection due to intracellular purines, uric acid in leucophores and guanine in iridophores [42]. Furthermore, in medaka embryos, leucophores are positioned along the dorsal midline of the trunk and associated with melanophores in a similar manner to that of iridophores in zebrafish embryos [4], [33]. However, xanthophores and leucophores commonly contain pteridine-related substance and our in situ studies revealed that gch and xdh, which are associated with pteridine synthesis pathway, are expressed in both lineages. Medaka mutants lf (slc2a15b) and wl (slc2a11b) affect coloration of both xanthophore and leucophore lineages; Slc2a15b and Slc2a11b functions in the synthesis of pteridines in these pigment cells (Kimura et al, unpublished data). These biochemical traits of xanthophore and leucophore lineages imply a close relationship between xanthophore and leucophore lineages. Although purines are used for reflection of light in both leucophores and iridophores, we speculate that the purine-dependent system may have been co-opted from iridophores when leucophores diverged from the xanthophore lineage during evolution.
Sox5 belongs to the SoxD subgroup together with Sox6 and Sox13 [43]. SoxD proteins are unique in that they have no known transactivation or transrepression domain, despite their transcriptional regulatory actions. Thus, interaction with other transcription factor seems to be important for SoxD to exert its function. Several transcription factors have been suggested to interact with SoxD. In particular, Sox5 and Sox6 cooperate with Sox9 in transactivating chondrocyte-specific genes [44]. In mouse melanoblasts, Sox5 competes against Sox10 for DNA binding sequences and thus antagonistically modulates Sox10 activity to regulate transcription of mitf and dct [45]. Assuming that Sox10 is generally involved in development of all pigment cell lineages in fish, antagonistic activity of Sox5 against Sox10 may contribute to promote xanthophore lineage in medaka. Previous reports suggest that the interaction between Sox and Pax is important for pigment cell development in mammals. In melanocyte development, Pax3 cooperates with Sox10 in induction of mitf expression at early stage [22], [46] but later Pax3 competes with Sox10 to induce the expression of dct for terminal differentiation of melanocytes [47]. Pax3 and Pax7 are closely related Pax-family transcription factors with a high degree of sequence homology and a similar genomic organization. These proteins have a similar DNA-binding ability in vitro [48]. Given Pax7a functions similar to Pax3 in medaka, Pax7a may function cooperatively with Sox10 during xanthophore/leucophore lineage development in medaka. In this context, Sox5 may act antagonistically against Sox10 interacting with Pax7a within xanthophore progenitor cells in medaka. To address this issue, studies of medaka sox10 mutants and compound mutants of sox5, sox10, and pax7a are necessary. Further identification of target genes of these transcription factors and master genes for specification and differentiation of xanthophores should help us to understand the molecular mechanism by which Sox5 controls xanthophore specification.
The ectopic localization of leucophores in ml-3 implies that Sox5 controls NCC migration. However, in our cell transplantation analysis, no ml-3 mutant donor-derived leucophores were ectopically positioned in WT host embryos. In contrast, we found WT donor-derived leucophores at an ectopic position in ml-3 host embryo. We noticed that there were no xanthophores around the ectopic leucophores, whereas WT or ml-3 donor-derived leucophores were observed at the normal positions and laid medially adjacent to xanthophores. Consistent with this, in ml-3 heterozygotes, excess leucophores are formed at the normal position in the presence of reduced but numerous xanthophores. It has been suggested that the normal pigment pattern formation requires the interactions between distinct pigment cell types [4], [49], [50]. For stripe formation in adult zebrafish, the repulsive behavior between melanophores and xanthophores is suggested to be involved in segregation of the two cell types in the skin. Our findings suggest that the presence of xanthophores prevents leucophores from being positioned laterally close to xanthophores and the absence of xanthophores in ml-3 mutants allows leucophores to scatter more laterally. Supporting this idea, cell transplantation analysis by using lf-2 mutants as host embryos has shown that ml-3 donor-derived leucophores are often formed at ectopic positions in the complete absence of xanthophores. These results imply that repulsive interaction between xanthophores and leucophores likely determines the positions of the two pigment cell types in the medaka embryo.
We show that medaka Sox5 functions as a molecular switch in specification of xanthophores versus leucophores. However, it is not clear whether sox5 is used for specification of xanthophores in other fish species that have only three types of pigment cells, such as zebrafish. If so, repression of the sox5 expression in the intermediate progenitor might be linked to appearance of leucophore lineage. Future studies on the role of sox5 gene in pigment cell development of various vertebrate species should shed light on the mechanism of diversification of pigment cell development.
Materials and Methods
Ethics statement
This study was performed with the approval of Nagoya University ethics committee and in accordance with local and Japanese ethical guidelines.
Medaka strains and husbandry
The Nagoya strain of medaka fish, Oryzias latipes, having all of the normal four pigment cell types, was used as WT. ml-3, identified in Orange-red stocks (devoid of visible melanophores) by Hideo Tomita [30], was crossed with Nagoya several times to equip the mutant with melanophore prior to experimental use. HNI-I inbred strain (HNI-I/NAGOYA inbred substrain, which was obtained after brother-sister mating of HNI-I inbred strain in more than 15 generations at Nagoya University) was used for crossing in genetic mapping. lf and lf-2 have been described [51]. Fish stocks were maintained in 16-L tanks with a water circulating system (Meitosuien) at 26°C under a 14 h light/10 h dark cycle. In some experiments, embryos were treated with 0.003% phenylthiourea to block melanin synthesis.
Observation of pigment cells
Embryos and larvae were imaged on a Leica MZ APO or an AxioPlan 2 (Zeiss) microscope using an AxioCam camera (Zeiss). Xanthophores were illuminated with UV light to observe their auto-fluorescence through DAPI filter. Prior to counting melanophore number, embryos were treated with 2 mg/ml epinephrine to aggregate melanin. Significant differences were calculated using Student's t-test, one-way ANOVA or two-way ANOVA with GraphPad Prism (version 5.00 for Windows, GraphPad Software).
Whole-mount in situ hybridization (ISH)
ISH was performed as previously described [52] with modification. A digoxygenin (DIG) - or fluorescein (FITC)-labeled riboprobe was made from a cloned cDNA in pDrive (Qiagen), pCRII-TOPO (Invitrogen) or pGEM-T easy (Promega) by using SP6 or T7 polymerase after restriction enzyme digestion. The brief procedure is as follows. Fixed embryos were treated with Proteinase K (10 µg/ml) in PBS for 10 min at 30°C. Hybridization was performed at 65°C overnight. Signals were detected with alkaline-phosphate conjugated anti-DIG or anti-FITC Fab fragments (Roche) using NBT/BCIP (Roche) or FastRed (Roche) as a chromogenic substrate. For histology, the specimens were embedded in a Technovit 8100 (Heraeus Kulzer) and sectioned at 8-µm thickness.
Positional cloning
By crossing F1 generation of ml-3 and WT HNI-I hybrids, 360 F2 offspring displaying the ml-3 phenotype were collected and subjected to bulked segregant analysis with the M-marker system [53]. For further recombination analysis, polymorphic markers were isolated in reference to medaka genome database (http://medakagb.lab.nig.ac.jp/Oryzias_latipes/index.html). Detailed information on the markers used is shown in Table S2.
Antisense oligonucleotide-mediated knockdown
Antisense morpholino (MO) oligonucleotide (Gene Tools) for sox5 was designed on the splice donor site of exon 7. The MO sequence is: 5′-GATGCTACTCACTGCATCCGGGCTT-3′. The non-specific standard control MO was used as a negative control. The sequence is 5′-CCTCTTACCTCAGTTACAATTTATA-3′. MO was microinjected in one blastomere of 1-cell stage embryos.
TILLING mutant screening
TILLING screening was performed as described [54], [55]. Genomic fragment of exon 13 in sox5 was amplified with primers; 5′-AATCTTCAGTCGTTTGAGTG-3′ (forward) and 5′-TAACGCTTGCTGAGGAAC-3′ (reverse).
Generation of transgenic fish
The fosmid clone containing lf/slc2a15b region (GOLWFno17_n04) was modified (Kimura et al., unpublished data). Exon 1 of slc2a15b was replaced by GFP cDNA (slc2a15b:GFP). The fosmid construct slc2a15b:GFP (50 pg) was injected into 1-cell stage medaka embryos to establish a transgenic line Tg(slc2a15b:GFP). Detailed characterization of Tg(slc2a15b:GFP) will be published elsewhere.
Cell transplantation
Transplanting cells from donor to host was done at late blastula stage. Donors, either of WT or of ml-3, were given with the transgene slc2a15b:GFP by crossing. Donor and host blastulae were dechorionated with hatching enzyme and placed in groove on a 1.5% agarose plate in 3.5 cm plastic dish filled with balanced salt solution containing 20 U/ml penicillin and 100 µg/ml streptomycin. Approximately a hundred donor cells were transplanted with glass microcapillary. Transplants were incubated at 26°C until 7 dpf.
Immunohistochemistry
Embryos were fixed with 4% paraformaldehyde in PBS overnight at room temperature. The primary antibody (rat anti-GFP IgG, Nacalai tesque or mouse anti-HuC IgG, Santa Cruz Biotechnology) and the secondary antibody (biotin-conjugated anti-rat IgG or biotin-conjugated anti-mouse IgG, VECTOR) were used at a 1∶1000 dilution. Staining was done by using VECTASTAIN ABC kit (VECTOR) with DAB (MUTO PURE CHEMICALS) or Alexa Fluor 488 tyramide (Invitrogen). In the experiment that detects HuC-positive enteric neurons, immnostaining was performed on cryostat sections made from frozen samples mounted in O.C.T. (Sakura Finetek Japan).
Alcian blue staining
Hatching larvae were fixed with 4% paraformaldehyde overnight. The samples were washed in acid-alcohol (1% HCl, 70% ethanol) and incubated for 2 hours in 0.1% alcian blue in acid-alcohol, thereafter washed in acid-alcohol and stored in 90% glycerol.
Supporting Information
Zdroje
1. DonoghuePC, GrahamA, KelshRN (2008) The origin and evolution of the neural crest. Bioessays 30 : 530–541.
2. Le DouarinNM, CreuzetS, CoulyG, DupinE (2004) Neural crest cell plasticity and its limits. Development 131 : 4637–4650.
3. FujiiR (1993) Cytophysiology of fish chromatophores. Int Rev Cytol 143 : 191–255.
4. KelshRN (2004) Genetics and evolution of pigment patterns in fish. Pigment Cell Res 17 : 326–336.
5. KelshRN, BrandM, JiangYJ, HeisenbergCP, LinS, et al. (1996) Zebrafish pigmentation mutations and the processes of neural crest development. Development 123 : 369–389.
6. OdiorneJM (1933) The Occurrence of Guanophores in Fundulus. Proc Natl Acad Sci U S A 19 : 750–754.
7. FriesEF (1942) White Pigmentary Effectors (Leucophores) in Killifishes. Proc Natl Acad Sci U S A 28 : 396–401.
8. TakeuchiIK (1976) Electron microscopy of two types of reflecting chromatophores (iridophores and leucophores) in the guppy, Lebistes reticulatus Peters. Cell Tissue Res 173 : 17–27.
9. Hama T (1975) In: Yamamoto T, editor. Medaka (KILLFISH): Biology and Strains. Tokyo: Keigaku Publishing Company. pp. 138–153.
10. OliphantLW, HudonJ (1993) Pteridines as reflecting pigments and components of reflecting organelles in vertebrates. Pigment Cell Res 6 : 205–208.
11. BraaschI, SchartlM, VolffJN (2007) Evolution of pigment synthesis pathways by gene and genome duplication in fish. BMC Evol Biol 7 : 74.
12. Le DouarinNM, DupinE (2003) Multipotentiality of the neural crest. Curr Opin Genet Dev 13 : 529–536.
13. CalloniGW, Glavieux-PardanaudC, Le DouarinNM, DupinE (2007) Sonic Hedgehog promotes the development of multipotent neural crest progenitors endowed with both mesenchymal and neural potentials. Proc Natl Acad Sci U S A 104 : 19879–19884.
14. CalloniGW, Le DouarinNM, DupinE (2009) High frequency of cephalic neural crest cells shows coexistence of neurogenic, melanogenic, and osteogenic differentiation capacities. Proc Natl Acad Sci U S A 106 : 8947–8952.
15. BhattS, DiazR, TrainorPA (2013) Signals and switches in Mammalian neural crest cell differentiation. Cold Spring Harb Perspect Biol 5 (2) pii: a008326. doi: 10.1101
16. TassabehjiM, NewtonVE, ReadAP (1994) Waardenburg syndrome type 2 caused by mutations in the human microphthalmia (MITF) gene. Nat Genet 8 : 251–255.
17. MochiiM, MazakiY, MizunoN, HayashiH, EguchiG (1998) Role of Mitf in differentiation and transdifferentiation of chicken pigmented epithelial cell. Dev Biol 193 : 47–62.
18. ListerJA, RobertsonCP, LepageT, JohnsonSL, RaibleDW (1999) nacre encodes a zebrafish microphthalmia-related protein that regulates neural-crest-derived pigment cell fate. Development 126 : 3757–3767.
19. HodgkinsonCA, MooreKJ, NakayamaA, SteingrimssonE, CopelandNG, et al. (1993) Mutations at the mouse microphthalmia locus are associated with defects in a gene encoding a novel basic-helix-loop-helix-zipper protein. Cell 74 : 395–404.
20. LeeM, GoodallJ, VerasteguiC, BallottiR, GodingCR (2000) Direct regulation of the Microphthalmia promoter by Sox10 links Waardenburg-Shah syndrome (WS4)-associated hypopigmentation and deafness to WS2. J Biol Chem 275 : 37978–37983.
21. ElworthyS, ListerJA, CarneyTJ, RaibleDW, KelshRN (2003) Transcriptional regulation of mitfa accounts for the sox10 requirement in zebrafish melanophore development. Development 130 : 2809–2818.
22. BondurandN, PingaultV, GoerichDE, LemortN, SockE, et al. (2000) Interaction among SOX10, PAX3 and MITF, three genes altered in Waardenburg syndrome. Hum Mol Genet 9 : 1907–1917.
23. LacostaAM, MuniesaP, RuberteJ, SarasaM, DominguezL (2005) Novel expression patterns of Pax3/Pax7 in early trunk neural crest and its melanocyte and non-melanocyte lineages in amniote embryos. Pigment Cell Res 18 : 243–251.
24. WatanabeA, TakedaK, PloplisB, TachibanaM (1998) Epistatic relationship between Waardenburg syndrome genes MITF and PAX3. Nat Genet 18 : 283–286.
25. PotterfSB, FurumuraM, DunnKJ, ArnheiterH, PavanWJ (2000) Transcription factor hierarchy in Waardenburg syndrome: regulation of MITF expression by SOX10 and PAX3. Hum Genet 107 : 1–6.
26. CurranK, RaibleDW, ListerJA (2009) Foxd3 controls melanophore specification in the zebrafish neural crest by regulation of Mitf. Dev Biol 332 : 408–417.
27. IgnatiusMS, MooseHE, El-HodiriHM, HenionPD (2008) colgate/hdac1 Repression of foxd3 expression is required to permit mitfa-dependent melanogenesis. Dev Biol 313 : 568–583.
28. ThomasAJ, EricksonCA (2009) FOXD3 regulates the lineage switch between neural crest-derived glial cells and pigment cells by repressing MITF through a non-canonical mechanism. Development 136 : 1849–1858.
29. NitzanE, PfaltzgraffER, LaboskyPA, KalcheimC (2013) Neural crest and Schwann cell progenitor-derived melanocytes are two spatially segregated populations similarly regulated by Foxd3. Proc Natl Acad Sci U S A 110 : 12709–12714.
30. TomitaH (1992) The lists of the mutants and strains of the medaka, common gambusia, silver crucian carp, goldfish, and golden venus fish maintained in the Laboratory of Freshwater Fish Stocks, Nagoya University. Fish Biol J MEDAKA 4 : 45–47.
31. KelshRN, InoueC, MomoiA, KondohH, Furutani-SeikiM, et al. (2004) The Tomita collection of medaka pigmentation mutants as a resource for understanding neural crest cell development. Mech Dev 121 : 841–859.
32. Tomita H (1975) In: Yamamoto T, editor. Medaka (KILLFISH): Biology and Strains. Tokyo: Keigaku Publishing Company. pp. 251–272.
33. Lynn LamoreuxM, KelshRN, WakamatsuY, OzatoK (2005) Pigment pattern formation in the medaka embryo. Pigment Cell Res 18 : 64–73.
34. OdenthalJ, RossnagelK, HaffterP, KelshRN, VogelsangE, et al. (1996) Mutations affecting xanthophore pigmentation in the zebrafish, Danio rerio. Development 123 : 391–398.
35. ParichyDM, RansomDG, PawB, ZonLI, JohnsonSL (2000) An orthologue of the kit-related gene fms is required for development of neural crest-derived xanthophores and a subpopulation of adult melanocytes in the zebrafish, Danio rerio. Development 127 : 3031–3044.
36. PelletierI, Bally-CuifL, ZieglerI (2001) Cloning and developmental expression of zebrafish GTP cyclohydrolase I. Mech Dev 109 : 99–103.
37. KelshRN, SchmidB, EisenJS (2000) Genetic analysis of melanophore development in zebrafish embryos. Dev Biol 225 : 277–293.
38. DuttonKA, PaulinyA, LopesSS, ElworthyS, CarneyTJ, et al. (2001) Zebrafish colourless encodes sox10 and specifies non-ectomesenchymal neural crest fates. Development 128 : 4113–4125.
39. KelshRN, EisenJS (2000) The zebrafish colourless gene regulates development of non-ectomesenchymal neural crest derivatives. Development 127 : 515–525.
40. CurranK, ListerJA, KunkelGR, PrendergastA, ParichyDM, et al. (2010) Interplay between Foxd3 and Mitf regulates cell fate plasticity in the zebrafish neural crest. Dev Biol 344 : 107–118.
41. LopesSS, YangX, MullerJ, CarneyTJ, McAdowAR, et al. (2008) Leukocyte tyrosine kinase functions in pigment cell development. PLoS Genet 4: e1000026.
42. ObikaM (1996) Morphology of chromatophores of the medaka. Fish Biol J MEDAKA 8 : 21–27.
43. LefebvreV (2010) The SoxD transcription factors–Sox5, Sox6, and Sox13–are key cell fate modulators. Int J Biochem Cell Biol 42 : 429–432.
44. LefebvreV, LiP, de CrombruggheB (1998) A new long form of Sox5 (L-Sox5), Sox6 and Sox9 are coexpressed in chondrogenesis and cooperatively activate the type II collagen gene. EMBO J 17 : 5718–5733.
45. StoltCC, LommesP, HillgartnerS, WegnerM (2008) The transcription factor Sox5 modulates Sox10 function during melanocyte development. Nucleic Acids Res 36 : 5427–5440.
46. WatanabeK, TakedaK, YasumotoK, UdonoT, SaitoH, et al. (2002) Identification of a distal enhancer for the melanocyte-specific promoter of the MITF gene. Pigment Cell Res 15 : 201–211.
47. LangD, LuMM, HuangL, EnglekaKA, ZhangM, et al. (2005) Pax3 functions at a nodal point in melanocyte stem cell differentiation. Nature 433 : 884–887.
48. SchaferBW, CzernyT, BernasconiM, GeniniM, BusslingerM (1994) Molecular cloning and characterization of a human PAX-7 cDNA expressed in normal and neoplastic myocytes. Nucleic Acids Res 22 : 4574–4582.
49. InabaM, YamanakaH, KondoS (2012) Pigment pattern formation by contact-dependent depolarization. Science 335 : 677.
50. ParichyDM (2007) Homology and the evolution of novelty during Danio adult pigment pattern development. J Exp Zool B Mol Dev Evol 308 : 578–590.
51. WadaH, ShimadaA, FukamachiS, NaruseK, ShimaA (1998) Sex-Linked Inheritance of the lf Locus in the Medaka Fish (Oryzias latipes). Zoolog Sci 15 : 123–126.
52. HashimotoH, RebagliatiM, AhmadN, MuraokaO, KurokawaT, et al. (2004) The Cerberus/Dan-family protein Charon is a negative regulator of Nodal signaling during left-right patterning in zebrafish. Development 131 : 1741–1753.
53. KimuraT, JindoT, NaritaT, NaruseK, KobayashiD, et al. (2004) Large-scale isolation of ESTs from medaka embryos and its application to medaka developmental genetics. Mech Dev 121 : 915–932.
54. IshikawaT, KameiY, OtozaiS, KimJ, SatoA, et al. (2010) High-resolution melting curve analysis for rapid detection of mutations in a Medaka TILLING library. BMC Mol Biol 11 : 70.
55. TaniguchiY, TakedaS, Furutani-SeikiM, KameiY, TodoT, et al. (2006) Generation of medaka gene knockout models by target-selected mutagenesis. Genome Biol 7: R116.
Štítky
Genetika Reprodukční medicínaČlánek vyšel v časopise
PLOS Genetics
2014 Číslo 4
- Kazuistika – Perspektivy využití precizované medicíny v rámci personalizované specifické terapie onkologických pacientů
- Nobelova cena za chemii pro genetické nůžky: Objev, který změní naši budoucnost?
- Technologie na bázi RNA v klinické praxi: od přebarvených petúnií k terapii vzácných a dosud jen obtížně léčitelných chorob u lidí
- „Nepředstavovali jsme si, že náš výzkum povede přímo ke vzniku nových léků, dokonce ještě za našeho života“
- Bezplatné služby pro diagnostiku ATTRv amyloidózy pro kardiology
Nejčtenější v tomto čísle
- The Sequence-Specific Transcription Factor c-Jun Targets Cockayne Syndrome Protein B to Regulate Transcription and Chromatin Structure
- The Mechanism of Gene Targeting in Human Somatic Cells
- Genetic Predisposition to In Situ and Invasive Lobular Carcinoma of the Breast
- Widespread Use of Non-productive Alternative Splice Sites in
Zvyšte si kvalifikaci online z pohodlí domova
Mazová zátka a její řešení
nový kurzVšechny kurzy