
Negative Supercoiling Creates Single-Stranded Patches of DNA That Are Substrates for AID–Mediated Mutagenesis
Antibody diversification necessitates targeted mutation of regions within the immunoglobulin locus by activation-induced cytidine deaminase (AID). While AID is known to act on single-stranded DNA (ssDNA), the source, structure, and distribution of these substrates in vivo remain unclear. Using the technique of in situ bisulfite treatment, we characterized these substrates—which we found to be unique to actively transcribed genes—as short ssDNA regions, that are equally distributed on both DNA strands. We found that the frequencies of these ssDNA patches act as accurate predictors of AID activity at reporter genes in hypermutating and class switching B cells as well as in Escherichia coli. Importantly, these ssDNA patches rely on transcription, and we report that transcription-induced negative supercoiling enhances both ssDNA tract formation and AID mutagenesis. In addition, RNaseH1 expression does not impact the formation of these ssDNA tracts indicating that these structures are distinct from R-loops. These data emphasize the notion that these transcription-generated ssDNA tracts are one of many in vivo substrates for AID.
Published in the journal:
. PLoS Genet 8(2): e32767. doi:10.1371/journal.pgen.1002518
Category:
Research Article
doi:
https://doi.org/10.1371/journal.pgen.1002518
Summary
Antibody diversification necessitates targeted mutation of regions within the immunoglobulin locus by activation-induced cytidine deaminase (AID). While AID is known to act on single-stranded DNA (ssDNA), the source, structure, and distribution of these substrates in vivo remain unclear. Using the technique of in situ bisulfite treatment, we characterized these substrates—which we found to be unique to actively transcribed genes—as short ssDNA regions, that are equally distributed on both DNA strands. We found that the frequencies of these ssDNA patches act as accurate predictors of AID activity at reporter genes in hypermutating and class switching B cells as well as in Escherichia coli. Importantly, these ssDNA patches rely on transcription, and we report that transcription-induced negative supercoiling enhances both ssDNA tract formation and AID mutagenesis. In addition, RNaseH1 expression does not impact the formation of these ssDNA tracts indicating that these structures are distinct from R-loops. These data emphasize the notion that these transcription-generated ssDNA tracts are one of many in vivo substrates for AID.
Introduction
The generation of high affinity antibodies is an important feature of the adaptive immune response to pathogens. The iterative process of somatic hypermutation (SHM) introduces mutations into the DNA encoding the variable (V) region of the antibody molecule that ultimately confer higher affinity for pathogen-derived antigen. Immunoglobulin (Ig) genes also undergo class switch recombination (CSR), which creates antibodies of different isotypes with distinct effector functions. The importance of these secondary diversification processes is demonstrated in hyper-IgM type II patients that lack these diversification processes and are thus immunocompromised [1].
Activation-induced cytidine deaminase (AID) initiates secondary diversification of Ig genes by deaminating dC within the V-region to initiate SHM and gene conversion, or within switch regions to initiate CSR [2]. The deamination event is then processed by downstream repair pathways that result in the mutagenic processes during SHM and in the production of double-stranded DNA (dsDNA) breaks during CSR. The mechanism by which AID preferentially deaminates dC in Ig genes rather than other loci has still not been fully elucidated, although recent reports have revealed that proteins involved in transcription play key roles in AID-targeting. Spt5, an elongation factor that directly interacts with the RNA polymerase, has been found to bind and target AID to mutating genes [3]. Furthermore, through in vitro SHM studies, the RNA exosome, a complex of factors that specialize in an array of diverse RNA processing events, has been shown to direct AID to both template and non-template strands of DNA [4]. Indeed, the role of transcription in SHM has long been suspected [5]–[9].
In the case of SHM of Ig genes, AID deaminates dC in both DNA strands, as evidenced by sequencing of V-region DNA [10], [11] and the finding that AID induces dUs equally on both strands of the DNA [12]. In the case of CSR, which requires a double strand break [13], AID is also thought to act on both strands of the Ig switch (S) region. That is, a plausible model for generating the double strand break envisages that AID will sometimes deaminate dCs that are close to each other but in opposite strands. These deaminations create G:U mismatches that are substrates for mismatch repair and UNG, which introduce single strand breaks close by in each strand, thus effectively making a double-strand break.
It is well established that AID directly deaminates dC only within single-stranded regions [14]–[17]. Our previous work showed that both strands of the Ig heavy chain V-region DNA of B cell lines and ex vivo mouse B cells contains single stranded patches and that these patches are more frequent in the V-region than in other genes [18]. Nonetheless, much work has been undertaken to unveil how both strands of the V and switch regions would be rendered single-stranded. Crystallographic studies have revealed that there is little exposed single-stranded DNA (ssDNA) in RNA polymerase II transcription bubbles [19], [20]. Likewise, the structure of RNA polymerase II complexed with Spt5 was recently solved, and again, ssDNA was shown to exist solely within the RNA polymerase II complex [21], [22]. In addition, because RNA polymerase II has been found to transcribe the Igμ gene in only the sense direction [23], the bottom (or template) DNA strand should be protected from deamination by nascent RNA produced by the elongating complex. A similar conundrum exists for CSR. That is, although some studies suggest that AID mediates CSR by mutating ssDNA exposed by RNA-DNA hybrids (i.e. R-loops; [24]) on the top strand DNA of the switch region, this model does not explain how AID would mutate the bottom DNA strand within R-loops to produce a dsDNA break. AID may access the bottom strand of the switch region through several mechanisms. One mechanism involves exposure of the bottom strand of a transcribed switch region by AID-directed ExoI-induced excision of the top DNA strand which would then lead to a second round of AID attack on the bottom strand [25]. A different explanation for how AID might act on both DNA strands is suggested by the observation that purified AID mutates supercoiled plasmid DNA on both strands in vitro [26]. That is, it is possible that substrate accessibility to AID is mediated by the supercoiling of DNA that is caused by transcription, which may be enhanced by a stalled transcription complex by Spt5 [3], and/or the RNA exosome [4].
As described in the present report, we have sought to test the role of supercoiling in rendering both strands of DNA accessible to AID. In previous work, we used sensitivity to bisulfite-mediated deamination to detect regions of ssDNA. We showed that in hypermutating B cells, the Ig V-region is enriched for patches of ssDNA compared to genes that are not mutated by AID [18]. In the present study, we have used a similar assay and found that actively transcribed genes are enriched for ∼7-nucleotide ssDNA patches, both in mammalian cells and in E.coli. These patches are present on both DNA strands. Furthermore, the frequency of these patches is an accurate predictor of AID activity at reporter substrates in mammalian cells and in E.coli. These ssDNA patches are not caused by RNA-DNA hybrids (i.e. R-loops), but instead, are produced by DNA supercoiling caused by transcription elongation. As described here, our results suggest one simple and specific method for how transcription renders DNA accessible to AID.
Results
ssDNA Frequency Correlates with Somatic Hypermutation Rates at a Transgene
We previously described an assay for detecting ssDNA in cells, based on the capacity of sodium bisulfite to convert dC to dU in single stranded but not double stranded DNA [18]. In this assay, fixed nuclei are exposed to sodium bisulfite, after which DNA is isolated and sequenced to identify regions in which dC was converted to dU. By carrying out the sodium bisulfite reaction in nuclei, we aimed to preserve protein-DNA interactions as they exist in vivo, as well as regions of ssDNA that would otherwise be disrupted during nucleic acid isolation. We have used this assay on both ex vivo mouse B cells and on Ramos cells - an immortalized centroblast-like cell line which undergoes constitutive SHM in culture.
Continuing this study, we now show that the V-region has a higher ssDNA frequency over other regions within the Ig locus (Figure S1A). Although sodium bisulfite and AID produce the same biochemical transaction (i.e. deamination of dC), ssDNA frequency within the V-region is not reduced in AID-deficient Ramos cells (Figure S1B) or in AID−/ − mice [18] indicating that the tracks of deaminated cytidines (i.e. dU) that we observed in B cells are caused by sodium bisulfite. Inasmuch as AID acts on ssDNA, the correlation between the frequencies of SHM and ssDNA patches at different genomic regions suggested that by identifying the molecular basis of the ssDNA patches we might elucidate how AID is recruited in SHM in this context.
As a first step in this analysis, we sought to measure whether the frequency of ssDNA patches correlates with mutation rates of the same genetic sequence. We measured these features in two DNA regions of our Ramos cell lines: the heavy chain V region and a GFP reporter gene (Figure 1A). For this analysis, we utilized a provirus that harbours a GFP gene containing a nonsense codon (TAG) located within a preferred target motif for AID (i.e. WRC), such that mutations (revertants) are detected as GFP-positive cells [27] (Figure S2A). This retrovirus does not contain any obvious Ig sequence. The retrovirus was stably integrated into the Ramos genome at a single copy (data not shown), and mutation frequencies at the GFP gene were measured by fluctuation analysis [28]. Using both AID-proficient and AID-deficient Ramos cells we prepared multiple cell lines bearing independent GFP proviruses, and as expected, mutation was greatly decreased in AID-deficient Ramos cells (Figure S2B). Figure 1A shows the representation of all the accumulated data on the actual location and length of each patch of ssDNA in the V-region and GFP genes. Wagon-wheels are depicted for each gene showing the number of ssDNA patches present per sequence analyzed. The majority of sequences which harbour ssDNA contain only one patch per sequence (Figure 1A). Our analysis thus showed that both strands of both V-region and GFP genes included patches of ssDNA. As shown previously [11], this finding correlates relatively well with the fact that AID mutates both strands at approximately equal frequencies (Figure S2D; see below for further discussion).

In order to compare results for different cell lines, different genes and different conditions, we have defined several summary measurements. Median ssDNA patch length is deduced from a cluster plot of the observed patch lengths (Figure 1B); ssDNA strand bias (Figure 1C) is defined as the fraction of the total number of nucleotides in ssDNA patches present on the top strand; ssDNA density (Figure 1E) is defined as the total number of nucleotides in single stranded patches divided by the total number of nucleotides examined for each gene in each cell line. As shown in Figure 1, the median length of these patches was similar in the V-region and GFP DNA (i.e. 7 nucleotides; Figure 1B), and, like the V-region, the patches within the GFP gene were equally distributed on both top and bottom strands (Figure 1C). Mutation rates at the GFP gene were ∼30-fold lower than at the V-region (Figure 1D), while the frequency of ssDNA at the GFP gene was ∼3.5 fold lower than at the V-region (Figure 1E), providing initial evidence of a link between SHM and ssDNA patch frequency.
To test whether the ssDNA frequency at the GFP gene correlates with SHM rates we required Ramos cell lines that mutate the GFP gene at differing rates. One source of such material was to use independently generated proviruses, which, as found in similar systems, had different mutation rates (Figure S2C). We also sought to use cell lines in which the difference in mutation frequency was genetically determined. Based on a previous report that the V-region promoter has an element that can enhance SHM [29], we tested whether incorporation of the Ramos V-region promoter enhances SHM of the GFP transgene. Indeed, we found that the GFP reversion frequency can be enhanced ∼5-fold by placing a 245 bp or a 1.1 kb segment of the Ramos V-region promoter upstream of the GFP gene (Figure S2A and S2B; VPS and VPL, respectively).
We then measured the occurrence of ssDNA patches in selected cell lines and defined a simple parameter, frequency of ssDNA. Using 12 independent transfectants in which the GFP gene is mutating at rates ranging from 0.4 to 17×10−5 mutations/base pair/generation (Figure S2C), we found that there was a strong correlation (r2 = 0.719, p = 0.0005) between ssDNA frequency and mutation frequency at the GFP gene (Figure 1F). Furthermore, as transcription rates correlate with AID activity, we compared transcript levels of the GFP transgene in the Ramos transfectants that produced both the highest and lowest frequencies of ssDNA/mutations at this site (VPL-6 and GFP-14, respectively: Figure 1F). As seen in Figure 1G, transcript levels correlate with both ssDNA patch formation and SHM frequency, supporting a role for transcription in this process. Moreover, ssDNA patch density is reduced in a dose dependent manner by inhibiting transcription elongation with actinomycin D (Figure 1H), as expected from our previous observation that α-amanitin, which inhibits transcription initiation, ablates the presence of ssDNA [18]. Interestingly, we also observed a dose dependent reduction is ssDNA with the use of the topoisomerase I inhibitor, camptothecin (Figure 1H). While this effect of camptothecin has an indirect inhibitory effect on transcription elongation, camptothecin inhibits topoisomerase I and alters the local superhelicity of the DNA. Thus, the reduction in ssDNA frequency observed using camptothecin may be independent of its effects on transcription elongation. Although these data suggest that transcription elongation is responsible for the generation of ssDNA patches, the effects of these inhibitors on ssDNA formation may be due to secondary or indirect effects, and thus caution must be exercised when interpreting this data. Collectively, these data show that the frequency of ssDNA correlates both with transcription and with AID mutation rates within the same genetic sequence, thus providing circumstantial evidence that these bisulfite-accessible ssDNA patches are substrates for AID.
ssDNA Patches within the Murine 5′μ Switch Region Correlate with the Requirements of Class Switch Recombination
Previous work has suggested that CSR is mediated by AID-deamination of R-loops within switch regions [24], [30]. R-loops are RNA:DNA hybrids generated by the RNA polymerase II complex and expose the top strand for AID-mediated attack [24], [30]. However, the current model for AID-induced CSR requires the deamination of both DNA strands within switch regions leading to the generation of a staggered dsDNA break [31]–[33]. Because R-loops were previously identified using purified nucleic acids treated with bisulfite [24], [30], we reasoned that ssDNA patches may have been disrupted during this purification process, as we previously found for the V-region [18].
To test whether ssDNA patches exist on both strands in switch regions, we carried out the bisulfite reaction on purified nuclei from primary murine B cells that had been stimulated to undergo CSR by lipopolysaccharide (LPS) treatment. As shown in Figure 2A, ssDNA patches were identified downstream of the JH4 region as well as immediately upstream of the μ-switch region in mature unstimulated and stimulated B cells. Wagon-wheels depicting the number of ssDNA patches per sequence show that most sequences that harbour ssDNA only contain one ssDNA patch (Figure 2A). Similar to the data obtained in Ramos cells, the patches had a median length of ∼7 nucleotides at both locations (Figure 2B), and were present on both the top and bottom strands with approximately equal frequencies upon LPS-stimulation (Figure S3A). Importantly, we observed no ssDNA patches in a non-transcribed gene, CD4, while unstimulated or LPS-stimulated B cells were enriched for ssDNA at the 3′JH4 region, the 5′μ-switch region (Figure 2C). These findings further support the role of transcription in producing ssDNA patches.
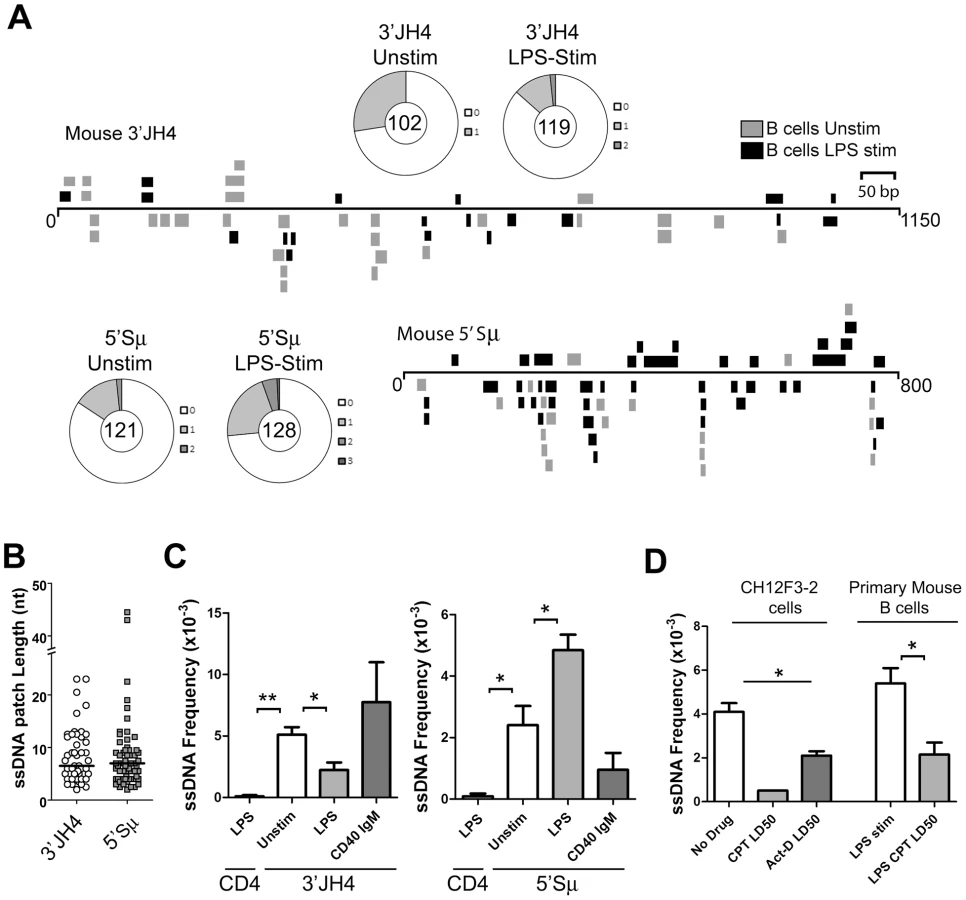
Interestingly, LPS-stimulation led to a statistically significant drop in the ssDNA frequency at the 3′JH4 region and a comparable increase in ssDNA frequency at the 5′μ-switch region (Figure 2C). This result was due to a decrease in the percent of sequences harbouring ssDNA patches at the 3′JH4 region and an increase in the percent of sequences harbouring ssDNA patches in the 5′Sμ region (Figure 2A). These findings are consistent with previous results that LPS-stimulation induces CSR, but not SHM, in primary murine B cells [34]. On the other hand, stimulation of ex vivo B cells with IgM and α-CD40, which activates B cells but does not induce CSR (data not shown), does not lead to an increase in ssDNA patch formation at the Sμ region (Figure 2C). However, we found that various treatments that stimulate CSR to IgG1, IgG3 and IgA did not lead to an increase in the ssDNA frequency in the 5′ regions of the Sγ1, Sγ3, and Sα regions, respectively (Figure S3B). While we don't know the reason for this result, it is consistent with the finding that conditions that stimulate CSR to IgG3 and IgG1 do not lead to AID-induced mutations [35] or to AID-induced dsDNA breaks [36] in the Sγ3 region, as opposed to the Sμ region [35], [36].
We next tested whether the ssDNA patches at the Sμ region could be reduced using the topoisomerase I inhibitor, camptothecin, as well as a transcription elongation inhibitor, actinomycin D, as was observed for SHM. In fact, camptothecin, which reduces switch region breaks and CSR in the CH12F3-2 murine cell line [37], also disrupts ssDNA patch formation in CH12F3-2 cells as well as in primary mouse B cells stimulated with LPS (Figure 2D) suggesting that the reduction in AID-induced switch region breaks might be due to a reduction in ssDNA patches. Treating CH12F3-2 cells with actinomycin D also led to a decrease in the ssDNA frequency at the 5′Sμ region (Figure 2D). Once again, the effects of these inhibitors on ssDNA formation may be due to secondary or indirect effects, and thus caution must be exercised when interpreting this data. Nevertheless, these data suggest that the bisulfite-accessible patches within the Ig locus in primary murine B cells are 1) caused by transcription elongation and 2) might allow access to AID on the bottom DNA strand within the switch region.
Mutation Frequency Somewhat Correlates with ssDNA Frequency at Non-Ig Genes
A recent report shows that Spt5 density at a gene predicts AID mutability [3]. Although ssDNA does not occur within the Spt5-RNA polymerase II complex [21], [22], it may be enriched near this complex. Hence, we examined whether the frequency of ssDNA patches correlates with Spt5 density in LPS-stimulated primary mouse B cells. As mentioned above, we found that the CD4 gene does not have any detectable ssDNA patches (Figure 3A). By contrast, ssDNA patch formation was detectable in all transcribed genes that we examined, and was higher in some genes (i.e. Btg1 and Psma4) than what we found within Ig genes in primary murine B cells (Figure 2C). Although we did not observe a correlation between Spt5 density and ssDNA patch frequency (Figure 3A), we found that the presence of ssDNA patches is a common feature of transcribed genes. However, we did observe a correlation between ssDNA frequency and mutation frequency in some of these genes (Figure 3B). That is, 4 out of 4 genes that have a ssDNA frequency above 0.005 have mutation frequencies above 7.5×10⁻⁵, while only 4 out of 8 genes that have a ssDNA frequency below 0.005 have mutation frequencies above 7.5×10⁻⁵ (Student's t-test, P<0.05). In fact, closer examination of the Btg-1 gene, which had the highest frequency of ssDNA of all genes, revealed that mutations at dC reported by Liu et al. [38] clustered around a region in the Btg-1 gene that was enriched in ssDNA patches (Figure 3C). These data indicate that ssDNA patch frequency is a predictor of AID mutability, but also reveals that other factors or properties of a gene are important for AID-induced mutations.

ssDNA Patches and AID Mutagenesis Are Enhanced by Negative Supercoiling
Transcription has been shown to produce local supercoiling of transcribed DNA [39]; positive supercoiling (increased winding of the DNA) occurs downstream of the transcription complex while negative supercoiling (increased unwinding of the DNA) occurs upstream [40], [41]. Negative supercoiling produces melted DNA [42], [43], and so we hypothesized that negatively supercoiled DNA may be responsible for the ssDNA patches characterized in this report. Interestingly, Storb and colleagues previously showed that AID has increased mutagenic activity on (negatively) supercoiled plasmid DNA in vitro [26].
In bacteria, negative supercoiling is relieved by topoisomerase 1 (TopA), and as a result, the DNA of TopA mutant bacteria is more highly supercoiled than in wildtype bacteria [44]. In principle, a comparison of ssDNA and AID-mediated mutation rates in wildtype and TopA mutants might indicate whether negative supercoiling is important for AID activity. Previous work has shown that AID is mutagenic in E. coli [7], [14]. We therefore tested whether DNA in E.coli has ssDNA patches similar to those seen in mammalian DNA, and if so, whether the density of the patches is higher in the absence of topoisomerase.
For this purpose we examined the structure of an inducible gene in E.coli. Wildtype [BL21(DE3)] and TopA mutant [VS111(DE3)] bacteria were transformed with an IPTG-inducible expression vector, treated with IPTG for 1 hour, and then subjected to a modified version of the in situ bisulfite protocol (see Materials and Methods). In this assay, we used an IPTG-inducible AID expression vector that expresses a catalytically dead AID(T27N), although any primary sequence would suffice for this analysis. Supercoiling can be assayed on bacterial plasmids by its mobility in chloroquine gel electrophoresis (see Materials and Methods). As expected, IPTG induction resulted in hyper-negative supercoiling (HNSC) in VS111(DE3) but not in BL21(DE3) controls (Figure 4A) as observed by the strong single banding pattern observed in the IPTG induced VS111(DE3) lane (Figure 4A, lane 4 and Figure S4A). IPTG induction also increased the ssDNA patch density in both strains of E. coli (Figure 4B), but the increase was ∼3 fold greater in the TopA mutant. Patch length was not significantly affected by IPTG induction and was similar in both strains to the length that we observed in mammalian cells (Figure 4C) and patches were present on both strands of the DNA (Figure 4D and Figure S4B).

To determine whether increased negative supercoiling also results in increased AID mutagenic activity, we generated an IPTG-inducible AID expression vector that also contains a Kanamycin resistance (KanR) gene with a L94P mutation which results in Kanamycin sensitivity (KanS) (Figure 4E). This mutation exists in a preferential target for AID (TACC is a WRCY motif). Mutation of either of the two cytidines at proline 94, resulting in either a serine or leucine at residue 94, restores KanR (Figure 4E).
Using the empty vector control, p-GEX5.3KanS, that does not code for AID, we found that the background mutation frequency of the TopA mutant strain VS111 was ∼10-fold higher than the BL21 strain, and ∼2-fold higher than the MG1655(DE3) strain, which is the parental wildtype strain to VS111 (Figure 4F). MG1655(DE3), like the BL21 strain, is not deficient in TopA and thus does not undergo hypernegative supercoiling as observed on a chloroquine gel electrophoresis (Figure S4A). Importantly, we observed a 5.8 to 12.8-fold increase in AID-induced mutation frequency in the VS111 strain (TopA deficient) relative to the BL21 strain and MG1655 strain, respectively (Figure 4F), even though IPTG induction led to similar AID protein levels in each strain (Figure S4C). These results indicate that negative supercoiling induced by transcription creates ssDNA patches and increases AID-mediated mutagenesis. Together with other work showing that AID deaminates dC only in ssDNA, our results argue that one role of transcription in SHM is to create supercoiling, which then generates single-stranded DNA patches that are substrates for AID-mediated deamination.
RNaseH1 Does Not Impact Bisulfite-Accessible ssDNA Patches
Another model for generating ssDNA focuses on the role of R-loops, in which the RNA-DNA hybrid formed in transcription renders the coding strand single-stranded. We tested whether the bisulfite-accessible patches found on both strands in the 5′μ switch region are caused by R-loop formation. We used the CH12F3-2 murine B cell line for this analysis, which is a cell line that can be induced to switch to IgA at high levels [45] and switching is exquisitely sensitive to the protein levels of factors required for CSR such as AID (Figure S5A and S5B: knockdown of AID by 2.4 and 5.8-fold leads to a 2.5 and 5.0-decrease in CSR, respectively) [3], RNF8/RNF168 [46], and DNA Ligase IV [47]. We then tested whether a human RNaseH1 (hRH1) expression vector reduces ssDNA patches in CH12F3-2 cells. hRH1 degrades RNA-DNA hybrids and has been shown to reduce R-loops when expressed in cells [48]. Two stable clones were obtained that overexpressed hRH1 (Figure 5A; clones hRH1-4 and -7). To test whether hRH1 was functional in these cells, we treated nuclei from the control and hRH1-expressing CH12F3-2 clones with the in situ bisulfite assay, and amplified R-loops using a 3′primer that binds to C to U converted DNA near the switch region and the standard 5′primer upstream of the 5′μ switch region that was used in Figure 2A. We observed a decrease, but not an ablation, in contiguously converted dC lengths (which likely represent R-loops) in clones expressing hRH1 compared to controls (Figure 5B and 5C) suggesting a decrease in R-loop length and frequency and offering a correlative readout that the hRH1 is active in the transfected cells. In addition, 8/19 (42%) sequences from the hRH1 clones did not have converted sequences 5′ of the primer compared to 3/14 (21%) for controls (Figure 5B) further suggesting that the hRH1 is indeed functional in this system. On the other hand, ssDNA patch frequency was unaffected in hRH1-expressing clones (Figure 5D and Figure S5C–S5E), and RNaseH1 did not affect the proliferative properties of CH12F3-2 (Figure S5F), suggesting that unlike R-loops, the ssDNA patches are not the product of RNA-DNA hybrids. We observed ssDNA patches in association with R-loop formation, however, they occur further upstream from the R-loops and are present at a slightly higher frequency to that of ssDNA patches amplified using non-converted primers for the 5′Sμ region (Figure 5D; Cont vs. Cont with R-loop and hRH1 vs. hRH1 with R-loop). Interestingly, the reduction in R-loop length and frequency caused by RNaseH1 did not lead to a decrease in CSR to IgA (Figure 5E). However, it is important to note that R-loops are still produced in the RNaseH1 expressing cells, and it is possible that this reduction in R-loop lengths and frequency is not sufficient to alter CSR activity. Furthermore, RNaseH1 expression did not impact the SHM frequency or the strand bias of mutations within the 5′Sμ region in CH12F3-2 cells (Figure 5F). In addition, expression of RNaseH1 in Ramos cells did not impact the SHM frequency at the V-region (Figure S5I) or at the GFP gene (Figure S5G), nor did it impact the ssDNA frequency at the V-region (Figure S5H). These data show that the bisulfite-accessible ssDNA patches are not caused by RNA-DNA hybrids, and suggest that under conventional circumstances, while the top strand of DNA is made accessible by the formation of R-loops at switch regions, the existence of ssDNA patches on both strands provides another mechanism by which AID can access the bottom strand of the switch region to mediate SHM and CSR. Thus, one of perhaps many mechanisms by which CSR proceeds is via the concerted action of R-loops, which allows access of AID to the top strand of DNA, and supercoiled-induced ssDNA patches, which allow access of AID to the bottom strand.

Discussion
While it is accepted that AID mediates SHM and CSR by deaminating ssDNA within Ig genes, the nature of the ssDNA and how it is generated has remained elusive. In this report, we reveal that Ig genes and a non-Ig transgene that is mutated by AID are enriched for short ∼7 nucleotide ssDNA patches. These ssDNA patches are reactive to sodium bisulfite only in intact nuclei [18]. Indeed, the ssDNA patches described in this report are consistent with the parameters necessary for an in vivo AID substrate, namely that: (1) these patches are found on both DNA strands thereby providing an explanation for the unbiased strand activity of AID during both SHM and CSR [10], [11] (Figure S2DFigure 5F), (2) the size of these patches correspond with the preferred in vitro substrate size for AID [49], and (3) patch formation is dependent on transcription elongation, concurrent with the requirement of transcription for SHM [5], [6]. Furthermore, we found that the frequency of these ssDNA patches strongly correlates with SHM rates within the Ig V-region and within a non-Ig transgene (GFP) that is mutated by AID. Together these data not only provide better insight into the role of DNA accessibilty during SHM and CSR, they also provide a model and mechanism of formation for one of the possible in vivo substrates of AID deamination.
The Ig switch regions have been shown to adopt a structure whereby the nascent sense transcript from the RNA polymerase II complex forms a RNA:DNA hybrid (i.e. R-loop) with the bottom DNA strand. The locations of these R-loops correlate with CSR [24], [50] and a large deletion of the switch region reduces both R-loop formation and CSR [30]. In addition, inverting the γ1 switch region reduces CSR to γ1 by ∼3 fold, and this inversion is thought to reduce R-loop formation [51]. Thus, R-loops play an important role in producing ssDNA during CSR. However, while the R-loop model explains how the top strand becomes accessible to AID, on its own it fails to explain how the bottom strand would be targeted for deamination, a prerequisite for CSR, and thus other processes must be taking place to allow for AID to access the bottom strand. It was recently shown that sense transcription through the switch region is sufficient for CSR while antisense transcripts are dispensable for this process [52]. This suggests that secondary structures produced during sense transcription elongation provide access to AID on both strands. Indeed, ExoI excision tracts can also potentially expose ssDNA on the bottom strand during CSR [25]. Previous findings showed that the bottom strand in the Ig switch region does not harbour ssDNA [24], [53]. This result is most likely due to the method of bisulfite deamination, which was carried out on purified nucleic acid [24], [53]. By carrying out the sodium bisulfite assay on intact nuclei, we show that the region immediately upstream of the μ switch region harbours short ssDNA patches on both DNA strands that increase in frequency when primary B cells (Figure 2C) or CH12F3-2 cells (Figure 5D) are stimulated to undergo CSR. This assay also identifies long stretches of sodium-bisulfite conversion within switch regions in murine B cells [18] or CH12F3-2 cells (Figure 5B and 5C) which are likely caused by R-loop formation. Although the ssDNA patches are shorter (∼7 nucleotides) within the switch region than the observed ssDNA within R-loops that can be kilobases in length [24], the frequency of these patches are significantly higher (∼1 patch per kilobase within the 5′μ switch region) than the frequency of R-loops in primary murine B cells (4% of switch regions contain R-loops) [30]. Furthermore, since R-loops only form in G-rich sequences [24], rare A:T rich switch sequences that are enriched for AID hotspot motifs, such as in Xenopus laevis, are unlikely to adopt an R-loop configuration, but nonetheless support CSR [54] indicating that they are accessed by AID through an unknown mechanism. In scenarios where R-loops are either decreased or absent, we suggest that ssDNA patches that are found on both DNA strands are sufficient to produce the AID-initiated staggered dsDNA breaks associated with CSR events. In addition, it is also possible that an AID induced mutation leads to Exo1-mediated excision of the top strand exposing the bottom strand to AID-attack [25]. In the context of normal R-loop formation, we suggest that all of these processes cooperate to allow AID access to the non-template (top) and template (bottom) DNA strands.
It has been appreciated for some time that transcription of the Ig gene is required for both SHM and CSR processes [5], [6]. It was assumed that transcription produces the ssDNA necessary for AID reactivity [7], [15], [16], [32]. Our findings that transcription initiation [18] and elongation inhibitors ablate ssDNA patches in the V-region in Ramos cells and the 5′μ switch region in CH12F3-2 cells (Figure 1H and Figure 2D, respectively) and that nontranscribed genes contain no ssDNA patches (Figure 2D; CD4 gene) provides additional independent evidence that the short ssDNA patches observed in Ig sequences are transcription-dependent. However, it is unlikely that the ssDNA patches are produced by bisulfite conversion of ssDNA tracts within the RNA polymerase II transcription bubble itself. First, the ssDNA patches observed in this report are shorter than the predicted transcription bubble size of ∼11 nucleotides [19]. Second, a recent report shows that the RNA polymerase II complex transcribes the Ramos V-region only in the sense direction [23] which would lead to ssDNA formation on the top strand only since the nascent transcript is expected to protect the bottom strand from bisulfite conversion. However, ssDNA patches are observed on both strands at approximately equal frequency in the Ramos V-region [11] arguing against the transcription bubble as the source of ssDNA. Moreover, it is unlikely that AID can gain access to dC within the transcription bubble since it is largely occupied by the RNA polymerase II complex [19], [20]. In the context of the AID targeting factor Spt5, crystallographic studies of Spt5 complexed to RNA polymerase II show that ssDNA is buried within the active centre cleft of the transcription machinery [21], [22].
DNA supercoiling caused by transcription is a potential explanation for the ssDNA patches that we observe in Ig genes. Indeed, we observe an alteration in ssDNA frequencies in mammalian cells treated with the topoisomerase I inhibitor camptothecin, which can alter local DNA superhelicity. Furthermore, TopA-deficiency in E.coli results in hyper-negative supercoiling of transcribed plasmid DNA, increased frequency of ssDNA patches, and AID mutagenic activity (Figure 4). It is known that TopA-deficiency can lead to R-loop formation upon induction of transcription. However, R-loop formation does not occur during transcription induced negative supercoiling in a plasmid system when the nascent mRNA is translated [55]. In our system, AID is actively transcribed and translated upon IPTG induction. In addition, TopA-deficiency did not lead to increased ssDNA patch lengths which would be expected if these were R-loops (Figure 4C). Furthermore, we did not observe an increase in ssDNA patches on the top strand in the TopA-deficient clones (Figure S4B), which would be expected since the sense strand would be displaced by the transcript. These data are consistent with the notion that negative supercoiling is the likely source of the ssDNA patches.
Further support for negative supercoiling as the source of ssDNA patches that we observed is that AID and sodium bisulfite can deaminate supercoiled plasmid DNA but not relaxed linearized DNA in vitro [26]. During transcription, negative supercoiling develops upstream of the transcription complex [40], [41] and has been associated with melted DNA that can in turn lead to the formation of secondary DNA structures, such as stem loops and cruciforms [42], [43]. In contrast, positive supercoiling occurs downstream of the transcription complex [40]. The dual effects of positive and negative supercoiling may work in concert to increase targets for AID. That is, as the transcription complex progresses through the gene leaving in its wake under wound and melted DNA, positive supercoiling downstream of the transcription complex may act to slow down or pause RNA polymerase II. Indeed, Canugovi et al. observed that inducing pausing/stalling of T7 RNA polymerase resulted in the accumulation of multiple clustered AID-induced mutations in vitro [56], and AID was recently found to interact with Spt5, a factor associated with stalled RNA polymerase II [3]. Rajagopal et al. recently showed that RNA polymerase II complexes pause and accumulate upstream of the μ switch region [57], which might serve to provide DNA structures that act as targets for AID during CSR. Indeed, the slight increase in ssDNA patch frequency that we observed in sequences that contained R-loops in the CH12F3-2 cells (Figure 5D) correlates nicely with the findings of Rajagopal et al. [57] which showed an accumulation of RNA pol II just 5′ of the Sμ region, possibly due to R-loop formation. Furthermore, Wang et al. have shown histone marks at the switch regions indicative of open and accessible chromatin and this finding was also associated with RNA polymerase II presence and stalling at switch regions [58]. Stalling of the RNA polymerase II may not only result in the production and maintenance of R-loops, but may act to sustain secondary structures in the DNA produced by negative supercoiling. These findings suggest that the activity of AID on short ssDNA patches would largely be limited by the activity of topoisomerases, removing transcription-induced supercoiling and thus eliminating ssDNA patches for AID to act on. Indeed, Kobayashi et al. showed that topoisomerase 1 mRNA and protein levels were reduced upon AID expression and this reduction was associated with altered DNA structure at the μ switch region, increased switch region cleavage, and increased CSR [37]. The reduction in topoisomerase 1 may therefore lead to transcriptional pausing allowing for the increased duration of negatively supercoiled DNA that can be mutated by AID. On the other hand, complete inhibition of topoisomerase 1 by camptothecin might indirectly lead to the cessation of all RNA polymerase II transcription as the RNA polymerase may not be able to bypass the complex or lesion produced by the camptothecin thereby resulting in a reduction in ssDNA patches (Figure 2D) and AID-induced DNA breaks [37]. Another potential source for the generation of these ssDNA patches is the RNA exosome which was recently reported to associate with AID and stimulate AID activity to both DNA strands in a manner that is independent of replication protein A (RPA) or the phosphorylation status of AID [4]. Our current and previous findings [18] that the immunoglobulin genes are enriched for ssDNA patches on both strands is consistent with the activity proposed by the RNA exosome. Nevertheless, our current findings support the role of negative supercoiling in the generation of these patches, but do not preclude the involvement of the RNA exosome or the Spt5 factor. Future work will reveal whether these factors are in part or in whole responsible for the generation of these ssDNA patches that are observed in this report. Furthermore, it is important to note that while we suggest that ssDNA patches observed in this report are produced by transcription-induced negative supercoiling, ssDNA could be produced by other mechanisms, such as transcription-induced G4 DNA formation [59], melting of DNA during replication, interaction of transcription factors with DNA, and DNA repair intermediates [25].
While the evidence supports the notion that the bisulfite-accessible ssDNA patches that are observed in Ig genes are substrates for AID, their frequency is likely not the sole determinant of mutability. First, while the 5′ end of the V-region is enriched in ssDNA patches (Figure 1A), it does not harbour many mutations (Figure S2D). Thus, near the V-region promoter, there is poor correlation between ssDNA patches and mutation frequency. In fact, previous studies have shown that the region near the promoter is spared from mutation (e.g. [60]) for reasons that are not known. Our data clearly states that it is not because there are no ssDNA patches there, and hence there must be another reason for this result. Perhaps the explanation is that AID associates with the elongation RNA polymerase II complex, or AID associates with stalled RNA polymerases, and both of these don't occur near the promoter region. Second, non-mutating genes also harbour ssDNA patches (Figure 3). Rather, our work suggests that ssDNA patches, which occur in transcribed genes and are produced by negative supercoiling, render DNA single stranded and accessible to AID, however some other molecular feature is required to target AID to Ig genes to mediate SHM and CSR. Thus, B cells have likely evolved several mechanisms to ensure enhanced targeting of AID to Ig genes. It is likely that multiple conditions must be met in a gene in order to produce the potential for high mutagenic activity by AID; these include a high frequency of ssDNA, the presence of specific cis-acting sequences [61], [62], a high degree of transcriptional pausing [3], [56], association with the RNA exosome [4], and the association of AID to trans-acting factors which function to link AID to each of the above-mentioned conditions (e.g. transcriptional pausing and Spt5). Integration of these distinct targeting mechanisms would ensure that the Ig locus is preferentially mutated by AID over other genomic regions, while if any of these conditions on their own are met, it could subject that gene to low levels of AID activity [38], [63], [64].
Materials and Methods
Ethics Statement
All animal work was conducted according to our institutions animal welfare guidelines.
In Vitro Cell Culture
Ramos and CH12F3-2 cells were cultured and stimulated as previously described [11], [46]. Retroviral transductions were carried out as previously described [65]. Ramos cells, CH12F3-2 cells and primary ex vivo LPS stimulated B cells were treated with inhibitors for 24 hours prior to in situ bisulfite treatment using their respective LD50 and LD25 values. The LD50 for actinomycin-D (Sigma-Aldrich) and camptothecin (Sigma-Aldrich) treatments were 10.85 ng/mL and 0.3405 µM for Ramos cells, respectively. LD25 for actinomycin-D and camptothecin were 6.4 ng/mL and 0.23 µM for Ramos cells, respectively. The LD50 for camptothecin treatment in CH12F3-2 cells was 0.75 µM. The LD50 for camptothecin treatment in primary ex vivo LPS stimulated B cells was 0.55 µM. LD50s for Ramos and CH12F3-2 cells were measured by trypan blue exclusion and confirmed by flow cytometry using Annexin V (eBioscience) staining 24 hours after drug was added. <1% DMSO was present at these inhibitor concentrations during culture. CH12F3-2 and Ramos cells were transfected with pA-HRH-delter-Zeo (see below) and selected with zeocin (Invitrogen) at 300 µg/ml. Western blots for RNaseH1 (Santa Cruz biotechnology; C-18) and β-actin (Abcam) were carried out using manufacturer's instructions. CSR assays using CH12F3-2 cells were described previously [46]. Lentiviral shRNA constructs for AID-targeting (TRC0000112031 and TRC0000112033) and GFP-targeting negative control (TRC0000072179) shRNA were provided by Dr. Jason Moffat. CH12F3-2 cells were transduced with lentivirus for 24 hours, followed by puromycin selection for 3 days. Positively transduced cells were then subjected to CSR assays.
Bacterial Strains and Plasmids
The pGFP*I puro retroviral vector was kindly provided by Dr. Matthias Wabl [27]. The GFP gene harbours a nonsense codon within an AID hotspot motif. An AID-mediated nonsense reversion mutation will occur on the bottom strand within the dC that is opposite the dG in the TAG codon. The vector was linearized with XhoI and the 245 bp and 1.1 kb V–region promoters were introduced into the retroviral vector using primers with XhoI flanking regions. To amplify the promoter regions, the following primers were used: RevVprom with FwdVPS (245 bp promoter) and RevVprom with FwdVPL (1.1 kb promoter) (see Table S1). The vector encoding RNaseH1 (pA-HRH-delter-Zeo) was kindly provided by Dr. Xialu Li [48]. VS111(DE3) [F− LAM - rph-I ΔtopA] and MG1655 [F− LAM - rph-I] were kindly donated by Dr. Fenfei Leng (Florida International University). Strain MG1655 was made into a DE3 strain using the Lambda DE3 Lysogenization Kit (EMD Cat# 69734-3). For the bisulfite analysis on the AID gene, BL21 (DE3) and VS111(DE3) were transformed with the IPTG-inducible plasmid p-GEX5.3-hAID(T27N) (catalytically inactive), and grown in Luria broth (LB) supplemented with 200 µg/mL ampicillin, while VS111(DE3) was additionally supplemented with 20 µg/mL chloramphenicol. IPTG-inductions were carried out for 1 hr at 1 µg/mL IPTG when cells reached an O.D. 600 of 0.4. For the kanamycin reversion assay, p-GEX5.3 and p-GEX5.3-hAID(WT) plasmids were used to introduce a kanamycin sensitive gene which contains an L94P mutation producing a p-GEX5.3KanS empty vector control and p-GEX5.3-hAID(WT)KanS plasmid respectively. The KanR gene has its own bacterial promoter and was placed directly downstream of the AID gene. There is no transcription terminator between the AID and KanR gene.
In Situ Bisulfite Assay
In situ bisulfite assay on Ramos, CH12F3-2 and ex vivo mouse B cells was performed as previously described [18]. In situ bisulfite on bacteria was carried out on BL21(DE3) and VS111(DE3). Bacteria was grown to an optical density of 0.4 and supplemented with 1 mM IPTG for 1 hour after which a modified version of the in situ sodium bisulfite assay was carried out (a detailed protocol will be provided upon request). ssDNA patches were defined as lengths of DNA that contain at least 2 consecutively bisulfite-converted dCs on the same strand. Average patch lengths are reported in this study, which were obtained from averaging the minimum and maximum patch lengths for each individual patch. That is, the minimum length of ssDNA patches is the distance between the converted dCs (or converted dGs for the bottom strand). The maximum length of ssDNA is the distance between (and excluding) the nonconverted dCs (or nonconverted dGs for the bottom strand) extending out from the 5′ and 3′ ends of the ssDNA patch. Two ssDNA patches in uninduced BL21(DE3) occurred in A/T rich regions (Figure 4C) resulting in short minimum patches (i.e. 3 and 4 nucleotides) but very large maximum patch sizes (i.e. 19 and 22 nucleotides) owing to the lack of dC nucleotides next to the patch. In this case, we assumed a maximum patch size that would result in an average patch size that we observed in otherwise typical patches. We previously defined patches as those containing at least 3 consecutively bisulfite-converted dCs [18], and this number was chosen based on a statistically significant difference between ssDNA at the V - and constant regions which was not the case when 2 consecutively bisulfite-converted dCs was used to define patches. Hence, the average patch lengths reported in that study were longer (∼10 nucleotides). In this report, we defined patches as having 2 consecutively bisulfite-converted dCs since statistically significant differences in ssDNA frequency existed between the Ramos V - and non-V-regions (Figure S1A). The ssDNA frequency at each gene was calculated by dividing the total number of nucleotides found in ssDNA (average ssDNA patch lengths were used) by the total number of nucleotides analysed. Extracted genomic DNA from in situ bisulfite treated-CH12F3-2 clones were subjected to PCR amplification to determine R-loops using a forward primer that binds ∼800 bp upstream of the murine μ switch region (Table S1; FMusSmu) and a reverse primer that binds just 5′ of the μ switch region in which the dGs have been replaced by dAs (Table S1; RRloop) to bind to sequences in which the dCs have been converted to dUs on the top strand R-loop lengths were determined as contiguously converted dCs starting from the reverse primer and extending 5′ of that region.
Flow Cytometric Analyses
Flow cytometry for GFP expression in Ramos cells was carried out as previously described [65]. Reversion of the stop codon at the Igμ gene in Ramos cells was carried out as previously described [11]. Flow cytometry on CH12F3-2 cells stimulated to switch were carried out using intracellular staining with PE-anti-mouse IgA antibody (eBioscience) and extracellular staining with PE-anti-mouse IgA antibody (Southern Biotech).
Primary B Cell Stimulation
All animal work was conducted according to our institutions animal welfare guidelines. Primary mature B cells were isolated and stimulated with LPS to induce CSR to the IgG3 isotype, as previously described [66]. Briefly, primary B cells were isolated from spleen of 10–12 week old mice using a magnetic negative selection B-cell enrichment kit (Stem Cell Technologies). ∼1 to 2×10⁷ cells were seeded in a 10 cm culture dish and exposed to 25 µg/mL of lipopolysaccharide (Escherichia coli serotype 055:B5; Sigma-Aldrich) for 48 hours. Primary mature B cells were also stimulated to isotype switch to IgA with 2 ng/mL TGF-β, 1.5 ng/mL IL-5, 25 µg/mL LPS and 10 ng/mL IL-4 for 48 hours and to switch to IgG1 25 µg/mL LPS and 10 ng/mL IL-4 for 48 hours. Cultured cells were grown in RPMI 1640 medium (Invitrogen) supplemented with 10% fetal calf serum (HyClone) and 50 µM β-mercaptoethanol (Invitrogen) at 37°C and 5% CO2.
Chloroquine Agarose Gel Analysis of Plasmid Topology
BL21(DE3) and VS111(DE3) bacterial strains expressing the catalytically inactive AID expression plasmid, p-GEX5.3-hAID(T27N), were grown to an optical density of 0.4 and induced for 1 hr with 1 mM IPTG as described above for Figure 4A. For Figure S4A BL21(DE3), VS111(DE3) and MG1655(DE3) strains expressing a control plasmid, p-GEX5.3KanS, were used. Following IPTG induction, plasmids were obtained using the GeneJet Plasmid mini prep kit (Fermentas). Plasmid topological status from each strain was analysed on a 1% agarose gel containing 5 µg/mL chloroquine (Sigma) run overnight at 3 V/cm. Gels were stained with 1 µg/ml ethidium bromide (BioShop) for 30 mins and exposed to visualize plasmid bands. Chloroquine is a DNA intercalator that introduces positive supercoils into DNA and allows for the resolution of different negatively supercoiled plasmid species. During chloroquine gel electrophoresis, more negatively supercoiled plasmids run further through the gel than their less negatively supercoiled counterparts.
Kanamycin Reversion Assay
BL21, MG1655, and VS111 bacterial strains containing the p-GEX5.3-hAID(WT)KanS and control p-GEX5.3KanS constructs were grown in LB Ampicillin (200 µg/mL Ampicillin) to an OD 0.3. Samples were then induced with 0.5 mM IPTG for 1 hour at 18°C. OD values were obtained after 1 hour to determine live bacterial cell numbers. All bacteria were plated on LB Kanamycin plates (100 µg/mL Kanamycin). Plates were incubated O/N at 37°C and colonies were counted the following day. Kanamycin reversion frequencies were calculated by dividing the total number of Kanamycin resistant colonies by the total number of live bacteria plated out. To determine the AID-specific mutation frequency, the mutation frequency of control p-GEX5.3KanS was subtracted from the p-GEX5.3-hAID(WT)KanS mutation frequency for each strain.
Sequencing of Ramos V-Region and CH12F3-2 5′Sμ Region for Mutation Analysis
Genomic DNA was prepared and regions of interest were amplified using Pfu Ultra II (Agilent). Amplification of the Ramos V-region was done using the Ramos V-region primers (Table S1: Ramos V-region). Amplification of the CH12F3-2 5′Sμ region was done using the Murine 5′μ Switch primers (Table S1: Murine 5′μ Switch). PCR products were cloned and sequenced. For Figure S5I, 11519 nucleotides and 10865 nucleotides were examined for the Ramos V-region in vector control and hRH1 expressing cells, respectively. For Figure 5F, 16029 nucleotides and 24781 nucleotides were examined for the CH12F3-2 5′Sμ region in control and hRH1 expressing clones respectively.
qPCR Analysis
qPCR analysis of GFP expression relative to GAPDH expression was done on Ramos clone GFP-14 and VPL-6. Total RNA was isolated using TRIzol reagent (Invitrogen) as per manufacturer's protocols. Reverse transcription was conducted using an oligo dT primer and SuperScriptIII (Invirtogen) as per manufacturer's protocols. qPCR was conducted on the 7300 Real Time PCR System (Applied Biosystems) using primers (Table S1) for GFP qPCR and GAPDH qPCR.
Statistical Analysis
All analyses were performed using GraphPad Prism. For Student's t tests, Mann-Whitney tests and linear regression analysis, P values of 0.05 or less were considered significant. All error bars represent the standard error of the mean (SEM).
Supporting Information
Zdroje
1. DurandyAHonjoT 2001 Human genetic defects in class-switch recombination (hyper-IgM syndromes). Curr Opin Immunol 13 543 548
2. Di NoiaJMNeubergerMS 2007 Molecular mechanisms of antibody somatic hypermutation. Annu Rev Biochem 76 1 22
3. PavriRGazumyanAJankovicMDi VirgilioMKleinI 2010 Activation-induced cytidine deaminase targets DNA at sites of RNA polymerase II stalling by interaction with Spt5. Cell 143 122 133
4. BasuUMengFLKeimCGrinsteinVPefanisE 2011 The RNA Exosome Targets the AID Cytidine Deaminase to Both Strands of Transcribed Duplex DNA Substrates. Cell 144 353 363
5. PetersAStorbU 1996 Somatic hypermutation of immunoglobulin genes is linked to transcription initiation. Immunity 4 57 65
6. BachlJCarlsonCGray-SchopferVDessingMOlssonC 2001 Increased transcription levels induce higher mutation rates in a hypermutating cell line. J Immunol 166 5051 5057
7. RamiroARStavropoulosPJankovicMNussenzweigMC 2003 Transcription enhances AID-mediated cytidine deamination by exposing single-stranded DNA on the nontemplate strand. Nat Immunol 4 452 456
8. DuquetteMLPhamPGoodmanMFMaizelsN 2005 AID binds to transcription-induced structures in c-MYC that map to regions associated with translocation and hypermutation. Oncogene
9. Gomez-GonzalezBAguileraA 2007 Activation-induced cytidine deaminase action is strongly stimulated by mutations of the THO complex. Proc Natl Acad Sci U S A 104 8409 8414
10. RadaCDi NoiaJMNeubergerMS 2004 Mismatch recognition and uracil excision provide complementary paths to both Ig switching and the A/T-focused phase of somatic mutation. Mol Cell 16 163 171
11. FriederDLarijaniMCollinsCShulmanMMartinA 2009 The concerted action of Msh2 and UNG stimulates somatic hypermutation at A. T base pairs. Mol Cell Biol 29 5148 5157
12. MaulRWSaribasakHMartomoSAMcClureRLYangW 2011 Uracil residues dependent on the deaminase AID in immunoglobulin gene variable and switch regions. Nat Immunol 12 70 76
13. StavnezerJGuikemaJESchraderCE 2008 Mechanism and regulation of class switch recombination. Annu Rev Immunol 26 261 292
14. Petersen-MahrtSKHarrisRSNeubergerMS 2002 AID mutates E. coli suggesting a DNA deamination mechanism for antibody diversification. Nature 418 99 104
15. BransteitterRPhamPScharffMDGoodmanMF 2003 Activation-induced cytidine deaminase deaminates deoxycytidine on single-stranded DNA but requires the action of RNase. Proc Natl Acad Sci U S A 100 4102 4107
16. SohailAKlapaczJSamaranayakeMUllahABhagwatAS 2003 Human activation-induced cytidine deaminase causes transcription-dependent, strand-biased C to U deaminations. Nucleic Acids Res 31 2990 2994
17. LarijaniMMartinA 2007 Single-stranded DNA structure and positional context of the target cytidine determine the enzymatic efficiency of AID. Mol Cell Biol 27 8038 8048
18. RonaiDIglesias-UsselMDFanMLiZMartinA 2007 Detection of chromatin-associated single-stranded DNA in regions targeted for somatic hypermutation. J Exp Med 204 181 190
19. KettenbergerHArmacheKJCramerP 2004 Complete RNA polymerase II elongation complex structure and its interactions with NTP and TFIIS. Mol Cell 16 955 965
20. AndreckaJTreutleinBArcusaMAMuschielokALewisR 2009 Nano positioning system reveals the course of upstream and nontemplate DNA within the RNA polymerase II elongation complex. Nucleic Acids Res 37 5803 5809
21. Martinez-RucoboFWSainsburySCheungACCramerP 2011 Architecture of the RNA polymerase-Spt4/5 complex and basis of universal transcription processivity. Embo J 30 1302 1310
22. KleinBJBoseDBakerKJYusoffZMZhangX 2011 RNA polymerase and transcription elongation factor Spt4/5 complex structure. Proc Natl Acad Sci U S A 108 546 550
23. ZhaoYDunn-WaltersDKBaroneFSpencerJ 2009 Antisense transcripts of V(D)J rearrangements; artifacts caused by false priming? Mol Immunol 46 2357 2362
24. YuKChedinFHsiehCLWilsonTELieberMR 2003 R-loops at immunoglobulin class switch regions in the chromosomes of stimulated B cells. Nat Immunol 4 442 451
25. VallurACMaizelsN 2008 Activities of human exonuclease 1 that promote cleavage of transcribed immunoglobulin switch regions. Proc Natl Acad Sci U S A 105 16508 16512
26. ShenHMStorbU 2004 Activation-induced cytidine deaminase (AID) can target both DNA strands when the DNA is supercoiled. Proc Natl Acad Sci U S A 101 12997 13002
27. WangCLHarperRAWablM 2004 Genome-wide somatic hypermutation. Proc Natl Acad Sci U S A 101 7352 7356
28. ZhangWBardwellPDWooCJPoltoratskyVScharffMD 2001 Clonal instability of V region hypermutation in the Ramos Burkitt's lymphoma cell line. Int Immunol 13 1175 1184
29. YangSYFugmannSDSchatzDG 2006 Control of gene conversion and somatic hypermutation by immunoglobulin promoter and enhancer sequences. J Exp Med 203 2919 2928
30. HuangFTYuKBalterBBSelsingEOrucZ 2007 Sequence dependence of chromosomal R-loops at the immunoglobulin heavy-chain Smu class switch region. Mol Cell Biol 27 5921 5932
31. ChenXKinoshitaKHonjoT 2001 Variable deletion and duplication at recombination junction ends: implication for staggered double-strand cleavage in class-switch recombination. Proc Natl Acad Sci U S A 98 13860 13865
32. MartinAScharffMD 2002 AID and mismatch repair in antibody diversification. Nature Rev Immunol 2 605 614
33. RushJSFugmannSDSchatzDG 2004 Staggered AID-dependent DNA double strand breaks are the predominant DNA lesions targeted to S mu in Ig class switch recombination. Int Immunol 16 549 557
34. Reina-San-MartinBDifilippantonioSHanitschLMasilamaniRFNussenzweigA 2003 H2AX is required for recombination between immunoglobulin switch regions but not for intra-switch region recombination or somatic hypermutation. J Exp Med 197 1767 1778
35. SchraderCEBradleySPVardoJMochegovaSNFlanaganE 2003 Mutations occur in the Ig Smu region but rarely in Sgamma regions prior to class switch recombination. Embo J 22 5893 5903
36. StaszewskiOBakerREUcherAJMartierRStavnezerJ 2011 Activation-induced cytidine deaminase induces reproducible DNA breaks at many non-Ig Loci in activated B cells. Mol Cell 41 232 242
37. KobayashiMAidaMNagaokaHBegumNAKitawakiY 2009 AID-induced decrease in topoisomerase 1 induces DNA structural alteration and DNA cleavage for class switch recombination. Proc Natl Acad Sci U S A 106 22375 22380
38. LiuMDukeJLRichterDJVinuesaCGGoodnowCC 2008 Two levels of protection for the B cell genome during somatic hypermutation. Nature 451 841 845
39. WuHYShyySHWangJCLiuLF 1988 Transcription generates positively and negatively supercoiled domains in the template. Cell 53 433 440
40. LiuLFWangJC 1987 Supercoiling of the DNA template during transcription. Proc Natl Acad Sci U S A 84 7024 7027
41. RahmouniARWellsRD 1992 Direct evidence for the effect of transcription on local DNA supercoiling in vivo. J Mol Biol 223 131 144
42. DaynAMalkhosyanSMirkinSM 1992 Transcriptionally driven cruciform formation in vivo. Nucleic Acids Res 20 5991 5997
43. KrasilnikovASPodtelezhnikovAVologodskiiAMirkinSM 1999 Large-scale effects of transcriptional DNA supercoiling in vivo. J Mol Biol 292 1149 1160
44. SamulRLengF 2007 Transcription-coupled hypernegative supercoiling of plasmid DNA by T7 RNA polymerase in Escherichia coli topoisomerase I-deficient strains. J Mol Biol 374 925 935
45. NakamuraMKondoSSugaiMNazareaMImamuraS 1996 High frequency class switching of an IgM+ B lymphoma clone CH12F3 to IgA+ cells. Int Immunol 8 193 201
46. RamachandranSChahwanRNepalRMFriederDPanierS 2010 The RNF8/RNF168 ubiquitin ligase cascade facilitates class switch recombination. Proc Natl Acad Sci U S A 107 809 814
47. HanLYuK 2008 Altered kinetics of nonhomologous end joining and class switch recombination in ligase IV-deficient B cells. J Exp Med 205 2745 2753
48. LiXManleyJL 2005 Inactivation of the SR protein splicing factor ASF/SF2 results in genomic instability. Cell 122 365 378
49. LarijaniMPetrovAPKolenchenkoOBerruMKrylovSN 2007 AID associates with single-stranded DNA with high affinity and a long complex half-life in a sequence-independent manner. Mol Cell Biol 27 20 30
50. YuKLieberMR 2003 Nucleic acid structures and enzymes in the immunoglobulin class switch recombination mechanism. DNA Repair (Amst) 2 1163 1174
51. ShinkuraRTianMSmithMChuaKFujiwaraY 2003 The influence of transcriptional orientation on endogenous switch region function. Nat Immunol 4 435 441
52. HaddadDOrucZPugetNLaviolette-MaliratNPhilippeM 2011 Sense transcription through the S region is essential for immunoglobulin class switch recombination. Embo J 30 1608 1620
53. YuKRoyDHuangFTLieberMR 2006 Detection and structural analysis of R-loops. Methods Enzymol 409 316 329
54. ZarrinAAAltFWChaudhuriJStokesNKaushalD 2004 An evolutionarily conserved target motif for immunoglobulin class-switch recombination. Nat Immunol 5 1275 1281
55. MasseEDroletM 1999 Escherichia coli DNA topoisomerase I inhibits R-loop formation by relaxing transcription-induced negative supercoiling. J Biol Chem 274 16659 16664
56. CanugoviCSamaranayakeMBhagwatAS 2009 Transcriptional pausing and stalling causes multiple clustered mutations by human activation-induced deaminase. Faseb J 23 34 44
57. RajagopalDMaulRWGhoshAChakrabortyTKhamlichiAA 2009 Immunoglobulin switch mu sequence causes RNA polymerase II accumulation and reduces dA hypermutation. J Exp Med 206 1237 1244
58. WangLWuerffelRFeldmanSKhamlichiAAKenterAL 2009 S region sequence, RNA polymerase II, and histone modifications create chromatin accessibility during class switch recombination. J Exp Med 206 1817 1830
59. DuquetteMLHandaPVincentJATaylorAFMaizelsN 2004 Intracellular transcription of G-rich DNAs induces formation of G-loops, novel structures containing G4 DNA. Genes Dev 18 1618 1629
60. LongerichSTanakaABozekGNicolaeDStorbU 2005 The very 5′ end and the constant region of Ig genes are spared from somatic mutation because AID does not access these regions. J Exp Med 202 1443 1454
61. MichaelNMartinTENicolaeDKimNPadjenK 2002 Effects of sequence and structure on the hypermutability of immunoglobulin genes. Immunity 16 123 134
62. DunnickWACollinsJTShiJWestfieldGFontaineC 2009 Switch recombination and somatic hypermutation are controlled by the heavy chain 3′ enhancer region. J Exp Med 206 2613 2623
63. MartinAScharffMD 2002 Somatic hypermutation of the AID transgene in B and non-B cells. Proc Natl Acad Sci U S A 99 12304 12308
64. YamaneAReschWKuoNKuchenSLiZ Deep-sequencing identification of the genomic targets of the cytidine deaminase AID and its cofactor RPA in B lymphocytes. Nat Immunol 12 62 69
65. ParsaJYBasitWWangCLGommermanJLCarlyleJR 2007 AID mutates a non-immunoglobulin transgene independent of chromosomal position. Mol Immunol 44 567 575
66. ZaheenABoulianneBParsaJYRamachandranSGommermanJL 2009 AID constrains germinal center size by rendering B cells susceptible to apoptosis. Blood 114 547 554
Štítky
Genetika Reprodukční medicínaČlánek vyšel v časopise
PLOS Genetics
2012 Číslo 2
- Kazuistika – Perspektivy využití precizované medicíny v rámci personalizované specifické terapie onkologických pacientů
- Nobelova cena za chemii pro genetické nůžky: Objev, který změní naši budoucnost?
- Technologie na bázi RNA v klinické praxi: od přebarvených petúnií k terapii vzácných a dosud jen obtížně léčitelných chorob u lidí
- „Nepředstavovali jsme si, že náš výzkum povede přímo ke vzniku nových léků, dokonce ještě za našeho života“
- Bezplatné služby pro diagnostiku ATTRv amyloidózy pro kardiology
Nejčtenější v tomto čísle
- Gene Expression and Stress Response Mediated by the Epigenetic Regulation of a Transposable Element Small RNA
- Contrasting Properties of Gene-Specific Regulatory, Coding, and Copy Number Mutations in : Frequency, Effects, and Dominance
- Homeobox Genes Critically Regulate Embryo Implantation by Controlling Paracrine Signaling between Uterine Stroma and Epithelium
- Nondisjunction of a Single Chromosome Leads to Breakage and Activation of DNA Damage Checkpoint in G2
Zvyšte si kvalifikaci online z pohodlí domova
Mazová zátka a její řešení
nový kurzVšechny kurzy