
Genetic Effects at Pleiotropic Loci Are Context-Dependent with Consequences for the Maintenance of Genetic Variation in Populations
Context-dependent genetic effects, including genotype-by-environment and genotype-by-sex interactions, are a potential mechanism by which genetic variation of complex traits is maintained in populations. Pleiotropic genetic effects are also thought to play an important role in evolution, reflecting functional and developmental relationships among traits. We examine context-dependent genetic effects at pleiotropic loci associated with normal variation in multiple metabolic syndrome (MetS) components (obesity, dyslipidemia, and diabetes-related traits). MetS prevalence is increasing in Western societies and, while environmental in origin, presents substantial variation in individual response. We identify 23 pleiotropic MetS quantitative trait loci (QTL) in an F16 advanced intercross between the LG/J and SM/J inbred mouse strains (Wustl:LG,SM-G16; n = 1002). Half of each family was fed a high-fat diet and half fed a low-fat diet; and additive, dominance, and parent-of-origin imprinting genotypic effects were examined in animals partitioned into sex, diet, and sex-by-diet cohorts. We examine the context-dependency of the underlying additive, dominance, and imprinting genetic effects of the traits associated with these pleiotropic QTL. Further, we examine sequence polymorphisms (SNPs) between LG/J and SM/J as well as differential expression of positional candidate genes in these regions. We show that genetic associations are different in different sex, diet, and sex-by-diet settings. We also show that over - or underdominance and ecological cross-over interactions for single phenotypes may not be common, however multidimensional synthetic phenotypes at loci with pleiotropic effects can produce situations that favor the maintenance of genetic variation in populations. Our findings have important implications for evolution and the notion of personalized medicine.
Published in the journal:
. PLoS Genet 7(9): e32767. doi:10.1371/journal.pgen.1002256
Category:
Research Article
doi:
https://doi.org/10.1371/journal.pgen.1002256
Summary
Context-dependent genetic effects, including genotype-by-environment and genotype-by-sex interactions, are a potential mechanism by which genetic variation of complex traits is maintained in populations. Pleiotropic genetic effects are also thought to play an important role in evolution, reflecting functional and developmental relationships among traits. We examine context-dependent genetic effects at pleiotropic loci associated with normal variation in multiple metabolic syndrome (MetS) components (obesity, dyslipidemia, and diabetes-related traits). MetS prevalence is increasing in Western societies and, while environmental in origin, presents substantial variation in individual response. We identify 23 pleiotropic MetS quantitative trait loci (QTL) in an F16 advanced intercross between the LG/J and SM/J inbred mouse strains (Wustl:LG,SM-G16; n = 1002). Half of each family was fed a high-fat diet and half fed a low-fat diet; and additive, dominance, and parent-of-origin imprinting genotypic effects were examined in animals partitioned into sex, diet, and sex-by-diet cohorts. We examine the context-dependency of the underlying additive, dominance, and imprinting genetic effects of the traits associated with these pleiotropic QTL. Further, we examine sequence polymorphisms (SNPs) between LG/J and SM/J as well as differential expression of positional candidate genes in these regions. We show that genetic associations are different in different sex, diet, and sex-by-diet settings. We also show that over - or underdominance and ecological cross-over interactions for single phenotypes may not be common, however multidimensional synthetic phenotypes at loci with pleiotropic effects can produce situations that favor the maintenance of genetic variation in populations. Our findings have important implications for evolution and the notion of personalized medicine.
Introduction
Metabolic syndrome (MetS) is an array of co-occurring disorders including dyslipidemia, high blood pressure, impaired glucose tolerance, and obesity. Individuals diagnosed with MetS have increased risk of developing cardiovascular disease (CVD) and type-2 diabetes (T2D) [1]. MetS prevalence currently exceeds 20% in the United States and is increasing in developing countries [2]. This increase is hypothesized to be the result of over-consumption of high-caloric foods in conjunction with sedentary lifestyles [3]. There is also a genetic component as individual responses to dietary environment and to lifestyle modifications vary [1], [4]. Understanding MetS etiology is challenging because phenotypic variation is caused by complex interactions of many genes of small effects, by environmental factors, and by gene-by-environment interactions [5]–[9]. Thus animal models are valuable because genetic and environmental influences can be controlled for and monitored in populations of known genetic structure [10].
Mouse models have made major contributions to our understanding of complex disease etiology, including hypertension, obesity, and T2D [11]–[15]. However, MetS per se is not well defined in mice because the physiological features of individual components vary between mice and humans, reflecting 65–85 million years of divergent evolution [16]–[19]. Nevertheless, mouse models have increased our understanding of the pathophysiology of metabolic disorders and genes with robust effects have been identified using both spontaneous (e.g. ob/ob mice) and transgenic models. Further understanding of MetS will come from interrogating genes with small allelic effects on physiological processes, the source of variation in complex traits relevant to evolution and biomedicine, rather than from single genes with large defects.
We present results of a study of loci associated with normal variation in multiple MetS components: obesity (fatpad and organ weights), serum lipid levels (cholesterol, triglycerides and free-fatty acids levels), and diabetes (serum insulin and glucose levels, and response to a glucose challenge) in an F16 generation of an Advanced Intercross Line (AIL) formed from the LG/J and SM/J inbred mouse strains (Wustl:LG,SM-G16). Variation in complex traits in LG/J x SM/J is due to many genes of small effect interacting with each other and with the environment. Quantitative trait loci (QTL) have previously been mapped for obesity, serum chemistries and growth-related phenotypes in crosses of these strains [20]–[25]. This study is the first to look at variation in multiple MetS components mapping to the same locus in a very advanced generation of the LG/J x SM/J AIL. Here we examine these MetS QTL under a systems biology framework, incorporating both biomedical and evolutionary perspectives.
We report additive and dominance genotypic effects in addition to parent-of-origin genomic imprinting effects. Parent-of-origin imprinting is defined as the unequal expression of maternally and paternally derived copies of an allele, and has been shown to affect variation in metabolic traits [26]–. We examine the context-dependency of these genetic effects – additive, dominance and imprinting – by examining response to high - and low-fat dietary treatments. Context-dependency, defined as genotype-by-environment and genotype-by-sex interactions [29] is a proposed mechanism by which genetic variation is maintained in populations [30]–[33]. We examine whether additive genotypic values for a given trait or trait combination change rank across different environments, which is consistent with a so-called ecological cross-over [34]. When different alleles are favored in different environments, selection can maintain genetic variation at the locus.
Another mechanism that can maintain genetic variation in a population is balancing selection at pleiotropic loci, those associated with variation in multiple phenotypes, with different dominance relations for the different traits, so-called differential dominance [22], [35]. When differential dominance is present, some linear combination of traits will display over - or underdominance, even when no single trait does. If directional selection occurs along these linear combinations, there is balancing selection on the locus and genetic variation will be maintained.
We examine context-dependent genetic effects and differential dominance at pleiotropic loci associated with MetS components. Patterns of pleiotropy are thought to reflect functional and developmental relationships among traits [36], and have been hypothesized to serve as potential constraints on adaptive evolution [37] as well as underlie correlated phenotypic responses to selection [38]. Although pleiotropy has long been proposed to be ubiquitous, few studies have measured enough traits in a focal population to analyze this aspect of genetic architecture [39]. Our results show that additive, dominance and parent-of-origin genomic imprinting genetic effects vary among diet, sex and diet-by-sex environments among metabolic traits mapping to the same locus. This indicates that context-dependency is an important aspect of pleiotropic connections among components of MetS, a result supported by recent work on the foraging gene in Drosophila melanogaster [40], [41]. Understanding these connections and their evolutionary implications is important for understanding disease etiology and is relevant to personalized medicine.
Results
Pleiotropic QTL
We identify 23 pleiotropic QTL associated with normal variation in two or more MetS components. Of these 23 loci, 12 pass genome-wide significance while 11 pass chromosome-wise significance. The average locus is associated with variation in 4 traits. The traits examined here show moderate to high genetic correlations among each other and are reported with their respective heritabilities in Ehrich et al. 2005 [22]. Fourteen loci (61%) are associated with both diabetes (glucose levels, glucose tolerance, and serum insulin) and obesity (fatpad and organ weights). Six loci (26%) are associated with both dyslipidemia (serum cholesterol, free-fatty acid and triglycerides levels) and obesity. Three loci (13%) are associated with adiposity (fatpad weight) and liver weight. Liver weight is moderately correlated with percent liver fat (r = 0.61) [42], and nonalcoholic fatty liver disease is strongly associated with MetS [43], [44].
Additive effects are found at 20 loci (87%), and dominance and imprinting effects are found at 21 loci (91%). On average, in cohorts showing additive effects, LL homozygotes have higher serum lipid levels (cholesterol, triglyceride, free-fatty acid) and heavier weights (fatpad and/or organ weights) but respond better to a glucose challenge (intra-peritoneal glucose tolerance test) than SS homozygotes. In cohorts showing dominance effects, the L allele is dominant to the S allele 52% of the time. In cohorts with dominance effects and no additivity, we find overdominance (heterozygotes have significantly higher genotypic values) 60% of the time and underdominance (heterozygotes have significantly lower genotypic values) 40% of the time. In cohorts showing parent-of-origin imprinting effects, 15% show maternal expression imprinting, 10% show paternal expression imprinting, 21% show polar dominance imprinting (no additive effects), and 54% show bipolar dominance imprinting (no additive or dominance effects) (Table S1). Description of the various parent-of-origin imprinting patterns is found in Wolf et al. (2008) [45]. High-fat fed males are the most commonly affected cohort for the organ weights and diabetes-related traits, and high-fat fed females are the most commonly affected cohort for the serum lipid levels and fatpad weights [24], [25], [46].
Context-Dependency of Genetic Effects
Table S1 breaks down the context-dependency of the QTL reported here and lists candidate genes found in the intervals. The mean QTL support interval is ≈4.0 Mb and contains 39 genes, many previously associated with metabolic disorders. Some of these positional candidates show expression differences between LG/J and SM/J in liver and white-fat tissues (Tables S1, S2 and S3), and we have annotated SNPs between the two strains in both coding and noncoding DNA in these intervals (Table S4). For example, we find a highly significant QTL on chromosome 1, DMetS1b, associated with variation in both serum lipid levels and obesity. This region overlaps QTL previously associated with high-density lipoprotein cholesterol (HDL) levels in studies using multiple crosses of mouse [15], [25], [47], [48]. Additionally, this region was recently reported as associated with both cholesterol and free-fatty acid levels in LG/J x SM/J [25]. The current analysis reveals this region is also associated with variation in gonadal and total fat-pad weights.
The genotypic effects at this QTL are complex (Figure 1a–1d). For cholesterol, there is an additive effect in the full population whereby individuals homozygous for the L allele have higher cholesterol. For free-fatty acid levels, in addition to this additive effect, high-fat fed females have maternal expression imprinting and low-fat fed females have paternal expression imprinting. High-fat fed males have polar dominance imprinting and low-fat fed males have underdominance effects with no significant additive or imprinting effects. For gonadal fatpad weight, high-fat fed females have bipolar dominance imprinting. For total fatpad weight, high-fat fed females have bipolar dominance imprinting and high-fat fed males have an additive effect.

This QTL spans 2.2Mb and contains 47 genes, 10 of which are candidates previously associated with metabolic disorders. Expression analysis of genes in this QTL show that in white-fat, 43 of these 47 genes are expressed in LG/J and SM/J, and 9 (21%) are significantly differentially expressed between the two strains. Three of these 9 genes, F11r, Fcgr2b and Nr1i3, are associated with variation in MetS components (Figure S1a-S1c and Table S2) [49]–[51]. In liver, 39 genes in the interval are expressed in LG/J and SM/J, and 10 (26%) of these genes are significantly differentially expressed between the two strains. Five of these 10 genes, Apoa2, F11r, Hsd17b7, Nr1i3, and Usf1, are MetS candidates (Figure S2a-S2e and Table S3) [47], [49]–[53].
There are 4,933 SNPs between LG/J and SM/J in DMetS1b (Table S4). Twenty–four of these SNPs are non-synonymous, and two of these non-synonymous SNPs (rs8258232 and rs8258226) fall in Apoa2. One of these SNPs, rs8258226, is the location of a mutation previously found to affect HDL cholesterol levels in multiple strains of mice [47]. The same Ala61 -to - Val61 substitution first identified by Wang et al. (2004) as the potential causal change underlying HDL variation is the same substitution found in LG/J. Many other DMetS1b SNPs, both in and around MetS candidates, fall within noncoding DNA having high regulatory potential [54].
Differential Dominance
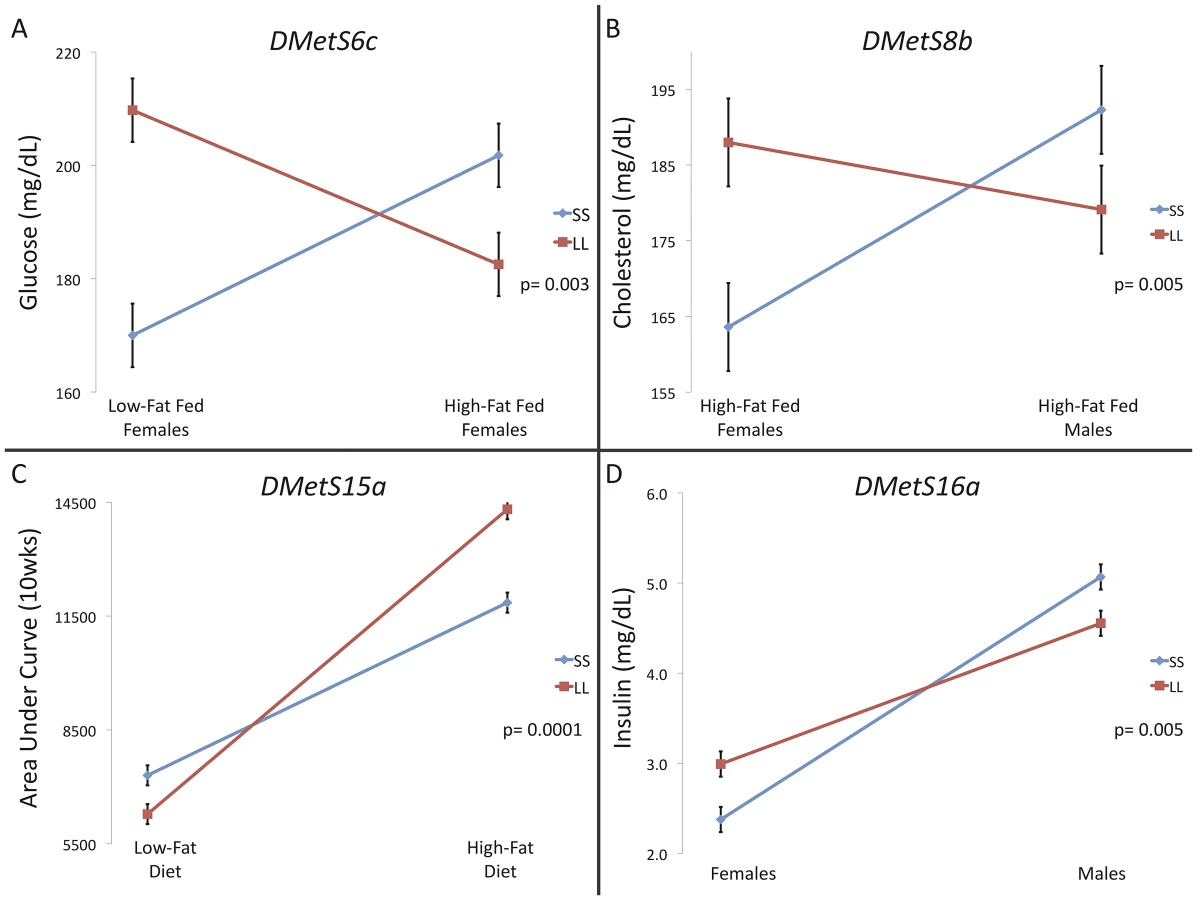
Differential dominance is a property of pleiotropy that occurs when different traits mapping to the locus vary in the magnitude of their dominance ratios (d/a). Because the dominance ratios vary, the additive and dominance vectors are not colinear and some combination of traits will display over - or underdominance [35], [55], [56]. An example of differential dominance is found at a QTL on chromosome 6, DMetS6c. This locus is associated with variation in diabetes-related traits and liver weight (Table S1). The dominance ratios at DmetS6c differ between glucose levels in low-fat fed females (d/a = −0.9) and insulin levels in high-fat fed males (d/a = 1.2). These two traits also display antagonistic pleiotropy, where glucose in the low-fat fed females has a significant positive additive genotypic value (LL homozygotes have higher levels) and insulin in the high-fat fed males has a significant negative additive genotypic value (SS homozygotes have higher levels) (Figure 2a-2b). Six loci (26%; DMets2c, DMetS6b, DMetS6c, DMetS7c, DMetS10b, DMetS16a) show differential dominance (Table S1).

Gene-by-Environmental Interactions
Statistically significant interactions are of two types: ‘spreading’, where there is no difference between the genotypes in one sex and/or environment but a substantial difference in the alternate sex and/or environment, and ‘crossing’, where the rank order of allelic effects changes between sexes and/or environments [57]. Only crossing interactions can act to maintain allelic variation at a locus. We find 4 loci (17% of loci) having traits (6% of traits mapping to these loci) showing significant crossing interactions (DMetS6c, DMetS8b, DMetS15a, DMetS16a, Figure 3, Tables S1 and S7), indicating that with a few exceptions, the rank order of the homozygote genotypes remains the same in multiple environments for individual traits mapping to these loci. Three of the four crossing interactions occur in diabetes-related traits (glucose and insulin levels and area under the curve at 10wks), which have relatively lower genetic correlations among the traits mapped here [22]. This supports theoretical predictions that crossing genotype-by-environmental interactions would give rise to lower genetic correlations among traits [38].
Discussion
Pleiotropic effects underlie genetic correlations among traits. Variation in pleiotropy is essential for selection to shape patterns of phenotypic covariation [58].
We identify 23 pleiotropic loci affecting normal variation in multiple components of MetS, including obesity-, T2D-, and CVD-related traits. We find additive, dominance and parent-of-origin imprinting effects are equally prevalent, highlighting the complex genetic architecture underlying these common/ complex traits that together characterize a syndrome. This result has implications for human genome-wide association studies (GWAS), which generally assume just additivity despite growing evidence for non-additive genetic effects on complex traits [59], [60]. Indeed a recent study identified parent-of-origin effects associated with T2D in the Icelandic genealogy database, finding the effects are different between males and females [61] and illustrating the complex connections among genomic sequence, genetic effects, environment, and disease risk.
Identifying these connections is a challenge in human population studies because recording or controlling an individual's environment over time is not possible, although some studies have successfully examined gene-by-environment interactions [5], [62]–[64]. We show that genotype interacts with environment in significant ways, and these interactions are not always consistent among genotypes, across environments, or across traits within the same population.
This is seen clearly at DMetS1b discussed above [25], [47], [65]. While multiple traits individually map to this locus (cholesterol, free-fatty acids, gonadal fatpad and total fatpad weight), the underlying genetic effects vary among the traits and are highly context dependent (Figure 1a–1d). We find the additivity is consistent among cohorts showing significant additive effects. However, when considering the heterozygotes, we find complex interactions between the L and S alleles in the different patterns of imprinting and dominance. For free-fatty acids, the females have opposite parent-of-origin imprinting effects depending on whether they were fed a high-fat (maternal expression imprinting) or low-fat (paternal expression imprinting) diet. If females were pooled together for analysis without considering dietary environment, no parent-of-origin effects would be detected because the two sex-by-diet cohorts' effects negate each other when combined. Further, for high-fat fed females, paternal inheritance of the L allele is protective for free-fatty acids, gonadal fatpad weight, and total fatpad. For gonadal fatpad and total fatpad weight, maternal inheritance of the L allele results in higher weight. Thus the same allele, in the same cohort, confers both protection and risk depending on parent-of-origin.
We find differential dominance among traits at some of these loci, for example at DMets6c discussed above. We acknowledge that our QTL contain multiple genes that may be tightly linked and may individually influence each trait mapped to the locus [66]. While our results are consistent with differential dominance occurring at some QTL, we do not have the resolution to test if this is due to multiple tightly linked genes. However, Keightley and Kascer showed that differential dominance is expected in systems in which nonlinearities are present, for example in the saturation and feedback inhibition systems of metabolic networks [67]. In this situation, some combination of traits will display under - or overdominance at the same locus, even in the absence of trait-specific under - or overdominance, a phenomenon called multivariate overdominance [55]. Directional selection on the synthetic phenotype could result in balancing selection at the locus and the maintenance of genetic variability [33]. At DMetS6c, directional selection for fitness could favor a genotype associated with lower levels of both insulin and glucose levels (Figure 4). It is tempting to speculate that maintenance of variability through interactions between alleles at a locus associated with metabolic traits could facilitate short-term adaptations to rapidly changing environments. While this issue is outside the scope of the current study, the results presented here can inform testing of evolutionary hypotheses such as The Thrifty Gene Hypothesis [68], under a systems biology framework, in an attempt to understand the determinants of the increasing prevalence of MetS and other disorders affecting metabolic homeostasis.

Genetic variation can also be maintained when the rank order of homozygous genotypes changes between environments. While most loci examined here do not show significant crossing interactions within the range of the experiment, we do see a few loci consistent with an ecological cross-over between sex and dietary environments for single traits (Figure 3). It is important to note, however, that an interaction between sexes is different than an interaction across environments. The evolutionary outcome of an ecological cross-over will depend on the frequency with which each environment is experienced. For sex it is generally ≈50∶50. Thus even in the absence of differential selection between the sexes, allelic variation will be maintained in a crossing scenario. For environmental interactions such as diet, allelic variation will be a function of the relative frequency of the environment experienced. Empirical evidence supporting the theory that heterogeneous environments produce crossing interactions is inconsistent [69], [70]. In this study, the genotypes for most of our single traits at these loci differ in magnitude between environments without significant crossing, a so-called spreading interaction. However, the QTL examined here are pleiotropic and multivariate combinations of traits may exhibit rank order changes in heterogeneous environments. Consider, for example, the antagonistic pleiotropy and hence rank order change of homozygous genotypes seen between glucose levels in low-fat fed females and insulin levels in high-fat fed males at DMetS6c (Figure 2a–2b). Such a multidimensional synthetic interaction is consistent with the complex nonlinear connection of the traits comprising the MetS, and remains an open question for further exploration [14].
Once a genomic association is made, examination of the QTL can lead to identification of the quantitative trait gene (QTG) and eventually the quantitative trait nucleotide (QTN) affecting variation in the trait. We acknowledge that our QTL may contain multiple QTG and QTN, even when we fail to reject pleiotropy. We have identified candidate QTGs in our QTL regions, both from the literature and by examining differential expression between LG/J and SM/J in relevant tissues. We further identified QTN for experimental follow-up by examining SNPs between the strains both in and around QTGs. We present many fruitful regions for follow-up, including some novel positional candidate genes, for example Cacna7a located in DMetS8b, which is associated with normal variation in obesity and cholesterol levels. This gene encodes the pre-forming A1A subunit of voltage-gated calcium channels and has been found to influence the functionality of cholesterol-rich microdomains [71]. It is differentially expressed between LG/J and SM/J in both liver and white-fat and contains many SNPs in non-coding flanking and intronic regions having high-regulatory potential. This gene is associated with chronodisruption, the desynchronization of circadian rhythms [72], and with migraine headaches [73]. Recent research demonstrates an association among chronodisruption, migraine, and MetS components [74]–[76].
Another attractive locus for follow-up is the Apoa2 gene, which falls in DMetS1b. Variations in the homologous human APOA2 sequence have been well studied for association with MetS components in humans [77], [78]. We not only find Apoa2 is differentially expressed between LG/J and SM/J, but also identify a non-synonomous coding SNP (rs8258226) that has been independently associated with elevated cholesterol levels in multiple other strains of mice [47]. While this result is encouraging proof-of-principle in going from QTL → QTG → QTN, further experimentation is required to know if this mutation, let along this gene, is associated with variation in the other traits mapping to this locus. Indeed it has been found that, when a single locus is associated with multiple traits, different polymorphisms within the locus are independently associated with the various traits [29], [79]. So while the QTL is pleiotropic, the pleiotropy breaks down at the nucleotide level.
Overall, we find the genetic effects at these 23 QTL are highly context-dependent and are not consistent among the individual traits mapped. Our results indicate that if context such as sex and/or diet are not considered, not only can genetic signals in specific cohorts be masked and/or cancelled out in an aggregate study population, but also genetic effects can be erroneously assigned to specific cohorts within a population if the effects are pooled over all its members. We have shown that the genetic architecture underlying the individual traits mapping to these QTL is complicated, and so are the relationships among the traits themselves. Further, some patterns are consistent with evolutionary theory with respect to the maintenance of genetic variation in populations, even when specific variants are deleterious in particular environments or in particular combinations. While over - or underdominance and crossing interactions for single phenotypes may not be common, multidimensional synthetic phenotypes at QTL with pleiotropic effects can produce situations that favor the maintenance of genetic variation in populations. As Lewontin ([80]; p318) noted, “Context and interaction are of the essence”.
Gluckman et al. [81] recently discussed the challenges associated with understanding human biology in light of the current epidemic of metabolic disorders, and Sing et al. [6] proposed a series of steps a researcher should take to address issues of complex disease etiology. As the era of personalized medicine and individual whole-genome sequencing looms, it is important to keep in mind the ultimate goal of developing treatments and prevention strategies for individuals. For MetS, this goal may be attained through understanding the underlying genetic architecture of its disease components, of how these components relate to each other evolutionarily, and in what context. Mouse models may be especially appropriate for bridging the divide between evolutionary and biomedical research because they allow the study of the effects of natural alleles on normal variation, and human-mouse homology is well defined. Our results are important because they can be used to elucidate gene-by-environmental effects that could inform large-scale genomic study design in humans.
Materials and Methods
Ethics Statement
Our study involved mice and all animal care and handling procedures conformed to IACUC guidelines.
Population
The LG/J x SM/J Advanced Intercross Line (AIL) is managed as a pseudo-randomly mated line starting from the F2 generation. The LG/J strain originated from a selection experiment for large body size at 60 days and the SM/J strain originated from a selection experiment for small body size at 60 days [82]. Animals from each strain have been inbred by brother-sister mating for over 150 generations making them genetically homozygous with the exception of spontaneous mutations and the agouti locus in SM/J which is maintained heterozygous (a/Aw) for breeding purposes [83], [84].
The AIL was generated from an initial cross of 10 male SM/J mice and 10 female LG/J mice. Animals are randomly mated but brother-sister mating is not allowed. Only one male and one female are chosen from each family as breeders for the next generation, thereby eliminating variation in familial contributions to the next generation. This is an effective method of reducing inbreeding and doubling the effective population size of a colony relative to its census size [85]. The average number of breeding pairs in the AIL is 75, giving a census size of 150 and an effective population size of approximately 300 individuals.
This study used an experimental F16 population of 1,002 animals in 76 sibships, each averaging 6.8 animals. Animal husbandry details can be found in Ehrich et al. 2005 [86]. At weaning, males and females from each litter were partitioned into cohorts fed either high-fat (253 males; 248 females) or low-fat (247 males; 254 females) diets. The diets were isocaloric with the exception of calories from fat (Harlan Teklad cat. No. TD88137, 42% energy from fat; and Research Diets cat. No. D12284, 15% energy from fat, specially formulated; Table 1).

Phenotypes
Animals were weighed weekly for 20 weeks. A subset of animals (217 females, 113 fed the low-fat diet and 104 fed the high-fat diet; 213 males, 103 fed the low-fat diet and 110 fed the high-fat diet) were subject to an intra-peritoneal glucose tolerance test (IPGTT) at 10 and 20 weeks of age as described in Ehrich et al. 2005 [86]. Readings taken over the course of 2 hours were used to calculate the area under the curve (AUC), a measure of glucose tolerance. Animals were necropsied at 20 weeks of age (also described in Ehrich et al. 2005) and fasting (4 hr) serum cholesterol, free-fatty acid, triglyceride, glucose, and insulin were obtained from blood via cardiac puncture. Serum was frozen at −20°C until assayed by the Nutrition Obesity Research Center – Animal Model Research Core at Washington University. Additionally, fat pads (inguinal, mesenteric, renal and gonadal) and internal organs (heart, kidneys, liver, and spleen) were removed and weighed.
Genotypes
DNA was extracted from liver tissue using the QIAGEN kit. 1,536 single nucleotide polymorphisms (SNPs) were chosen from the CTC/Oxford SNP survey (www.well.ox.ac.uk/mouse/INBREDS/) and scored with the Illumina Golden Gate Bead Array. Genotyping was performed at the Washington University Genome Sequencing and Analysis Center. 1,402 autosomal SNPs were reliably scored and used in this study (Table S5).
A genetic map was created based on physical order of the SNPs along the autosomes (mm9; NCBI build 37). Recombination fractions were estimated using R/qtl [87]. Ordered genotypes were reconstructed at each marker from familial SNP data (F15 parents and their F16 offspring) using the Integer Linear Programming algorithm as implemented in PedPhase 2.1 [88]. Due to the computational intensity of the algorithm, it was necessary to partition the larger chromosomes before running the program. Additive (Xa) and dominance (Xd) genotypic scores were assigned at each marker: Xa = 1, 0, −1 and Xd = 0, 1, 0 for the LL, LS and SL, and SS genotypes, respectively. ‘L’ refers to an allele derived from the LG/J strain and ‘S’ refers to an allele derived from the SM/J strain. Further, we assigned parent-of-origin imprinting genotypic scores (Xi) to distinguish between reciprocal heterozygotes, LS and SL. By convention the first allele refers to that inherited from the father and the second from the mother. Imprinting genotypic scores for LL, LS, SL, and SS are Xi = 0, +1, −1, 0, respectively [89]. Additional genotypes were imputed at 1cM intervals between the markers using the equations of Haley and Knott [90] with the inclusion of equations derived for imputing imprinting genotypic scores [91].
QTL Mapping
Single locus analyses were performed using maximum likelihood in the Mixed Procedure in SAS 9.2. Our full mapping included: sex, diet, sex-by-diet interaction, the direct effects of the genomic locations (Xa, Xd, Xi), and their two - and three-way interactions with sex and diet as fixed effects. The full model explains variation in trait (Y) using the linear equation:where µ is the population mean and e is the residual. The regression coefficients are the additive [a = (GLL)−(GSS))/2], dominance [d = ((GLS+GSL)−(GLL-GSS))/2] and imprinting [i = (GLS−GSL)/2] genotypic scores, where G refers to the mean phenotype of all individuals sharing the subscripted genotype, and their interactions with sex (s) and/or with diet (d). Family and its interactions with sex and diet, including the three-way interaction, were included as random effects in the model. The −2 ln(likelihood) of this model was compared to a null model including only sex, diet and sex-by-diet interaction terms using a chi-square test with 12 df. Probabilities were transformed into LOD = −log10(Pr).
The number of independent tests was calculated using the Li and Ji method based on the eigenvalues of the correlation matrix of marker additive genotype scores [92]. This was used to calculate Bonferroni adjusted significance thresholds, 1−(1−α)1/M, where M is the number of independent tests. A significance threshold was calculated at the genome-wide level (LOD ≥3.90) as well as separately for each autosome (Table S6). With chromosome-wise significance, we expect 1 false positive result per trait. Our results overwhelm this in that there are 6–10 times the number of significant results for each trait as expected by chance under a null model of no QTL. Further, QTL with chromosome-wise significance have a history of replication across different mapping populations of this cross [24].
Pleiotropy
QTL for separately analyzed traits related to two or more metabolic syndrome (MetS) components mapping to the same cM position are considered pleiotropic QTL. When QTL support intervals for separately analyzed MetS component traits overlapped, but the separate trait peaks did not map to the same cM position, a formal test of pleiotropy was performed as described by Cheverud [36]. First, the most likely peak QTL positions for each single trait were identified, e.g. the position with the highest LOD score, and then the most likely combined position of the all the traits mapping to the region, weighted by their LOD scores, was identified. A X2 for model fit was obtained at each single trait peak and at the combined-trait position. The differences in X2 values between the separate and the combined-trait models were added together to generate a X2 test for pleiotropy [34]. The degrees of freedom were determined by the number of positions (corresponding to the number of traits) in the separate model minus the single position of the combined model. The null hypothesis is that the combined model fits the data better and there is most likely a single pleiotropic QTL. Because it is statistically simpler to have 1 QTL rather than multiple QTL, a significant result (Prob(X2) ≤ 0.05) indicates there is most likely more than one QTL in the region (hence rejecting the null hypothesis of pleiotropy). Support intervals were determined using a standard one-LOD drop from the highest LOD at the combined peak of the QTL [93] (Table S1).
Crossing Analysis
The genotypic values for each cohort were obtained at QTL showing significant additive*sex, additive*diet, and/or additive*sex*diet interactions. When the genotypic values for individuals with LL and SS genotypes were of opposite ranks between two cohorts showing significant additive effects, a formal test for crossing interactions was run. The effect of differential dispersion of trait means in different cohorts was removed by standardizing the variance in trait means for each cohort by the following equation:where Xkl is the trait value for the lth individual of the kth cohort. Xk and SDk are the mean and standard deviation of the kth cohort, and SDpooled is the average SD over all cohorts. This standardization removes the effect of differential dispersion of cohorts' means, hence eliminating the differences in the scale of the genotypic effects and leaving only the changes in the order of the genotypic means as the source of the interaction [57], [94]. These transformed trait values were analyzed by the mixed model in SAS as described above. If the significant additive*sex, additive*diet, and/or additive*sex*diet interaction effects remained at the QTL, and the genotypic values for individuals with LL and SS genotypes were of opposite ranks between cohorts, the interaction was considered to be ‘crossing’ and not ‘spreading’ (Table S7).
Expression Data
At necropsy, liver and gonadal fat pads (white fat) were collected from 4 males and 4 females representing each strain and diet. Tissue was immediately frozen in liquid nitrogen and stored at −80°C until extraction. RNA was extracted using RNeasy 96 Universal Tissue extraction kits (Qiagen, Valencia, CA), and quantified using a Nanodrop 2000 (Thermo Scientific, Wilmington, DE). Samples were submitted to the Washington University Microarray Core Facility, where quality was assessed using a 2100 Bioanalyzer (Agilent Tecnologies, Palo Alto, CA). RNA was reverse transcribed and amplified using an Illumina TotalPrep amplification kit (Ambion, Austin, TX) and then hybridized onto Illumina WG-6 v.2 BeadChips (Illumina, San Diego, CA). Arrays were scanned using the Illumina Beadstation 500, and images processed using Illumina BeadScan software. Intensity values were analyzed using Illumina BeadStudio.
Illumina raw data from 45,281 unique probes were examined using LUMI [95]. Data were transformed using a variance stabilization transformation [96], which takes into account the large number of technical replicates on Illumina arrays, and normalized using a robust spline normalization. Genes showing no significant expression were filtered from the data set prior to analysis, leaving 26,209 transcripts analyzed for the liver and 29,285 for white fat. The data were analyzed using Partek Genomics software v6.5 (Partek Incorporated, St. Louis, MO). Significant differences in gene expression were assessed using a 3-factor ANOVA, testing for the main effects of diet, of sex, of strain and of their interactions and correcting for multiple tests using the False Detection Rate approach. To correct for multiple tests within these focal regions, q-values were generated for genes falling in the 23 MetS support intervals using QVALUE (method = bootstrap)[97] (Tables S2 and S3).
Whole-Genome Polymorphism Data
Whole-genome sequencing for the LG/J (≈20X haploid coverage) and the SM/J (≈14X haploid coverage) inbred mouse strains was completed by the Washington University School of Medicine Genome Sequencing Center using Illumina sequencing in two steps as described in Mardis et al. [98] and Ding et al. [99]. The reference genome used was the July 2007 assembly NCBI build37(mm9). Illumina reads from liver tissue from a single LG/J female and a single SM/J female were aligned to the reference genome using MAQ [100].
High-quality SNPs for each strain were called using SamTools (http://samtools.sourceforge.net/) [101], requiring three or more reads and a SNP quality score ≥ 20. We identified 4,406,015 high-confidence polymorphisms between LG/J and SM/J. These polymorphisms were annotated with custom Python programs using RefSeq [102] coordinates downloaded from the UCSC Genome Browser [103] accessed May 2010. The LG/J and SM/J whole-genome SNPs have been submitted to dbSNP [104] for public use under the handle “Cheverud”.
Supporting Information
Zdroje
1. CornierMADabeleaDHernandezTLLindstromRCSteigAJ 2008 The metabolic syndrome. Endocr Rev 29 777 822
2. AbegundeDOMathersCDAdamTOrtegonMStrongK 2007 The burden and costs of chronic diseases in low-income and middle-income countries. Lancet 370 1929 1938
3. HeymsfieldSB 2009 How large is the energy gap that accounts for the obesity epidemic? Am J Clin Nutr 89 1717 1718
4. MusaniSKEricksonSAllisonDB 2008 Obesity--still highly heritable after all these years. Am J Clin Nutr 87 275 276
5. NettletonJASteffenLMBallantyneCMBoerwinkleEFolsomAR 2007 Associations between HDL-cholesterol and polymorphisms in hepatic lipase and lipoprotein lipase genes are modified by dietary fat intake in African American and White adults. Atherosclerosis 194 e131 140
6. SingCFStengardJHKardiaSL 2003 Genes, environment, and cardiovascular disease. Arterioscler Thromb Vasc Biol 23 1190 1196
7. BuchananAVWeissKMFullertonSM 2006 Dissecting complex disease: the quest for the Philosopher's Stone? Int J Epidemiol 35 562 571
8. KlosKLKardiaSLHixsonJETurnerSTHanisC 2005 Linkage analysis of plasma ApoE in three ethnic groups: multiple genes with context-dependent effects. Ann Hum Genet 69 157 167
9. GroveMLMorrisonAFolsomARBoerwinkleEHoelscherDM 2007 Gene-environment interaction and the GNB3 gene in the Atherosclerosis Risk in Communities study. Int J Obes (Lond) 31 919 926
10. LusisAJAttieADReueK 2008 Metabolic syndrome: from epidemiology to systems biology. Nat Rev Genet 9 819 830
11. LawsonHACheverudJM 2010 Metabolic syndrome components in murine models. Endocr Metab Immune Disord Drug Targets 10 25 40
12. CleeSMYandellBSSchuelerKMRabagliaMERichardsOC 2006 Positional cloning of Sorcs1, a type 2 diabetes quantitative trait locus. Nat Genet 38 688 693
13. BennettBJFarberCROrozcoLKangHMGhazalpourA 2010 A high-resolution association mapping panel for the dissection of complex traits in mice. Genome Res 20 281 290
14. StoehrJPNadlerSTSchuelerKLRabagliaMEYandellBS 2000 Genetic obesity unmasks nonlinear interactions between murine type 2 diabetes susceptibility loci. Diabetes 49 1946 1954
15. WangXPaigenB 2002 Quantitative trait loci and candidate genes regulating HDL cholesterol: a murine chromosome map. Arterioscler Thromb Vasc Biol 22 1390 1401
16. FooteMHunterJPJanisCMSepkoskiJJJr 1999 Evolutionary and preservational constraints on origins of biologic groups: divergence times of eutherian mammals. Science 283 1310 1314
17. LanderESLintonLMBirrenBNusbaumCZodyMC 2001 Initial sequencing and analysis of the human genome. Nature 409 860 921
18. WaterstonRHLindblad-TohKBirneyERogersJAbrilJF 2002 Initial sequencing and comparative analysis of the mouse genome. Nature 420 520 562
19. PolotskyVY 2007 Mouse model of the metabolic syndrome: the quest continues. J Appl Physiol 102 2088 2089
20. CheverudJMEhrichTHHrbekTKenneyJPPletscherLS 2004 Quantitative trait loci for obesity - and diabetes-related traits and their dietary responses to high-fat feeding in LGXSM recombinant inbred mouse strains. Diabetes 53 3328 3336
21. Kenney-HuntJPVaughnTTPletscherLSPeripatoARoutmanE 2006 Quantitative trait loci for body size components in mice. Mamm Genome 17 526 537
22. EhrichTHKenney-HuntJPPletscherLSCheverudJM 2005 Genetic variation and correlation of dietary response in an advanced intercross mouse line produced from two divergent growth lines. Genet Res 85 211 222
23. FawcettGLJarvisJPRosemanCCWangBWolfJB 2009 Fine-Mapping of Obesity-Related Quantitative Trait Loci in and F9/10 Advanced Intercross Line. Obesity (Silver Spring) in press
24. CheverudJMLawsonHAFawcettGLWangBPletscherLS 2010 Diet-Dependent Genetic and Genomic Imprinting Effects on Obesity in Mice. Obesity (Silver Spring)
25. LawsonHAZelleKMFawcettGLWangBPletscherLS 2010 Genetic, epigenetic, and gene-by-diet interaction effects underlie variation in serum lipids in a LG/J x SM/J murine model. J Lipid Res
26. XieTChenMGavrilovaOLaiEWLiuJ 2008 Severe obesity and insulin resistance due to deletion of the maternal Gsalpha allele is reversed by paternal deletion of the Gsalpha imprint control region. Endocrinology 149 2443 2450
27. RampersaudEMitchellBDNajACPollinTI 2008 Investigating parent of origin effects in studies of type 2 diabetes and obesity. Curr Diabetes Rev 4 329 339
28. WeinsteinLSXieTQasemAWangJChenM 2009 The role of GNAS and other imprinted genes in the development of obesity. Int J Obes (Lond)
29. MackayTFStoneEAAyrolesJF 2009 The genetics of quantitative traits: challenges and prospects. Nat Rev Genet 10 565 577
30. BurgerRGimelfarbA 2002 Fluctuating environments and the role of mutation in maintaining quantitative genetic variation. Genet Res 80 31 46
31. GillespieJHTurelliM 1989 Genotype-environment interactions and the maintenance of polygenic variation. Genetics 121 129 138
32. MackayTF 1981 Genetic Variation in Varying Environments. Genetical Research 37 79 93
33. TurelliMBartonNH 2004 Polygenic variation maintained by balancing selection: pleiotropy, sex-dependent allelic effects and G x E interactions. Genetics 166 1053 1079
34. LynchMWalshB 1998 Genetics and Analysis of Quantitative Traits. Sunderland Sinauer
35. Kenney-HuntJPCheverudJM 2009 Differential dominance of pleiotropic loci for mouse skeletal traits. Evolution 63 1845 1851
36. CheverudJM 2001 The Genetic Architecture of Pleiotropic Relations and Differential Epistasis. WagnerGP The Character Concept in Evolutionary Biology San Diego Academic Press 411 433
37. WagnerGP 1988 The Gene and its Phenotype. Biology and Philosophy 3 105 115
38. FalconerDSMackayTF 1996 Introduction to Quantitative Genetics. London Oliver & Boyd
39. WrightS 1980 Genic and Organismic Selection. Evolution 34 825 843
40. KentCFDaskalchukTCookLSokolowskiMBGreenspanRJ 2009 The Drosophila foraging gene mediates adult plasticity and gene-environment interactions in behaviour, metabolites, and gene expression in response to food deprivation. PLoS Genet 5 e1000609 doi:10.1371/journal.pgen.1000609
41. HouleDGovindarajuDROmholtS 2010 Phenomics: the next challenge. Nat Rev Genet 11 855 866
42. MinkinaOKenney-HuntJFawcettGSemenkovichCFCheverudJM Quantitative trait loci affecting liver fat content in mice. In Preparation
43. Almeda-ValdesPCuevas-RamosDAguilar-SalinasCA 2009 Metabolic syndrome and non-alcoholic fatty liver disease. Ann Hepatol 8 Suppl 1 S18 24
44. FabbriniESullivanSKleinS 2010 Obesity and nonalcoholic fatty liver disease: biochemical, metabolic, and clinical implications. Hepatology 51 679 689
45. WolfJBCheverudJMRosemanCHagerR 2008 Genome-wide analysis reveals a complex pattern of genomic imprinting in mice. PLoS Genet 4 e1000091 doi:10.1371/journal.pgen.1000091
46. LawsonHALeeAFawcettGLPletscherLSMaxwellTJ 2011 The importance of context to the genetic architecture of diabetes-related traits is revealed in a genome-wide scan of a LG/JxSM/J murine model. Mammalian Genome in press
47. WangXKorstanjeRHigginsDPaigenB 2004 Haplotype analysis in multiple crosses to identify a QTL gene. Genome Res 14 1767 1772
48. SuZCoxAShenYStylianouIMPaigenB 2009 Farp2 and Stk25 are candidate genes for the HDL cholesterol locus on mouse chromosome 1. Arterioscler Thromb Vasc Biol 29 107 113
49. ZerneckeALiehnEAFraemohsLvon HundelshausenPKoenenRR 2006 Importance of junctional adhesion molecule-A for neointimal lesion formation and infiltration in atherosclerosis-prone mice. Arterioscler Thromb Vasc Biol 26 e10 13
50. Mendez-FernandezYVStevensonBGDiehlCJBraunNAWadeNS 2011 The inhibitory FcgammaRIIb modulates the inflammatory response and influences atherosclerosis in male apoE(-/-) mice. Atherosclerosis 214 73 80
51. MassonDQatananiMSbernaALXiaoRPais de BarrosJP 2008 Activation of the constitutive androstane receptor decreases HDL in wild-type and human apoA-I transgenic mice. J Lipid Res 49 1682 1691
52. JokelaHRantakariPLamminenTStraussLOlaR 2010 Hydroxysteroid (17beta) dehydrogenase 7 activity is essential for fetal de novo cholesterol synthesis and for neuroectodermal survival and cardiovascular differentiation in early mouse embryos. Endocrinology 151 1884 1892
53. SingmannPBaumertJHerderCMeisingerCHolzapfelC 2009 Gene-gene interaction between APOA5 and USF1: two candidate genes for the metabolic syndrome. Obes Facts 2 235 242
54. TaylorJTyekuchevaSKingDCHardisonRCMillerW 2006 ESPERR: learning strong and weak signals in genomic sequence alignments to identify functional elements. Genome Res 16 1596 1604
55. KlingenbergCPLeamyLJRoutmanEJCheverudJM 2001 Genetic architecture of mandible shape in mice: effects of quantitative trait loci analyzed by geometric morphometrics. Genetics 157 785 802
56. EhrichTHVaughnTTKoreishiSFLinseyRBPletscherLS 2003 Pleiotropic effects on mandibular morphology I. Developmental morphological integration and differential dominance. J Exp Zool B Mol Dev Evol 296 58 79
57. De BritoRAPletscherLSCheverudJM 2005 The evolution of genetic architecture. I. diversification of genetic backgrounds by genetic drift. Evolution 59 23333 22342
58. PavlicevMKenney-HuntJPNorgardEARosemanCCWolfJB 2008 Genetic variation in pleiotropy: differential epistasis as a source of variation in the allometric relationship between long bone lengths and body weight. Evolution 62 199 213
59. MaherB 2008 Personal genomes: The case of the missing heritability. Nature 456 18 21
60. HamonSCStengardJHClarkAGSalomaaVBoerwinkleE 2004 Evidence for non-additive influence of single nucleotide polymorphisms within the apolipoprotein E gene. Ann Hum Genet 68 521 535
61. KongASteinthorsdottirVMassonGThorleifssonGSulemP 2009 Parental origin of sequence variants associated with complex diseases. Nature 462 868 874
62. JunyentMParnellLDLaiCQArnettDKTsaiMY 2009 ADAM17_i33708A>G polymorphism interacts with dietary n-6 polyunsaturated fatty acids to modulate obesity risk in the Genetics of Lipid Lowering Drugs and Diet Network study. Nutr Metab Cardiovasc Dis
63. KabagambeEKGlasserSPOrdovasJMWarodomwichitDTsaiMY 2009 TCF7L2 polymorphisms and inflammatory markers before and after treatment with fenofibrate. Diabetol Metab Syndr 1 16
64. ChatterjeeNKalayliogluZMoslehiRPetersUWacholderS 2006 Powerful multilocus tests of genetic association in the presence of gene-gene and gene-environment interactions. Am J Hum Genet 79 1002 1016
65. StewartTPKimHYSaxtonAMKimJH 2010 Genetic and genomic analysis of hyperlipidemia, obesity and diabetes using (C57BL/6J x TALLYHO/JngJ) F2 mice. BMC Genomics 11
66. BighamET 1998 Role of chromosome blocks in heterosis and estimates of dominance and overdominance. LamkeyKR Concepts and Breeding Heterosis in Crop Plants Madison Soil Science Society of America 71 87
67. KeightleyPDKacserH 1987 Dominance, pleiotropy and metabolic structure. Genetics 117 319 329
68. NeelJV 1962 Diabetes mellitus: a “thrifty” genotype rendered detrimental by “progress”? Am J Hum Genet 14 353 362
69. YeamanSChenYWhitlockMC 2010 No effect of environmental heterogeneity on the maintenance of genetic variation in wing shape in Drosophila melanogaster. Evolution 64 3398 3408
70. InglebyFCHuntJHoskenDJ 2010 The role of genotype-by-environment interactions in sexual selection. J Evol Biol 23 2031 2045
71. DaviesADouglasLHendrichJWrattenJTran Van MinhA 2006 The calcium channel alpha2delta-2 subunit partitions with CaV2.1 into lipid rafts in cerebellum: implications for localization and function. J Neurosci 26 8748 8757
72. van OosterhoutFMichelSDeboerTHoubenTvan de VenRC 2008 Enhanced circadian phase resetting in R192Q Cav2.1 calcium channel migraine mice. Ann Neurol 64 315 324
73. van den MaagdenbergAMPizzorussoTKajaSTerpolilliNShapovalovaM 2010 High cortical spreading depression susceptibility and migraine-associated symptoms in Ca(v)2.1 S218L mice. Ann Neurol 67 85 98
74. SchurksMRistPMBigalMEBuringJELiptonRB 2009 Migraine and cardiovascular disease: systematic review and meta-analysis. BMJ 339 b3914
75. BondDSRothJNashJMWingRR 2010 Migraine and obesity: epidemiology, possible mechanisms and the potential role of weight loss treatment. Obes Rev
76. GarauletMMadridJA 2010 Chronobiological aspects of nutrition, metabolic syndrome and obesity. Adv Drug Deliv Rev
77. ChenSNCilingirogluMToddJLombardiRWillersonJT 2009 Candidate genetic analysis of plasma high-density lipoprotein-cholesterol and severity of coronary atherosclerosis. BMC Med Genet 10 111
78. Lara-CastroCHunterGRLovejoyJCGowerBAFernandezJR 2005 Apolipoprotein A-II polymorphism and visceral adiposity in African-American and white women. Obes Res 13 507 512
79. FlintJMackayTF 2009 Genetic architecture of quantitative traits in mice, flies, and humans. Genome Res 19 723 733
80. LewontinRC 1974 The Genetic Basis of Evolutionary Change. New York Columbia University Press
81. GluckmanPDHansonMABatesonPBeedleASLawCM 2009 Towards a new developmental synthesis: adaptive developmental plasticity and human disease. Lancet 373 1654 1657
82. KramerMGVaugnTTPletscherSKing-EllisonKAdamsE 1998 Genetic variation in body weight gain and composition in the intercross of Large (LG/J) and Small (SM/J) inbred strains of mice. Genetics and Molecular Biology 21 211 218
83. FestingM 1996 Origins and characteristics of inbred strains of mice. LyonMFRastonSBrownSDM Variants and Strains of the Laboratory Mouse New York City Oxford University Press
84. HrbekTde BritoRAWangBPletscherLSCheverudJM 2006 Genetic characterization of a new set of recombinant inbred lines (LGXSM) formed from the inter-cross of SM/J and LG/J inbred mouse strains. Mamm Genome 17 417 429
85. TempletonAR 2006 Population Genetics and Microevolutionary Theory. Hoboken Wiley-Liss
86. EhrichTHHrbekTKenney-HuntJPPletscherLSWangB 2005 Fine-mapping gene-by-diet interactions on chromosome 13 in a LG/J x SM/J murine model of obesity. Diabetes 54 1863 1872
87. BromanKWSaunakS 2009 A Guide to QTL Mapping with R/qtl. New York Springer
88. LiJJiangT 2005 Computing the minimum recombinant haplotype configuration from incomplete genotype data on a pedigree by integer linear programming. J Comput Biol 12 719 739
89. WolfJBHagerRCheverudJM 2008 Genomic imprinting effects on complex traits: a phenotype-based perspective. Epigenetics 3 295 299
90. HaleyCSKnottSA 1992 A simple regression method for mapping quantitative trait loci in line crosses using flanking markers. Heredity 69 315 324
91. CheverudJMLawsonHAFawcettGLWangBPletscherLS 2011 Diet-Dependent Genetic and Genomic Imprinting Effects on Obesity in Mice. Obesity (Silver Spring) 19 160 170
92. LiJJiL 2005 Adjusting multiple testing in multilocus analyses using the eigenvalues of a correlation matrix. Heredity 95 221 227
93. LanderESBotsteinD 1989 Mapping mendelian factors underlying quantitative traits using RFLP linkage maps. Genetics 121 185 199
94. WadeMJ 1990 Genotype-environment interaction of flour beetles, Tribolium castaneum. Evolution 44 2004 2011
95. DuPKibbeWALinSM 2008 lumi: a pipeline for processing Illumina microarray. Bioinformatics 24 1547 1548
96. LinSMDuPHuberWKibbeWA 2008 Model-based variance-stabilizing transformation for Illumina microarray data. Nucleic Acids Res 36 e11
97. StoreyJD 2002 A direct approach to false discovery rates. Journal of the Royal Statistical Society, Series B 64 479 498
98. MardisERDingLDoolingDJLarsonDEMcLellanMD 2009 Recurring mutations found by sequencing an acute myeloid leukemia genome. N Engl J Med 361 1058 1066
99. DingLEllisMJLiSLarsonDEChenK 2010 Genome remodelling in a basal-like breast cancer metastasis and xenograft. Nature 464 999 1005
100. LiHRuanJDurbinR 2008 Mapping short DNA sequencing reads and calling variants using mapping quality scores. Genome Res 18 1851 1858
101. LiHHandsakerBWysokerAFennellTRuanJ 2009 The Sequence Alignment/Map format and SAMtools. Bioinformatics 25 2078 2079
102. PruittKDTatusovaTMaglottDR 2005 NCBI Reference Sequence (RefSeq): a curated non-redundant sequence database of genomes, transcripts and proteins. Nucleic Acids Res 33 D501 504
103. RheadBKarolchikDKuhnRMHinrichsASZweigAS 2010 The UCSC Genome Browser database: update 2010. Nucleic Acids Res 38 D613 619
104. SherrySTWardMHKholodovMBakerJPhanL 2001 dbSNP: the NCBI database of genetic variation. Nucleic Acids Res 29 308 311
Štítky
Genetika Reprodukční medicínaČlánek vyšel v časopise
PLOS Genetics
2011 Číslo 9
- Kazuistika – Perspektivy využití precizované medicíny v rámci personalizované specifické terapie onkologických pacientů
- Nobelova cena za chemii pro genetické nůžky: Objev, který změní naši budoucnost?
- Technologie na bázi RNA v klinické praxi: od přebarvených petúnií k terapii vzácných a dosud jen obtížně léčitelných chorob u lidí
- „Nepředstavovali jsme si, že náš výzkum povede přímo ke vzniku nových léků, dokonce ještě za našeho života“
- Bezplatné služby pro diagnostiku ATTRv amyloidózy pro kardiology
Nejčtenější v tomto čísle
- Retrotransposon-Induced Heterochromatin Spreading in the Mouse Revealed by Insertional Polymorphisms
- The Evolutionarily Conserved Longevity Determinants HCF-1 and SIR-2.1/SIRT1 Collaborate to Regulate DAF-16/FOXO
- Genome-Wide Analysis of Heteroduplex DNA in Mismatch Repair–Deficient Yeast Cells Reveals Novel Properties of Meiotic Recombination Pathways
- Association of eGFR-Related Loci Identified by GWAS with Incident CKD and ESRD
Zvyšte si kvalifikaci online z pohodlí domova
Mazová zátka a její řešení
nový kurzVšechny kurzy