
Disease-Associated Mutations That Alter the RNA Structural Ensemble
Genome-wide association studies (GWAS) often identify disease-associated mutations in intergenic and non-coding regions of the genome. Given the high percentage of the human genome that is transcribed, we postulate that for some observed associations the disease phenotype is caused by a structural rearrangement in a regulatory region of the RNA transcript. To identify such mutations, we have performed a genome-wide analysis of all known disease-associated Single Nucleotide Polymorphisms (SNPs) from the Human Gene Mutation Database (HGMD) that map to the untranslated regions (UTRs) of a gene. Rather than using minimum free energy approaches (e.g. mFold), we use a partition function calculation that takes into consideration the ensemble of possible RNA conformations for a given sequence. We identified in the human genome disease-associated SNPs that significantly alter the global conformation of the UTR to which they map. For six disease-states (Hyperferritinemia Cataract Syndrome, β-Thalassemia, Cartilage-Hair Hypoplasia, Retinoblastoma, Chronic Obstructive Pulmonary Disease (COPD), and Hypertension), we identified multiple SNPs in UTRs that alter the mRNA structural ensemble of the associated genes. Using a Boltzmann sampling procedure for sub-optimal RNA structures, we are able to characterize and visualize the nature of the conformational changes induced by the disease-associated mutations in the structural ensemble. We observe in several cases (specifically the 5′ UTRs of FTL and RB1) SNP–induced conformational changes analogous to those observed in bacterial regulatory Riboswitches when specific ligands bind. We propose that the UTR and SNP combinations we identify constitute a “RiboSNitch,” that is a regulatory RNA in which a specific SNP has a structural consequence that results in a disease phenotype. Our SNPfold algorithm can help identify RiboSNitches by leveraging GWAS data and an analysis of the mRNA structural ensemble.
Published in the journal:
. PLoS Genet 6(8): e32767. doi:10.1371/journal.pgen.1001074
Category:
Research Article
doi:
https://doi.org/10.1371/journal.pgen.1001074
Summary
Genome-wide association studies (GWAS) often identify disease-associated mutations in intergenic and non-coding regions of the genome. Given the high percentage of the human genome that is transcribed, we postulate that for some observed associations the disease phenotype is caused by a structural rearrangement in a regulatory region of the RNA transcript. To identify such mutations, we have performed a genome-wide analysis of all known disease-associated Single Nucleotide Polymorphisms (SNPs) from the Human Gene Mutation Database (HGMD) that map to the untranslated regions (UTRs) of a gene. Rather than using minimum free energy approaches (e.g. mFold), we use a partition function calculation that takes into consideration the ensemble of possible RNA conformations for a given sequence. We identified in the human genome disease-associated SNPs that significantly alter the global conformation of the UTR to which they map. For six disease-states (Hyperferritinemia Cataract Syndrome, β-Thalassemia, Cartilage-Hair Hypoplasia, Retinoblastoma, Chronic Obstructive Pulmonary Disease (COPD), and Hypertension), we identified multiple SNPs in UTRs that alter the mRNA structural ensemble of the associated genes. Using a Boltzmann sampling procedure for sub-optimal RNA structures, we are able to characterize and visualize the nature of the conformational changes induced by the disease-associated mutations in the structural ensemble. We observe in several cases (specifically the 5′ UTRs of FTL and RB1) SNP–induced conformational changes analogous to those observed in bacterial regulatory Riboswitches when specific ligands bind. We propose that the UTR and SNP combinations we identify constitute a “RiboSNitch,” that is a regulatory RNA in which a specific SNP has a structural consequence that results in a disease phenotype. Our SNPfold algorithm can help identify RiboSNitches by leveraging GWAS data and an analysis of the mRNA structural ensemble.
Introduction
Genome-Wide Association Studies (GWAS) pinpoint mutations associated to a disease state with single nucleotide precision [1]–[4]. In some cases, the molecular cause of the disease is evident from the mutation data alone. For example, if the mutation results in a premature stop codon, the production of a truncated protein is the cause for the disease [5]. In a majority of cases, however, it is difficult to identify the molecular cause of the disease from the GWAS data alone [3], [6]–[11]. This is especially true when associations are identified in non-coding and intergenic regions of the genome [10], [11]. Since a majority of the human genome is non-coding and intergenic, it is not surprising that many GWAS studies are finding disease associations in such regions [12]–[14]. In this study we aim to evaluate the role of mutation induced structural changes in regulatory RNAs of the human genome and their consequence on the disease state.
The central role of RNA as a major regulator of genetic networks in the cell is now well established [15]. Furthermore, it is estimated that up to 95% of the human genome is transcribed, suggesting that a majority of mutations are transferred to the transcriptome [1]. This study focuses on the potential structural consequences of disease-associated mutations on the RNA transcriptome, in particular single nucleotide polymorphisms (SNPs) in the 5′ and 3′ UTRs of genes. UTRs are the regulatory elements of genes, acting as controllers of translation and RNA decay, as well as targets for RNA interference (RNAi) [16]–[18]. Since UTRs are readily transcribed, play a central role in post-transcriptional regulation, and are integral to the mature mRNA, they present an ideal starting point for studying the potential structure/function relationships of disease-associated mutations on the transcriptome.
Unlike highly structured RNAs such as self splicing introns [19], Riboswitches [20], and the Ribosome [21], the UTRs of mRNAs are not generally evolved to adopt single, well-defined structures. Instead they adopt an ensemble of conformations best described by a partition function, which is defined as the probabilities of all possible base-pairs [22]–[24]. Most mutations in an RNA only have local effects on the structural ensemble. A small subset of mutations, however, have a large and global effect [22]. If a disease-associated mutation belongs to the latter, it can suggest a role for RNA structure in the molecular mechanism of the disease. We make several assumptions in this study, which will be borne out by the data presented below. These assumptions are:
-
Certain human disease states are caused by mutation induced conformational changes in transcribed, regulatory RNA molecules. If a disease-associated mutation causes a large change in the ensemble of RNA structure, this suggests RNA conformational change as a potential molecular cause of the disease.
-
Large regulatory RNAs generally adopt multiple conformations and it is critical to consider how mutations affect this ensemble rather than just the minimum free energy structure [25].
-
A majority (>95%) of mutations result in only small, local changes in the structure of an RNA.
-
The same phenotype (disease) can be caused by different mutations with varying degrees of effect on overall RNA ensemble structure. A global analysis of the structural consequences of all disease-associated mutations on a regulatory RNA can pinpoint the regulatory region of the RNA.
In this study we investigate known disease associated SNPs that map to non-coding UTR regions of the human genome with respect to their effect on the ensemble RNA structure. We identify disease states in which the associated SNPs significantly alter the RNA structural ensemble of the UTR. This analysis provides insight into the potential molecular causes of several genetic disorders including Hyperferritinemia-cataract syndrome [26], β-Thalassemia [27], [28], and Chronic Obstructive Pulmonary Disease (COPD) [29], [30]. More importantly, our analysis reveals the extent to which SNPs affect RNA structure, and the nature of those effects in disease-states.
Results
Ensemble RNA structural analysis
We first consider the C33G SNP in the 5′ UTR of the HBB (β-globin) gene, which is associated with β-Thalassemia [31], [32] to illustrate the basic premise of our methodology. The SNP is not located near any transcription, translation start or stop sites (Figure 1A). A recent study demonstrated that the C33G mutation (replacing C33 with a G) has a negligible effect on mRNA transcriptional levels [33]. A possible cause for the disease state is therefore a conformational change in the RNA structure. In Figure 1B, we show the result of a partition function calculation for the wild-type (non-diseased) “C” allele of the UTR. Unlike traditional Minimum Free Energy calculations (MFE) that predict a single low energy structure of the RNA, the partition function computes the probability of pairing for all possible base-pairs including potential pseudoknots [22]–[24]. The partition function therefore is a representation of the RNA structural ensemble, i.e. all possible RNA structures [22]. Since whole UTRs are generally not evolved to adopt a single well defined structure, the partition function illustrated in Figure 1B is a more accurate representation of the RNA's structural ensemble than the single structure obtained by traditional MFE computations such as mFold [23].
![Partition function analysis of the C33G SNP in the 5′ UTR of HBB associated with β-Thalassemia <em class="ref">[<b>28</b>]</em>.](https://pl-master.mdcdn.cz/media/cache/media_object_image_large/media/image/f2c8d6dbf7f1c0b221c4c2d1ed9d5ab0.png)
We choose to highlight the HBB 5′ UTR and the C33G SNP associated with β-Thalassemia [31], [32] because of the difference in the partition functions illustrated in Figure 1B and 1C. The partition function calculation using the mutant sequence (replacing C33 with a G) is dramatically altered by this single SNP, suggesting a significant change in the overall structural ensemble of the UTR RNA. In Figure 1D, we compute the base accessibility (i.e. the probability of the base being paired) by summing the base-pair probabilities down the columns of the partition function. When we compare the base-pairing probabilities for the wild type (C33 non-diseased allele, black line) with the disease-associated mutation (G33, red line), we see that specific bases show large changes in nucleotide accessibility while others remain unaffected by this mutation.
Evaluating the significance of a change in the RNA structural ensemble
For the purposes of this study, we are particularly interested in identifying disease-associated SNPs like C33G in the HBB 5′ UTR that have a significant effect on the RNA structural ensemble as defined by the partition function calculation. We quantify the overall structural effect of a mutation on an RNA by computing the Pearson correlation coefficient between the wild-type and diseased base-pair probabilities (black and red lines, Figure 1D). For the C33G mutant we determine a WT/mutation correlation coefficient of 0.797 (Table 1). This simple calculation allows us to quantitatively describe the overall rearrangement in the structural ensemble of the RNA caused by the disease-associated mutation.
The Pearson correlation coefficient as computed above provides a quantitative measure of the overall change in the partition function caused by a mutation. However, based on this single calculation, it is difficult to determine the significance of the structural change. We compute Pearson correlation coefficients for all 150 possible single nucleotide mutations (the HBB 5′ UTR is 50 nucleotides in length) and illustrate their values as a heat map in Figure 2A. This result illustrates that a majority of mutations in the HBB 5′ UTR only have small effects (Pearson correlation coefficient >0.95) on the structural ensemble. To better illustrate this point, we plot in Figure 2B a histogram of Pearson correlation coefficients for all single nucleotide mutations of HBB.

The distribution of Pearson correlation coefficients is dependent on both the sequence and its length. This is illustrated in Figure 2C where we plot the distribution of Pearson correlation coefficients for the 1599 mutations in the 5′ UTR of SERPINA1 (serpin peptidase inhibitor, clade A (α-1 antiproteinase, antitrypsin), member 1, which is 533 nucleotides in length), where the C116U SNP is associated with COPD [34]. The two distributions are clearly different and these results suggest a straightforward approach for comparing the extent of conformational change caused by a SNP in an RNA. The C33G mutation in the HBB 5′ UTR has the sixth lowest correlation coefficient out of the 150 possible mutations and we therefore compute a p-value of 6/150 = 0.04 for this SNP (Table 1). Similarly, the C116U mutation in the 5′ UTR of SERPINA1 results in a Pearson correlation coefficient of 0.664 and this yields a p-value of 21/1599 = 0.013. This simple calculation allows us to compare the effects on SNPs on different UTRs and thus rank order the disease-associated SNPs in the Human genome with respect to the significance of the structural rearrangement they induce.
Genomic scan of all known disease-associated SNPs in HGMD
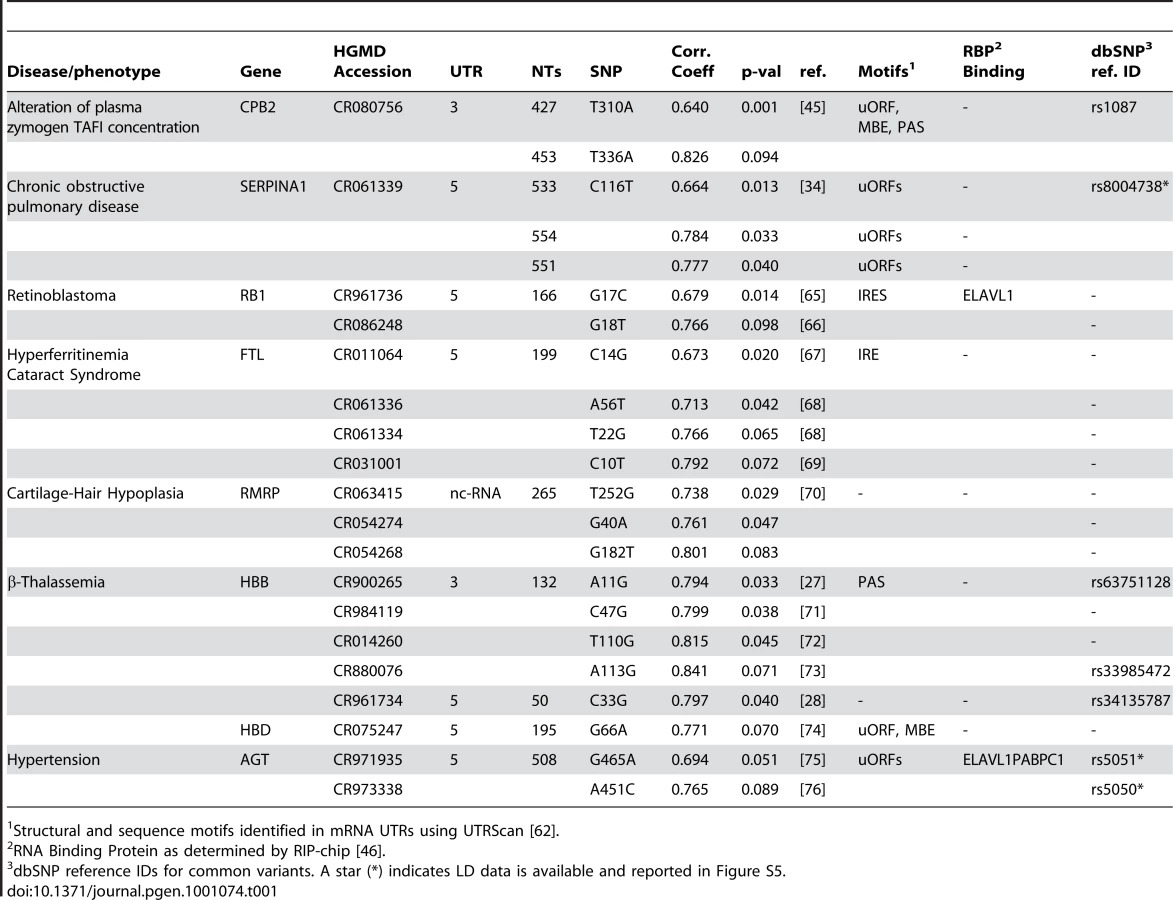
We analyzed a total of 514 disease-associated SNPS in 350 UTRs and non-coding RNAs from the HGMD (Human Gene Mutation Database) [35], [36]. HGMD is a curated database that records the results of published GWAS and other disease association studies [35]. This database is unique in that it provides flanking sequence for a majority of its entries, allowing us to automatically validate the location of SNPs within UTRs using the latest human genome annotations [37], [38]. Of the 350 RNAs we analyzed, 206 were 5′ UTRs, 132 were 3′ UTRs and 12 were non-coding RNAs. The SNPs we analyzed map only to the untranslated regions of mature mRNA and are at least 10 nt away from any transcription or translation start or stop sites. Furthermore, the HGMD annotation stores SNPs associated with alternative splicing in a separate table, which we did not include in our analysis. Our data therefore represents a comprehensive subset of known disease-associated mutations within mRNA UTRs that are not expected to directly affect splicing, translation or transcription through sequence variation. We chose to perform our analysis on this particular subset of disease-associated SNPs to maximize our chances of finding disease states where RNA structural rearrangements are likely to be causative in the association. We map in Figure S5 all SNPs in strong LD (Linkage Disequilibrium, R2>0.9) for common variants identified in Table 1.
Our results are presented in Table 1 and in Table S1. We report on all the disease-associated SNPs that alter RNA structure with a p-value<0.1. We therefore report the top 10 percent of disease-associated SNPs in regulatory non-coding RNA that alter their RNA structural ensemble within the human genome. The disease-states reported in Table 1 are particularly interesting to this study, as they potentially offer mechanistic insight into how RNA structural rearrangement can affect gene regulation and lead to disease. We begin our analysis of SNP induced RNA conformational change by considering the four SNPs associated with Hyperferritinemia Cataract Syndrome listed in Table 1.
Hyperferritinemia Cataract Syndrome
We identify four SNPs in the 5′ UTR of the FTL (ferritin light chain) gene that significantly affect the RNA structural ensemble (Table 1) and that are associated with Hyperferritinemia Cataract Syndrome. The FTL gene encodes the Ferritin light chain protein, and deregulation of this gene leads to the disease phenotype [39]. Recent studies on the regulation of FTL have revealed an Iron Response Element (IRE) in the 5′ UTR to which a regulatory Iron Response Protein (IRP) binds [26], [39]. The IRE is an RNA hairpin and mutations in the 5′ UTR disrupt the structure of the IRE and thus alter the binding affinity of the IRP, leading to aberrant FTL regulation [26]. This type of regulatory system is precisely what we aim to identify with our genomic analysis.
One limitation of the partition function representation (Figure 1B, for example) is in the visualization and interpretation of the structural ensemble change induced by mutation. UTRs generally do not adopt single well-defined structures and classic representations of RNA structure (commonly referred to as “airport terminal diagrams”) cannot accurately be used to visualize overall changes in the ensemble. An alternative visualization of the structural ensemble is illustrated in Figure 3A for the wild-type (non-diseased) FTL 5′ UTR. We carried out a Boltzmann sampling of RNA structures using the sFold procedure [40], [41] and generated an ensemble of 5000 alternative RNA structures from the wild-type and mutant sequences. We then perform principal component analysis (PCA) on the full ensemble of structures. The ensemble of structures that belong to a particular sequence (wild-type or a specific mutant) were then projected onto the first two principle components as shown in Figure 3. This allows us to visualize the structural heterogeneity in the ensemble of structures for a sequence, keeping in mind that two points that are close together in our projection diagram indicate the two corresponding structures are similar in structural space.
![Structural analysis using Boltzmann sampling and principal cponent analysis of FTL 5′ UTR and four Hyperferritinemia cataract syndrome–associated mutations <em class="ref">[<b>39</b>]</em>.](https://pl-master.mdcdn.cz/media/cache/media_object_image_large/media/image/5ca35c1ead10e884234b8eff4d1748c8.png)
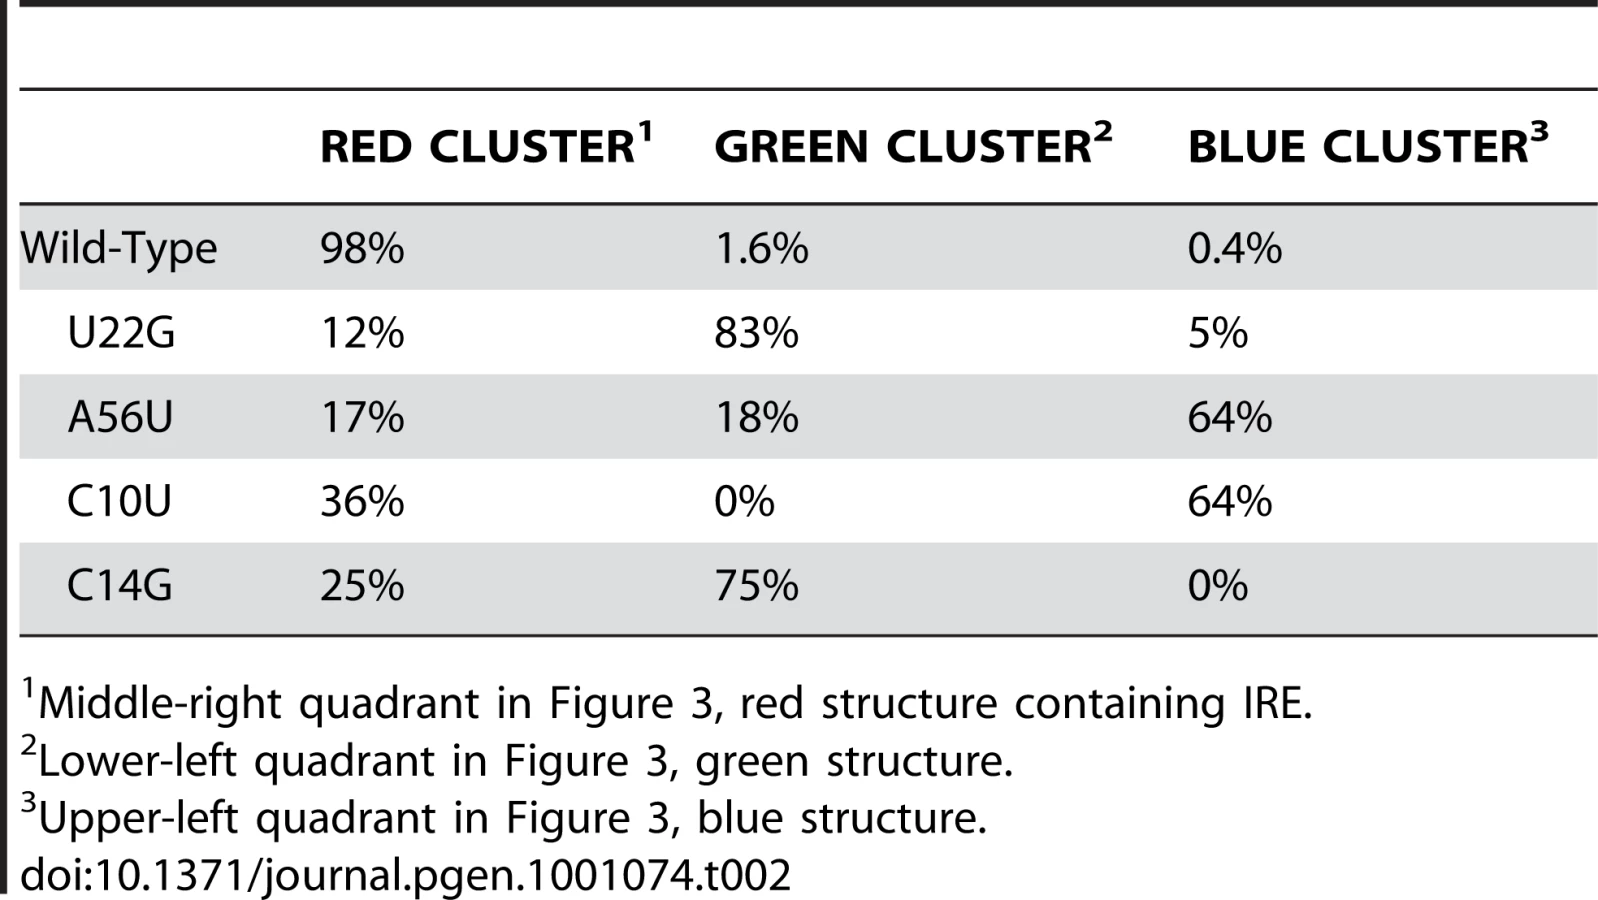
For the FTL wild-type sequence we find that a majority of our sampled structures are grouped in a single cluster in the right center quadrant of the PCA graph. Representative structures for the three main structural clusters identified for FTL are illustrated in the Figure 3A insets as linear diagrams. We clearly see the formation of the IRE in the representative structure (red), indicating that a majority (97%) of wild-type RNAs adopt this structure. It is when we perform the same Boltzmann sampling procedure for the four diseased SNP sequences that we are able to visualize the nature of the structural ensemble change caused by these disease-associated mutations.
In Figure 3B–3E we project Boltzmann sampled structures onto the same principle components as those used in Figure 3A for the four Hyperferritinemia Cataract Syndrome associated SNP sequences. This analysis immediately reveals the nature of the structural change that putatively is the cause of the disease phenotype. The U22G and A56U mutations result in all three structural clusters populated (Figure 3B and 3C) while the C10U and C14G mutations selectively populate one of the mutant clusters (Figure 3D and 3E). In all cases, we find that the disease-associated mutations populate alternative conformations where the IRE is not formed. For FTL, the non-diseased UTR adopts a compact structural ensemble where the IRE is formed, while the diseased-associated SNPs shift the ensemble to include a significant number of structures where the IRE is disrupted in favor of long-range base pairs. In Table 2, we compute the relative population of the three clusters for the wild type and mutant sequences and find that all four disease-associated mutations significantly reduce the percentage of structures containing an IRE. Nonetheless, we see that no single mutation completely abolishes the cluster with the IRE, suggesting a shift in the relative populations of each conformation.
One phenotype, multiple genotypes
The four SNPs we identify in the 5′ UTR of FTL as having a large effect on its structural ensemble are a subset of the 30 SNPs associated with Hyperferritinemia Cataract Syndrome reported in HGMD. Since HGMD is based on existing published literature, one can assume that these 30 SNPs represent only a subset of all mutations that can cause the Hyperferritinemia phenotype. A majority (28) of the known SNPs associated with Hyperferritinemia Cataract Syndrome occur in the 5′ UTR of FTL, suggesting that the UTR is central in the regulation of the gene. The four mutations we identify using our partition function calculation and correlation analysis (which we will now refer to as the SNPFold algorithm) identify SNPs that have a major effect on the RNA structural ensemble. By design, SNPFold identifies the SNPs that alter the global structural ensemble of the RNA, and will not identify SNPs that have only local structural effects on the RNA. It is clear, however, that a global effect on the RNA structural ensemble is not a prerequisite for disease association. Clearly, multiple molecular mechanisms can cause the same phenotype; in the case of Hyperferritnaemia Cataract Syndrome any mutation that either directly or indirectly affects the IRE and its ability to bind the corresponding Iron Response Protein (IRP) can result in the phenotype.
In the supplement (Figure S2) we illustrate a natural extension of the SNPFold algorithm for analyzing multiple disease-associated SNPs. We average the change in base-pair probability for each nucleotide and for all Hyperferritinemia Cataract Syndrome associated SNPs. This global analysis of the effects of SNPs on the RNA structure clearly identifies the IRE in the 5′ UTR, which is where on average, the largest changes in base-pair probability are observed. As more associated genotypic information becomes available, it is likely that it will be possible to use this data to identify other RNA structural elements within the transcriptome.
Discussion
Our analysis of the effects of disease-associated human genetic variation on mRNA and regulatory non-coding RNAs reveals the extent to which specific SNPs affect the RNA structural ensemble. The SNPfold algorithm we propose is unique in that it takes into account the effects of mutation on the ensemble of possible RNA structures, and not just a single minimum free energy structure. UTRs are not evolved to adopt a single, well-defined structure (unlike catalytic RNAs, for example [42]) but will rather adopt a large ensemble of structures [43]. We find that a majority of mutations have small, local effects on the structural ensemble (Figure 2), while certain specific mutations can profoundly alter it. In Figure S3, we compare the performance of MFE (mFold) algorithms to the partition function approach we used and show that our approach is far less sensitive to mutation. We identified those disease-associated mutations in human UTRs that have a large effect on the RNA structural ensemble and report them here.
We identified a broad range of disease phenotypes that are associated with SNPs that alter the RNA structural ensemble. For all the disease states presented in Table 1, the mRNA is either hypothesized or has been shown to play a causal role in the association. In certain cases, assays have already been carried out to show that the SNP causes a change in translation efficiency [26], [39], and/or mRNA stability [44], [45]. We also identified the mRNAs in which RIP-chip [46] experiments measured an interaction with an RNA binding protein (Table 1). We find that several RNA binding proteins including ELAVL1 (embryonic lethal, abnormal vision, Drosophila)-like 1), PABPC1 (Polyadenylate-binding protein 1), and IGFBP2 (insulin-like growth factor binding protein 2) are found to co-IP with our mRNAs of interest (Table 1 and Table S1). This suggests that the SNP induced structural changes could affect protein binding for the mRNAs identified in Table 1. Furthermore, our analysis of pre-mRNAs (Table S2) suggests that the conformational changes induced by SNPs are most significant in the mature mRNA. Finally, analysis of eQTL (expression Quantitative Trace Locus, Table S3) data reveals that for all but two of the common SNPs we identified in our RNA structural analysis, there is no measured effect on transcriptional levels [47].
To ascertain the relationship between our predicted changes in base-pairing probability and RNA functional elements we performed additional analyses reported in the supplement (Figure S4). We find that predicted changes in base-pairing probability overlap significantly with known RNA functional elements including IREs, IRES (Internal Ribosome Entry Sites), uORFs (upstream Open Reading Frames), PAS's (Polyadenylation Sites), TOPs (Terminal Oligopyrimidine tracts), MBEs (Musashi Binding Elements), K-Boxes and GY-Boxes. The IRES is an alternate translation initiation site that allows the ribosome to bind the mRNA in a 5′ cap independent manner [48]. uORFs are found upstream of the normal ORF and lower the translation of the main ORF, and in some cases lead to the production of a short regulatory transcript [49], [50]. A PAS is a variable AU-rich sequence that is essential for the recruitment of the polyadenylation machinery needed to add the polyA tail to a given RNA [51]. TOP elements tag the mRNA for growth associated translational repression [52]. MBEs recruit and bind the Musashi protein, an evolutionarily conserved RNA-binding protein known to have the ability to regulate mRNA translation [53]. K-Boxes and GY-Boxes are conserved negative regulators, acting as binding platforms for the 5′ seed regions of miRNAs [54], [55]. We therefore observe SNP induced changes in base-pairing probability in a majority of the RNA functional elements in our UTRs of interest. For each of these elements, accessibility is key to function, and the base-pairing probability changes we predict affect accessibility.
We performed a complete analysis of the structural changes caused by disease associated mutations in the 5′ UTR of FTL, because it is already established that an IRE is present in the UTR and is responsible for regulating FTL [26], [39]. Our structural analysis of the FTL 5′ UTR (Figure 3) begins to reveal the molecular complexity of disease caused by mRNA structural rearrangement. We see in Figure 3 that no single SNP has the exact same effect on the structural ensemble. Nonetheless, the structural changes observed are limited in the case of this phenotype to three major structural clusters. Mutations shift the equilibrium between the different structural clusters. However, all structures sampled when projected in principal component space fall into these same clusters. A different behavior is observed in the 5′ UTR of RB1 (retinoblastoma 1), where the two disease-associated SNPs we identified also significantly repartition the structural ensemble (Figure S1). In this case, the disease-associated SNPs have the opposite effect to that observed in the FTL 5′ UTR. For the RB1 5′ UTR, the Retinoblastoma associated SNPs collapse the structural ensemble from three clusters to one.
Structural rearrangement of a UTR as a post-transcriptional regulatory mechanism is common in bacterial Riboswitches [16], [20]. In this case, the binding of a small molecule, in general a metabolite, changes the secondary structure of the RNA so as to promote or inhibit Ribosomal binding and gene translation [16]. It is therefore not surprising that certain specific mutations can have profound structural consequences on a human UTR. The UTRs and their associated SNPs we report here are in fact a type of “RiboSNitch,” that is a molecular switch that is activated by SNP. Unlike the Riboswitch, however, a RiboSNitch results in a permanent change in regulation and thus leads to the disease phenotype. RiboSNitches represent a novel therapeutic target, since small molecules can repartition the RNA structural ensemble.
The U310A and U336A mutations in the 5′UTR of CPB2 are particularly noteworthy. CPB2 codes for the Thrombin-Activable Fibrinolysis Inhibitor (TAFI) [45]. An activated form of TAFI is known to slow down Fibrinolysis [44]. Mutations that alter the expression level of this protein are associated with various thrombotic disorders, including ischemic stroke [56]. Results from mRNA decay assays show the presence of these SNPs result in an mRNA with an altered stability [45]. Our results suggest that the associated SNPs significantly alter the RNA conformational ensemble of the TAFI 5′ UTR and that this could affect RNA decay. Therefore, conformational change is also a likely determinant of mRNA stability which indirectly controls protein expression.
Low-cost whole genome sequencing, SNP microarrays specifically focused on non-coding regions of the genome, and greater phenotypic information available through electronic medical records will necessarily yield new phenotypic associations in the non-coding regions of the genome. The SNPfold algorithm provides a novel approach to gain structural insight into the structural consequences of mutations on a transcript. We therefore developed a web server (http://cloud.wadsworth.org/snpfold) that reproduces the computational functionality we describe in this manuscript. In particular our web server allows the simultaneous analysis of multiple SNPs. This computational tool will provide the GWAS community with a simple way to quantitatively evaluate the effects of SNPs (and other mutations) on the RNA structural ensemble.
Materials and Methods
Identification of a set of disease-associated SNPs in UTRs
The Human Genetic Mutations Database (http://www.hgmd.cf.ac.uk/) was utilized [35], [36] as a primary source of genotype/phenotype associations in our study. The professional version of the database, obtainable through a yearly subscription fee, contains the “prom” table. The 2009.1 version of HGMD that we utilized contains 1459 entries in the prom table. Each entry contains DNA sequences that flank the disease associated SNP. These flanking sequences were mapped to the human reference genome, in order to determine the genomic coordinates of the corresponding SNPs [37]. 1385 mutations from this table were successfully mapped to some specific coordinate within a specified chromosome.
Once the coordinates of the SNPs in the table were obtained, the ‘refgene’ table from the hg18 build of the Human genome [38] was used to identify SNPs that map on a UTR of a gene. For a given gene transcript, the corresponding chromosome and strand are provided, as well as coordinates of the transcription and translation start/stop sites, and the exon start/stop sites. SNPs whose coordinates map between the transcription start/translation stop sites or the translation stop/transcription stop sites were classified as mapping onto a UTR region. SNPs that either mapped onto intronic regions of UTRs (not between an exon start and stop coordinate) or were less than 10 nucleotides away from either end of the UTR were excluded from our analysis.
Obtaining sequences of UTR regions
The gene coordinates in ‘refgene’ were used to extract UTR sequences for a given disease associated UTR SNP in ‘prom’. For this, full sequences for each chromosome in the human reference genome were required. We used UCSC genome build hg18 [37]. If the gene was on the ‘minus’ strand, we used the reverse complement of the extracted sequence, as the human reference genome consists entirely of sequence from the ‘plus’ strand. Using the mapped coordinates for each UTR SNP, two different UTR sequences were produced: the wild type sequence, and the sequence containing the disease-associated SNP. It should also be noted that the UTR sequences produced were from the mature transcripts, and are fully spliced.
SNPfold algorithm
The SNPfold algorithm that was developed utilizes the RNA partition function calculations implemented in RNAfold [57], [58]. The algorithm requires an input of two different RNA strands that are identical in length. For the analysis of any RNA SNP, the wild type RNA sequence and the RNA sequence containing the disease associated SNP of interest was obtained as previously described. The sum of the columns of each partition function was used to compute the Pearson Correlation coefficient for each WT/SNP pair.
To normalize for sequence length, we computed a non-parametric p-value for a given correlation coefficient. This value represents the likelihood of a random mutation in the RNA of interest producing the same or lower correlation coefficient. For a sequence of length n all possible 3n mutations are computed and the mutation of interest ranked compared to all the other possible mutations. The non-parametric p-value was then estimated as the rank of the mutation of interest divided by 3n.
Principal Component analysis of the structural ensemble
The structures for the Principal Component analysis were generated using the statistical sampling algorithm in the sFold software [40]. The structures were then parameterized into a vector of ones and zeros (with one representing the base being paired). A sample of 1000 structures from each mutant and WT sequence was randomly selected and used to generate the basis vectors of the principle component analysis. The two firsty basis vectors representing the variances in the data were used to project the 5000 structures from each sequence onto the same principle components. The resultant data took the form of a 2D scatterplot. The linear structure diagrams for the wild type were generated using the VARNA software [59].
Scanning UTRs for RNA regulatory motifs
A search for known RNA regulatory motifs was carried out in every UTR reported in Table 1 and Table S1. The UTRscan algorithm (which searches a user-submitted RNA sequence for known UTR motifs listed in the UTRsite database) was utilized [60], [61]. In 3′ UTRs, an additional search for miRNA binding sites was conducted using RegRNA which predicts splicing sites and miRNA binding sites in mRNA sequences [62].
Detection of RBP binding to transcripts of interest
RIP-Chip Data obtained from Scott Tenenbaum (UAlbany) was analyzed in the context of the mRNAs reported in Table 1 and Table S1 [46]. The data included analyses of RNA transcript coprecipitation with three different RNA-binding proteins (Elavl1, Pabpc1, and Igfbp2) in two different cell lines (Gm12878 and K562). p-values (−log10) above 1.3 were deemed statistically significant for RNA binding, and are reported in Table 1 and Table S1.
LD and eQTL analysis of SNPs
We searched dbSNP to identify common variants (SNPs) with accession IDs (rs numbers) from Table 1 and Table S1. For the mRNAs in which we identified common variants, LD data from HapMap was downloaded [63] and reported above a significant (R2>0.9) threshold. eQTL data from [64] was queried using the common dbSNP IDs.
Supporting Information
Zdroje
1. MortonNE
2008 Into the post-HapMap era. Adv Genet 60 727 742
2. MathewCG
2008 New links to the pathogenesis of Crohn disease provided by genome-wide association scans. Nat Rev Genet 9 9 14
3. LeeSH
van der WerfJH
HayesBJ
GoddardME
VisscherPM
2008 Predicting unobserved phenotypes for complex traits from whole-genome SNP data. PLoS Genet 4 e1000231 doi:10.1371/journal.pgen.1000231
4. BenjaminEJ
DupuisJ
LarsonMG
LunettaKL
BoothSL
2007 Genome-wide association with select biomarker traits in the Framingham Heart Study. BMC Med Genet 8 Suppl 1 S11
5. LeeST
ChoiKW
YeoHT
KimJW
KiCS
2008 Identification of an Arg35X mutation in the PDCD10 gene in a patient with cerebral and multiple spinal cavernous malformations. J Neurol Sci 267 177 181
6. WangJ
PitarqueM
Ingelman-SundbergM
2006 3′-UTR polymorphism in the human CYP2A6 gene affects mRNA stability and enzyme expression. Biochem Biophys Res Commun 340 491 497
7. WangD
JohnsonAD
PappAC
KroetzDL
SadeeW
2005 Multidrug resistance polypeptide 1 (MDR1, ABCB1) variant 3435C>T affects mRNA stability. Pharmacogenet Genomics 15 693 704
8. Kimchi-SarfatyC
OhJM
KimIW
SaunaZE
CalcagnoAM
2007 A “silent” polymorphism in the MDR1 gene changes substrate specificity. Science 315 525 528
9. GommansWM
TataliasNE
SieCP
DupuisD
VendettiN
2008 Screening of human SNP database identifies recoding sites of A-to-I RNA editing. Rna 14 2074 2085
10. GlinskyGV
2008 SNP-guided microRNA maps (MirMaps) of 16 common human disorders identify a clinically accessible therapy reversing transcriptional aberrations of nuclear import and inflammasome pathways. Cell Cycle 7 3564 3576
11. GlinskyGV
2008 Disease phenocode analysis identifies SNP-guided microRNA maps (MirMaps) associated with human “master” disease genes. Cell Cycle 7 3680 3694
12. NuinoonM
MakarasaraW
MushirodaT
SetianingsihI
WahidiyatPA
2009 A genome-wide association identified the common genetic variants influence disease severity in beta(0)-thalassemia/hemoglobin E. Hum Genet
13. GlinskiiAB
MaJ
MaS
GrantD
LimCU
2009 Identification of intergenic trans-regulatory RNAs containing a disease-linked SNP sequence and targeting cell cycle progression/differentiation pathways in multiple common human disorders. Cell Cycle 8 3925 3942
14. TreutleinJ
CichonS
RidingerM
WodarzN
SoykaM
2009 Genome-wide association study of alcohol dependence. Arch Gen Psychiatry 66 773 784
15. LaederachA
2007 Informatics challenges in structured RNA. Brief Bioinform 8 294 303
16. WangJX
LeeER
MoralesDR
LimJ
BreakerRR
2008 Riboswitches that sense S-adenosylhomocysteine and activate genes involved in coenzyme recycling. Mol Cell 29 691 702
17. RanaTM
2007 Illuminating the silence: understanding the structure and function of small RNAs. Nat Rev Mol Cell Biol 8 23 36
18. LeinES
HawrylyczMJ
AoN
AyresM
BensingerA
2007 Genome-wide atlas of gene expression in the adult mouse brain. Nature 445 168 176
19. DohertyEA
DoudnaJA
2000 Ribozyme structures and mechanisms. Annu Rev Biochem 69 597 615
20. TuckerBJ
BreakerRR
2005 Riboswitches as versatile gene control elements. Curr Opin Struct Biol 15 342 348
21. NollerHF
2005 RNA structure: reading the ribosome. Science 309 1508 1514
22. WaldispuhlJ
CloteP
2007 Computing the partition function and sampling for saturated secondary structures of RNA, with respect to the Turner energy model. J Comput Biol 14 190 215
23. MathewsDH
2004 Using an RNA secondary structure partition function to determine confidence in base pairs predicted by free energy minimization. Rna 10 1178 1190
24. BernhartSH
TaferH
MucksteinU
FlammC
StadlerPF
2006 Partition function and base pairing probabilities of RNA heterodimers. Algorithms Mol Biol 1 3
25. ReederJ
HochsmannM
RehmsmeierM
VossB
GiegerichR
2006 Beyond Mfold: recent advances in RNA bioinformatics. J Biotechnol 124 41 55
26. BurdonKP
SharmaS
ChenCS
DimasiDP
MackeyDA
2007 A novel deletion in the FTL gene causes hereditary hyperferritinemia cataract syndrome (HHCS) by alteration of the transcription start site. Hum Mutat 28 742
27. JankovicL
EfremovGD
PetkovG
KattamisC
GeorgeE
1990 Two novel polyadenylation mutations leading to beta(+)-thalassemia. Br J Haematol 75 122 126
28. HoPJ
RochetteJ
FisherCA
WonkeB
JarvisMK
1996 Moderate reduction of beta-globin gene transcript by a novel mutation in the 5′ untranslated region: a study of its interaction with other genotypes in two families. Blood 87 1170 1178
29. CastaldiPJ
ChoMH
CohnM
LangermanF
MoranS
2009 The COPD Genetic Association Compendium: A Comprehensive Online Database of COPD Genetic Associations. Hum Mol Genet
30. EzzikouriS
El FeydiAE
El KihalL
AfifiR
BenazzouzM
2008 Prevalence of common HFE and SERPINA1 mutations in patients with hepatocellular carcinoma in a Moroccan population. Arch Med Res 39 236 241
31. HoPJ
HallGW
WattS
WestNC
WimperisJW
1998 Unusually severe heterozygous beta-thalassemia: evidence for an interacting gene affecting globin translation. Blood 92 3428 3435
32. HoPJ
HallGW
LuoLY
WeatherallDJ
TheinSL
1998 Phenotypic prediction in beta-thalassemia. Ann N Y Acad Sci 850 436 441
33. SgourouA
RoutledgeS
AntoniouM
PapachatzopoulouA
PsiouriL
2004 Thalassaemia mutations within the 5′UTR of the human beta-globin gene disrupt transcription. Br J Haematol 124 828 835
34. ChappellS
DalyL
MorganK
Guetta BaranesT
RocaJ
2006 Cryptic haplotypes of SERPINA1 confer susceptibility to chronic obstructive pulmonary disease. Hum Mutat 27 103 109
35. StensonPD
BallEV
MortM
PhillipsAD
ShielJA
2003 Human Gene Mutation Database (HGMD): 2003 update. Hum Mutat 21 577 581
36. GeorgeRA
SmithTD
CallaghanS
HardmanL
PieridesC
2008 General mutation databases: analysis and review. J Med Genet 45 65 70
37. KarolchikD
KuhnRM
BaertschR
BarberGP
ClawsonH
2008 The UCSC Genome Browser Database: 2008 update. Nucleic Acids Res 36 D773 779
38. ElnitskiLL
ShahP
MorelandRT
UmayamL
WolfsbergTG
2007 The ENCODEdb portal: simplified access to ENCODE Consortium data. Genome Res 17 954 959
39. SanchezM
GalyB
DandekarT
BengertP
VainshteinY
2006 Iron regulation and the cell cycle: identification of an iron-responsive element in the 3′-untranslated region of human cell division cycle 14A mRNA by a refined microarray-based screening strategy. J Biol Chem 281 22865 22874
40. DingY
ChanCY
LawrenceCE
2005 RNA secondary structure prediction by centroids in a Boltzmann weighted ensemble. Rna 11 1157 1166
41. DingY
ChanCY
LawrenceCE
2004 Sfold web server for statistical folding and rational design of nucleic acids. Nucleic Acids Res 32 W135 141
42. WoodsonSA
2000 Recent insights on RNA folding mechanisms from catalytic RNA. Cell Mol Life Sci 57 796 808
43. QuarrierS
MartinJS
Davis-NeulanderL
BeauregardA
LaederachA
Evaluation of the information content of RNA structure mapping data for secondary structure prediction. RNA 16 1108 1117
44. de BruijneEL
GilsA
GuimaraesAH
DippelDW
DeckersJW
2009 The role of thrombin activatable fibrinolysis inhibitor in arterial thrombosis at a young age: the ATTAC study. J Thromb Haemost 7 919 927
45. BoffaMB
MaretD
HamillJD
BastajianN
CrainichP
2008 Effect of single nucleotide polymorphisms on expression of the gene encoding thrombin-activatable fibrinolysis inhibitor: a functional analysis. Blood 111 183 189
46. BaroniTE
ChitturSV
GeorgeAD
TenenbaumSA
2008 Advances in RIP-chip analysis : RNA-binding protein immunoprecipitation-microarray profiling. Methods Mol Biol 419 93 108
47. StrangerBE
NicaAC
ForrestMS
DimasA
BirdCP
2007 Population genomics of human gene expression. Nat Genet 39 1217 1224
48. KozakM
2003 Alternative ways to think about mRNA sequences and proteins that appear to promote internal initiation of translation. Gene 318 1 23
49. ChildSJ
MillerMK
GeballeAP
1999 Translational control by an upstream open reading frame in the HER-2/neu transcript. J Biol Chem 274 24335 24341
50. JousseC
BruhatA
CarraroV
UranoF
FerraraM
2001 Inhibition of CHOP translation by a peptide encoded by an open reading frame localized in the chop 5′UTR. Nucleic Acids Res 29 4341 4351
51. BeaudoingE
FreierS
WyattJR
ClaverieJM
GautheretD
2000 Patterns of variant polyadenylation signal usage in human genes. Genome Res 10 1001 1010
52. IadevaiaV
CaldarolaS
TinoE
AmaldiF
LoreniF
2008 All translation elongation factors and the e, f, and h subunits of translation initiation factor 3 are encoded by 5′-terminal oligopyrimidine (TOP) mRNAs. Rna 14 1730 1736
53. CharlesworthA
WilczynskaA
ThampiP
CoxLL
MacNicolAM
2006 Musashi regulates the temporal order of mRNA translation during Xenopus oocyte maturation. Embo J 25 2792 2801
54. LaiEC
BurksC
PosakonyJW
1998 The K box, a conserved 3′ UTR sequence motif, negatively regulates accumulation of enhancer of split complex transcripts. Development 125 4077 4088
55. LaiEC
TamB
RubinGM
2005 Pervasive regulation of Drosophila Notch target genes by GY-box-, Brd-box-, and K-box-class microRNAs. Genes Dev 19 1067 1080
56. LeebeekFW
GoorMP
GuimaraesAH
BrouwersGJ
MaatMP
2005 High functional levels of thrombin-activatable fibrinolysis inhibitor are associated with an increased risk of first ischemic stroke. J Thromb Haemost 3 2211 2218
57. BindewaldE
ShapiroBA
2006 RNA secondary structure prediction from sequence alignments using a network of k-nearest neighbor classifiers. Rna 12 342 352
58. HofackerIL
StadlerPF
2006 Memory efficient folding algorithms for circular RNA secondary structures. Bioinformatics 22 1172 1176
59. DartyK
DeniseA
PontyY
2009 VARNA: Interactive drawing and editing of the RNA secondary structure. Bioinformatics 25 1974 1975
60. PesoleG
LiuniS
GrilloG
IppedicoM
LarizzaA
1999 UTRdb: a specialized database of 5′ and 3′ untranslated regions of eukaryotic mRNAs. Nucleic Acids Res 27 188 191
61. PesoleG
LiuniS
1999 Internet resources for the functional analysis of 5′ and 3′ untranslated regions of eukaryotic mRNAs. Trends Genet 15 378
62. HuangHY
ChienCH
JenKH
HuangHD
2006 RegRNA: an integrated web server for identifying regulatory RNA motifs and elements. Nucleic Acids Res 34 W429 434
63. 2003 The International HapMap Project. Nature 426 789 796
64. DimasAS
DeutschS
StrangerBE
MontgomerySB
BorelC
2009 Common regulatory variation impacts gene expression in a cell type-dependent manner. Science 325 1246 1250
65. CowellJK
BiaB
AkoulitchevA
1996 A novel mutation in the promotor region in a family with a mild form of retinoblastoma indicates the location of a new regulatory domain for the RB1 gene. Oncogene 12 431 436
66. MaciasM
DeanM
AtkinsonA
Jimenez-MoralesS
Garcia-VazquezFJ
2008 Spectrum of RB1 gene mutations and loss of heterozygosity in Mexican patients with retinoblastoma: identification of six novel mutations. Cancer Biomark 4 93 99
67. CremonesiL
FumagalliA
SorianiN
FerrariM
LeviS
2001 Double-gradient denaturing gradient gel electrophoresis assay for identification of L-ferritin iron-responsive element mutations responsible for hereditary hyperferritinemia-cataract syndrome: identification of the new mutation C14G. Clin Chem 47 491 497
68. FerrariF
FoglieniB
ArosioP
CamaschellaC
DaraioF
2006 Microelectronic DNA chip for hereditary hyperferritinemia cataract syndrome, a model for large-scale analysis of disorders of iron metabolism. Hum Mutat 27 201 208
69. CremonesiL
ParoniR
FoglieniB
GalbiatiS
FermoI
2003 Scanning mutations of the 5′UTR regulatory sequence of L-ferritin by denaturing high-performance liquid chromatography: identification of new mutations. Br J Haematol 121 173 179
70. BonafeL
DermitzakisET
UngerS
GreenbergCR
Campos-XavierBA
2005 Evolutionary comparison provides evidence for pathogenicity of RMRP mutations. PLoS Genet 1 e47 doi:10.1371/journal.pgen.0010047
71. HoPJ
HallGW
LuoLY
WeatherallDJ
TheinSL
1998 Beta-thalassaemia intermedia: is it possible consistently to predict phenotype from genotype? Br J Haematol 100 70 78
72. WayeJS
EngB
PattersonM
ReisMD
MacdonaldD
2001 Novel beta-thalassemia mutation in a beta-thalassemia intermedia patient. Hemoglobin 25 103 105
73. KazazianHHJr
BoehmCD
1988 Molecular basis and prenatal diagnosis of beta-thalassemia. Blood 72 1107 1116
74. MorgadoA
PicancoI
GomesS
MirandaA
CouceloM
2007 Mutational spectrum of delta-globin gene in the Portuguese population. Eur J Haematol 79 422 428
75. InoueI
NakajimaT
WilliamsCS
QuackenbushJ
PuryearR
1997 A nucleotide substitution in the promoter of human angiotensinogen is associated with essential hypertension and affects basal transcription in vitro. J Clin Invest 99 1786 1797
76. IshigamiT
UmemuraS
TamuraK
HibiK
NyuiN
1997 Essential hypertension and 5′ upstream core promoter region of human angiotensinogen gene. Hypertension 30 1325 1330
Štítky
Genetika Reprodukční medicínaČlánek vyšel v časopise
PLOS Genetics
2010 Číslo 8
- Kazuistika – Perspektivy využití precizované medicíny v rámci personalizované specifické terapie onkologických pacientů
- Nobelova cena za chemii pro genetické nůžky: Objev, který změní naši budoucnost?
- Technologie na bázi RNA v klinické praxi: od přebarvených petúnií k terapii vzácných a dosud jen obtížně léčitelných chorob u lidí
- „Nepředstavovali jsme si, že náš výzkum povede přímo ke vzniku nových léků, dokonce ještě za našeho života“
- Bezplatné služby pro diagnostiku ATTRv amyloidózy pro kardiology
Nejčtenější v tomto čísle
- Identification of the Bovine Arachnomelia Mutation by Massively Parallel Sequencing Implicates Sulfite Oxidase (SUOX) in Bone Development
- Common Inherited Variation in Mitochondrial Genes Is Not Enriched for Associations with Type 2 Diabetes or Related Glycemic Traits
- A Model for Damage Load and Its Implications for the Evolution of Bacterial Aging
- Did Genetic Drift Drive Increases in Genome Complexity?
Zvyšte si kvalifikaci online z pohodlí domova
Mazová zátka a její řešení
nový kurzVšechny kurzy