
Targeted Changes of the Cell Wall Proteome Influence Ability to Form Single- and Multi-strain Biofilms
Candida albicans is the most prevalent human fungal pathogen. Its ability to cause disease relies, in part, on the formation of biofilms, a protective structure of highly adherent cells tolerant to antifungal agents and the host immune response. The biofilm is considered as a persistent root of infection, disseminating infectious cells to other locations. In this study, we performed large-scale phenotypic analyses aimed at identifying genes whose overexpression affects biofilm development in C. albicans. Our screen relied on a collection of 531 C. albicans strains, each conditionally overexpressing one given gene and carrying one specific molecular tag allowing the quantification of strain abundance in mixed-population experiments. Our results strikingly revealed the enrichment of strains overproducing poorly-characterized surface proteins called Pgas (Putative GPI-Anchored proteins), within a 531-strain-containing biofilm model. We show that these PGA genes differentially contribute to single-strain and multi-strain biofilm formation and are involved in specific stages of the biofilm developmental process. Taken together, our results reveal the importance of C. albicans cell surface proteins during biofilm formation and reflect the powerful use of strain barcoding in combination with gene overexpression to identify genes and/or pathways involved in processes pertaining to virulence of pathogenic microbes.
Published in the journal:
. PLoS Pathog 10(12): e32767. doi:10.1371/journal.ppat.1004542
Category:
Research Article
doi:
https://doi.org/10.1371/journal.ppat.1004542
Summary
Candida albicans is the most prevalent human fungal pathogen. Its ability to cause disease relies, in part, on the formation of biofilms, a protective structure of highly adherent cells tolerant to antifungal agents and the host immune response. The biofilm is considered as a persistent root of infection, disseminating infectious cells to other locations. In this study, we performed large-scale phenotypic analyses aimed at identifying genes whose overexpression affects biofilm development in C. albicans. Our screen relied on a collection of 531 C. albicans strains, each conditionally overexpressing one given gene and carrying one specific molecular tag allowing the quantification of strain abundance in mixed-population experiments. Our results strikingly revealed the enrichment of strains overproducing poorly-characterized surface proteins called Pgas (Putative GPI-Anchored proteins), within a 531-strain-containing biofilm model. We show that these PGA genes differentially contribute to single-strain and multi-strain biofilm formation and are involved in specific stages of the biofilm developmental process. Taken together, our results reveal the importance of C. albicans cell surface proteins during biofilm formation and reflect the powerful use of strain barcoding in combination with gene overexpression to identify genes and/or pathways involved in processes pertaining to virulence of pathogenic microbes.
Introduction
Candida albicans is the most predominant human fungal pathogen, causing both superficial and hematogenously disseminated infections [1]. These infections are complicated by C. albicans' ability to form biofilms, which are complex three-dimensional microbial structures attached to either biotic or abiotic surfaces and encased in an extracellular matrix [2]–[5]. Biofilms play a crucial role in C. albicans virulence as they result in decreased susceptibility to both antimicrobial agents and the host immune system [2], [5]–[7]. C. albicans biofilms are composed of yeast and hyphal cells, and the ability to switch between these morphotypes is essential for normal biofilm formation [8]–[10]. Additional understanding of the mechanisms of biofilm formation in C. albicans has been gained over recent years with the discovery of various regulators and effectors involved in this process (reviewed in [11]). In this respect, several cell wall proteins have been shown to play crucial roles during biofilm formation. For instance, the Bcr1 transcription factor, required for biofilm formation, was shown to control the expression of genes encoding cell wall proteins, among which the ALS3, ALS1, and HWP1 genes contribute to biofilm formation and integrity [12]–[14]. Heterotypic interactions between Als1 and Als3, members of the Als family of glycophosphatidylinositol (GPI)-anchored agglutinin-like cell wall proteins, and the hyphal wall protein Hwp1, appear crucial for cell-cell interactions within biofilms [15]. Other GPI-anchored proteins play positive or negative roles at different stages of biofilm formation, such as Ywp1 (Pga24), Eap1 (Pga47), Pga26, Pga1, and members of the CFEM family (Pga10, Rbt5 and Csa1) [16]–[21].
To date, the investigation of molecular determinants of biofilm formation in C. albicans has largely relied on phenotypic analyses of loss-of-function mutants for genes predicted to play a role in this process, based on their expression profile, function or cellular location [12], [22]–[25]. Gene overexpression is an alternative strategy for studying gene function. It mimics gain-of-function mutations, provides a complement to loss-of-function phenotypes and allows the role of both essential and non-essential genes or individual genes within multi-gene families to be studied [26]. Gene overexpression has been successfully used in Saccharomyces cerevisiae to reveal new signalling pathways [27] and identify transcription factor targets [28]. More recently, overexpression approaches in C. albicans identified genes involved in fitness, adherence, morphogenesis, pheromone response and antifungal resistance [29]–[33] as well as the characterization of transcription factor targets [13], [23], [34]. To date, the largest collection of overexpression plasmids that exists for C. albicans genes has been developed in our laboratory [30]. This collection includes 337 uniquely barcoded plasmids allowing tetracycline-inducible overexpression of genes encoding components of signalling networks, in particular protein kinases, protein phosphatases and transcription factors [30].
Here, we have extended this plasmid collection to include genes encoding C. albicans predicted cell wall proteins and genes involved in genome dynamics. We took advantage of the molecular barcoding of the cognate overexpression strains to develop a signature-tagged overexpression (ST-OE) screen aimed at identifying genes whose overexpression affects fitness during planktonic cell growth and/or biofilm development in C. albicans. Our results specifically highlight the impact of overexpressing specific cell surface GPI-modified proteins on the ability of C. albicans to form single - or multi-strain biofilms and reveal their role in adhesion and/or cell-cell interactions.
Results
Construction of a signature-tagged C. albicans overexpression collection
We generated a collection of signature-tagged C. albicans conditional overexpression strains using partial C. albicans ORFeome libraries ([30]; Legrand et al., in preparation; Walker et al., in preparation) and a collection of barcoded derivatives of the conditional overexpression plasmid CIp10-PTET-GTW ([30]; Fig. 1A, See Materials and Methods for details). The resulting collection includes 531 strains conditionally overexpressing individual genes encoding (or predicted to encode) transcription factors (180 ORFs), protein kinases (72 ORFs), protein phosphatases (34 ORFs), proteins related to DNA replication, recombination and repair (87 ORFs), predicted cell surface proteins (61 ORFs) and others (Fig. 1B; S1 Table for details).

We tested the efficiency of detecting each of the 531 tagged strains from a pool with equal strain representation using an oligonucleotide microarray carrying both forward and reverse probe sequences for every barcode (S1 Figure and S1 Table, see Materials and Methods). The microarrays efficiently detected nearly 90% of the pooled strains with only 11.6% of total strain-matching probes (123 out of 1062) having log2-transformed Cy5 and Cy3 signal intensities lower than 8 (S1 Figure), suggesting that just over 10% were underrepresented or that the corresponding tags had low hybridization efficiency. Strain detection with the microarrays was highly reproducible, as shown by the high Pearson correlation coefficients between 2 independent pool replicates (S1B Figure).
Identification of C. albicans genes whose overexpression alters cell fitness during planktonic growth
As a proof-of-principle for the ST-OE approach, we evaluated the impact of overexpressing each of the 531 genes on planktonic strain fitness. Pooled strains were grown for 16 generations in GHAUM medium (see Materials and Methods) at 30°C in the presence or absence of 50 µg.mL-1 doxycycline (Dox), with dilution in fresh medium after 8 generations to avoid saturation of the culture. Genomic DNA was prepared, followed by barcode amplification, labeling with Cy3 (untreated) or Cy5 (Dox-treated) dyes and hybridization to the barcode microarray. We found that overexpression of 5 genes, namely RAD53, RAD51, PIN4, SFL2 and ORF19.2781, decreased strain fitness using a Z-score (i.e. number of standard deviations from the population mean) cutoff of −2.0 (Fig. 2A and S2 Table). Notably, we failed to detect any gene conferring increased fitness (Fig. 2A). Liquid growth assays of individual strains grown independently confirmed an increased doubling time in Dox-treated cells overexpressing RAD53, RAD51 and ORF19.2781, relative to untreated cells (Fig. 2B), in agreement with our microarray data. As morphology alterations affect turbidity measurements, the SFL2-overexpressing strain which shows extensive filamentation in overexpression conditions [30], [35]–[37] was omitted from this assay. Taken together, these data indicated that our ST-OE approach could be used to identify genes whose overexpression affects C. albicans fitness.

Identification of C. albicans genes whose overexpression alters strain abundance within a multi-strain biofilm
We used the ST-OE approach to identify C. albicans genes whose overexpression alters strain abundance within a multi-strain biofilm. To this end, the 531-strain pool was grown overnight in GHAUM medium at 30°C in the presence or absence of 50 µg.mL−1 doxycycline. Cells were allowed to adhere to Thermanox slides that were subsequently incubated at 37°C for 40 h in a microfermentor under a continuous flow of GHAUM medium in the presence or absence of 50 µg.mL−1 doxycycline. Genomic DNA was extracted from the resulting mature biofilms followed by barcode amplification, Cy3 (untreated)/Cy5 (Dox-treated) labeling and hybridization to barcode microarrays. The entire experiment was performed using 8 biological replicates and two independent analyses of our microarray data were performed (See Materials and Methods for details). We found 20 genes whose overexpression altered strain abundance in the multi-strain biofilm. Only one gene (ORF19.2781) was common to both planktonic and biofilm data, suggesting that the remaining 19 genes were not linked to a growth defect (Table 1, Fig. 3 and S3 Table). Overexpression of 16 out of these 20 genes resulted in increased strain abundance within the multi-strain biofilm (Table 1). A gene ontology (GO) term enrichment analysis was performed using the GO Term Finder at the Candida Genome Database [38]–[40] and the 531 gene set as a reference. Strikingly, among the 20 identified genes we found a significant enrichment of the GO term “cell wall” (P = 1.4×10⁻⁵) including 10 genes encoding (or predicted to encode) proteins involved in cell wall biogenesis and integrity (IHD1/PGA36, PGA15, PGA19, PGA22, PGA32, PGA37, PGA42, PGA59, PHR2 and TOS1, Table 2). Similarly, when the enrichment analysis was performed using broad functional categories, we observed a significant enrichment for cell surface protein-encoding genes (P = 1.31×10⁻⁵; Table 2). Overexpression of these 10 genes did not significantly promote or inhibit morphogenesis when compared to strain SC5314 (S2A Figure). Moreover, their overexpression did not significantly impact growth rates as judged by colony size on solid GHAUM medium at 30°C and 37°C (S2B Figure). Thus, our data suggested that the increased occupancy of the multi-strain biofilm by the selected strains was not a consequence of altering growth rate or morphogenesis.


Impact of overexpressing selected genes on single-strain biofilm formation
The selected overexpression strains were tested for their ability to form single strain biofilms under conditions similar to those used for our mixed-population screen. Biofilms were grown in the continuous-flow microfermentor system. The biomass obtained after 40 h of biofilm growth was quantified and compared to the biomass formed by the wild type strain SC5314 grown under the same conditions. As shown in Fig. 4A, the strain overexpressing PGA59 displayed increased biomass, consistent with our mixed-population data. Decreased biofilm biomass was observed upon PGA22 overexpression (Fig. 4A), contrasting with the positive impact of overexpressing this gene on strain abundance in the multi-strain biofilm (Fig. 3 and Table 1). Finally, overexpression of the remaining genes did not significantly affect biofilm biomass (Fig. 4A).

We further compared biofilm formation of the wild-type and the PGA59- and PGA22-overexpression strains during a kinetic experiment in the continuous-flow fermentor system under inducing conditions. The biofilm biomass was quantified at 18, 24, 40, 48, and 65 h of biofilm growth. The overexpression strains behaved similarly until the first time-point (18 h; Fig. 4B). The PGA59-overexpression strain formed a biofilm faster than the remaining strains from 18 h onwards (Fig. 4B, upper panel). In contrast, the PGA22-overexpression strain developed into biofilms more slowly than the wild-type strain (Fig. 4B, lower panel). Overall, these results were consistent with those obtained in the end-point analysis (Fig. 4A) and suggested that the behavior of the PGA22-overexpression strain differed when grown in single - or multi-strain biofilms.
Competitive growth of the PGA22 or PGA59 overexpression strains results in higher abundance of the corresponding strains in a mixed population biofilm
Because of the discrepancy observed for the PGA22-overexpression strain in single - or multi-strain biofilms, we assessed whether the increased abundance of PGA22- or PGA59-overexpression strains in a multi-strain biofilm could be recapitulated in a biofilm formed by either of these strains together with a control strain. The PGA22- or PGA59-overexpression plasmids were introduced into a C. albicans strain that constitutively expressed GFP (CEC3781, S4 Table). A strain constitutively expressing BFP (CEC3783, S4 Table) was used as a control. A 1∶1 mixture of the GFP-tagged PGA22 - or PGA59-overexpressing strains and the BFP-expressing control strain was used as an inoculum, and biofilms grown for 40 h in the absence or presence of doxycycline. Genomic DNA was isolated from each biofilm, and strain abundance quantified by qPCR using GFP and BFP specific primers. In biofilms grown under non-inducing conditions, the overexpression and control strains were equally represented (Fig. 5). By contrast, both PGA22 - and PGA59-overexpression strains were significantly more abundant in the respective biofilms grown under inducing conditions (64% vs. 50% for the PGA22-overexpression strain and 65% vs. 50% for the PGA59-overexpression strain, with or without doxycycline, respectively; Fig. 5). Consistently, confocal microscopy-acquired fluorescence images showed more GFP-labeled cells relative to BFP cells in the doxycycline-treated mixed biofilms as compared to untreated controls (S3 Figure). A similar increase was observed when BFP-expressing PGA22 - or PGA59-overexpression strains were grown in mixed-biofilms with a GFP-expressing control strain (S4 Figure). Hence, overexpression of PGA22 and PGA59 resulted in increased strain abundance in a mixed biofilm-population.

PGA22 and PGA59 overexpression increases cell adherence
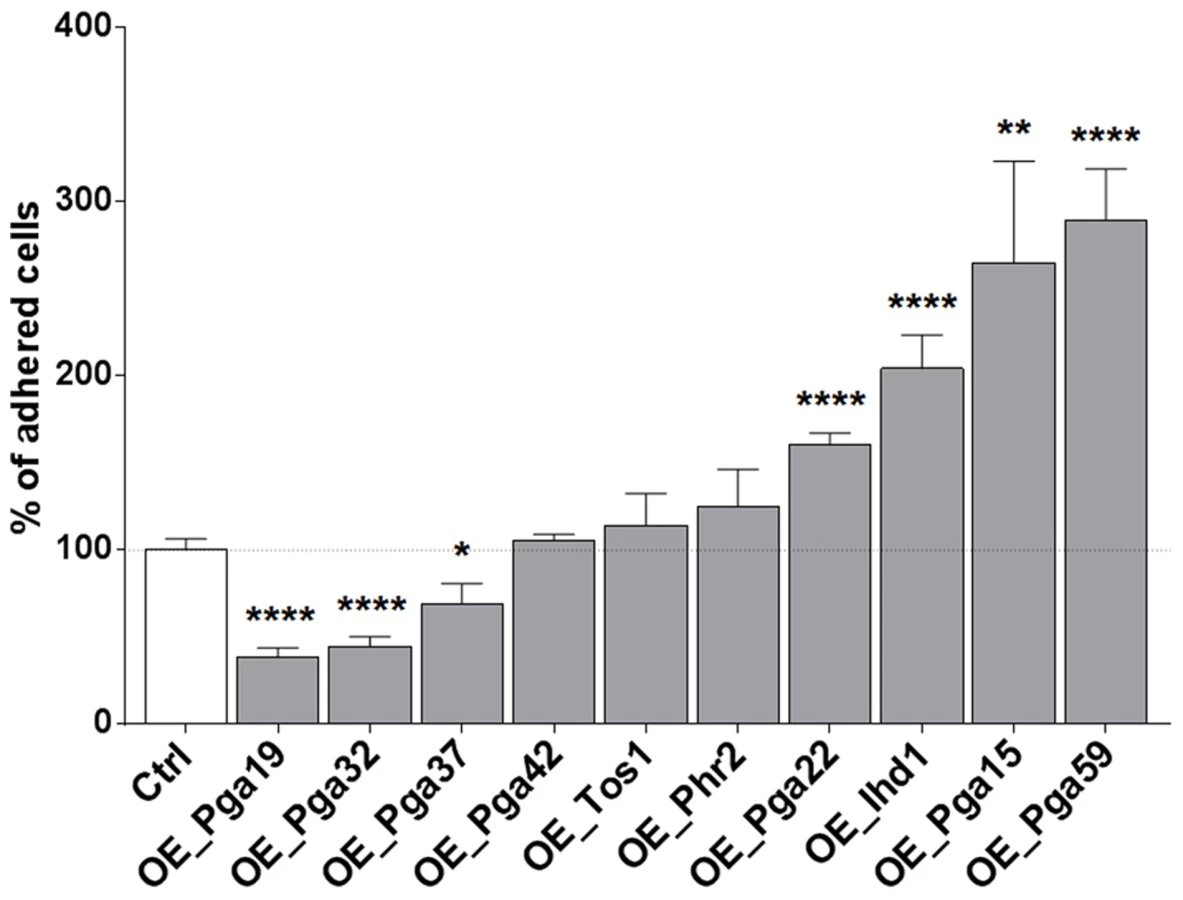
Biofilm formation is a multi-stage process that is initiated upon adherence of C. albicans yeast cells to a substrate and reinforced through cell-to-cell interactions (reviewed in [3]). Differences observed for the PGA22- and PGA59-overexpression strains upon single - or multi-strain biofilm formation might reflect differences in adherence to the substrate or to other biofilm cells. Therefore, strains overexpressing PGA22 or PGA59 as well as the other cell wall-related genes identified in our screen were individually tested for their ability to adhere to Thermanox following overnight growth in GHAUM medium at 30°C in the presence or absence of doxycycline. Modest, non-significant, variations in the adherence of the ten strains were observed when they were grown under non-inducing conditions (S5 Figure). In contrast, overexpression of IHD1/PGA36, PGA15, PGA22 and PGA59 significantly increased adherence of C. albicans to Thermanox, while overexpression of PGA19, PGA32 and PGA37 decreased it (Fig. 6). The increased adherence phenotype was substrate-independent, as shown in an adhesion assay of the PGA22 - and PGA59-overexpressing strains using a polystyrene substrate (microtiter plate, S6 Figure).
PGA22 overexpression results in increased sensitivity of adhered cells to shear forces
Results presented above indicated that over-expression of PGA59 and PGA22 increased adherence to abiotic surfaces and yet, this could have different outcomes during biofilm formation. While the PGA59-overexpression strain showed an increased ability to form biofilms in single - and multi-strain biofilms consistent with increased adherence to the substrate, the PGA22-overexpression strain showed decreased or increased ability to form biofilms when grown alone or in combination, respectively. We reasoned that the differences observed for the PGA22-overexpression strain might occur at early time points during biofilm development and therefore, examined the fate of cells overexpressing PGA22 once adhered to Thermanox and exposed to a flow of medium in the microfermentor system. To this aim, the PGA22-overexpression strain was grown overnight in the presence or absence of doxycycline, allowed to adhere to Thermanox and incubated in the microfermentor system in the presence or absence of doxycycline for 2 h. Cells attached to the Thermanox at t = 0 h and t = 2 h and those that were released during the 2 h of biofilm growth in the continuous-flow fermentor system were quantified by microscopy or by flow cytometry (see Materials and Methods). At t = 0 h, overexpression of PGA22 resulted in increased adherence (Fig. 7A); however, at t = 2 h, less cells remained attached to the slide (Fig. 7B), correlating with an increase of released cells during this 2 h period (Fig. 7C). Moreover, careful observation of Thermanox slides under the microscope revealed that upon overexpression of PGA22, cells tended to adhere in clusters of more than 3 cells (Fig. 7D). Under a more static environment (i.e. in the absence of flow), overexpression of PGA22 did not decrease biofilm formation and showed a tendency to form more biofilm (S7 Figure). In this environment the PGA59-overexpression strain still formed more biofilm (S7 Figure). This is in line with the effect of flow in washing out cells adhered to the substrate and consequently affecting biofilm biomass. We further analyzed our confocal microscopy-acquired fluorescence data from the competitive biofilm growth assay under continuous flow of the GFP-labeled strains overexpressing PGA22 and PGA59 versus the parental control strain (BFP-labeled, S3 Figure). We quantified abundance of GFP - versus BFP-labeled cells within the bottom layer of the mature biofilm, where early events such as adhesion occur. In the bottom layer of the biofilm, the PGA22-overexpressing cells were less abundant as compared to the upper layer (S8 Figure, compare panels A and B). In contrast, PGA59-overexpressing cells were more abundant within both the bottom and upper layers of the mature biofilm (S8 Figure, compare panels C and D). Taken together, our results suggested that the apparent increase in adherence of the PGA22-overexpression strain was a consequence of increased cell aggregation that rendered adhered cells more susceptible to shear forces occurring in the microfermentor. This may explain why PGA22 overexpression is detrimental to single-strain biofilm formation but favorable in a potentially protective multi-strain biofilm. In contrast, increased adherence of individual cells of the PGA59-overexpression strain to the surface was directly correlated to increased biofilm formation whether alone or in combination.

PGA22 and PGA59 overexpression imparts significant adhesion forces to single C. albicans cells exposed to an inert support
To further investigate the effect of PGA22 and PGA59 overexpression on the adherence of single C. albicans cells, we performed adhesion force measurements using Atomic Force Microscopy (AFM, Fig. 8). The PGA22- and PGA59-overexpression strains were grown for 16 h in the presence or absence of 50 µg.mL−1 doxycycline in YPD medium and subjected to an adhesion force measurement assay between the AFM tip, composed of Si3N4, and the cell surface (Fig. 8). We generated adhesion maps (Fig. 8, left panels) where the intensity of each pixel corresponds to the force required to dissociate the AFM tip from the sample (i.e. adhesion force). Upon doxycycline treatment, adhesion events were detected in 76% of the recorded force curves for PGA22 overexpression (Fig. 8, + Dox, upper panels), versus less than 3% without treatment (Fig. 8, -Dox, upper panels). We detected only 5% of adhesion events in the recorded force curves on the parental control strain (vector only, S9 Figure). The mean force of PGA22 overexpression-mediated adhesion events was 1.21 nN±0.55 nN (Fig. 8). The PGA59-overexpressing cells displayed a stronger surface adhesion rate upon induction by doxycycline (Fig. 8, lower panels, PGA59, + Dox). Both frequency of cell surface-tip adhesion events (82%) and adhesion forces (ranging from 1 up to 5 nN) were higher than those observed for PGA22 overexpression (Fig. 8, lower panels). Taken together, our AFM analyses indicated that PGA22 and PGA59 overexpression imparted significant adhesion forces to single C. albicans cells.

Overexpression of PGA22 alters the structure of the C. albicans cell wall
The C. albicans cell wall is characterized by an inner layer containing the skeletal polysaccharides chitin, β-1,3-glucan and β-1,6-glucan, and a fibrillar outer layer enriched with O-linked and N-linked mannose polymers (mannans) covalently associated with proteins. The major class of cell wall proteins are GPI-modified proteins attached to the β-1,3-glucan skeleton by β-1,6 linkages [41], [42]. We reasoned that overexpressing predicted GPI-anchored proteins could result in an abnormal cell wall structure, leading to modified adherence to the substrate and/or other cells. The cell wall architecture of strains overexpressing PGA22 and PGA59 were analyzed using transmission electron microscopy (TEM). Results presented in Fig. 9 showed that the PGA22-overexpressing strain displayed a thinner outer fibrillar layer as compared to the control strain and the PGA59-overexpressing strain. In contrast, the inner cell wall thickness of these strains was similar (Fig. 9B). Alterations in the cell wall structure of the PGA22-overexpression mutant may contribute to its modified ability to bind Thermanox and/or aggregate.

Genome-wide transcript profiling data correlate with perturbation of the C. albicans cell wall upon PGA22 overexpression
To better understand how PGA22 overexpression affects the cell wall structure, we additionally performed transcript profiling of the PGA22-overexpression strain under the same growth conditions used for the TEM analysis (Fig. 9). Three independently grown PGA22-overexpression strains were treated or not with 50 µg.mL−1 doxycycline for 16 h followed by total RNA extraction, reverse transcription, labeling and hybridization to a custom-designed C. albicans ORF microarray that was described previously [36]. Analysis of the control strain (see below) indicated that doxycycline treatment did not affect gene expression under these conditions (S10 Figure). Using a fold-change cut-off of 1.5 and a p-value threshold of ≤0.05, 37 genes were upregulated upon PGA22 overexpression (Table 3; see Materials and Methods for details and S5 Table for complete transcript profiling data). A significant proportion of cell wall related genes were among the induced genes, including genes encoding (or predicted to encode) GPI-anchored proteins (PGA29/RHD3, CRH11), a chitinase (CHT3) and a chitin synthase (CHS1), cell wall proteins (RBE1, SCW1) as well as putative adhesins (PGA35/FGR41, PGA38 and ORF19.5267) (Table 3). Gene Ontology term enrichment analysis revealed a strong overrepresentation of the term “Cell wall” (p = 0.001) among the transcriptionally induced genes. On the other hand, although 100 genes were significantly downregulated (fold-change <−1.5; p-value <0.05; S5 Table), no significant gene ontology enrichment was found. However, we noticed the presence of genes encoding mannosyltransferases (MNN12, MNT1, KTR4, RHD1) and genes linked to or affecting mannosyltransferase activity (VRG4, SMF12, SKN1) in the set of downregulated genes (S5 Table, See discussion). We confirmed the expression microarray data by RT-qPCR analyses of selected targets (S10 Figure), using the parental BWP17 strain carrying the empty vector (BWP17AH-CIp10-PTET-GTW, S4 Table) as a negative control for doxycycline-inducible expression (Control, S10 Figure). Taken together, our transcript profiling data suggested that PGA22 overexpression leads to perturbation of the expression of cell wall genes, consistent with a role of PGA22 in C. albicans cell wall structure and/or function.

Expression of C. albicans PGA22 induces cell cluster formation and affects cell wall structure in a heterologous context
To test whether the Candida-specific PGA22 gene may confer cell-to-cell adhesion or an aggregation phenotype in a heterologous context, we expressed PGA22 in the non-adherent yeast S. cerevisiae using a surface display system [43]. Briefly, a version of PGA22 deleted for the predicted GPI anchor signal was fused to a S. cerevisiae cell wall targeting signal, and constitutively expressed from the TEF1 promoter. S. cerevisiae cells expressing this fusion protein were allowed to adhere to a 24-well polystyrene plate for 1 h, and the biomass was measured with crystal violet staining, after thorough rinsing of the wells. The S. cerevisiae strain transformed with the empty vector was used as a negative control. There was no significant difference in the biomass between the two strains, but examination of the polystyrene surfaces after rinsing showed aggregation of the PGA22-expressing S. cerevisiae strain (Fig. 10A). The cell wall structures of the control and PGA22-expressing strains were then analyzed by TEM. When expressing PGA22, S. cerevisiae exhibited a cell wall with a less dense fibrillar outer layer, reminiscent of the structure observed when overexpressing PGA22 in C. albicans (Fig. 9A and 10B). Thus, excess of PGA22 seemed to cause major structural modifications of the outer cell wall, which may modify cell-to-cell and cell-to-surface adhesion properties.

Inactivation of PGA22 also impacts adherence, biofilm formation and cell wall structure
In order to get further insight on the role of PGA22, we investigated the behavior of a pga22Δ/pga22Δ strain upon adherence to and biofilm formation on Thermanox using an existing deletion mutant (S4 Table). We found that the pga22Δ/pga22Δ strain displayed increased adherence to Thermanox (Fig. 11A), although it was not significantly altered for biofilm formation in the microfermentor system (Fig. 11B). We also tested the effect of deleting PGA22 on competitive biofilm growth (Fig. 11C). We generated pga22Δ/pga22Δ mutants expressing either GFP or mCherry (ΔΔpga22-GFP or ΔΔpga22-mCherry; S4 Table) and mixed each mutant with the parental strain expressing either mCherry or GFP, respectively (BWP17-mCherry or BWP17-GFP; S4 Table), at a 1∶1 ratio, followed by growth for 40 h in the microfermentor to form biofilms. As a control, biofilm growth of a 1∶1 mixture of strains pga22Δ/pga22Δ expressing GFP and mCherry was used. We quantified the relative strain abundance by qPCR using mCherry and GFP as strain identifiers and two independent primer sets for each gene (Fig. 11C, see Materials and Methods for details). We found that the pga22Δ/pga22Δ mutant outcompeted the parental BWP17 strain (Fig. 11C), correlating with its increased adherence on Thermanox (Fig. 11A). Finally, TEM revealed that the cell wall of the pga22Δ/pga22Δ mutant had a thinner outer fibrillar layer as compared to the control strain, while the inner cell wall was unchanged (Fig. 11D). Taken together, these results indicated that lack of PGA22 resulted in an altered cell wall structure that contributed to increased adherence and occupancy of a multi-strain biofilm and that modifying positively or negatively Pga22 levels in the C. albicans cell wall impacted the cell wall structure and function.

Discussion
We designed a screen to identify C. albicans genes that when overexpressed alter planktonic growth fitness or strain abundance in a multi-strain biofilm. Surprisingly, our study showed that over-representation of a C. albicans strain in a multi-strain biofilm did not systematically correlate with an increased biomass in single-strain biofilms. This observation reinforces the notion that cell-to-cell interactions play critical roles in the formation of C. albicans biofilms.
There was a noteworthy enrichment for cell surface-related genes among the overexpressed genes that conferred increased abundance in the multi-strain biofilm. Indeed, ten genes were included in this category, encoding either predicted GPI-anchored proteins (Ihd1/Pga36, Pga15, Pga19, Pga22, Pga32, Pga37, Pga42, Pga59 and Phr2), or a secreted protein of unknown function (Tos1) with similarity to the predicted GPI-anchored protein Pga52 [42], [44]. Notably, the majority (70%) of these proteins are specific to pathogenic Candida species and 5 have orthologs only in C. dubliniensis (Pga15, Pga19, Pga32, Pga37, Pga42; [42], [45]). Overexpression of MSB2 also resulted in increased occupancy of the multi-strain biofilm. Msb2 is a plasma membrane-bound signaling mucin with a heavily glycosylated extracellular domain [46], [47]. Inactivation of MSB2 leads to a defect in biofilm formation [47], consistent with our observation that its overexpression favors biofilm formation. Relatively little is known about the functions of the nine predicted GPI-anchored proteins, and their localization at the cell membrane or in the cell wall has not been fully investigated. One exception is Phr2, a member of the beta-glucanosyltransferase family, which is covalently attached to the cell wall and has a role in cell wall biogenesis at low pH [48] and no described role in biofilm formation. The three remaining genes in the beta-glucanosyltransferase family, namely PGA4/GAS1, PGA5/GAS2, and PHR3 were not tested in this study. Pga59 is a small, abundant, cell wall GPI-anchored protein whose absence negatively impacts on cell wall integrity and hyphal morphogenesis [49]. While the PGA59 gene is highly expressed in biofilms [49], [50], it is not strictly required for biofilm formation under the conditions analyzed to date [49]. Overexpression of PGA62, a paralog of PGA59, also increased C. albicans occupancy of the multi-strain biofilm but to a lower extent than PGA59 overexpression (S3 Table). PGA15, PGA22, PGA37 and PGA42 are members of the Cell Surface-Targets of Adherence Regulators (CSTAR) group of genes [25]. PGA15, PGA41 and PGA42 are members of a C. albicans-specific gene family [44]. Overexpression of PGA41 also showed a tendency for increased C. albicans occupancy of the multi-strain biofilm (S3 Table). Overexpression of the different members of a gene family did not always result in similar phenotypes in the ST-OE screen. For instance, PGA37 and PGA57 are paralogs but only overexpression of PGA37 resulted in increased occupancy of the multi-strain biofilm under the conditions tested (S3 Table). We found that many of the genes identified in our screen were upregulated at/in different steps and/or models of biofilm development, including PHR2 [51], TOS1 [34], [52], MSB2, PGA32, PGA22, BEM2, IHD1 and PGA37 [34]. For instance, PHR2 appears induced during late steps of biofilm development (i.e. mature biofilms) [51], whereas TOS1 appears induced during early events [52].
The behavior of the overexpression strains for these ten cell surface-related genes in single-strain biofilms did not follow a general pattern. Overexpression of some genes (eg PGA59 and IHD1) resulted in increased adherence and an increased or unchanged biofilm biomass. In contrast, overexpression of other genes had a negative impact on adherence and no impact on biofilm formation (PGA19, PGA32 and PGA37), a positive impact on adherence and a negative impact on biofilm formation (PGA15, PGA22) or no discernible impact (PGA42, PHR2 and TOS1). Taken together, these results suggest that the ability of C. albicans strains to adhere to the biofilm substratum is not the only defining component of biofilm development. In addition, the discrepancies observed when testing single-strain biofilm formation and strain occupancy in a multi-strain biofilm indicate that the environment provided by a multi-strain biofilm may favor biofilm occupancy by a strain otherwise defective for single-strain biofilm formation. This is illustrated by the PGA22-overexpression strain that had increased adherence, but adhered cells were more sensitive to shear forces, due to cell-to-cell clustering, thus delaying the emergence of a single-strain biofilm. Such sensitivity to shear forces was not observed when this strain formed a biofilm in combination with one or several other C. albicans strains that expressed PGA22 at normal levels. Hence the presence of wild type cells may protect the PGA22-overexpression strain from the deleterious effects of shear forces. Cooperativeness between strains that express cell surface proteins to different levels has already been observed. Indeed, Nobile et al. [15] have shown that hwp1 and als1als3 knockout mutants are individually defective in biofilm formation. Yet, the combination of these mutant strains results in the formation of an intact multi-strain biofilm. This suggested that Hwp1 interacts with Als1 and Als3 in order to ensure efficient biofilm formation. Here, we did not identify any functional link between the predicted cell surface proteins studied, but our results indicate that they may participate in cell-to-substrate and cell-to-cell interactions, with different impacts on biofilm formation.
It is currently unknown how PGA22 precisely confers increased cell-to-cell and cell-to-substrate adhesion. We observed that overexpression of PGA22 in either C. albicans or S. cerevisiae had a significant impact on the cell wall structure of both species and caused cell aggregation (Fig. 7 and 10), suggesting that the Pga22 protein might have a more direct effect on the cell wall structure. Our AFM experiments indicated a clustered repartition of the adhesion events on the cell surface of the C. albicans cells overexpressing PGA22, not seen with PGA59. This may indicate the presence of Pga22-enriched cell surface domains and explain the alteration of cell wall structure in both C. albicans and S. cerevisiae. Our genome-wide transcript profiling data also showed that PGA22 overexpression triggered alterations in the expression of cell wall genes, including putative adhesins (e.g. FGR41, and PGA38) or chitin synthesis and remodeling genes (CHS1 and CHT3) that may participate in conferring the adhesion phenotype or be a consequence of altering the cell wall structure and/or function by Pga22 overproduction (Table 3, S5 Table, S10 Figure). PGA22 overexpression also correlated with downregulation of mannosyltransferase-encoding genes (MNN12, MNT1, KTR4 and RHD1, S5 Table) as well as genes associated with mannosyltransferase activity and wall maintenance (VRG4, SMF12, SKN1, S5 Table), which may impact on the production of mannoproteins at the external layer of the cell wall as well as affect the overall wall structure and composition. Consistently, TEM analyses revealed that the PGA22-overexpressing strain had an altered mannoprotein-rich outer fibrillar layer (Fig. 9). Our preliminary results also showed that overexpression of PGA22 reduced the cell wall protein content and decreased Concanavalin A staining, indicative of reduced mannoprotein abundance. On the other hand, both overexpression and deletion of PGA22 cause increased adherence and increased biofilm formation under competitive growth with a wild-type strain (Fig. 4 and S7 Figure). It is possible that cells compensate for PGA22 absence by producing other adhesion proteins. Previous studies have reported cases where a gene deletion phenocopied the overexpresser. For instance both deletion and overexpression of α-1,2-mannosyltransferases similarly altered cell wall integrity in Mycobacterium smegmatis and Mycobacterium tuberculosis [53]. Both overexpression and deletion of SFL1, encoding a transcription factor that controls the yeast-to-hyphae transition, attenuated virulence of C. albicans in a mouse model of systemic infection [54]. Clearly, more studies are needed for a better understanding of the complexity of PGA22 function during C. albicans biofilm development. Further experiments will also be needed in order to understand the basis for the changes in adherence and biofilm formation of overexpression strains for other cell wall genes identified in this study. These changes may reflect subtle modifications in the physical properties of their cell walls, including altered charge and hydrophobicity and compensatory changes in the cell wall proteome, as well as modification of the extracellular matrix.
Our overexpression screen uses the conditional overexpression system pNIM1 [30], [62] that has the advantage of inducing gene expression under tightly controlled conditions and bypassing the effect of any mutation (e.g. acquired during C. albicans transformation) that could interfere with the phenotype. In addition, our validation experiments were performed using independently-generated overexpression strains carrying the alternative doxycycline-inducible overexpression system pNIMX that allows for higher overexpression levels to be achieved [30]. Some limitations of our system include possible doxycycline-dependent effects on the observed phenotypes, even if low concentrations of doxycycline (in the range of 40-50 µg/ml) were used. We provide some data arguing against doxycycline interference with both gene expression (S10 Figure; Control) and phenotype (S9 Figure; Vector-only control). Biofilms are also notorious for their ability to exclude small molecules, such as antifungal agents and antibiotics, and it is possible that doxycycline does not reach deep areas within the mature biofilm. Our biofilm development model relies on a continuous supply of the growth medium with doxycycline, suggesting that at least cells that adhere to or are located within the external surface of the biofilm are constantly exposed to doxycycline. Furthermore, strains overproducing Pga22 express high levels of PGA22 even after 16 h of exposure to doxycycline (S10 Figure) indicating that doxycycline promoter-driven transcripts are sustained over a long period of time.
Overexpression of several C. albicans genes has previously been shown to affect biofilm formation. For instance, overexpression of ADH5, GCA1, and GCA2 promoted matrix production, while overexpression of CSH1 and IFD6 inhibited it [23] and PES1 overexpression increased the dispersal step [55]. These genes were not included in our overexpression collection. Other genes, with known biofilm phenotypes when overexpressed, were included in our collection e.g. NRG1, UME6 and GAT2/BRG1. Overexpression of NRG1 repressed morphogenesis and resulted in the formation of yeast-only biofilms [56]. Overexpression of UME6 and GAT2/BRG1 triggered hyphal formation independently of the presence of hypha-inducing cues [32] and resulted in the formation of hyperfilamentous biofilms and increased biofilm biomass, respectively [32], [56], [57]. Despite these previous findings the NRG1-, UME6- and GAT2/BRG1-overexpression strains did not display altered occupancy in our multi-strain biofilm model. This reinforces the notion that the behavior of individual strains in a multi-strain biofilm cannot be directly predicted from their behavior in a single-strain biofilm model. In fact, the majority of the genes identified through the ST-OE biofilm screen did not have an impact on morphogenesis when overexpressed (S2B Figure), although this process is of central importance to biofilm formation [8]. Our unpublished data showed that only overexpression of ORF19.3459/MCK1 resulted in a filamentation phenotype at 37°C (but not 30°C) in media that do not normally promote hyphal growth. Thus, this strain might show normal adherence but increased hyphal growth and representation in a biofilm. In addition, overexpression of two cell polarity genes CDC24 and BEM2 [58] resulted in increased representation in the multi-strain biofilm although the underlying mechanism remains to be investigated.
We found that overexpression of four genes involved in the regulation of cell-cycle progression and the DNA-damage response, namely RAD53, RAD51, PIN4 and ORF19.2781, and one gene known for its role in the regulation of C. albicans morphogenesis (SFL2), resulted in decreased fitness upon planktonic growth with doubling times increasing by 3-27% when strains were grown individually (Fig. 2B). Our results are consistent with the S. cerevisiae phenotypes associated with overexpression of the orthologs of these five genes [27], [59]. One observation that emerges from our study is the low number of C. albicans genes that when overexpressed resulted in decreased fitness (5/531; 1%). This contrasts with the observation of Douglas et al. [59] who used a similar setting (growth of a pool of ∼5,100 barcoded PGAL4-dependent S. cerevisiae overexpression strains) and identified 361 (7.1%) strains with decreased fitness after 20 generations under inducing conditions. This may reflect a weaker level of overexpression from the PTET promoter used in our study. Indeed, when using a modified transactivation system that induces higher expression from the PTET promoter (pNIMX, [30]) and a collection of 257 overexpression strains for genes largely overlapping those analyzed here, 18 strains (7.0%) were identified with a fitness defect, including those overexpressing RAD53 and SFL2 [30]. A second interesting observation is the lack of genes whose overexpression conferred increased fitness. This was also the case when higher levels of expression were driven from the pNIMX system (S. Znaidi and C. d'Enfert, unpublished) and in the study of ∼5,100 S. cerevisiae overexpression strains [59]. It is likely that use of a relatively rich medium provided optimal growth conditions and therefore limited discriminatory capacity for increased fitness. Our approach also identified four genes, namely ASH1, ORF19.2781, PRR2 and STB5 whose overexpression led through unexplored mechanisms to under-representation of the corresponding strains in a multi-strain biofilm (Fig. 3, Table 1). It is notable that among these genes, only ORF19.2781 resulted in a lower fitness when overexpressed in planktonic culture, suggesting that fitness determinants may differ depending on growth conditions.
In conclusion, our results illustrate the power of using signature tagging in conjunction with gene overexpression for the identification of genes involved in biofilm formation and more general processes pertaining to C. albicans virulence. This warrants our current development of a genome-wide collection of C. albicans overexpression strains [60]. Moreover, our results reveal how targeted changes in the cell wall proteome differentially alter C. albicans ability to form single - and multi-strain biofilms, re-emphasizing the importance of the cell wall and cell-cell interactions in C. albicans pathobiology.
Materials and Methods
C. albicans strains
C. albicans overexpression strains used in this study have been derived from 294 barcoded integrative overexpression plasmids described previously [30], as well as 237 novel barcoded plasmids for overexpression of transcription factors and signaling components (90), cell wall-related proteins (61) and genes involved in DNA replication, recombination and repair (86; see S1 Table for a list of all ORFs included, primers used for their amplification and corresponding barcodes). Briefly, for this latter set of 237 plasmids, the respective ORFs were PCR amplified using chimeric primers followed by recombination-mediated transfer into the Gateway donor vector pDONR207 [30], [61]. The set of pDONR207 derivatives was fully sequenced to ascertain that no unintended mutations were introduced during PCR amplification. The pDONR207-ORF plasmids were then used in a Gateway LR reaction together with barcoded derivatives of the CIp10-PTET-GTW vector [30], carrying a TET promoter (PTET, [62]). All barcoded overexpression vectors were linearized with StuI and used to transform either CEC1121, a derivative of SN148 [63] (S4 Table), or CEC1429, a derivative of CAI4 [64] (S4 Table), both strains harbor the pNIM1 plasmid [62] for doxycycline-regulated expression from the PTET promoter. Transformants were selected and checked as described yielding 531 overexpression strains [61]. Selected overexpression plasmids were also used to transform strains CEC3783 or CEC3781 carrying the pNIMX plasmid (S4 Table; [30]) for doxycycline-regulated expression from the PTET promoter and either a PTDH3-BFP or PTDH3-GFP gene fusion for constitutive expression of BFP or GFP, respectively. Constructs with GFP and BFP were integrated between PGA59 and PGA62. PTET was induced with 50 µg.mL−1 of doxycycline in all experiments.
The C. albicans ΔΔpga22 loss-of-function mutant was generated in BWP17 [65] by successive replacement of the complete ORF in the two alleles using PCR-generated disruption cassettes flanked by 100 bp of target homology region as previously described [66]. The disruption cassettes were amplified using oligonucleotides 3738J5DR and 3738J3DR described in S6 Table and ARG4- or HIS1-bearing plasmids. The resulting transformants were verified by PCR and one clone was selected for subsequent transformation with plasmid CIp10 [67] yielding the prototrophic ΔΔpga22 mutant (S4 Table). Alternatively, the selected clone was transformed with CIp10 derivatives harboring either the GFP gene placed under the control of the C. albicans TDH3 promoter or the mCherry gene placed under the control of the C. albicans ADH1 promoter, yielding strains ΔΔpga22-GFP and ΔΔpga22-mCherry, respectively.
Preparation of strain pools
The 531 signature-tagged overexpression strains were thawed on Nunc omnitray plates (Thermo Scientific) containing YPD (1% Yeast Extract, 2% Bacto-Peptone, 2% D-glucose)-agar using a 96 pin replicator and allowed to grow for 6 days at 30°C. No significant colony size alterations were recorded. 10 mL of YPD were added to each plate and colonies were scraped off using a cell spreader. Strains were pooled in ∼100 mL YPD/15% glycerol at a concentration of ∼57 OD600 (optical density at 600 nm) units.mL−1, aliquoted in 2-mL tubes and frozen at −80°C.
Planktonic fitness assay
The overexpression strain pool was grown at 30°C with agitation (200 rpm) for 16 generations in GHAUM medium, a synthetic defined medium (0.67% Yeast Nitrogen Base, 2% D-glucose) supplemented with histidine, arginine, uridine and methionine (at final concentrations of 1 mg.mL−1, 1 mg.mL−1, 0.02 mg.mL−1 and 2 mg.mL−1, respectively), in the absence or presence of 50 µg.mL−1 doxycycline. Genomic DNA was extracted as described for S. cerevisiae in Rose et al. [68] from strain pools, followed by PCR-amplification of the barcodes using primers CipSAC2-UP-2 and CipSAC2-DWN-2 (3 min at 94°C; followed by 35 cycles of 30 sec at 94°C, 30 sec at 50°C, and 30 sec at 72°C; and a final step of 7 min at 72°C) (see S6 Table for primers used in this study). The PCR products were then subjected to indirect differential fluorescent dye labeling (Cy5 for Dox-treated, Cy3 for untreated pools). Labeled DNA was resuspended in 50 µL DigEasy Hyb solution (Roche), incubated at 95°C for 5 min, snap-cooled on ice and directly deposited on a barcode microarray (Agilent Technologies, GEO platform # GPL17420) containing: i) ∼12 on-chip replicates of both sense and antisense DNA sequences complementary to 657 tags (representing 531 strain tags +126 unused tags) and ii) different negative control spots (Agilent reference). Hybridization was performed overnight at 25°C, followed by washing and scanning of the arrays using GenePix 4200 AL scanner (Molecular Devices). This experiment was repeated twice independently. Microarray data were analyzed using two distinct data processing softwares: GeneSpring GX 11 (Agilent Technologies) and ArrayPipe v2.0 [69]. Z-score (i.e. number of standard deviations from the population mean) calculations were performed using ArrayPipe v2.0. The thresholds for GeneSpring were kept at Fold Change values equal or superior to 2 and p-values equal or inferior to 0.05, while thresholds for ArrayPipe v2.0 were absolute Z-score values equal or above 1.5 and p-values equal or below 0.05. Only strains that met both algorithm thresholds for both sense and antisense barcode fluorescence signals were kept as altering planktonic growth. Microarray data have been deposited at GEO under accession number GSE48647 and Z-score and fold-change data are available in S2 Table.
Confirmation of the microarray fitness data by liquid growth assay
Strains were individually grown three-times independently in 96-well plates at a starting optical density (OD600) of 0.1 in 100 µL of YPD supplemented with or without 50 µg.mL−1 doxycycline. The OD600 was measured every 5 min using a Tecan Infinite 200 reader. Tecan OD600 readings were converted into “flask OD600” reading using the following formula: ODFlask = ODTecan ×12.2716–1.0543 [70] and doubling times were calculated within the exponential growth interval as previously described [71].
Biofilm formation in a continuous-flow fermentor system
The inoculum was prepared from an early-stationary-phase culture of either the pool of overexpression strains, a combination of two equally represented strains or individual strains grown in flasks at 30°C in an orbital shaker. Cells were grown in GHAUM medium with or without 50 µg.mL−1 doxycycline, each inoculum was then diluted to an OD600 of 1 in fresh GHAUM medium with or without 50 µg.mL−1 doxycycline and left at room temperature for 30 min, to allow further overexpression. Plastic slides (Thermanox; Nunc) were immersed in the inoculum for 30 min at room temperature to allow adherence of cells to the plastic substrate. The plastic slides were then transferred to the glass vessel of a 40-mL incubation chamber [50]. This vessel has two glass tubes inserted to drive the entry of medium and air, while used medium is evacuated through a third tube. The flow of GHAUM medium is controlled by a recirculation pump (Ismatec) set at 0.6 mL.min−1 and pushed by pressured air supplied at 105 Pa, conditions minimizing planktonic phase growth and promoting biofilm formation. The chambers with the plastic substrate were incubated at 37°C and biofilms (8 independent biological replicates) were grown for 40 h followed by genomic DNA extraction, barcode amplification and differential labeling (Dox-treated samples with Cy5, untreated samples with Cy3) and hybridization to barcode microarrays as described above. We performed two independent analyses of our microarray data using the Arraypipe [69] or GeneSpring softwares. Arraypipe analyses identified 29 genes with absolute Z-score values above or equal to 1.5, fold change above or equal to 2, and p value below or equal to 0.05 (Fig. 3, Table 1, S3 Table), while GeneSpring analyses identified 21 genes when the last two selection criteria described above were used (Table 1 and S3 Table). Microarray data have been deposited at GEO under accession number GSE48647.
Quantification of strains in mixed biofilms using quantitative PCR
Mixed biofilms with two strains expressing either the BFP or the GFP genes under the control of the PTDH3 promoter were grown for 40 h as described above. Plastic substrates were then recovered and immersed in 25 mL of PBS. Biofilms were detached from the plastic substrates by vortexing twice for 15 sec, and collected by centrifugation. Genomic DNA was extracted using MasterPure Yeast DNA Purification Kit (Epicentre), and quantified using a NanoVue Plus (GEHealthcare Life Sciences); all samples were adjusted to a DNA concentration of 100 ng.µL−1. 10 ng.µL−1 and 1 ng.µL−1 dilutions were used as templates for quantitative PCR (qPCR), with the following protocol: 0.2 µM of each primer was added to SYBR Green (Invitrogen) and 5 µL of DNA, in a total reaction volume of 25 µL; qPCR was performed as follow: 3 min at 94°C, followed by 35 cycles of 30 sec at 94°C, 30 sec at 58°C, and 30 sec at 72°C, and a final step of 7 min at 72°C. Each sample was tested for amplification within the BFP and GFP coding regions (using the primers BFPpFwd and BFPpRev, and GFPpFwd and GFPpRev respectively; S6 Table). The resulting Ct value of each amplification was analyzed in order to assess the ratio between the GFP - and BFP-strains within the biofilm, in the induced (with Dox) and non-induced (without Dox) samples. Six replicates for each strain were analyzed through a Student's t-test. For competitive growth of the ΔΔpga22 mutant versus the parental BWP17 strain, two independent sets of primers for mCherry (primers 1, mCherry2-FWD and mCherry2-REV; primers 2, mCherry-FWD and mCherry-REV) and GFP (primers 1, GFPpFwd and GFPpRev; primers 2, GFP.RT.fw and GFP.RT.rv) were used (S6 Table) and two independent experiments were averaged. The TEF3 gene was used as a calibrator and the ACT1 gene was used as a control (primers ACT1-FWD and ACT1-REV, S6 Table).
Biofilm dry weight measurement
Biofilms were grown and recovered from the substrate after 18, 24, 40, 48 and 65 h of growth as described above. The PBS solution containing the detached biofilm was vacuum-filtered through a 1.2 µm filter (Millipore); the filter was dried at 60–65°C for 2–3 days and then weighed on a precision scale (Mettler AE200; Mettler Toledo) to obtain the dry mass of the biofilm. A minimum of 3 replicates were analyzed through a Student's t-test.
Adherence
After adherence as described above, the plastic substrates were washed three times in PBS to remove non-adherent cells, and mounted on a glass slide for observation with a Leica DM RXA microscope, using an objective at 10× magnification or an oil-immersed objective at 40× magnification. Pictures of the substrates were taken and 15 fields were counted for each strain per condition (presence or absence of doxycycline), except for the strains overexpressing PGA42, TOS1 and PHR2, with 10 fields each. The replicate measurements were analyzed through a Student's t-test. The same test was performed for the ΔΔpga22 knockout strain, without doxycycline, and the results were compared to the wild-type strain SC5314. Pictures of the substrates were taken and 20 fields were counted for each strain.
Atomic Force Microscopy (AFM) analysis of cell surface adhesion
10 mL of YPD (1% Yeast Extract, 2% Bacto-Peptone, 2% D-glucose) liquid medium were inoculated with PGA22-overexpression strain, PGA59-overexpression strain, and the control strain with empty plasmid (CEC3785), and incubated ON at 30°C, in an orbital shaker (180 rpm). A 10 µL aliquot of each culture was then diluted to 10 mL in fresh YPD medium with or without 50 µg.mL−1 doxycycline, and allowed to grow for 16 hours to allow overexpression of the targeted protein. 5 mL of the cell culture were then quickly centrifuged, washed with 5 mL of acetate buffer (18 mM CH3COONa, 1 mM CaCl2 and 1 mM MnCl2, pH 5.2) and resuspended in 3 mL of the same buffer. 100 µL of this cell suspension were deposited on a freshly oxygen-activated microstructured PolyDiMethylSiloxane (PDMS) stamp. Cells were immobilized in the PDMS stamps as described elsewhere [72], and immersed in the same acetate buffer. To get statistical significance of the AFM data, about 10–15 cells have been analyzed from three independent experiments for each strain. AFM experiments were conducted on a Nanowizard III from JPK Instruments (Berlin, Germany). We used MLCT probes from Bruker probes with a spring constant of 0.02 N.m−1 +/−10% measured before each experiment by the thermal noise method. Adhesion force maps were recorded in force volume mode (32×32 or 64×64 force curves). The maximum applied force has been set to 2 nN, the Z displacement to 2 µm and the retract time to 50 ms (with a loading rate of 800,000 pN.s−1). Force curves were analyzed using JPK data processing software to extract the maximum adhesion force on each force curve.
Adherence and washing step in the continuous-flow fermentor system
Following adherence, the plastic substrates were introduced in the continuous-flow fermentor system for 2 h, and then observed under the microscope. 30 fields for each condition (presence or absence of doxycycline) were photographed. The cells that were released and washed away during these 2 h under the continuous-flow conditions were also collected, pelleted and resuspended in 1 mL of PBS, 400 µL of which were counted on a MACS Quant (Mylteni Biotec). Student's t-tests were performed.
Confocal microscopy fluorescence images and quantification
Mixed biofilms with two strains expressing either the BFP or the GFP genes under the control of the PTDH3 promoter were grown for 40 h as described above. Confocal microscopy was then performed on the recovered plastic substrates, using a Zeiss LSM 700 laser scanning confocal microscope on an upright Axio Imager Z2 stand, using a Zeiss W-nACHROPLAN 40X/0.75 working distance 2.1 mm objective; z-stacks of the biofilms were obtained using the blue and green lasers, for the whole biofilm thickness. Z-stacks were then analyzed using Volocity software to acquire the volume occupied by the cells in the green channel (overexpression mutant, expressing GFP) and by the cells in the blue channel (control strain, expressing BFP).
High-pressure freezing (HPF)-transmission electron microscopy (TEM)
Overexpression strains were grown overnight in YPD in the presence or absence of 50 µg.mL−1 doxycycline. S. cerevisiae strains were grown overnight at 30°C in liquid YNB N5000 medium (0.17% YNB w/o AA w/o ammonium sulfate; 1% Glc; 0.5% Ammonium sulfate) supplemented with leucine, histidine and lysine at a final concentration of 0.1 mg.mL−1. Samples were prepared by high-pressure freezing with an EMPACT2 high-pressure freezer and rapid transport system (Leica Microsystems Ltd., Milton Keynes, United Kingdom). After freezing, cells were freeze-substituted in substitution reagent (1% [wt/vol] OsO4 in acetone) with a Leica EMAFS2. Samples were then embedded in Spurr resin and additional infiltration was provided under a vacuum at 60°C before embedding in Leica FSP specimen containers and polymerizing at 60°C for 48 h. Semithin survey sections, 0.5 µm thick, were stained with 1% toluidine blue to identify areas containing cells. Ultrathin sections (60 nm) were prepared with a Diatome diamond knife on a Leica UC6 ultramicrotome and stained with uranyl acetate and lead citrate for examination with a Philips CM10 transmission microscope (FEI UK Ltd., Cambridge, United Kingdom) and imaging with a Gatan Bioscan 792 (Gatan United Kingdom, Abingdon, United Kingdom). The thicknesses of the inner and outer layers of the cell wall were measured using Image J and by averaging 30 measurements for each cell (n = 30 cells). Analyses were performed using Student's t-tests.
Total RNA extraction, expression microarray analyses and qRT-PCR assays
PGA22 overexpression strain was grown three times independently in YPD medium supplemented or not with 50 µg.mL−1 doxycycline during 16 h. Total RNA was extracted using the hot phenol method as described previously [36], followed by first-strand cDNA synthesis and Cy5 (doxycycline-treated samples)/Cy3 (untreated samples) labeling from 20 µg total RNA, using the Superscript III indirect cDNA labeling system (Invitrogen). Purified labeled samples were mixed and hybridized to a C. albicans expression array (Agilent Technologies) designed such that two nonoverlapping probe sets target each of 6,105 C. albicans ORFs for a total of 15,744 probes, thereby allowing two independent measurements of the mRNA level for a given gene [36]. Hybridization was performed as described elsewhere [36]. Images of Cy5 and Cy3 fluorescence were generated by scanning the expression arrays using an Axon Autoloader 4200AL scanner (Molecular Devices, Downington, PA). Images were subsequently analyzed with the GenePix Pro 6.1.0.2 software (Molecular Devices, Downington, PA). GenePix Results (GPR) files were imported into the Arraypipe 2.0 for spot filtering, background subtraction (limma normexp BG correction) and Lowess global normalization of signal intensities [73]. Replicate arrays (n = 3) were combined and fold-change and P-values (standard Student's t-test) were calculated.
For RT-qPCR analyses, the strain CEC3785 (S4 Table) was grown exactly as described above and used as a negative control for doxycycline treatment. Total RNA from both the PGA22 overexpression - and control strains was extracted using the hot phenol method [36] and reverse transcription (RT) was performed using the SuperScript III first-strand synthesis system using 5 µg of total RNA (Invitrogen, catalog # 18080-051) in a total reaction volume of 20 µL. The qPCR reaction was made of 1 µL from the RT reaction mixture combined with 4 µL of primer mix at 10 pmol.µL−1 each (forward and reverse primers of the selected genes, S6 Table), 10 µL of 2X Takyon Rox SYBR MasterMix dTTP Blue (Eurogentec) and 5 µL of H2O (total volume = 20 µL). Q-PCRs were performed in a MicroAmp Optical 96-Well Reaction Plate (Applied Biosystems) using an Eppendorf realplex4 Mastercycler real-time PCR instrument (Eppendorf) with 1 cycle at 50°C for 2 min, 1 cycle at 95°C for 10 min and 50 cycles at 95°C for 15 sec and 58°C for 1 min. Data analysis was performed using the realplex software version 2.2 (Eppendorf). For each experiment, threshold cycle (CT) values were determined using the realplex software. The levels of relative gene expression (n-fold) for the doxycycline-treated samples as compared to the untreated controls of PGA22, ORF19.5267, FGR41, RBE1, CHT3, CHS1 and the ACT1 negative control gene were calculated using the 2−ΔΔCT method, as follows: ΔCT = CT(selected gene) − CT(TEF3 reference gene) and ΔΔCT = ΔCT(doxycycline-treated sample) − ΔCT(untreated control). The ACT1 gene was used as a negative control. Three independent experiments were performed on different days using 2 biological replicates each time (assumed as n = 6). A two-tailed Student's t-test was applied by comparing the doxycycline-treated set to the untreated set. Statistical significance is set as P≤0.05.
Expression of C. albicans PGA22 in S. cerevisiae
PGA22 was amplified from SC5314 genomic DNA using PGA22-GTW-fwd and PGA22ΔCter-rev as primers, and recombined into the Gateway donor vector pDONR207 (see above). The resulting plasmid was sequenced, prior to being transferred into S. cerevisiae Gateway destination vector pBC542 [43]. Briefly, this centromeric plasmid bears the TEF promoter, a Gateway cassette flanked by an inframe HA tag, followed by an inframe S. cerevisiae GPI anchor sequence. The pBC542/CaPGA22 plasmid was used to transform S. cerevisiae BY4742, and the resulting strain was tested in an adherence assay as described in Monniot et al [74]. After rinsing, the cells adhered to the 24-well plates were imaged with a Leica M80 stereomicroscope and a Leica DMI6000 inverted microscope, using a HC PLAN APOx20/0.70 objective.
Supporting Information
Zdroje
1. CalderoneR, FonziW (2001) Virulence factors of Candida albicans. Trends Microbiol 9 : 327–335.
2. Cuellar-CruzM, Lopez-RomeroE, Villagomez-CastroJC, Ruiz-BacaE (2012) Candida species: new insights into biofilm formation. Future Microbiol 7 : 755–771.
3. FinkelJ, MitchellA (2011) Genetic control of Candida albicans biofilm development. Nature Rev Microbiol 9 : 109–118.
4. HarriottM, NoverrM (2011) Importance of Candida-bacterial polymicrobial biofilms in disease. Trends Microbiol 19 : 557–563.
5. MayerFL, WilsonD, HubeB (2013) Candida albicans pathogenicity mechanisms. Virulence 4 : 119–128.
6. RamageG, RajendranR, SherryL, WilliamsC (2012) Fungal biofilm resistance. Int J Microbiol 2012 : 528521.
7. MatheL, Van DijckP (2013) Recent insights into Candida albicans biofilm resistance mechanisms. Current Genet 59 : 251–264.
8. BaillieG, DouglasL (1999) Role of dimorphism in the development of Candida albicans biofilms. J Med Microbiol 48 : 671–679.
9. RamageG, VandeWalleK, López-RibotJ, WickesB (2002) The filamentation pathway controlled by the Efg1 regulator protein is required for normal biofilm formation and development in Candida albicans. FEMS Microbiol Lett 214 : 95–100.
10. RichardM, NobileC, BrunoV, MitchellAP (2005) Candida albicans biofilm-defective mutants. Eukaryot Cell 4 : 1493–1502.
11. BonhommeJ, d'EnfertC (2013) Candida albicans biofilms: building a heterogeneous, drug-tolerant environment. Curr Op Microbiol 16 : 398–403.
12. NobileC, MitchellA (2005) Regulation of cell-surface genes and biofilm formation by the C. albicans transcription factor Bcr1p. Current Biol 15 : 1150–1155.
13. NobileC, AndesD, NettJ, SmithF, YueF, et al. (2006) Critical role of Bcr1-dependent adhesins in C. albicans biofilm formation in vitro and in vivo. PLoS Path 2: e63.
14. NobileC, NettJ, AndesD, MitchellA (2006) Function of Candida albicans adhesin Hwp1 in biofilm formation. Eukaryot Cell 5 : 1604–1610.
15. NobileC, SchneiderH, NettJ, SheppardD, FillerS, et al. (2008) Complementary adhesin function in C. albicans biofilm formation. Current Biol 18 : 1017–1024.
16. PérezA, PedrósB, MurguiA, CasanovaM, López-RibotJ, et al. (2006) Biofilm formation by Candida albicans mutants for genes coding fungal proteins exhibiting the eight-cysteine-containing CFEM domain. FEMS Yeast Res 6 : 1074–1084.
17. LiF, PalecekS (2003) EAP1, a Candida albicans gene involved in binding human epithelial cells. Eukaryot Cell 2 : 1266–1273.
18. HashashR, YounesS, BahnanW, El KoussaJ, MaaloufK, et al. (2011) Characterisation of Pga1, a putative Candida albicans cell wall protein necessary for proper adhesion and biofilm formation. Mycoses 54 : 491–500.
19. KapteynJ, HoyerL, HechtJ, MüllerW, AndelA, et al. (2000) The cell wall architecture of Candida albicans wild-type cells and cell wall-defective mutants. Mol Microbiol 35 : 601–611.
20. GrangerB, FlennikenM, DavisD, MitchellA, CutlerJ (2005) Yeast wall protein 1 of Candida albicans. Microbiology 151 : 1631–1644.
21. LaforetL, MorenoI, Sánchez-FresnedaR, Martínez-EsparzaM, MartínezJ, et al. (2011) Pga26 mediates filamentation and biofilm formation and is required for virulence in Candida albicans. FEMS Yeast Res 11 : 389–397.
22. BonhommeJ, ChauvelM, GoyardS, RouxP, RossignolT, et al. (2011) Contribution of the glycolytic flux and hypoxia adaptation to efficient biofilm formation by Candida albicans. Mol Microbiol 80 : 995–1013.
23. NobileC, NettJ, HerndayA, HomannO, DeneaultJ-S, et al. (2009) Biofilm matrix regulation by Candida albicans Zap1. PLoS Biol 7: e1000133.
24. TaffH, NettJ, ZarnowskiR, RossK, SanchezH, et al. (2012) A Candida biofilm-induced pathway for matrix glucan delivery: implications for drug resistance. PLoS Path 8: e1002848.
25. FinkelJ, XuW, HuangD, HillE, DesaiJ, et al. (2012) Portrait of Candida albicans adherence regulators. PLoS Path 8: e1002525.
26. PrelichG (2012) Gene overexpression: uses, mechanisms, and interpretation. Genetics 190 : 841–854.
27. SopkoR, HuangD, PrestonN, ChuaG, PappB, et al. (2006) Mapping pathways and phenotypes by systematic gene overexpression. Mol Cell 21 : 319–330.
28. ChuaG, MorrisQ, SopkoR, RobinsonM, RyanO, et al. (2006) Identifying transcription factor functions and targets by phenotypic activation. Proc Natl Acad Sci USA 103 : 12045–12050.
29. FuY, LuoG, SpellbergB, EdwardsJ, IbrahimA (2008) Gene overexpression/suppression analysis of candidate virulence factors of Candida albicans. Eukaryot Cell 7 : 483–492.
30. ChauvelM, NesseirA, CabralV, ZnaidiS, GoyardS, et al. (2012) A versatile overexpression strategy in the pathogenic yeast Candida albicans: Identification of regulators of morphogenesis and fitness. PloS One 7: e45912.
31. SahniN, YiS, DanielsKJ, HuangG, SrikanthaT, et al. (2010) Tec1 mediates the pheromone response of the white phenotype of Candida albicans: insights into the evolution of new signal transduction pathways. PLoS Biol 8: e1000363.
32. DuH, GuanG, XieJ, SunY, TongY, et al. (2012) Roles of Candida albicans Gat2, a GATA-type zinc finger transcription factor, in biofilm formation, filamentous growth and virulence. PloS One 7: e29707.
33. Ramirez-ZavalaB, WeylerM, GildorT, SchmauchC, KornitzerD, et al. (2013) Activation of the Cph1-Dependent MAP Kinase Signaling Pathway Induces White-Opaque Switching in Candida albicans. PLoS Path 9: e1003696.
34. NobileC, FoxE, NettJ, SorrellsT, MitrovichQ, et al. (2012) A recently evolved transcriptional network controls biofilm development in Candida albicans. Cell 148 : 126–138.
35. SpieringMJ, MoranGP, ChauvelM, MaccallumDM, HigginsJ, et al. (2010) Comparative transcript profiling of Candida albicans and Candida dubliniensis identifies SFL2, a C. albicans gene required for virulence in a reconstituted epithelial infection model. Eukaryot Cell 9 : 251–265.
36. ZnaidiS, NesseirA, ChauvelM, RossignolT, d'EnfertC (2013) A comprehensive functional portrait of two heat shock factor-type transcriptional regulators involved in Candida albicans morphogenesis and virulence. PLoS Path 9: e1003519.
37. SongW, WangH, ChenJ (2011) Candida albicans Sfl2, a temperature-induced transcriptional regulator, is required for virulence in a murine gastrointestinal infection model. FEMS Yeast Res 11 : 209–222.
38. ArnaudMB, CostanzoMC, ShahP, SkrzypekMS, SherlockG (2009) Gene Ontology and the annotation of pathogen genomes: the case of Candida albicans. Trends Microbiol 17 : 295–303.
39. InglisDO, SkrzypekMS, ArnaudMB, BinkleyJ, ShahP, et al. (2013) Improved gene ontology annotation for biofilm formation, filamentous growth, and phenotypic switching in Candida albicans. Eukaryot Cell 12 : 101–108.
40. BoyleEI, WengS, GollubJ, JinH, BotsteinD, et al. (2004) GO: TermFinder—open source software for accessing Gene Ontology information and finding significantly enriched Gene Ontology terms associated with a list of genes. Bioinformatics 20 : 3710–3715.
41. KlisFM, SosinskaGJ, de GrootPW, BrulS (2009) Covalently linked cell wall proteins of Candida albicans and their role in fitness and virulence. FEMS Yeast Res 9 : 1013–1028.
42. Munro CA, Richard ML (2012) The cell wall: glycoproteins, remodeling, and regulation. In: Calderone RA, Clancy CJ, editors. Candida and candidiasis, 2nd edition. Washington DC: ASM Press. pp.197–223.
43. ZupancicML, FriemanM, SmithD, AlvarezRA, CummingsRD, et al. (2008) Glycan microarray analysis of Candida glabrata adhesin ligand specificity. Mol Microbiol 68 : 547–559.
44. RichardML, PlaineA (2007) Comprehensive analysis of glycosylphosphatidylinositol-anchored proteins in Candida albicans. Eukaryot Cell 6 : 119–133.
45. ButlerG, RasmussenMD, LinMF, SantosMA, SakthikumarS, et al. (2009) Evolution of pathogenicity and sexual reproduction in eight Candida genomes. Nature 459 : 657–662.
46. RomanE, CottierF, ErnstJF, PlaJ (2009) Msb2 signaling mucin controls activation of Cek1 mitogen-activated protein kinase in Candida albicans. Eukaryot Cell 8 : 1235–1249.
47. PuriS, KumarR, ChadhaS, TatiS, ContiHR, et al. (2012) Secreted aspartic protease cleavage of Candida albicans Msb2 activates Cek1 MAPK signaling affecting biofilm formation and oropharyngeal candidiasis. PloS One 7: e46020.
48. MuhlschlegelFA, FonziWA (1997) PHR2 of Candida albicans encodes a functional homolog of the pH-regulated gene PHR1 with an inverted pattern of pH-dependent expression. Mol Cell Biol 17 : 5960–5967.
49. Moreno-RuizE, OrtuG, de GrootP, CottierF, LoussertC, et al. (2009) The GPI-modified proteins Pga59 and Pga62 of Candida albicans are required for cell wall integrity. Microbiology 155 : 2004–2020.
50. García-SánchezS, AubertS, IraquiI, JanbonG, GhigoJ-M, et al. (2004) Candida albicans biofilms: a developmental state associated with specific and stable gene expression patterns. Eukaryot Cell 3 : 536–545.
51. NettJE, LepakAJ, MarchilloK, AndesDR (2009) Time course global gene expression analysis of an in vivo Candida biofilm. J Infect Dis 200 : 307–313.
52. YeaterKM, ChandraJ, ChengG, MukherjeePK, ZhaoX, et al. (2007) Temporal analysis of Candida albicans gene expression during biofilm development. Microbiology 153 : 2373–2385.
53. FukudaT, MatsumuraT, AtoM, HamasakiM, NishiuchiY, et al. (2013) Critical roles for lipomannan and lipoarabinomannan in cell wall integrity of mycobacteria and pathogenesis of tuberculosis. mBio 4: e00472–00412.
54. LiY, SuC, MaoX, CaoF, ChenJ (2007) Roles of Candida albicans Sfl1 in hyphal development. Eukaryot Cell 6 : 2112–2121.
55. UppuluriP, ChaturvediAK, SrinivasanA, BanerjeeM, RamasubramaniamAK, et al. (2010) Dispersion as an important step in the Candida albicans biofilm developmental cycle. PLoS Path 6: e1000828.
56. UppuluriP, PierceC, ThomasD, BubeckS, SavilleS, et al. (2010) The transcriptional regulator Nrg1p controls Candida albicans biofilm formation and dispersion. Eukaryot Cell 9 : 1531–1537.
57. ClearyIA, LazzellAL, MonteagudoC, ThomasDP, SavilleSP (2012) BRG1 and NRG1 form a novel feedback circuit regulating Candida albicans hypha formation and virulence. Mol Microbiol 85 : 557–573.
58. BassilanaM, BlythJ, ArkowitzRA (2003) Cdc24, the GDP-GTP exchange factor for Cdc42, is required for invasive hyphal growth of Candida albicans. Eukaryot Cell 2 : 9–18.
59. DouglasAC, SmithAM, SharifpoorS, YanZ, DurbicT, et al. (2012) Functional analysis with a barcoder yeast gene overexpression system. G3 2 : 1279–1289.
60. Legrand M, Munro CA, d'Enfert C (2011) Cool Tools 5: The Candida albicans ORFeome project. In: Calderone RA, Clancy CJ, editors. Candida and candidiasis, 2nd edition. Washington DC: ASM Press. pp.505–510.
61. CabralV, ChauvelM, FironA, LegrandM, NesseirA, et al. (2012) Modular gene over-expression strategies for Candida albicans. Methods Mol Biol 845 : 227–244.
62. ParkY-N, MorschhäuserJ (2005) Tetracycline-inducible gene expression and gene deletion in Candida albicans. Eukaryot Cell 4 : 1328–1342.
63. NobleS (2005) Strains and strategies for large-scale gene deletion studies of the diploid human fungal pathogen Candida albicans. Eukaryot Cell 4 : 298–309.
64. FonziWA, IrwinMY (1993) Isogenic strain construction and gene mapping in Candida albicans. Genetics 134 : 717–728.
65. WilsonRB, DavisD, MitchellAP (1999) Rapid hypothesis testing with Candida albicans through gene disruption with short homology regions. J Bacteriol 181 : 1868–1874.
66. GolaS, MartinR, WaltherA, DunklerA, WendlandJ (2003) New modules for PCR-based gene targeting in Candida albicans: rapid and efficient gene targeting using 100 bp of flanking homology region. Yeast 20 : 1339–1347.
67. MuradAM, LeePR, BroadbentID, BarelleCJ, BrownAJ (2000) CIp10, an efficient and convenient integrating vector for Candida albicans. Yeast 16 : 325–327.
68. Rose MD, Winston F, Hieter P (1990) Methods in Yeast Genetics: A Laboratory Course Manual. Cold Spring Harbor, NY: Cold Spring Harbor Laboratory Press.
69. HokampK, RocheFM, AcabM, RousseauME, KuoB, et al. (2004) ArrayPipe: a flexible processing pipeline for microarray data. Nucl Acids Res 32: W457–459.
70. EricsonE, HoonS, St OngeRP, GiaeverG, NislowC (2010) Exploring gene function and drug action using chemogenomic dosage assays. Methods Enzymol 470 : 233–255.
71. St OngeRP, ManiR, OhJ, ProctorM, FungE, et al. (2007) Systematic pathway analysis using high-resolution fitness profiling of combinatorial gene deletions. Nature Genet 39 : 199–206.
72. DagueE, JauvertE, LaplatineL, VialletB, ThibaultC, et al. (2011) Assembly of live micro-organisms on microstructured PDMS stamps by convective/capillary deposition for AFM bio-experiments. Nanotechnology 22 : 395102.
73. HokampK, RocheFM, AcabM, RousseauME, KuoB, et al. (2004) ArrayPipe: a flexible processing pipeline for microarray data. Nucl Acids Res 32: W457–459.
74. MonniotC, BoisrameA, Da CostaG, ChauvelM, SautourM, et al. (2013) Rbt1 protein domains analysis in Candida albicans brings insights into hyphal surface modifications and Rbt1 potential role during adhesion and biofilm formation. PLoS One 8: e82395.
Štítky
Hygiena a epidemiologie Infekční lékařství LaboratořČlánek vyšel v časopise
PLOS Pathogens
2014 Číslo 12
- Parazitičtí červi v terapii Crohnovy choroby a dalších zánětlivých autoimunitních onemocnění
- Vakcíny proti klíšťové encefalitidě
- Kdy je nejlepší očkovat
- Možné vedlejší účinky očkování
- Imunogenita vakcín
Nejčtenější v tomto čísle
- Plasma Membrane-Located Purine Nucleotide Transport Proteins Are Key Components for Host Exploitation by Microsporidian Intracellular Parasites
- Rubella Virus: First Calcium-Requiring Viral Fusion Protein
- Emergence of MERS-CoV in the Middle East: Origins, Transmission, Treatment, and Perspectives
- Neutral Sphingomyelinase in Physiological and Measles Virus Induced T Cell Suppression
Zvyšte si kvalifikaci online z pohodlí domova
Mazová zátka a její řešení
nový kurzVšechny kurzy