
The Set3/Hos2 Histone Deacetylase Complex Attenuates cAMP/PKA Signaling to Regulate Morphogenesis and Virulence of
Candida albicans, like other pleiomorphic fungal pathogens, is able to undergo a reversible transition between single yeast-like cells and multicellular filaments. This morphogenetic process has long been considered as a key fungal virulence factor. Here, we identify the evolutionarily conserved Set3/Hos2 histone deacetylase complex (Set3C) as a crucial repressor of the yeast-to-filament transition. Cells lacking core components of the Set3C are able to maintain all developmental phases, but are hypersusceptible to filamentation-inducing signals, because of a hyperactive cAMP/Protein Kinase A signaling pathway. Strikingly, Set3C-mediated control of filamentation is required for virulence in vivo, since set3Δ/Δ cells display strongly attenuated virulence in a mouse model of systemic infection. Importantly, the inhibition of histone deacetylase activity by trichostatin A exclusively phenocopies the absence of a functional Set3C, but not of any other histone deacetylase gene. Hence, our work supports a paradigm for manipulating morphogenesis in C. albicans through alternative antifungal therapeutic strategies.
Published in the journal:
. PLoS Pathog 6(5): e32767. doi:10.1371/journal.ppat.1000889
Category:
Research Article
doi:
https://doi.org/10.1371/journal.ppat.1000889
Summary
Candida albicans, like other pleiomorphic fungal pathogens, is able to undergo a reversible transition between single yeast-like cells and multicellular filaments. This morphogenetic process has long been considered as a key fungal virulence factor. Here, we identify the evolutionarily conserved Set3/Hos2 histone deacetylase complex (Set3C) as a crucial repressor of the yeast-to-filament transition. Cells lacking core components of the Set3C are able to maintain all developmental phases, but are hypersusceptible to filamentation-inducing signals, because of a hyperactive cAMP/Protein Kinase A signaling pathway. Strikingly, Set3C-mediated control of filamentation is required for virulence in vivo, since set3Δ/Δ cells display strongly attenuated virulence in a mouse model of systemic infection. Importantly, the inhibition of histone deacetylase activity by trichostatin A exclusively phenocopies the absence of a functional Set3C, but not of any other histone deacetylase gene. Hence, our work supports a paradigm for manipulating morphogenesis in C. albicans through alternative antifungal therapeutic strategies.
Introduction
The human fungal pathogen Candida albicans is a harmless commensal of the mucosal surfaces and gastrointestinal tract of most healthy individuals. However, it can cause severe superficial and disseminated infections, particularly when the immune system of the human host is compromised [1]. A major virulence trait of C. albicans is the ability to switch between several distinct morphologies, including the unicellular yeast-like and the filamentous pseudohyphal and hyphal forms. Since several other fungal pathogens are also dimorphic or even pleiomorphic, including Blastomyces dermatitidis or Coccidioides immiti, morphogenesis has been considered a key component of fungal virulence and host invasion [2], [3].
The switch from the yeast to filamentous forms in C. albicans is triggered by a broad range of environmental or host stimuli, including serum, an elevated growth temperature to 37°C in vitro, and more specific inducers such as N-acetylglucosamine or estradiol [4], [5]. The control of this morphological transition involves several signaling pathways and transcription factors [6], [7]. The most prominent positive regulators are a mitogen-activated protein (MAP) kinase pathway and its downstream transcription factor Cph1 [8], as well as the cyclic adenosine monophosphate (cAMP)/protein kinase A (PKA) pathway and its downstream target transcription factor Efg1 [9], [10]. In addition, filamentation is also under negative control by the transcriptional repressor Tup1 [11]. Tup1-mediated repression requires an interaction between Tup1 with sequence-specific DNA-binding factors such as Nrg1 and Rfg1 [12], [13], [14].
In addition to the yeast-filament transition, diploid C. albicans cells homozygous for the Mating Type Locus (MTL) can also reversibly switch between two distinct cell types termed white and opaque. White cells have a round, yeast-like shape and form dome-shaped colonies on solid agar, while opaque cells display an elongated morphology and form flattened colonies [15]. Furthermore, white cells are unable to mate, whereas opaque cells are mating-competent [16]. Switching between the two phases is believed to enable C. albicans to better adapt to various host niches. For example, white cells are more virulent in a murine systemic infection model, whereas opaque cells colonize the skin more efficiently than white cells [17], [18].
White-opaque switching is reversible and regulated by several transcription factors. The C. albicans diploid genome harbors the Mating Type Locus (MTL) with two alleles known as a and α [19]. The master regulator of switching is WOR1, which in MTL heterozygous cells is stably repressed by a heterodimeric a/α repressor [16], [20], [21]. MTL homozygous white cells are devoid of detectable Wor1 expression. By contrast, opaque cells maintain high Wor1 levels for many generations due to multiple positive feed-back loops [22]. Interestingly, EFG1 is a key negative regulator of WOR1, since MTL homozygous efg1Δ/Δ cells exist predominantly in the opaque phase [23], [24].
Recently, we have shown that several histone-modifier enzymes, including the evolutionarily conserved Set3/Hos2 histone deacetylase complex (SetC) also modulate the white-opaque transition [25]. The related Set3 and Hos2 proteins in Saccharomyces cerevisiae are parts of a similar multiprotein complex (Set3C) that possesses histone deacetylase activity, with multiple functions, including meiosis-specific repression of sporulation [26], promotion of Ty1 retrotransposons integration at tRNA genes [27], as well as signaling secretory stress through the PKC cell integrity pathway [28].
In this study, we discover a unique and novel composite phenotype caused by the deletions of key subunits of the Set3/Hos2 complex in C. albicans. On solid media, set3Δ/Δ and hos2Δ/Δ mutants display a hyperfilamenous phenotype at elevated temperatures, and specifically in the opaque phase. Surprisingly, in the filamentous forms of set3Δ/Δ and hos2Δ/Δ cells, Efg1-dependent target genes are induced as a result of an activated cAMP/PKA pathway. Our results establish the Set3C as a PKA-antagonist that fine-tunes the threshold of the yeast-filament conversion. We also show that set3Δ/Δ cells display strongly attenuated virulence in a murine model of systemic infection, which is associated with hyperfilamentation in vivo. Strikingly, we demonstrate that inhibition of histone deacetylation by trichostatin A exclusively phenocopies the lack of Set3C but not of any other histone deacetylase in Candida albicans. Hence, these data suggest a novel approach for developing antifungal drugs by manipulating the morphogenetic ability of Candida albicans through inhibition of chromatin modification.
Results
MTL homozygous set3Δ/Δ mutants filament specifically in the opaque phase
The Set3 histone deacetylase complex (Set3C) of Saccharomyces cerevisiae comprises of four core (Set3, Hos2, Snt1, Sif2) and three peripheral subunits (Hos4, Hst1, Cpr1), of which Hos2 and Hst1 display catalytic activities. Disruption of any of the core subunit genes prevents complex assembly, whereas the disruption of peripheral subunit genes has no such effect [26]. Reciprocal BLAST searches of the S. cerevisiae and C. albicans proteomes revealed a strong conservation of the core proteins and suggested an analogous architecture of the putative CaSet3C (Table 1).

In a previous study, we reported that SET3 and HOS2 are key regulators of white-opaque switching in MTL homozygous C. albicans strains [25]. Surprisingly, MTLa/a set3Δ/Δ opaque cells show an additional phenotype: they form wrinkled colonies on Lee's agar plates as opposed to the smooth colonies formed by wild type opaque cells and SET3/set3Δ heterozygotes (Figure 1A). Reintegration of one copy of SET3 at the RP10 locus rescued the phenotype, whereas the integration of a control vector at the RP10 locus did not (Figure 1A).

Microscopic inspection revealed that wrinkled opaque colonies formed by set3Δ/Δ cells consisted of mostly filamentous structures with pseudohyphal characteristics [29]. Namely, the cells were elongated and longer than wild type opaque cells, and constrictions were visible at mother-daughter cell junctions (Figure 1B and S2B). In addition, set3Δ/Δ opaque cells expressed the filament-specific gene ECE1 [30] at high levels, indicating an active filamentation program (Figure 1C).
Given the strong conservation of the yeast Set3C in C. albicans, we tested whether hyperfilamentation occurs upon deletion of other subunit-genes of the putative complex. Opaque cells lacking the core subunit Hos2 also gave rise to wrinkled colonies consisting of mostly pseudohyphae (Figure 1D). On the other hand, opaque cells lacking the peripheral subunit Hst1 formed smooth colonies, whereas opaque set3Δ/Δ hst1Δ/Δ cells displayed wrinkled colonies, which reverted to smooth ones upon complementing the SET3-deletion (Figure 1D). Thus, in C. albicans the Set3C is likely to be of similar architecture as in S. cerevisiae. Importantly, the data indicate that loss of a functional Set3C triggers hyperfilamentation of opaque phase cells.
Loss of SET3 promotes filamentation at an elevated temperature
SET3 has been previously identified in a large-scale haploinsufficiency screen as a modulator of filamentation in MTL heterozygous C. albicans cells [31]. Thus, we constructed several independent hetero - and homozygous SET3 deletion strains in an MTLa/α background, and compared the morphologies of wild type and deletion mutants on several standard liquid and solid laboratory media. Most notably, the set3Δ/Δ strain displayed hyperfilamentous growth on solid YPD at 37°C (Figure 2A). YPD at 30°C was used as standard medium supporting yeast phase growth, whereas YPD supplemented with 10% fetal calf serum (FCS) were standard conditions that promote filamentation (Figure 2A). set3Δ/Δ mutants showed a mild hyperfilamentation phenotype on filament-inducing Lee and Spider plates at 37°C. However, wild type and set3Δ/Δ did not show any apparent differences in liquid cultures of all conditions tested (Figure S1). In addition, set3Δ/Δ cells were more invasive on some solid media (Figure S1). Notably, a haploinsufficiency phenotype of SET3/set3Δ cells as reported earlier [31] was not observed in our experimental settings (Figure 1A and 2A), but we observed a mild haploinsufficiency effect at temperatures above 37°C (data not shown).

Microscopic inspection revealed that wrinkled set3Δ/Δ colonies on YPD plates at 37°C consisted of mainly filaments characterized by parallel cell walls and perpendicular septa, the hallmarks of true hyphae (Figure 2B and S2A) [29]. Furthermore, under these conditions, filament-specific ECE1 mRNA levels in set3Δ/Δ colonies were upregulated, confirming an active filamentation program (Figure 2C).
Cells lacking the putative core subunits Hos2, Snt1 and Sif2 also gave rise to wrinkled colonies consisting of mostly true hyphae on YPD at 37°C (Figure 2D), and hos2Δ/Δ cells expressed ECE1 at comparable levels as set3Δ/Δ cells (Figure 2C). By contrast, hst1Δ/Δ cells formed smooth colonies under these conditions. Moreover, the set3Δ/Δ hst1Δ/Δ double mutant formed wrinkled colonies, which was reverted upon restoring SET3 (Figure 2D), confirming the notion of a conserved Set3C architecture in C. albicans.
As expected, the hyperfilamentation on YPD at 37°C was independent of MTL-zygosity. Indeed, MTLa/a wild type and mutant white phase strains showed the same characteristics as the respective MTLa/α isolates (Figure S2C), supporting the general view that the same genetic mechanisms regulate filamentation in both MTL heterozygous and MTL homozygous white phase cells.
If loss of Set3C function is the cause of the hyperfilamenting phenotype, biochemical inhibition of the catalytic activity should mimic the loss of the catalytic subunit. Therefore, we examined the morphological development of wild type C. albicans strains in the presence of the histone deacetylase inhibitor Trichostatin A (TSA) [32]. Surprisingly, we found that 10 µg/ml TSA supplementation of solid YPD medium strongly induced filamentation at 37°C (Figure 2E). We then examined single deletion C. albicans strains lacking all putative histone deacetylase under identical growth conditions in the absence of TSA. Most strikingly, only the loss of the Set3 and Hos2 deacetylase genes induced the yeast-hyphae morphogenetic conversion (Figure 2E). These results demonstrate that inhibition of histone deacetylase activity by TSA is phenocopied by the loss of the Set3 and Hos2 core subunits of the C. albicans Set3C but not of any other histone deacetylase. Taken together, these data strongly suggest that lack of a functional Set3C causes a hyperfilamentation phenotype in set3Δ/Δ and hos2Δ/Δ mutants.
Several transcription factors involved in morphogenesis, including the positive regulator EFG1, as well as the negative regulators NRG1 or SSN6, are themselves regulated at the transcriptional level upon serum-induced yeast-to-hypha transition [12], [33], [34]. Therefore, we tested whether repression of SET3 or HOS2 is associated with the morphological conversion of wild type cells. However, we found no significant differences between SET3 and HOS2 mRNA levels in yeast and hyphal cells (Figure S3). These results confirm that a mechanism other than transcriptional inactivation of SET3 or HOS2 must constitute a trigger driving yeast-to-hypha conversion.
Deletion of EFG1 suppresses the hyperfilamentation of set3Δ/Δ and hos2Δ/Δ mutants
Does the Set3C represent an independent pathway regulating morphogenesis or is it a component of a previously characterized signaling pathway? To investigate the epistatic relationships between SET3, HOS2 and the previously characterized positive regulators CPH1 and EFG1 [8], [9], we analyzed the phenotypes of relevant double deletion mutants. The cph1Δ/Δ set3Δ/Δ and cph1Δ/Δ hos2Δ/Δ double mutants formed hyphae on YPD plates at 37°C, as well as in response to serum. Thus, the combined loss of CPH1 and SET3 or CPH1 and HOS2 resembled the single deletion phenotypes of set3Δ/Δ and hos2Δ/Δ cells (Figure 3A and B). On the other hand, the efg1Δ/Δ set3Δ/Δ and efg1Δ/Δ hos2Δ/Δ double mutants failed to filament, even upon induction with serum; therefore, loss of EFG1 was epistatic to the deletion of SET3 or HOS2 (Figure 3A and B).

In addition, we analyzed the genetic relationship between SET3, HOS2 and SET1. C. albicans SET1 is a histone methyltransferase gene [35], acting in the same pathway as SET3 and HOS2 regulating the frequency of white opaque switching [25]. Whereas in white-opaque switching regulation, SET1 is epistatic to SET3 and HOS2 [25], we noticed a slight enhancement in filament formation in set1Δ/Δ set3Δ/Δ and set1Δ/Δ hos2Δ/Δ double mutants (Figure 3A). Furthermore, loss of EFG1 was epistatic to the loss of SET3 in opaque phase cells, as well (Figure 3C and 3D). Taken together, these results suggest that SET3 and HOS2 are acting in a different pathway than CPH1 or SET1. Nevertheless, Set3C may interfere with Efg1-dependent signaling, resulting in hyperfilamentatation phenotypes of set3Δ/Δ and hos2Δ/Δ single mutants.
Loss of SET3 or HOS2 enhances the induction of EFG1-dependent target genes
The epistasis relations excluded the involvement of a Cph1-dependent mechanism contributing to the effect of SET3 and HOS2 deletions, but EFG1 remained as a possibility. In addition, we also wanted to investigate whether the lack of SET3 or HOS2 interferes with the function of Tup1, a known transcriptional repressor promoting yeast-phase growth in C. albicans [11]. Notably, Tup1 in S. cerevisiae was shown to directly interact with Hos2, and loss of Hos2 was shown to compromise Tup1-dependent gene repression [36].
Therefore, we chose several marker genes whose expression is regulated by Efg1, Tup1 or both of them, and analyzed their mRNA levels in set3Δ/Δ and hos2Δ/Δ mutants (Figure 4A) using qRT-PCR. HWP1 is a filament-specific gene strongly induced by serum [37] or lack of TUP1 [38]. In addition, serum induction of HWP1 is strictly EFG1-dependent (Figure 4B) [37]. In the absence of SET3 or HOS2, cells express high HWP1 levels even on YPD at 37°C, with about 15-fold differences between wild type and set3Δ/Δ or hos2Δ/Δ cells (P<0.01), indicating an active hyphal program. Moreover, elevated HWP1-expression is completely abolished once EFG1 is also deleted in set3Δ/Δ or hos2Δ/Δ cells (Figure 4B). In addition, qualitatively identical results were obtained using additional hyphae-specific markers such as ECE1 and FRE2 (Figure S4).

RBT2 is a gene repressed by Tup1. However, RBT2 expression does not change upon serum induction, excluding an Efg1-mediated control of RBT2 (Figure 4C) [39]. In the absence of SET3 or HOS2, cells express low levels of RBT2 under all conditions tested, comparable to wild type cells, indicating that their absence does not interfere with Tup1-mediated repression of RBT2. Moreover, DDR48 mRNA levels also show a qualitatively identical expression pattern in these mutants (Figure S4).
Finally, SOD5 is expressed at low levels in yeast phase but is induced in an EFG1-dependent manner in serum-induced hyphae, and induction is maintained in tup1Δ/Δ cells (Figure 4D) [40]. Interestingly, we found that set3Δ/Δ and hos2Δ/Δ cells express SOD5 at levels higher than wild type cells on YPD at 37°C (about 3.5-fold relative to wild type, P<0.01) or in the presence of serum at 37°C (about 3.3-fold relative to wild type, P<0.01) (Figure 4D). Most importantly, the elevated SOD5 mRNA levels, both in set3Δ/Δ and hos2Δ/Δ cells, required EFG1 (Figure 4D). Taken together, these results demonstrate that loss of SET3 or HOS2 strongly enhances the expression of EFG1-dependent genes. In other words, genes repressed by Efg1 in yeast phase cells are induced upon loss of SET3 or HOS2, with TUP1-dependent targets remaining unaffected.
Hyperfilamentation of set3Δ/Δ cells is suppressed by adenine supplementation
In a previous study, we have shown that adenine is an environmental factor that modulates the frequency of the opaque to white transition in vitro requiring SET3 [25]. We also made the striking observation that opaque isolates of the MTLa/a set3Δ/Δ cells did not form pseudohyphae on adenine-supplemented Lee's medium at 25°C (Figure 5A and B). The effect of adenine was both dose-dependent and specific; 100 µg/ml adenine completely reverted cells to yeast phase growth, while the same concentration of uridine failed to do so (Figure 5A and B).

To analyze the effect of adenine supplementation at the gene expression level, we first confirmed the induction of the EFG1-dependent targets in opaque MTLa/a set3Δ/Δ mutants. As expected, HWP1 was strongly induced in set3Δ/Δ opaque but not in white cells (around 200-fold relative to wild type, P<0.01); nevertheless, HWP1 expression was reduced back to wild type levels by deleting EFG1 or upon addition of adenine to the medium (Figure 5C). In addition, ECE1 levels showed a qualitatively similar pattern (Figure S4). Furthermore, SOD5 was also induced in set3Δ/Δ opaque cells (around 2.6-fold relative to wild type, P<0.01), and its induced expression was also reduced in efg1Δ/Δ set3Δ/Δ cells or set3Δ/Δ cells grown in the presence of adenine (Figure 5D). The expression level of the Tup1-target RBT2 was again unaffected (Figure 5E).
Is the hyperfilamentation phenotype of white set3Δ/Δ cells on YPD at 37°C also reverted by adenine supplementation? Unfortunately, it is not possible to address this question directly, because the yeast extract present in YPD contains adenine [41]. Hence, as expected, additional 100 µg/ml adenine supplementation on YPD had no effect on the phenotype of set3Δ/Δ cells at 37°C (Figure 5F). However, if the strains were cultured on SD medium, which has defined components and is devoid of adenine yet supports yeast-phase growth of wild type cells, we observed hyperfilamentation of MTLa/α set3Δ/Δ cells at 37°C. This was reverted by adding 100 µg/ml adenine to SD or complementation of one allele of SET3 (Figure 5G). Taken together, these results demonstrate that both the opaque and white filamentation phenotypes of set3Δ/Δ cells can be suppressed by exogenous adenine provided in the growth medium.
The set3Δ/Δ cells have a hyperactive cAMP/PKA pathway
Why are the Efg1-dependent target genes activated upon disruption of the Set3C? Efg1 receives input information from two signaling cascades. First, Efg1 is a downstream target of the cAMP/protein kinase A (PKA) signaling pathway. Briefly, this pathway transmits nutritional signals and involves the activation of the adenylyl-cyclase Cdc35 initiating cAMP synthesis, thereby activating PKA. C. albicans harbors two functional PKA catalytic subunits, Tpk1 and Tpk2 [42]. Second, Mkc1, the central MAP kinase of the protein kinase C (PKC) cell integrity pathway sensing cell wall damage, is also proposed to regulate Efg1-dependent morphogenesis [43]. Consequently, we tested the contribution of PKA and PKC signaling to the hyperfilamenting phenotypes of set3Δ/Δ (Figure 6A).
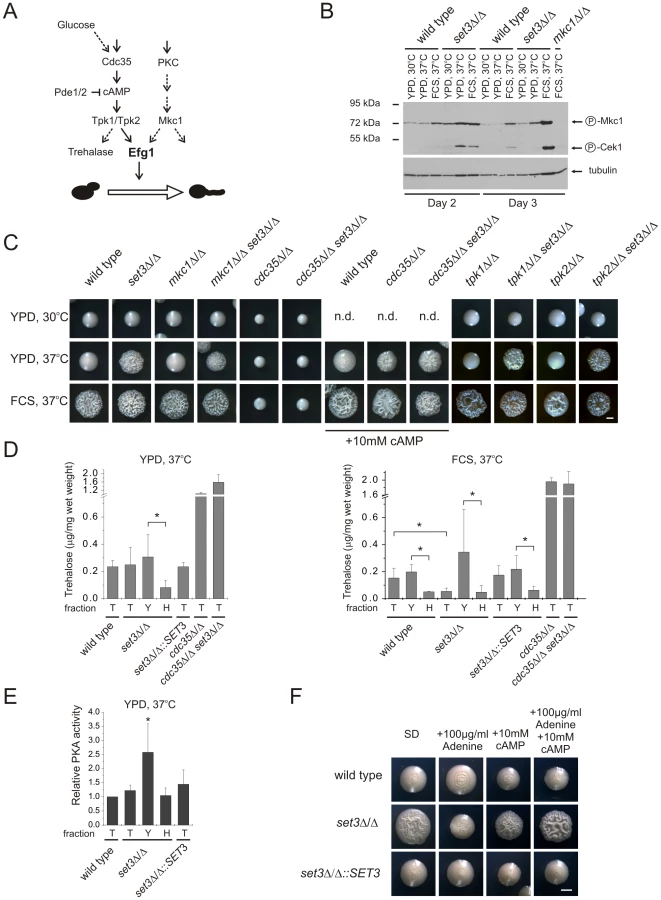
To assess activation of the PKC pathway, we performed Western blot analysis of the active, phosphorylated form of Mkc1. As expected, under filament-inducing conditions, both wild type and set3Δ/Δ cells harbored activated and thus phosphorylated Mkc1 (Figure 6B). Surprisingly, a high level of phosphorylated Mkc1 was also apparent in the set3Δ/Δ colonies after three days of incubation on YPD at 37°C, indicating a hyperactive PKC pathway (Figure 6B). However, we subsequently found that a lack of SET3 was epistatic to the deletion of MKC1, since the mkc1Δ/Δ set3Δ/Δ double mutant displayed filamentous growth on solid YPD at 37°C similar to the set3Δ/Δ mutant (Figure 6C). These data demonstrate that although the PKC pathway appears active in set3Δ/Δ cells on YPD at 37°C, it is not the cause, but rather a consequence of the active filamentation program.
To address whether an active cAMP/PKA pathway is required for the hyperfilamenting phenotype of set3Δ/Δ cells, we performed epistasis experiments of SET3 with CDC35 encoding the adenylyl-cyclase, as well as TPK1 and TPK2 encoding the two PKA catalytic subunits. As shown on Figure 6C, lack of CDC35 prevented both serum - and temperature-induced filamentation of wild type and set3Δ/Δ cells which was reverted upon supplementing the media with 10 mM cAMP. These data demonstrates that hyperfilamentation of set3Δ/Δ cells requires a functional cAMP/PKA pathway. On the other hand, deletion of SET3 was epistatic to the deletion of either TPK1 or TPK2, yet these results can be explained by the functional redundancy of the two PKA genes.
To link hyperfilamentation in the absence of Set3C with an increased activity of the cAMP/PKA pathway, we measured the trehalose content of wild type and mutant cultures. Trehalose is a disaccharide present in many yeast species; it is degraded by the neutral trehalase enzyme, which is activated by PKA [44], [45]. As expected, we did not observe differences in the trehalose contents of wild type, set3Δ/Δ, set3Δ/Δ::SET3 and hos2Δ/Δ cells after growth for two and three days on solid YPD at 30°C supporting yeast phase growth (Figure S5A). Surprisingly, we failed to detect any differences between the four strains on solid YPD at 37°C, where set3Δ/Δ and hos2Δ/Δ cells readily filament (Figure 6D, S5A). However, set3Δ/Δ cells contained around 3-fold less (P<0.05) trehalose than wild type or set3Δ/Δ::SET3 heterozygous colonies when grown for three days on filament-inducing, FCS-supplemented plates (Figure 6D, S5A). Therefore, we concluded that differences in trehalose levels between yeast cells and filamentous forms may not be detectable because the colonies contain a mixture of both (Figure S2A). Consequently, we developed a filtration-based method to separate the yeast-phase and filamentous cells of colonies, to yeast and hyphal fractions. Strikingly, we found about 4-fold more trehalose in the yeast fraction when compared to the hyphae fraction (P<0.05, Figure 6D) derived from the same colonies of wild type, set3Δ/Δ and set3Δ/Δ::SET3 cells when grown on filament-inducing FCS medium at 37°C. Hence, a decreased trehalose content may reflect a history of PKA-activation, once the yeast-filament conversion has been initiated. In good agreement with this suggestion, a similar decrease in trehalose content was also detectable between the yeast and hyphal fractions of set3Δ/Δ cells grown on YPD medium at 37°C (P<0.05, Figure 6D).
To directly assess whether at some stage of differentiation an elevated PKA activity can be detected in the hyperfilamentous set3Δ/Δ cells, we performed PKA activity assays using total cell extracts derived from wild type, set3Δ/Δ and set3Δ/Δ::SET3 cells grown on YPD at 37°C. In these experiments, a fluorescently labeled peptide is phosphorylated by PKA, followed by electrophoretic separation of phosphorylated and non-phosphorylated peptides and quantification by spectrophotometry (see Figure S5B and details in Materials and Methods). Surprisingly, we detected about 2-fold higher PKA activity of the yeast fraction of set3Δ/Δ cells when compared to the wild type (P<0.05, Figure 6E), indicating that this fraction contains a subset of cells harboring an elevated level of active PKA, although this difference is undetectable when comparing whole colonies (Figure 6E). Taken together, these results demonstrate that the hyperfilamentous phenotype of set3Δ/Δ cells requires functional cAMP/PKA signaling; differentiated hyphae are associated with a decrease in trehalose, while a subset of set3Δ/Δ cells harbor an elevated level of active PKA when compared to wild type cells.
Finally, we tested if suppression of hyperfilamentation in set3Δ/Δ cells by exogenous adenine can be rescued by stimulating the cAMP/PKA pathway with exogenous cAMP. Surprisingly, set3Δ/Δ cells indeed displayed a hypersensitive morphogenetic potential in the presence of both exogenous adenine and cAMP (Figure 6F), indicating that both adenine and the Set3C can modulate cAMP/PKA signaling, albeit through antagonistic mechanisms.
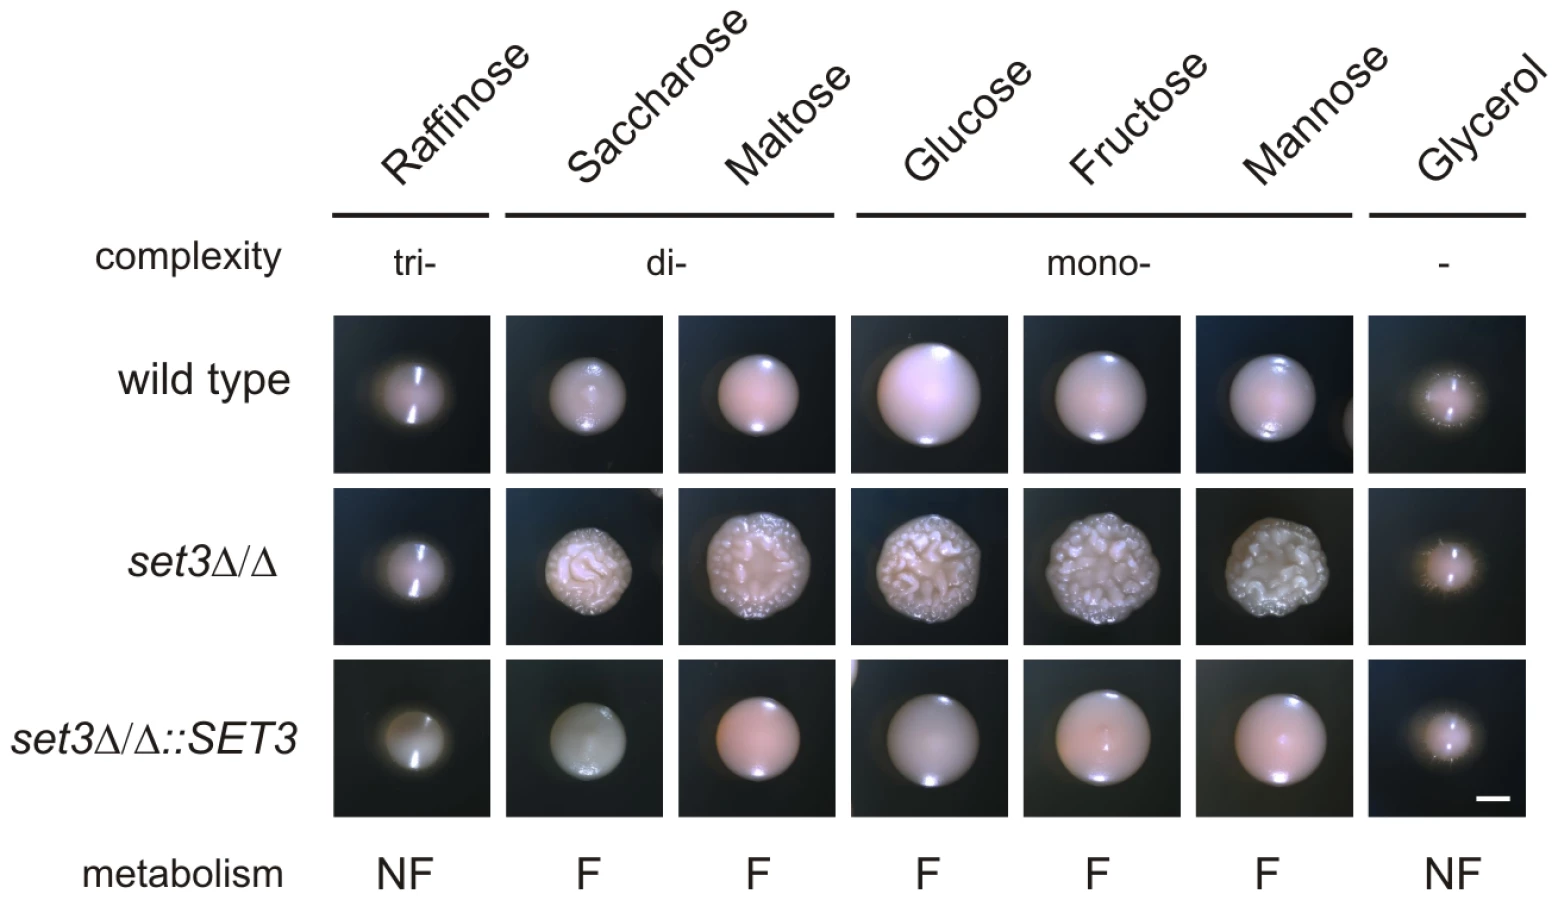
Non-fermentable carbon sources revert hyperfilamentation of set3Δ/Δ cells
In S. cerevisiae, a known substrate of the cAMP/PKA pathway is glucose. Cells cultured on fermentable carbon sources (that can be degraded through glycolysis) are associated with a higher activity of cAMP/PKA signaling, while cells grown on non-fermentable carbon sources are characterized with a lower activity of cAMP/PKA signaling and activation of gluconeogenesis [44] (Figure 6A). Consequently, we tested if limiting cAMP/PKA signaling by non-fermentable carbon sources reverts the hyperfilamentation of set3Δ/Δ cells. Indeed, the hyperfilamentation effect was only observed if cells were grown on saccharides whose enzymatic degradation yields glucose. By contrast, set3Δ/Δ cells reverted to wild type morphologies in the presence of the non-fermentable carbon sources such as glycerol (Figure 7). A similar suppression was observed when the cells were grown on raffinose as a carbon source (Figure 7). Since yeasts, including Candida species do not have a β-lactamase enzyme, they fail to degrade raffinose (consisting of a glucose, galactose and fructose molecule) to fermentable monosaccharides. These results demonstrate that metabolic conditions normally associated with low cAMP/PKA signaling are sufficient to revert the hyperfilamentation effect of the SET3-deletion.
set3Δ/Δ cells have a hypersensitive cAMP/PKA signaling pathway
N-acetylglucosamine (GlcNAc) can activate the cAMP/PKA pathway, and thus is a potent inducer of the yeast-filament transition [5], [46]. To test whether activation of the cAMP/PKA pathway in the hyperfilamentous set3Δ/Δ cells result from a pathway being hypersensitive to filament-inducing stimuli, we analyzed the morphological development of wild type and set3Δ/Δ cells on solid media containing a gradient of GlcNAc. At 30°C, wild type cells required high amounts (5–10 mM) of GlcNAc to trigger filamentous growth (Figure 8A). By contrast, set3Δ/Δ cells displayed massive filamentation already at much lower (0.5–1 mM) concentrations, demonstrating that the cAMP/PKA pathway in this mutant is hypersensitive to inducing stimuli when compared to wild type cells (Figure 8A).

The set3Δ/Δ mutant shows attenuated virulence in a murine infection model
The above results demonstrate that the Set3C moderates cAMP/PKA signaling, thereby promoting yeast phase growth. To address whether Set3C-dependent restriction of filamentation is important for virulence of C. albicans in vivo, we tested the set3Δ/Δ mutant in a mouse model of systemic infection. Consequently, wild type, set3Δ/Δ and complemented set3 strains were injected into the tail vein of 6–8 week old male BALB/c mice. As shown on Figure 9A, 9 out of 10 mice infected with the wild type strain and 10 out of 10 mice infected with the complemented set3 strain died until day seven after injection. By contrast, mice injected with the set3Δ/Δ strain started succumbing to the infection only on day 11, and 6 out of 10 mice were still alive after three weeks (P<0.001, Log rank test). We reproduced the infection experiment once more with another group of 10 mice per C. albicans genotype essentially yielding identical results (data not shown). The results unequivocally demonstrate a strongly attenuated virulence of set3Δ/Δ cells. To confirm that the virulence defect of set3Δ/Δ cells is not caused by a reduced growth rate, we measured the generation times of wild type, heterozygous and homozygous set3 mutants in vitro, but found no significant differences between any of the strains (Figure 9B).

Next, we performed histopathology experiments to address whether the virulence defect of set3Δ/Δ mutants is associated with altered morphological development or unusual tissue invasion in vivo. In the kidneys of mice infected with wild type C. albicans, fungal cells were present as a mixture of both unicellular and filamentous forms on day one after infection. By contrast, set3Δ/Δ cells were displaying hyperfilamentous morphologies (Figure 9C). These data demonstrate that set3Δ/Δ mutants, despite hyperfilamenting in vivo, display attenuated virulence in a murine infection model. These data suggest that the virulence defect is not caused by slower growth but rather by the interference with the morphogenetic conversion.
Discussion
The Set3C is a cAMP/PKA-antagonistic repressor of filamentation
Here, we identify the Set3C, an evolutionary conserved histone deacetylase complex, as a repressor of the cAMP/PKA pathway regulating the yeast-to-hypha conversion in Candida albicans. We provide several lines of evidence that the hyperfilamentation resulting from removing the Set3C is linked to interference with the cAMP/PKA signaling pathway. First, deletion of the pathway genes CDC35 and EFG1 is epistatic to the deletion of SET3 or HOS2. Although, SET3 appears epistatic to both PKA genes TPK1 and TPK2, it can be explained by the functional redundancy of the Tpk1 and Tpk2 enzymes [47]. Second, we found that differentiated hyphae contain around 4-times less trehalose than yeast-phase cells. Thus, trehalose content is a possible readout to detect the history of PKA activation during the yeast-to-hypha conversion of C. albicans. Seemingly contradicting this suggestion, an elevated PKA activity level was detected in the yeast phase fraction of filamentous wrinkled set3Δ/Δ colonies; however, this discrepancy appears logical because of the shortcomings of the filtering procedure used for the separation of morphologies. Namely, in filamentous colonies the differentiated hyphae stick together, yet short filaments are still passing through the filter pores and are found in the yeast fraction (data not shown). We believe that during growth on solid surfaces, a subset of cells reaches a yet undefined age or metabolic state, and then commit to the yeast-to-hypha conversion through activation of the cAMP/PKA pathway. This subset of cells that are “poised” to initiate germ tube formation is enriched in the yeast fraction of the filamentous colonies, thus enabling detection of subtle differences in PKA activity. Third, growth on non-fermentable carbon sources, which is associated with low cAMP/PKA signaling, is sufficient to revert the hyperfilamentation effect of the SET3-deletion.
In this study, we analyzed two distinct filamentation phenotypes of set3Δ/Δ cells to elucidate the mechanism of action of the Set3C, and we propose the following model, which we refer to as the “threshold shift model” (Figure 8B). In wild type cells, the cAMP/PKA pathway and its target transcription factor Efg1 regulate morphogenesis in response to several environmental stimuli [9], [10]. Naturally, molecules triggering morphogenetic conversions do not show a homogenous concentration in vivo; therefore, the regulatory pathway must have a certain sensitivity to input signals, which in the case of the cAMP/PKA pathway, is determined by (at least) two factors: the concentration of key regulatory components inside the cell and a Set3C-dependent attenuation mechanism. For instance, EFG1 is rapidly downregulated upon yeast-to-hyphae conversion by serum and elevated temperature [10]. Efg1 binds to its own promoter, and in the absence of Efg1, the endogenous EFG1 promoter is activated [34]. This auto-inhibitory loop appears crucial for a stable commitment to hyphal growth, because ectopic overexpression of EFG1 causes hyphal cells to revert to yeast growth by lateral budding [34]. At the same time, the results presented in this study suggest that in the absence of a functional Set3C, the cAMP/PKA pathway responds to milder stimuli to initiate conversion to the filamentous growth (Figure 8A and B).
In our belief, this simple “threshold shift” model is coherent with both phenotypes of the set3Δ/Δ mutant for the following reasons. First, white phase set3Δ/Δ cells grow predominantly as hyphae on YPD at 37°C as opposed to the wild type cells growing as yeasts (Figure 2, S2A). In this system, YPD at 30°C, YPD 37°C and YPD+serum at 37°C in this order represent three conditions on the horizontal axis of the model analogous to a stimulus-gradient (Figure 8B). Wild type cells, whose cAMP/PKA signaling has wild type sensitivity, perceive the YPD at 37°C as being below the threshold required for hyphal conversion. By contrast, set3Δ/Δ mutants perceive YPD at 37°C as an environment whose inductive effect is already above the threshold required to switch to hyphal growth. Second, opaque phase set3Δ/Δ mutants grow predominantly as pseudohyphae on Lee's medium at 25°C as opposed to set3Δ/Δ white cells as well as wild type white or opaque cells (Figure 1). In this system, however, Lee's medium at 25°C already represents an environmental scenario close to the threshold point, which is supported by the fact that Lee's medium at 37°C drives hyphal growth [30], [37], [48]. Why do set3Δ/Δ cells filament only in the opaque but not in the white phase? Opaque cells express EFG1 at lower levels than white cells [23], because in opaque cells EFG1 is repressed directly by the master opaque regulator Wor1, and indirectly by the transcription factor Czf1 [22]. Therefore, filamentation of opaque set3Δ/Δ cells is most probably resulting from the increased cAMP/PKA pathway sensitivity due to the lack of Set3C, and the inhibition of the EFG1 locus by Wor1 and Czf1 mimicking the effect of the EFG1-autoinhibitory loop (the latter being absent in the white phase). Notably, Lee's medium at 25°C is not a strong enough signal to induce true hyphal growth. This is in complete agreement with a recently proposed hypothesis, according to which weak filament-inducing signals turn on a set of genes required for pseudohyphal growth, while a stronger signal of the same nature turns on a set of additional genes triggering hyphal growth [49].
At which level of the pathway does the Set3C act on the molecular level? Recently, it was shown that C. albicans Efg1 binds to the promoters of filament-specific genes in both yeast and hyphal cells, and recruits the NuA4 histone acetyltransferase complex and the Swi/Snf chromatin remodeling complex upon hyphal induction [50]. Given that the S. cerevisiae Set3C possesses histone deacetylase activity [26], and that all subunits of the complex show strong evolutionary conservation (Table 1), it seems reasonable to propose that Set3C interferes with Efg1-dependent gene expression in C. albicans by effecting the chromatin status at Efg1 target loci. On the other hand, the PKA hyperactivity in set3Δ/Δ cells as judged from trehalose quantification and PKA activity assays (Figure 6D and 6E) apparently contradicts this notion, and implies that the Set3C acts either at the level or upstream of PKA (see Figure 6A). Nevertheless, a chromatin-based regulatory effect at Efg1 target loci would still be possible, if Efg1 coordinated a feed-back mechanism affecting the activity of PKA. We are developing molecular tools to address these possibilities directly. In this context, it is interesting to note that in a previous study, we found the histone methyltransferase SET1 to be epistatic to SET3 or HOS2 to regulate white-opaque switching in C. albicans [25]. We interpreted these data in a way that the PHD domain of Set3 recognizes methylation marks generated by Set1 at its target loci. Indeed, such a recognition was subsequently demonstrated in S. cerevisiae, in vivo [51]. Consequently, since deletion of SET1 and SET3 showed a synergistic effect in repressing filamentation (Figure 3A), it is reasonable to hypothesize that at genetic loci where Set3C antagonizes filamentation, it does not depend on the methylation marks generated by Set1. Alternatively, it is also possible that the Set3C targets as yet unknown transcription factor(s), rather than histone proteins. This will have to be explored in more detail in future studies.
Adenine as a morphogenetic signal
Along with serum and nitrogen-limitation, filamentation of C. albicans can be triggered by numerous specific stimuli, including human hormones, N-acetylglucosamine and bacterial peptidoglycans [4], [52]. We identify adenine as a potential signal that also has a modulatory effect on the yeast-filament conversion in vitro. Namely, exogenous adenine attenuated the hyperfilamentation phenotypes of set3Δ/Δ cells and suppressed the upregulation of filament-specific genes (Figure 5 and S4). Similar to the Set3C, adenine may also influence cAMP/PKA dependent signaling events in a negative way, since cAMP supplementation in the presence of adenine rescued the phenotype of set3Δ/Δ cells (Figure 6F). Since adenine in itself did not have an influence on the morphogenesis or marker gene expression in wild type cells (Figure 5), it appears likely that its importance as a metabolic factor is limited to specific conditions in vivo, which are partially mimicked by the disruption of the Set3C. In this context, it is interesting to note that limitation of nicotinic acid (like adenine, a NAD precursor) in a urinary tract infection model regulates cell adhesion through a chromatin-dependent mechanism in the fungal pathogen Candida glabrata [53].
In summary, although the specific nature of the adenine signal will have to be explored in further studies, it provides an additional argument that both white and opaque filamentation phenotypes of set3Δ/Δ mutants are caused by an interference with the same genetic mechanism. In addition, we have shown earlier that exogenous adenine also modulates opaque-to-white transition [25], which, together with the results provided here, indicate the need to study the role of purine-metabolism in the regulation of C. albicans morphogenesis.
Morphogenesis as a virulence factor
Most human fungal pathogens including Candida albicans, Cryptococcus neoformans, Blastomyces dermatitidis or Histoplasma capsulatum are dimorphic. Therefore, morphogenesis has been extensively studied as a potential virulence trait [2]. For example, locking Candida albicans cells in the yeast form by the combined deletion of CPH1 and EFG1 abolishes virulence [9]. Likewise, locking cells in a filamentous form by deleting TUP1 had a similar effect [11]. These data led to the general view that virulence is determined by the ability to change morphologies rather than the individual growth forms per se. Although this view is widely accepted, supporting evidence remains indirect, because the mutants tested so far are either locked in a specific growth form or display pleiotropic alterations of other cellular functions unrelated to morphogenesis. For instance, deletion of the transcriptional repressor NRG1 locks cells in a filamentous state and nrg1Δ/Δ cells are avirulent [14]. Deletion of the hypha-specific cyclin HGC1 locks cells in the yeast form and the hgc1Δ/Δ mutant is also avirulent [54]. Deletion of the transcriptional repressor SSN6 permits yeast and pseudohyphal growth, but not true hyphal growth. Lack of SSN6 affects generation time, and ssn6Δ/Δ cells are avirulent [33]. The most direct evidence addressing the contribution of a specific growth form to virulence came from two recent studies on the transcription factors UME6 and NRG1. The ectopic overexpression of UME6 converted cells to the hyphal growth mode in vivo rendering cells hypervirulent [49]. Conversely, ectopic overexpression of NRG1 inhibited hyphal growth in vivo causing attenuated virulence [55]. These studies demonstrated the pivotal role of the hyphal morphology during infection.
In this study we describe a novel phenotype caused by the ablation of key components of the Set3C. The C. albicans set3Δ/Δ mutant is able to maintain both normal yeast and filamentous growth modes but is hyperfilamenting both in vitro and in vivo. Strikingly, the set3Δ/Δ mutant shows attenuated virulence in a murine systemic infection model. However, we cannot rule out that loss of SET3 alters expression of other yet unknown virulence genes whose functions are unrelated to morphogenesis. We are currently performing whole genome microarray analyses to address this possibility. Nevertheless, the virulence defect of set3Δ/Δ cells in vivo as yet appears to highlight the importance of maintaining the yeast phase growth during certain stages of dissemination in the host. Since mice infected with set3Δ/Δ cells recover from the infection more efficiently than mice infected with wild type cells, it appears that the adequate timing for filamentation in a given niche is crucial for full virulence. The ability to maintain the unicellular yeast morphology in host environments being important for virulence is not surprising, since several pleiomorphic pathogens are virulent mainly in the yeast form. For instance, both in the case of Histoplasma capsulatum and Cryptococcus neoformans, yeast phase cells are required for human infections [2], [56].
Regardless of other possible defects caused by impaired Set3C function, targeting the complex with specific deacetylase inhibitors can have a unique therapeutic potential. In fact, impairing the morphogenetic ability has been postulated as a promising area for antifungal drug discovery [55]. Trichostatin A (TSA), a known histone deacetylase inhibitor was recently shown to alter drug sensitivity and to inhibit serum-induced morphogenesis of some C. albicans strains [57], [58]. In addition, a novel fungal Hos2-inhibitor has entered clinical trials to prove therapeutic potential used in combination with the antifungal fluconazole [59]. Here, we show that TSA is a potent trigger of the yeast-to-hyphae conversion of C. albicans. Most importantly, out of all putative histone deacetylase genes, only the deletion of Hos2, the second catalytic subunit of the Set3C can phenocopy TSA treatment, providing compelling evidence that inhibition of the Set3C by TSA is causing the morphogenetic defects. Currently, we are investigating a possible therapeutic potential of TSA and related compounds to modulate morphogenesis and virulence in vivo.
In conclusion, we establish the Set3C as a novel key regulator of morphogenesis in C. albicans. We propose that compromising the complex activity leads to a “threshold shift” in the susceptibility to morphogenetic signals, and a consequent virulence defect. Since the complex appears well conserved from yeast to mammals [60], it will be fascinating to investigate the roles of the Set3C in the morphogenesis and virulence of other fungal pathogens. Indeed, the homologues of SET3 and HOS2 have recently been indentified as factors enhancing virulence of the human fungal pathogen Cryptococcus neoformans [61]. Taken together, our results emphasize the role of morphogenesis as a virulence factor and highlight the role of chromatin in regulating the activity of signaling pathways to orchestrate developmental changes in a simple eukaryotic model system.
Materials and Methods
Media and growth conditions
Rich medium (YPD) and complete synthetic medium (SD) was prepared as previously described [41]. Modified Lee's medium was prepared as described [48]. Unless indicated otherwise, MTL heterozygous and homozygous strains were routinely grown at 30°C and 25°C, respectively. GlcNAc, adenine and cAMP were purchased from Sigma.
Strain construction
The complete list of C. albicans strains, primers and plasmids used in this study are listed in Supplementary Tables S1, S2 and S3, respectively. All strains were derived from SN152 [62], a leucine, histidine, arginine auxotrophic derivative of the clinical isolate SC5314 [63]. SET3, HOS2, MKC1, CDC35, TPK1, TPK2, SNT1 and SIF2 were deleted in SN152 using the fusion PCR strategy with the C.m.LEU2 and C.d.HIS1 markers [62]. The cph1Δ/Δ strain (JKC19) has been previously described [8]. All MTLa/a strains were constructed in the DHCA202 background, which is a MTLa/a derivative of SN152 [25]. The deletion mutants set3Δ/Δ, hos2Δ/Δ, set1Δ/Δ, hst1Δ/Δ, efg1Δ/Δ set3Δ/Δ, efg1Δ/Δ hos2Δ/Δ, set1Δ/Δ set3Δ/Δ and set1Δ/Δ hos2Δ/Δ in the DHCA202 background were described earlier [25]. SET3 was deleted in the JKC19 and the MTLa/a hst1Δ/Δ strains to create the cph1Δ/Δ set3Δ/Δ and hst1Δ/Δ set3Δ/Δ mutants, respectively, using the pDH104 plasmid [25] linearized by PvuI restriction. HOS2 was deleted in the JKC19 background to create the cph1Δ/Δ hos2Δ/Δ mutant using the pDH102 plasmid [25] linearized by digestion with PvuI. SET3 was deleted in the mkc1Δ/Δ background using the fusion PCR strategy with the C.d.ARG4 marker and the linearized pDH104 plasmid to create the mkc1Δ/Δ set3Δ/Δ strain. CDC35, TPK1 and TPK2 were deleted in the set3Δ/Δ background using the fusion PCR strategy with the C.d.ARG4 and SAT1 markers to create the cdc35Δ/Δ set3Δ/Δ, tpk1Δ/Δ set3Δ/Δ and tpk2Δ/Δ set3Δ/Δ strains. Except for the cph1Δ/Δ set3Δ/Δ, cph1Δ/Δ hos2Δ/Δ and hst1Δ/Δ set3Δ/Δ, mkc1Δ/Δ set3Δ/Δ cdc35Δ/Δ set3Δ/Δ and tpk1Δ/Δ set3Δ/Δ double mutants, at least two independent homozygous deletion strains were constructed from independent heterozygote isolates. Transformation was performed via electroporation as described [64]. Genomic integration events were verified with PCR and Southern blot analyses.
Gene complementation mutants were constructed using three approaches. In the MTLa/α set3Δ/Δ strains and the MTLa/a hst1Δ/Δ mutant, the SET3 ORF was reintegrated into its endogenous locus using the pDH112 complementation plasmid [25] linearized by PvuI digestion. In the MTLa/a set3Δ/Δ strains, the SET3 ORF was integrated into one allele of the RP10 locus. To target the RP10 locus, 5′ and 3′ homology regions corresponding to about +/−1kb up - and downstream of the start and stop codon of the RP10 ORF, respectively, were amplified from SC5314 genomic DNA. The upstream fragment was cloned using the HindIII and BamHI restriction sites; the downstream fragment was cloned using the SacI and SacII sites into the pAG36 [65] plasmid harboring a nourseothricin acetyltransferase (NAT1) resistance marker, to yield the plasmid pRP53. The SET3 ORF with its endogenous promoter was cloned into pRP53 using ApaI and NheI restriction sites introduced into pRP53 on the 3′ primer of the upstream RP10 cloning fragment, to create the complementation vector p7221. The pRP53 empty vector and the p7221 integration constructs were linearized by AgeI-digestion prior to transformation. Gene complementation construct for the HOS2 ORF was created using the SAT1 marker cassette of the plasmid pSFS2A and the fusion PCR strategy exactly as described [25]. Transformation was performed via electroporation as described [64]. Correct genomic integration of the complementation plasmids was verified by PCR analysis.
Colony morphology analysis and microscopy
Colony morphology was analyzed using a Discovery V12 Stereoscope equipped with an Axiocam MR5 camera (Zeiss) Microscopic analysis was performed using an Olympus IX81 microscope equipped with a Hamamatsu Orca ER camera (Olympus). For fluorescence microscopy, cells were fixed in 70% ethanol for five minutes, washed three times with distilled water, stained with 10 µM Calcofluor White and 1 µg/ml DAPI (4′,6-Diamidino-2-phenylindole dihydrochloride) for five minutes, washed three times with distilled water and deposited onto glass slides.
Generation time analysis
Strains were streaked from −80°C frozen stocks on YPD agar plates and incubated three days at 30°C. Single colonies were inoculated in liquid YPD and grown overnight, diluted to an OD600 of 1–2 and incubated three hours at 30°C. Cultures were diluted into fresh YPD to an OD600 of 0.1–0.3; subsequently, OD600 values were measured every hour. The generation times were calculated by fitting an exponential function on the exponential parts of the growth curves using the Origin 6.1 software (MicroCal).
RNA isolation and quantitative qRT-PCR
Strains were streaked from −80°C frozen stocks onto YPD agar plates and incubated three days at 30°C. Opaque phase cultures, as well as the white isolates of the corresponding genotypes were streaked from −80°C frozen stocks on YPD agar plates containing 5 µg/ml Phloxin B and incubated three days at 25°C. Single colonies were suspended in distilled water and spread at low densities onto media indicated at each experiment, and incubated using conditions described for each experiment. Colonies (1–3) were scraped off plates and suspended in 500 µl TRI Reagent (Molecular Research Center). After addition of around 200 µl glass beads (425–600 µm, Sigma), cells were broken at 5 m/s for 45 seconds on a FastPrep instrument (MP Biomedicals). Tubes were centrifuged and the supernatant (around 300 µl) was transferred to a fresh tube, 500 µl TRI Reagent and 160 µl chloroform was added. After centrifugation at 14000 g for 15 min at 4°C, the aqueous phase was extracted once with phenol:chloroform:isoamylalcohol. RNA was precipitated in 70% ethanol at −20°C overnight, washed once with 70% ethanol and dissolved in distilled water. About 5–10 µg total RNA was treated with DNaseI (Fermentas). Subsequently, about 1–5 µg of total RNA was reverse-transcribed with the First Strand cDNA synthesis kit (Fermentas). cDNA amplification was monitored quantitatively by SYBR Green incorporation in a Realplex Mastercycler (Eppendorf) using the MesaGreen Master mix (Eurogentec). Amplification curves were analyzed using the Realplex Software (Eppendorf). Statistics analysis (Student's t-test) was performed in Excel (Microsoft).
Western blot analysis
Colonies were scraped off plates and cells were washed three times with ice-cold distilled water. About 20 mg (±0.5 mg) wet weight of cells of each culture were measured and total cell extracts were prepared exactly as previously described [25]. For Western blot analysis, extracts from 0.5 mg wet cells were separated by SDS-PAGE. The phosphorylated forms of the Mkc1 and Cek1 MAP Kinases were detected with a phospho-p44/42 antibody (#9101, Cell Signaling). Loading controls were visualized using a monoclonal anti-tubulin antibody (DM1A, Sigma). Western blot experiments were repeated three times.
Trehalose determination
Colonies were scraped off plates and cells were washed three times with ice-cold distilled water. About 20 mg (±0.5 mg) wet weight of cells of each culture were frozen in liquid nitrogen. For the separation of yeast and hyphal phases, the colonies were filtered through a 70 µm cell strainer (BD Falcon) prior to the washing steps. The pellets were resuspended in 0.5 ml of 0.25 M Na2CO3 per 20 mg of cells, boiled at 95°C for 20 min, and centrifuged at 14.000 g for 5 min. A 10 µl aliquot of the supernatant was neutralized by the addition of 6.5 µl 1M acetic acid. For each reaction, 5 µl of buffer T (300 mM NaAc, 30 mM CaCl2, pH 5.5) and 3 µl of porcine kidney trehalase was added (3.7 U/ml, Sigma), and the volume was adjusted to 43 µl with distilled water. Reactions were incubated at 37°C for 45 min. The glucose liberated was measured in 25 µl of each reaction using the glucose assay kit from Sigma according to the manufacturer's instructions.
Protein Kinase A activity assay
Colonies were scraped off agar plates and about 100 mg (±50 mg) wet weight of cells of each culture was washed twice with ice-cold distilled water. For the separation of yeast and hyphal phases, the colonies were filtered through a 70 µm cell strainer (BD Falcon) prior to the washing steps. Crude cell extracts were prepared as previously described [66]. Briefly, cell pellets were resuspended in 250 µl of 10 mM sodium phosphate buffer (pH 6.8) containing 1 mM EGTA, 1 mM EDTA, 10 mM β-mercaptoethanol. Protease inhibitor tablets (Roche) were added prior to use. After resuspension, glass beads were added (425–600 µm, Sigma), and cells were broken at 4 m/s for 30 seconds on a FastPrep instrument (MP Biomedicals). Tubes were centrifuged twice at 14000 rpm at 4°C for 15 minutes and the supernatant was transferred to a fresh tube. Total protein concentrations were adjusted with the Bradford method, and extracts containing 10 µg of total protein were immediately used for the enzymatic assay. Total PKA activity was measured following the guidelines of the PepTag cAMP-dependent protein kinase assay kit (Promega) in a total volume of 50 µl, containing 20 mM Tris-HCl (pH 7.4), 10 mM MgCl2, 1 mM ATP and 2 µg of PepTag A1 Peptide. 10 µM cAMP and 250 µM H-89 (LC Laboratories) were added when indicated. Reactions were incubated at 30°C for 30 minutes, heat-inactivated at 95°C for 10 min and separated on a 0.8% agarose gel in 50 mM Tris (pH 8.0) buffer (Figure S5B). Quantification of the phosphorylated.
PepTag peptide fractions excised from the gels was performed by spectrophotometry according to the manufacturer's instructions.
Virulence assays
Strains were streaked from −80°C frozen stocks on YPD agar plates and incubated two-three days at 30°C. Single colonies were inoculated in liquid YPD and grown until the mid-exponential growth phase (around OD600 1). Cells were washed twice with PBS and the concentrations were adjusted with a hemocytometer. About 5*105 cells were injected in 100–110 µl suspensions in PBS through the lateral tail vein into 6–8 week old male BALB/c mice. The mice all weighed between 17 and 20 grams and 10 mice per C. albicans genotype were used, except for the PBS control for which only three mice were injected. Survival was monitored over a three week period. Curves were plotted and statistical analysis (Log-rank test) was carried out using the Prism software (GraphPad). The virulence assay was repeated twice.
For histopathology, C. albicans cells were prepared and injected exactly as described for the survival experiments. Three 6–8 week old male BALB/c mice were injected per each C. albicans genotype, plus two mice were injected with PBS. Animals were sacrificed on Day 1 after the injection. Kidneys were fixed in 4% paraformaldehyde and embedded in paraffin. Serial sections (2 µm) were stained with Grocott staining using the Bio-Optica Kit according to the manufacturer's instructions. All animal experiments were performed according to the guidelines of the Austrian Ministry of Science and Research and were approved by the animal ethics committee of the Medical University Vienna under the protocol number BMWF-68.205/0233-II/10b/2009.
Supporting Information
Zdroje
1. OddsFC
1988 Candida and Candidosis: A Review and Bibliography. London Baillière Tindall
2. RooneyPJ
KleinBS
2002 Linking fungal morphogenesis with virulence. Cell Microbiol 4 127 137
3. GowNA
BrownAJ
OddsFC
2002 Fungal morphogenesis and host invasion. Curr Opin Microbiol 5 366 371
4. BrownAJ
GowNA
1999 Regulatory networks controlling Candida albicans morphogenesis. Trends Microbiol 7 333 338
5. ErnstJF
2000 Transcription factors in Candida albicans - environmental control of morphogenesis. Microbiology 146 (Pt8) 1763 1774
6. WhitewayM
BachewichC
2007 Morphogenesis in Candida albicans. Annu Rev Microbiol 61 529 553
7. LiuH
2001 Transcriptional control of dimorphism in Candida albicans. Curr Opin Microbiol 4 728 735
8. LiuH
KohlerJ
FinkGR
1994 Suppression of hyphal formation in Candida albicans by mutation of a STE12 homolog. Science 266 1723 1726
9. LoHJ
KohlerJR
DiDomenicoB
LoebenbergD
CacciapuotiA
1997 Nonfilamentous C. albicans mutants are avirulent. Cell 90 939 949
10. StoldtVR
SonnebornA
LeukerCE
ErnstJF
1997 Efg1p, an essential regulator of morphogenesis of the human pathogen Candida albicans, is a member of a conserved class of bHLH proteins regulating morphogenetic processes in fungi. Embo J 16 1982 1991
11. BraunBR
JohnsonAD
1997 Control of filament formation in Candida albicans by the transcriptional repressor TUP1. Science 277 105 109
12. BraunBR
KadoshD
JohnsonAD
2001 NRG1, a repressor of filamentous growth in C.albicans, is down-regulated during filament induction. EMBO J 20 4753 4761
13. KadoshD
JohnsonAD
2001 Rfg1, a protein related to the Saccharomyces cerevisiae hypoxic regulator Rox1, controls filamentous growth and virulence in Candida albicans. Mol Cell Biol 21 2496 2505
14. MuradAM
LengP
StraffonM
WishartJ
MacaskillS
2001 NRG1 represses yeast-hypha morphogenesis and hypha-specific gene expression in Candida albicans. EMBO J 20 4742 4752
15. SlutskyB
StaebellM
AndersonJ
RisenL
PfallerM
1987 “White-opaque transition”: a second high-frequency switching system in Candida albicans. J Bacteriol 169 189 197
16. MillerMG
JohnsonAD
2002 White-opaque switching in Candida albicans is controlled by mating-type locus homeodomain proteins and allows efficient mating. Cell 110 293 302
17. KvaalC
LachkeSA
SrikanthaT
DanielsK
McCoyJ
1999 Misexpression of the opaque-phase-specific gene PEP1 (SAP1) in the white phase of Candida albicans confers increased virulence in a mouse model of cutaneous infection. Infect Immun 67 6652 6662
18. KvaalCA
SrikanthaT
SollDR
1997 Misexpression of the white-phase-specific gene WH11 in the opaque phase of Candida albicans affects switching and virulence. Infect Immun 65 4468 4475
19. HullCM
JohnsonAD
1999 Identification of a mating type-like locus in the asexual pathogenic yeast Candida albicans. Science 285 1271 1275
20. HuangG
WangH
ChouS
NieX
ChenJ
2006 Bistable expression of WOR1, a master regulator of white-opaque switching in Candida albicans. Proc Natl Acad Sci U S A 103 12813 12818
21. ZordanRE
GalgoczyDJ
JohnsonAD
2006 Epigenetic properties of white-opaque switching in Candida albicans are based on a self-sustaining transcriptional feedback loop. Proc Natl Acad Sci U S A 103 12807 12812
22. ZordanRE
MillerMG
GalgoczyDJ
TuchBB
JohnsonAD
2007 Interlocking transcriptional feedback loops control white-opaque switching in Candida albicans. PLoS Biol 5 e256
23. SonnebornA
TebarthB
ErnstJF
1999 Control of white-opaque phenotypic switching in Candida albicans by the Efg1p morphogenetic regulator. Infect Immun 67 4655 4660
24. SrikanthaT
TsaiLK
DanielsK
SollDR
2000 EFG1 null mutants of Candida albicans switch but cannot express the complete phenotype of white-phase budding cells. J Bacteriol 182 1580 1591
25. HniszD
SchwarzmullerT
KuchlerK
2009 Transcriptional loops meet chromatin: a dual-layer network controls white-opaque switching in Candida albicans. Mol Microbiol 74 1 15
26. PijnappelWW
SchaftD
RoguevA
ShevchenkoA
TekotteH
2001 The S. cerevisiae SET3 complex includes two histone deacetylases, Hos2 and Hst1, and is a meiotic-specific repressor of the sporulation gene program. Genes Dev 15 2991 3004
27. MouZ
KennyAE
CurcioMJ
2006 Hos2 and Set3 promote integration of Ty1 retrotransposons at tRNA genes in Saccharomyces cerevisiae. Genetics 172 2157 2167
28. CohenTJ
MalloryMJ
StrichR
YaoTP
2008 Hos2p/Set3p deacetylase complex signals secretory stress through the Mpk1p cell integrity pathway. Eukaryot Cell 7 1191 1199
29. SudberyP
GowN
BermanJ
2004 The distinct morphogenic states of Candida albicans. Trends Microbiol 12 317 324
30. BirseCE
IrwinMY
FonziWA
SypherdPS
1993 Cloning and characterization of ECE1, a gene expressed in association with cell elongation of the dimorphic pathogen Candida albicans. Infect Immun 61 3648 3655
31. UhlMA
BieryM
CraigN
JohnsonAD
2003 Haploinsufficiency-based large-scale forward genetic analysis of filamentous growth in the diploid human fungal pathogen C.albicans. EMBO J 22 2668 2678
32. YoshidaM
KijimaM
AkitaM
BeppuT
1990 Potent and specific inhibition of mammalian histone deacetylase both in vivo and in vitro by trichostatin A. J Biol Chem 265 17174 17179
33. HwangCS
OhJH
HuhWK
YimHS
KangSO
2003 Ssn6, an important factor of morphological conversion and virulence in Candida albicans. Mol Microbiol 47 1029 1043
34. TebarthB
DoedtT
KrishnamurthyS
WeideM
MonterolaF
2003 Adaptation of the Efg1p morphogenetic pathway in Candida albicans by negative autoregulation and PKA-dependent repression of the EFG1 gene. J Mol Biol 329 949 962
35. RamanSB
NguyenMH
ZhangZ
ChengS
JiaHY
2006 Candida albicans SET1 encodes a histone 3 lysine 4 methyltransferase that contributes to the pathogenesis of invasive candidiasis. Mol Microbiol 60 697 709
36. WatsonAD
EdmondsonDG
BoneJR
MukaiY
YuY
2000 Ssn6-Tup1 interacts with class I histone deacetylases required for repression. Genes Dev 14 2737 2744
37. SharkeyLL
McNemarMD
Saporito-IrwinSM
SypherdPS
FonziWA
1999 HWP1 functions in the morphological development of Candida albicans downstream of EFG1, TUP1, and RBF1. J Bacteriol 181 5273 5279
38. BraunBR
JohnsonAD
2000 TUP1, CPH1 and EFG1 make independent contributions to filamentation in Candida albicans. Genetics 155 57 67
39. BraunBR
HeadWS
WangMX
JohnsonAD
2000 Identification and characterization of TUP1-regulated genes in Candida albicans. Genetics 156 31 44
40. MartchenkoM
AlarcoAM
HarcusD
WhitewayM
2004 Superoxide dismutases in Candida albicans: transcriptional regulation and functional characterization of the hyphal-induced SOD5 gene. Mol Biol Cell 15 456 467
41. KaiserC
MichaelisS
MitchellA
1994 Methods in Yeast Genetics. A Laboratory Course Manual. New York Cold Spring Harbor Laboratory Press
42. BiswasS
Van DijckP
DattaA
2007 Environmental sensing and signal transduction pathways regulating morphopathogenic determinants of Candida albicans. Microbiol Mol Biol Rev 71 348 376
43. KumamotoCA
2005 A contact-activated kinase signals Candida albicans invasive growth and biofilm development. Proc Natl Acad Sci U S A 102 5576 5581
44. TheveleinJM
de WindeJH
1999 Novel sensing mechanisms and targets for the cAMP-protein kinase A pathway in the yeast Saccharomyces cerevisiae. Mol Microbiol 33 904 918
45. UnoI
MatsumotoK
AdachiK
IshikawaT
1983 Genetic and biochemical evidence that trehalase is a substrate of cAMP-dependent protein kinase in yeast. J Biol Chem 258 10867 10872
46. CastillaR
PasseronS
CantoreML
1998 N-acetyl-D-glucosamine induces germination in Candida albicans through a mechanism sensitive to inhibitors of cAMP-dependent protein kinase. Cell Signal 10 713 719
47. BockmuhlDP
KrishnamurthyS
GeradsM
SonnebornA
ErnstJF
2001 Distinct and redundant roles of the two protein kinase A isoforms Tpk1p and Tpk2p in morphogenesis and growth of Candida albicans. Mol Microbiol 42 1243 1257
48. BedellGW
SollDR
1979 Effects of low concentrations of zinc on the growth and dimorphism of Candida albicans: evidence for zinc-resistant and -sensitive pathways for mycelium formation. Infect Immun 26 348 354
49. CarlislePL
BanerjeeM
LazzellA
MonteagudoC
Lopez-RibotJL
2009 Expression levels of a filament-specific transcriptional regulator are sufficient to determine Candida albicans morphology and virulence. Proc Natl Acad Sci U S A 106 599 604
50. LuY
SuC
MaoX
RanigaPP
LiuH
2008 Efg1-mediated recruitment of NuA4 to promoters is required for hypha-specific Swi/Snf binding and activation in Candida albicans. Mol Biol Cell 19 4260 4272
51. KimT
BuratowskiS
2009 Dimethylation of H3K4 by Set1 recruits the Set3 histone deacetylase complex to 5′ transcribed regions. Cell 137 259 272
52. XuXL
LeeRT
FangHM
WangYM
LiR
2008 Bacterial peptidoglycan triggers Candida albicans hyphal growth by directly activating the adenylyl cyclase Cyr1p. Cell Host Microbe 4 28 39
53. DomergueR
CastanoI
De Las PenasA
ZupancicM
LockatellV
2005 Nicotinic acid limitation regulates silencing of Candida adhesins during UTI. Science 308 866 870
54. ZhengX
WangY
2004 Hgc1, a novel hypha-specific G1 cyclin-related protein regulates Candida albicans hyphal morphogenesis. EMBO J 23 1845 1856
55. SavilleSP
LazzellAL
MonteagudoC
Lopez-RibotJL
2003 Engineered control of cell morphology in vivo reveals distinct roles for yeast and filamentous forms of Candida albicans during infection. Eukaryot Cell 2 1053 1060
56. HullCM
HeitmanJ
2002 Genetics of Cryptococcus neoformans. Annu Rev Genet 36 557 615
57. SimonettiG
PassarielloC
RotiliD
MaiA
GaraciE
2007 Histone deacetylase inhibitors may reduce pathogenicity and virulence in Candida albicans. FEMS Yeast Res 7 1371 1380
58. SmithWL
EdlindTD
2002 Histone deacetylase inhibitors enhance Candida albicans sensitivity to azoles and related antifungals: correlation with reduction in CDR and ERG upregulation. Antimicrob Agents Chemother 46 3532 3539
59. TurnerB
MurchL
2009 Interscience Conference on Antimicrobial Agents and Chemotherapy–49th annual meeting. Part 1. 11–15 September 2009, San Francisco, CA, USA. IDrugs 12 667 669
60. GuentherMG
LaneWS
FischleW
VerdinE
LazarMA
2000 A core SMRT corepressor complex containing HDAC3 and TBL1, a WD40-repeat protein linked to deafness. Genes Dev 14 1048 1057
61. LiuOW
ChunCD
ChowED
ChenC
MadhaniHD
2008 Systematic genetic analysis of virulence in the human fungal pathogen Cryptococcus neoformans. Cell 135 174 188
62. NobleSM
JohnsonAD
2005 Strains and strategies for large-scale gene deletion studies of the diploid human fungal pathogen Candida albicans. Eukaryot Cell 4 298 309
63. GillumAM
TsayEY
KirschDR
1984 Isolation of the Candida albicans gene for orotidine-5′-phosphate decarboxylase by complementation of S. cerevisiae ura3 and E. coli pyrF mutations. Mol Gen Genet 198 179 182
64. ReussO
VikA
KolterR
MorschhauserJ
2004 The SAT1 flipper, an optimized tool for gene disruption in Candida albicans. Gene 341 119 127
65. GoldsteinAL
McCuskerJH
1999 Three new dominant drug resistance cassettes for gene disruption in Saccharomyces cerevisiae. Yeast 15 1541 1553
66. CassolaA
ParrotM
SilbersteinS
MageeBB
PasseronS
2004 Candida albicans lacking the gene encoding the regulatory subunit of protein kinase A displays a defect in hyphal formation and an altered localization of the catalytic subunit. Eukaryot Cell 3 190 199
67. RomanE
NombelaC
PlaJ
2005 The Sho1 adaptor protein links oxidative stress to morphogenesis and cell wall biosynthesis in the fungal pathogen Candida albicans. Mol Cell Biol 25 10611 10627
Štítky
Hygiena a epidemiologie Infekční lékařství LaboratořČlánek vyšel v časopise
PLOS Pathogens
2010 Číslo 5
- Parazitičtí červi v terapii Crohnovy choroby a dalších zánětlivých autoimunitních onemocnění
- Vakcíny proti klíšťové encefalitidě
- Kdy je nejlepší očkovat
- Možné vedlejší účinky očkování
- Imunogenita vakcín
Nejčtenější v tomto čísle
- Quorum Sensing Inhibition Selects for Virulence and Cooperation in
- The Role of Intestinal Microbiota in the Development and Severity of Chemotherapy-Induced Mucositis
- Crystal Structure of HIV-1 gp41 Including Both Fusion Peptide and Membrane Proximal External Regions
- Susceptibility to Anthrax Lethal Toxin-Induced Rat Death Is Controlled by a Single Chromosome 10 Locus That Includes
Zvyšte si kvalifikaci online z pohodlí domova
Mazová zátka a její řešení
nový kurzVšechny kurzy