
The Coding and Noncoding Architecture of the Genome
Caulobacter crescentus is a model system for studying asymmetric cell division, a fundamental process that, through differential gene expression in the two daughter cells, enables the generation of cells with different fates. To explore how the genome directs and maintains asymmetry upon cell division, we performed a coordinated analysis of multiple genomic and proteomic datasets to identify the RNA and protein coding features in the C. crescentus genome. Our integrated analysis identifies many new genetic regulatory elements, adding significant regulatory complexity to the C. crescentus genome. Surprisingly, 75.4% of protein coding genes lack a canonical translation initiation sequence motif (the Shine-Dalgarno site) which hybridizes to the 3′ end of the ribosomal RNA allowing translation initiation. We find Shine-Dalgarno sites primarily inside of genes where they cause translating ribosomes to pause, possibly allowing nascent proteins to correctly fold. With our detailed map of genomic transcription and translation elements, a systems view of the genetic network that controls asymmetric cell division is within reach.
Published in the journal:
. PLoS Genet 10(7): e32767. doi:10.1371/journal.pgen.1004463
Category:
Research Article
doi:
https://doi.org/10.1371/journal.pgen.1004463
Summary
Caulobacter crescentus is a model system for studying asymmetric cell division, a fundamental process that, through differential gene expression in the two daughter cells, enables the generation of cells with different fates. To explore how the genome directs and maintains asymmetry upon cell division, we performed a coordinated analysis of multiple genomic and proteomic datasets to identify the RNA and protein coding features in the C. crescentus genome. Our integrated analysis identifies many new genetic regulatory elements, adding significant regulatory complexity to the C. crescentus genome. Surprisingly, 75.4% of protein coding genes lack a canonical translation initiation sequence motif (the Shine-Dalgarno site) which hybridizes to the 3′ end of the ribosomal RNA allowing translation initiation. We find Shine-Dalgarno sites primarily inside of genes where they cause translating ribosomes to pause, possibly allowing nascent proteins to correctly fold. With our detailed map of genomic transcription and translation elements, a systems view of the genetic network that controls asymmetric cell division is within reach.
Introduction
The C. crescentus genome encodes instructions to perform asymmetric cell division using a genetic circuit that integrates transcriptional control from differential chromosome methylation, activation of transcription factors by phosphosignaling pathways, specific proteolysis events, and the subcellular localization of regulatory proteins [1]. Multiple cell cycle events are coordinated with the replication and segregation of the chromosome once and only once per cell cycle [2]. While the C. crescentus genome was sequenced 13 years ago [3], our understanding of the transcribed and translated elements in the genome is far from complete.
Tiling arrays have previously been used to map 27 ncRNAs and 769 transcription start sites (TSSs) in the C. crescentus genome [4],[5]. Now, using RNA sequencing one can identify transcript architectures at single base-pair resolution and with genome-wide coverage [6]. Recently, global identification of 5′ PPP sites of transcription initiation in the genome using a modified global RACE approach enabled mapping of 2726 TSSs in the C. crescentus genome (Zhou et al. [unpublished data]). Liquid chromatography-mass spectrometry (LC-MS) based proteomics methods have identified peptides in 66% of annotated coding DNA sequences (CDSs) [7], but poor peptide coverage severely limits mapping of entire CDSs. However, with ribosome profiling, which maps translating ribosomes [8],[9], we have successfully mapped the C. crescentus CDSs genome-wide.
We report application of a multi-omic approach utilizing RNA-seq, global 5′-RACE, LC-MS proteomics, and ribosome profiling data sets to identify the RNA transcripts and CDSs in the C. crescentus genome at high resolution. We identified transcription units at single nucleotide resolution, 5′ and 3′ UTRs, and the position of all translated CDSs at near single codon resolution in the C. crescentus genome. Integration of these datasets allowed the identification of 375 leaderless mRNAs, 94 new small open reading frames, and 106 new noncoding RNAs. Additionally, we mapped 3235 CDSs in the C. crescentus genome transcribed from 2201 mRNA transcripts. Our integrated analysis also identifies a plethora of genetic regulatory elements, significantly increasing the knowledge of regulatory complexity encoded by the C. crescentus genome. With the identification of the genomic transcription and translation elements, a systems map of the genetic network that controls asymmetric cell division is within reach.
Analysis of the translation initiation sites shows that a majority (75.4%) initiate without a Shine-Dalgarno sequence. A majority of Shine-Dalgarno sites are encoded within the CDSs and, as with E. coli and B. subtilis, these Shine-Dalgarno sites correlate with pauses in translation elongation [10]–[12]. This suggests that C. crescentus uses the Shine-Dalgarno site more commonly for ribosome pausing rather than translation initiation. As suggested from a multitude of predicted bacterial genome annotations [13]–[16], our genomic map provides further experimental evidence that the Shine-Dalgarno-based translation initiation model is not applicable to all bacteria.
Results
A multi-level genome-wide gene expression map
We integrated multiple C. crescentus genomic datasets to map global gene expression features at base-pair resolution (Figure 1). We used a genomic RACE dataset that mapped 2726 TSSs in minimal defined medium allowing promoter and 5′ end RNA identification (Zhou et al. [unpublished data] NCBI GEO accession number GSE57366). Additionally, we used RNA-seq data derived from base-hydrolyzed RNA fragments from complex and minimal defined medium to find both the stable 5′ end of the transcript and the length of the transcript onto which we mapped the individual CDSs. To identify translated CDSs, we used both genome coverage of trypsin-digested peptides (identified for 2559 annotated CDSs) in minimal medium during log growth and starvation [7] and ribosome profiling data. Ribosome profiling data were collected from mid-log phase C. crescentus NA1000 cultures grown in complex (peptone-yeast extract; PYE) and minimal defined (M2 glucose; M2G) medium. Translation was arrested with 100 µg/mL chloramphenicol, polysomes were digested with micrococcal nuclease, and ribosome-protected mRNA fragments were purified on a sucrose gradient and prepared for high throughput sequencing (Figure S1) [8],[17]. Although the extent of peptide coverage within the CDS was not consistent due to the non-uniform distribution of trypsin cut sites, the ribosome profiling data allowed us to map the expressed CDSs in the genome with high coverage and resolution. The 5′ and 3′ UTRs of the transcript can thus be identified. With this approach we have now identified the global transcript and CDS architecture of the C. crescentus genome under the specified growth conditions. Our updated version of the C. crescentus genome annotation can be downloaded here (Dataset S1), and has been incorporated in the NCBI NA1000 annotation (accession CP001340).

We identified differentially expressed genes by comparing RNA-seq levels between M2G and PYE medium, and these results agree well with previous microarray measurements (Dataset S1) [18]. In addition, we find that the ribosome profiling levels correlate with the relative amount of protein present in the cell, validating that the ribosome profiling assay is measuring protein production (Fig. S15). The ribosome profiling data also revealed additional changes in translation between growth conditions (Dataset S1). We found 39 genes that are differentially translated with a >2-fold change in translation efficiency (as defined in the Methods) between M2G and PYE medium (Dataset S1). The largest class of differentially translated genes includes eight genes involved in amino acid catabolism. These genes are repressed in M2G, likely due to the absence of amino acids in the medium.
The C. crescentus CDS map
We mapped the CDSs in the C. crescentus genome using both LC-MS peptide coverage [7] and ribosome profiling. We initially used the LC-MS peptide coverage and the specificity of trypsin protease to map start codons. Since trypsin cuts proteins after Arg or Lys residues, we identified translation start sites as N-terminal sites not preceded by Arg or Lys codons. To avoid false signals from peptides generated from protein degradation we searched for peptides >20 amino acids, thereby omitting products from the major protease ClpP [19]. A majority of the remaining peptides mapped to ATG, GTG, or TTG start codons or the next codon that would result from cleavage of fMet. In this manner, we identified 621 start codons out of the 3818 annotated CDSs in the NA1000 (CP001340) genome. The remainder could not be identified due to the poor intra-CDS coverage of peptides. Since the ribosome profiling read density matched the 621 verified start codons remarkably well (Figure S2), we used the ribosome profiling data to map all start codons. Importantly, ribosome profiling relies on sequencing the protected mRNA fragment from actively translating ribosomes; thus, the ribosome profiling results can be used to globally map start codons at near complete coverage. Using the density of ribosomes along CDSs, we searched for start codons in the predicted annotation (CP001340) by looking for a continual density of ribosomes from the stop codon to the furthest upstream in-frame start codon. If a peptide was found in the LC-MS data, we refined the search for the start codon from the most N-terminal codon of the peptide to the furthest upstream in-frame start codon covered by ribosome footprints. Additionally, we found many LC-MS peptides and ribosomes positioned outside of annotated CDSs either within intergenic regions or on the opposite strand of hypothetical CDSs. We manually curated these regions to identify the boundaries of the corresponding CDS. Using this multipronged approach we mapped 3235 CDSs in the C. crescentus genome. The average increase in the density of ribosomes at the start codon (Figure S2) aided the detection of start codons and, despite heterogeneity in mRNA footprint sizes, allowed us to identify start codons at near single codon resolution.
While 74.3% of the start codons identified were ATG, many CDSs initiate with GTG (14.5%), TTG (10.3%), and a few with CTG (0.7%) (Dataset S1). We also observed a small number of CDSs that begin with other potential near-cognate start codons (0.25%), including one double mismatch GTC codon verified by LC-MS (Dataset S1). In total, we corrected the start codons of 12.8% of annotated CDSs (or 15.7% of those that were mapped), including many that were previously reported to be misannotated or involved in cell cycle regulation including gcrA, chpT, sciP, sidA, divJ, parB, and ftsA (Dataset S1) [20]–[22]. We verified that the ftsA start codon is 18 codons upstream using western blots (Figure 2A, Figure S11) and found that overexpression from a high-copy plasmid containing the correct start codon yielded a strong cell division phenotype while that of the previously annotated form lacking the N-terminal 18 amino acids ([23]–[25]) causes a less severe phenotype (Figure 2A) even after 24 hours of overexpression (Figure S16), suggesting these 18 N-terminal amino acids are likely functional. In general, predicted start codons are further upstream than our experimentally determined start codons due to the biases of start codon prediction algorithms to pick longer CDSs. However, we identified 69 CDSs with start codons further upstream than the original annotation. We also identified 94 previously unidentified CDSs, most of which encode small proteins of less than 100 amino acids. Some of these small CDSs appear to be leader peptides, such as the small CDS positioned in front of the trpS gene (Figure 2B) [26]. It is likely that some of these small leader CDSs have a regulatory role in the expression of their downstream genes [26]. Additionally, we found that 62% of small CDSs are not encoded in the same direction as the downstream genes, indicating that they are not leader peptides and instead likely encode functional proteins (Figure 2C). As tracking the ribosome profiling footprint density allowed us to globally map CDSs in C. crescentus, we analyzed the E. coli and B. subtilis ribosome profiling datasets [10] alone and identified 53 and 70 putative changes to the CDSs in each respective genome (Dataset S6). Finally, we observed cases where a single mRNA has multiple start codons that initiate different isoforms of the protein (Figure 2D) [9]. We identified 75 alternative start codons in the C. crescentus genome by searching for internal peptides with N-terminal residues mapping to non-typsin digested ATG sites (Dataset S1).

Revisiting the role of the Shine-Dalgarno sequence
Despite a conserved 3′ end of the rRNA anti-Shine-Dalgarno (aSD) sequence (CCUCC) in all bacteria, only 24.6% (957) of C. crescentus CDSs contain a Shine-Dalgarno (SD) sequence in the translation initiation site as determined by the predicted ΔG° of annealing between the aSD with the mRNA (Figure 3A, Figure S3A) [16]. While the C. crescentus genome is GC-rich (67.17%), the random chance of finding a SD sequence in a translation initiation region is 19.2%, suggesting only slight enrichment of SD sites. The C. crescentus translation initiation site motif contains little or no consensus information other than the start codon (Figure 3B). Globally, the predicted RNA stability at the translation initiation site revealed it to be less stable than other regions of the mRNA (Figure S3B), consistent with the model that an unstructured region at the translation initiation site is required to translate mRNAs without a SD sequence at the initiation site [27]. On average we observe a peak of ribosome density at the start codon and a peak, albeit smaller, at the stop codon, suggesting that initiation and termination may be slow steps in C. crescentus translation (Figure S4A). However, as the ribosomes were arrested with chloramphenicol, which blocks elongation but not initiation of translation, the enrichment observed at the start codon may not accurately reflect the natural abundance of initiating ribosomes. The ribosome occupancy along genes has peaks along the coding sequence caused by pausing of elongating ribosomes (Figure 3C). As observed in E. coli and B. subtilis [10], many of the internal pauses in translation elongation appear not to be driven by codon usage (Figure S4B), but instead correlate with internal SD sites in the mRNA coding sequence that base-pair with the 3′ end of the rRNA, stalling ribosome movement (Figure 3D) [10]. The aSD binding strength for the SD sequences correlates with the ribosome occupancy, suggesting that the annealing of the rRNA to the mRNA slows translocation of elongating ribosomes (Figure 3E, Figure S14). These results support the hypothesis that internal SD sites provide a conserved pausing mechanism for bacterial ribosomes even in a genome that has high GC content where SD sequences are more abundant. In accordance with a more prevalent role of the SD in elongation, we see poor correlation with the translation efficiency of mRNAs and the aSD binding strength of their SD sequence at the start codon (Figure S5).

The C. crescentus transcribed RNA map
To identify the RNA transcript units we used a global RACE dataset that maps 5′ PPP-sites of transcription initiation (Zhou et al. [unpublished data]) together with RNA-seq density measured here. We found good overlap of the TSSs between the datasets. When the RNA-seq density is centered at the TSSs identified by 5′ global RACE, we observed an increase in RNA-seq read density at the same 5′ nucleotide (Figure 4A). By comparing the RNA-seq data to the TSSs we were able to map the length of the major form of the transcriptional unit and in some cases where an internal TSS exists, allowing us to identify potential isoforms of transcripts. The transcripts mapped by our RNA-seq approach agree well with published northern blots (Dataset S7). In addition, by comparing the transcript unit with the mapped CDSs, we were also able to determine which RNAs encode proteins under the growth conditions tested. In the RNA-seq data sets we found 74% of reads map within CDSs, 21% of reads map to intergenic regions, and 5% map antisense to CDSs. In total, 96.2% of the genome was transcribed among the conditions tested. Together, these data now provide a comprehensive map and functional classification (coding or noncoding) of the expressed RNAs in the C. crescentus genome with single base-pair resolution.

mRNA architecture
The global distribution of mRNA leader lengths in C. crescentus (Figure 4B) shows that 57% of 5′ UTRs are between 15 and 60 nt with some spanning >100 nt. Surprisingly, we observed 375 leaderless mRNAs (9.6% of the cell's CDSs) (Figure 4C). The 5′ nucleotide is the first base of the start codon in a leaderless mRNA that is able to initiate translation on bacterial, archaeal, and eukaryotic ribosomes, suggesting it is an ancient mechanism of translation initiation [28]. Leaderless mRNAs have been found to be rare in most bacteria [29]–[31] and previously only two leaderless mRNAs were identified in C. crescentus: dnaX and hemE [32]. The presence of many leaderless mRNAs in C. crescentus and 171 in S. meliloti [33] suggests translation of leaderless mRNAs may occur more commonly in the alpha-proteobacteria than previously anticipated.
In contrast to leaderless mRNAs, we identified 286 mRNAs that have long 5′ UTRs >100 nt (Figure 4D), which may play regulatory roles in translation. For example, dnaA mRNA encodes a 155 nt 5′ UTR that contributes to the repression of translation, suggesting the 5′ UTR helps regulate the level of the protein needed for proper cell cycle regulation [34]. Additionally, four 5′ UTRs appear to encode conserved riboswitches that are capable of regulating the expression of downstream genes upon direct metabolite binding to the RNA [35] (Table S1).
We also observed genes for which the mRNA is transcribed from an internal site driving translation of an alternative translation initiation site. For example, CCNA_00832 has an internal TSS which is translated from a start codon in the +2 reading frame, resulting in a distinct protein compared to the lowly expressed full length mRNA isoform (Figure 4E). In addition, we find that the cell division gene ftsW has two mRNA isoforms which result in translation of two different length proteins in the same reading frame, with the smaller form (ftsWs) being more highly translated (Figure 4F). No PPP site was identified for the small form of the mRNA; however, it does contain a good sigma 70 site [36] 35 nt upstream of the internal 5′ end. Additionally, when ftsW was inserted into a low copy plasmid lacking the promoter for the full length ftsW CDS, we observed accumulation of FtsWs protein (Figure S11) suggesting it is transcribed from an internal transcript. Overexpression of ftsWs causes a marked motility and cell division phenotype in a low-agar swarming plate assay as well as an increase in cell length when grown in liquid culture (Figure 4F, S6). Despite the small size of this 35 amino acid isoform, FtsWs can localize to sites of constriction (Figure 4F) suggesting it may play a role in cell division. Altogether, we observe that alternative transcripts can drive alternative translation products increasing the diversity of proteins encoded in the genome.
Non-coding RNA architecture
We observed 133 non-coding RNAs (ncRNAs), adding 106 new ncRNAs to the 27 previously identified using tiling arrays [4] (not including conserved ncRNAs such as tRNAs, rRNAs, RNaseP, 6S RNA, 4.5S RNA, and tmRNA). Most of the ncRNAs are expressed from intergenic regions (Figure 5A) and ribosome profiling data showed that these regions are not translated. Some ncRNAs are transcribed from TSSs in the 3′ end of a CDS (Figure 5B), which, similar to Salmonella, allows the 3′ UTR regions to act as a reservoir for ncRNAs [37].
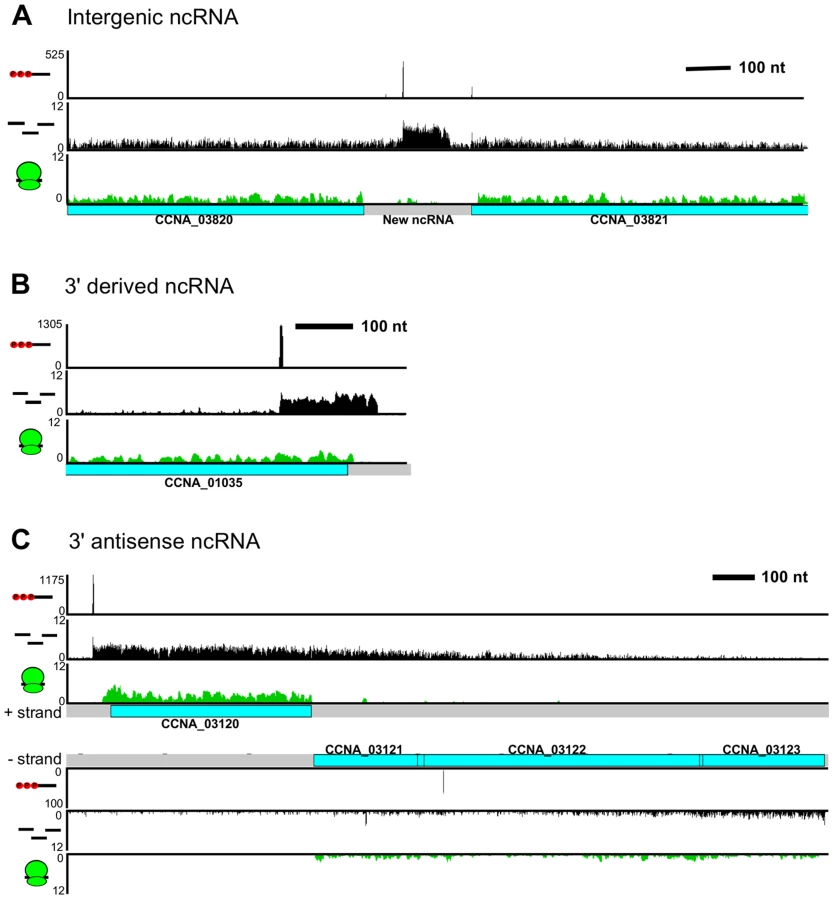
RNA-seq data showed widespread antisense RNA transcribed throughout the C. crescentus genome accounting for 5% of non-tRNA/rRNA reads. Global RACE 5′ PPP mapping revealed that antisense TSSs are found within 15% of CDSs (Zhou et al. [unpublished data]). We observed that the 3′ UTR of an mRNA can extend into the coding regions of downstream genes oriented in the opposite direction forming a long antisense RNA with respect to the mRNAs of these downstream genes (Figure 5C). We found overlaps extending over up to three genes. For example, the 3′ UTR of CCNA_03120, a gene predicted to encode a protein involved in chemotaxis, extends into the coding regions of an operon containing genes CCNA_03121, CCNA_03122 (putative integral membrane protein), and CCNA_03123 (metal regulated homo-dimeric repressor).
Complexity in the architecture of operons
The operon has been traditionally defined as a single co-transcribed unit that yields a single polycistronic mRNA. Using our CDS and RNA maps, we were able to identify operons as mRNAs with >1 CDS (Figure 6A). We observe 863 operons in the C. crescentus genome encoding 65% of all CDSs in the genome. We found that 55% of operons contain 2 CDSs (Figure S7); however, a few operons are quite large with up to 29 CDSs in a single operon. Examples of these include the type IV pilus operon (12 CDSs) [38], one of the ribosomal protein operons (24 CDSs), and the NADH dehydrogenase operon (29 CDSs), the largest C. crescentus operon. The distribution of operon sizes for C. crescentus is similar to that for M. pneumonia [39], H. pylori [31], and E. coli [40]. In many operons, such as those of ribosomal proteins (Figure 6A), the expression level of each CDS is similar yielding the proper stoichiometry of ribosomal proteins of one per ribosome. However, we find that many C. crescentus operons do not have equal expression of the encoded CDSs at the RNA and translation levels (Figure S8).
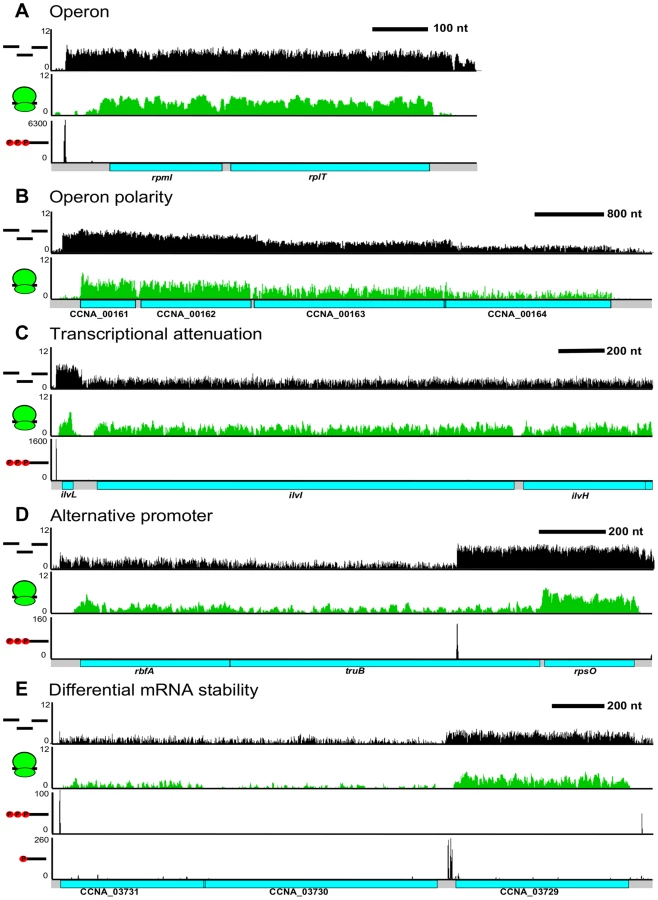
Different levels of expression of RNA for contiguous CDSs within a single operon can be caused by a multitude of factors. The most well characterized mechanism is transcriptional polarity, driven by translation rate, transcription elongation factors, and/or termination factors to cause the 3′ end genes to have reduced levels of expression (Figure 6B). Additionally, operons can be regulated by transcriptional attenuators that down-regulate transcription of the trailing genes (Figure 6C). As shown originally in the E. coli trp operon [26], the ilvBN operon leader has tandem Ile and Val codons which, upon conditions of low tRNAIle and tRNAVal aminoacylation, cause ribosome pausing at these codons, blocking a rho-independent terminator hairpin from forming and allowing RNA-polymerase to elongate through the ilvBN operon [41]. Uneven expression can also cause the 3′ end CDSs to be expressed higher than 5′ end CDSs. We observed that 349 operons contained an alternative TSS (Figure 6D) that could potentially drive higher expression of downstream CDSs. Expression from these internal TSSs was observed to be dynamically regulated during the cell cycle (Zhou et al. [unpublished data]). We also observed operons that appear to have 3′ end genes whose mRNAs are more stable (Figure 6E). In these cases, the operon has only a single TSS and contains a downstream 5′ P site, indicative of an RNaseE cut site. Since the last CDS has a higher mRNA level, it is likely that the 5′ end of the transcript is less stable. Altogether, 64% of the operons appear to have a >2 fold change in RNA level among different CDSs suggesting that most operons are regulated co - and post-transcriptionally to ensure appropriate RNA levels of each encoded CDS.
Operons appear to be highly regulated by having both multiple TSSs and different transcription termination sites. We therefore calculated the total number of TSSs per operon and found that C. crescentus operons have an average of 1.3 TSSs per operon driving multiple mRNA isoforms. Additionally, the number of operons that have successive ≥5-fold drops in RNA level between encoded CDSs is 125, suggesting that polarity of operons also drives many isoforms. In total, we estimate that C. crescentus operons have an average of 1.5 isoforms per operon generated either from alternative TSSs or polarity and 0.5 cis-encoded regulatory features including antisense RNAs, riboswitches, and transcription attenuators. The high number of isoforms and regulatory features suggests that operons can be highly regulated at the transcription and RNA levels. Together with the 75 CDSs that can be initiated internally to drive different protein isoforms, this suggests that the C. crescentus genome contains significant regulatory complexity.
Discussion
Integration of genomic datasets reveals regulatory complexity
We used multiple datasets from ribosome profiling, RNA-seq, 5′ global RACE, and LC-MS [7] to identify and quantify the transcribed and translated elements of the C. crescentus genome with high resolution and near complete coverage (Table 1). Ribosome profiling provides a way to map CDSs that greatly surpasses LC-MS in coverage. We found misannotation of the start codons of many important genes involved in the C. crescentus cell cycle (Dataset S1), including the essential cell division gene ftsA (Fig. 2A, Fig. S11), and found that the truncation of the N-terminal 18 amino acids absent in the previously annotated start codon affects the function of FtsA. We found two cases where previously predicted ncRNAs [4] are, in fact, translated (Dataset S1). Additionally, ribosome profiling identified 94 previously unknown CDSs, a majority of which are <50 amino acids. In total we observe 94 small CDSs of <50 amino acids in the genome. The role of these small proteins in C. crescentus is largely unexplored; however, small proteins have been reported to have important functions in B. subtilis, E. coli, and eukaryotes [42],[43]. A recent identification of a small protein in C. crescentus that can delay cell division upon DNA damage suggests this class of proteins indeed can perform important cellular functions in C. crescentus [20].

We discovered 106 new ncRNAs in the C. crescentus genome that are expressed during normal growth. However, most of the identified C. crescentus ncRNAs are not conserved in other genomes outside of the Caulobacteraceae with only a few present in other alpha-proteobacteria. The function of only one of these ncRNAs in C. crescentus has been characterized, crfA, which was shown to be involved in the response to carbon starvation [4],[44]. In other bacteria, small ncRNAs have a variety of functions, but most commonly they are involved in annealing to mRNAs with complementary sequences and regulating translation or mRNA stability [45]. Most ncRNAs identified in bacteria function through the RNA chaperone Hfq [45],[46]. Hfq is thought to both stabilize the ncRNA and facilitate annealing between the ncRNA and the target mRNAs. In C. crescentus the ncRNA substrates of Hfq have not been identified; however, Hfq was found to be non-disruptable in a high-throughput transposon mutagenesis screen [22] suggesting an important role for ncRNA regulation. Additionally, 14 of the C. crescentus ncRNAs are cell cycle regulated (Zhou et al. [unpublished data]), suggesting these ncRNAs may play a role in cell cycle progression.
With our CDS mapping approach we identified upstream leader peptides and alternative start codons (Figure 2A,B,D). While translation of upstream leader peptides can often regulate expression of the downstream gene, it is possible that these CDSs may also produce functional proteins. Alternative start codon selection in eukaryotes has been shown in some cases to control subcellular localization and to cause functional switches in proteins by translating forms lacking functional domains [47]–[49]. The cell division gene ftsW is made in a full length and short form (Figure 4F), both of which can localize to the site of constriction at the midcell (Figure 4F) [25]. Overexpression of ftsWs, the short form of ftsW, gave rise to a motility and cell division defect in the swarmer plate assay, leading to a modest elongation of the cells (Figure 4F, S6). As the mRNA for the full length ftsW is activated in the late predivisional cell, it will be important to measure the cell cycle-regulated translation of both the ftsW long and ftsWs short forms to understand their roles in regulating cell division.
The vast amount of regulatory RNA elements identified by this approach suggests that there's an unexplored level of cell cycle gene expression control that remains to be investigated. Indeed, as seen in other bacteria, the examination of RNA levels in operons suggests that most operons are not consistent with the classical model of one polycistronic transcriptional unit, suggesting that regulation of operons is more complex [31],[39],[50]. In support of this we estimate that on average, each mRNA and operon contains 2.0 cis-encoded regulatory features (alternative TSS, antisense RNA, internal TSS, internal start codon, lower 3′ RNA density) suggesting combinatorial regulation. Altogether, in the C. crescentus genome we identified ncRNAs, leaderless mRNAs, alternative translation initiation sites, small upstream CDSs, antisense RNAs, alternative transcription initiation sites, transcriptional polarity of operons, and differential RNA stability of operons. These elements are spread throughout the genome and suggest that co/post-transcriptional regulation is likely an important mechanism for cell cycle regulation of gene expression. In support of this, many antisense RNAs and ncRNAs are differentially activated at specific stages of the cell cycle (Zhou et al. [unpublished data]). An important goal will be to understand how the RNA regulatory elements affect cell cycle stage-specific translation and mRNA stability to identify their role in the genetic circuitry that drives the cell cycle.
Diverse mechanisms of translation initiation
Bacterial translation start site selection is thought to occur by the 30S ribosome subunit binding to the SD site on the mRNA [51],[52], spaced approximately 5 nt away from the start codon [53]. While the kinetic events of translation initiation on SD led mRNAs have been well studied [54], initiation on leaderless mRNAs and non-SD containing mRNAs are less well understood. Recent reports suggest that non-SD led mRNAs have an unstructured region at the start codon [27], which was also seen in C. crescentus (Figure S3B). Additionally, non-SD led mRNAs may contain motifs that bind to sites on the rRNA outside the aSD region [55],[56]; however, we do not see abundant motifs that can explain initiation (Figure 3B). We observe that around the start codon the predicted mRNA folding stability is lowest, suggesting that having an unstructured region may be vital for non-SD mRNA binding to ribosomes (Figure S3B) [27].
Leaderless mRNAs are initiated by preassembled 70S/80S ribosomes and can be initiated by ribosomes from all three domains of life [28],[57],[58]. We find that leaderless mRNAs have no specific motif for translation initiation, but instead have an unstructured region that is shifted from the start codon further towards the 3′ end of the translation initiation site likely ensuring the AUG is accessible to bind initiator tRNA in the mRNA channel of the ribosome (Figure S3B). The C. crescentus genome appears to contain the second highest relative number of leaderless mRNAs of any bacterium characterized to date with 375 in a 4.0 mb genome, only behind Mycobacterium tuberculosis with 505 in a 4.4 mb genome [59]. Interestingly, in C. crescentus leaderless mRNAs are translated with similar efficiency to mRNAs containing a leader (Figure S10) suggesting C. crescentus translation is adapted to use leaderless mRNAs as substrates during normal growth and not with a stress induced mechanism as in M. tuberculosis or E. coli [59],[60].
Analysis of sequenced bacterial genomes shows an abundance of non-SD led mRNAs across bacteria, suggesting that the SD dominated mechanism, which is abundant in E. coli and B. subtilis (66.9% and 94.3% of CDSs use a SD sequence, respectively (Figure S9 [16])), is not abundantly used in other bacterial species [13]–[16],[27],[61]. Furthermore, bioinformatics predictions have estimated that the fraction of genes with start codons preceded by SD sites is only 54.3% across bacteria [15]. In C. crescentus only 24.6% of all start codons are preceded by a SD sequence, providing direct evidence that SD mediated translation initiation is not the major mechanism. Interestingly, C. crescentus ribosomes do not initiate on bacteriophage Ms2 or T4 mRNAs and E. coli ribosomes do not initiate on Caulobacter phage Cb5 mRNA, suggesting the translation machinery of these bacteria have different specificities for translation initiation sites despite a similar aSD sequence of the rRNA [62],[63]. Overall, this suggests that the low level of SD sites in C. crescentus translation initiation sites (24.6%) may be due to an adaptation of C. crescentus translation machinery to initiate on non-SD led mRNAs. In support of this, we observe equivalent translation efficiency of leaderless, non-SD led, and SD led mRNAs (Figure S10). Thus, C. crescentus provides a useful model system to investigate the molecular mechanisms of translation initiation on both non-SD and leaderless mRNAs.
Role of the anti-Shine-Dalgarno in pausing
Using our experimentally determined CDS features we found that C. crescentus uses SD sites primarily for ribosome pausing within the CDSs instead of for translation initiation. We did not observe that C. crescentus ribosomes preferentially paused at rare codons (Figure S4B), similar to E. coli and B. subtilis when cultured in conditions with sufficient nutrients, but instead at internal SD sites within the mRNA (Figure 3D,E) [10]. Upon starvation of E. coli or B. subtilis cells for serine, pausing is observed at serine codons [10],[12] suggesting that depleting aminoacyl-tRNA levels can cause significant codon dependent pausing [26],[64]. In C. crescentus, as in E. coli [10], SD sites are selected against in the CDS (Figure S13), presumably due to their strong ability to pause ribosomes. Indeed, the presence of internal SD sites within CDSs has been shown to cause long pauses in a single molecule ribosome translocation assays [65]. Additionally, ribosome pausing at internal SD sites has also been shown to be an important element for ribosome frame shifting [66],[67] and likely affects other cotranslational processes such as protein folding [68]. The aSD site in the ribosome is conserved across all known bacteria (Figure S12) [14], even in those lacking abundant SD sites at start codons. As C. crescentus has evolved to have a larger apparent role of the SD for pausing than initiation, perhaps the strong conservation of the aSD site is due in part to its role in programmed ribosome pausing.
Materials and Methods
Ribosome profiling and RNA-seq
C. crescentus strain NA1000 was grown in M2G or PYE overnight in 5 mL, transferred to 25 mL and grown overnight, then diluted into 500 mL and grown to an OD600 of 0.5. Cells were treated with 100 µg/mL of chloramphenicol for 2 minutes then harvested by centrifugation and flash frozen in liquid nitrogen. Cells were subjected to mixer milling (6 cycles for 3 min at 15 Hz) while frozen in liquid nitrogen. A small amount of the lysate was saved for RNA-seq and the rest was used for ribosome profiling. Ribosome profiling was performed as in [10],[17]. To prepare the RNA-seq libraries, total RNA was extracted from the frozen cell pellet by hot acid-phenol extraction and RNA integrity was verified on the bioanylzer (Agilent). rRNA was removed by MICROBExpress gram negative rRNA removal kit (Ambion). The resulting RNA was base hydrolyzed at 95°C in alkaline hydrolysis buffer (50 mM sodium carbonate pH 9.2, 1 mM EDTA) for 23 minutes and size selected between 20 and 45 nt on a denaturing PAGE gel (10% acrylamide 1× TBE/7M Urea). Library prep was performed as in [10],[17] for both RNA-seq fragments and ribosome footprints. DNA libraries were sequenced on the Illumina Hiseq 2000 or Genome Analyzer platforms. Ribosome profiling reads were mapped to the NA1000 genome sequence (CP001340) using bowtie 0.12.8 [69] and center weighted as in [10]. RNA-seq reads were mapped to the 5′ nucleotide to find the 5′ ends or to the full read sequence for mapping transcripts. Data for two ribosome profiling and two RNA-seq datasets (one set for both M2G and PYE) were deposited into the gene expression omnibus (accession number GSE54883).
CDS mapping
Ribosome profiling read density (Datasets S2 & S3) and the LC-MS derived tryptic peptides were both mapped to the NA1000 genome sequence (CP001340). Using the predicted CDS architecture in the annotation file downloaded from genbank (accession number CP001340) we found tryptic peptides in 66% of the CDSs. Tryptic peptides were directly used to map start codons if the N-terminal codon (or the previous codon in the case of formyl-Met processing) mapped to regions where the previous codon was not an Arg or Lys codon. Since the coverage of the tryptic peptides at the start codon is poor we used the ribosome profiling read density to map the remainder of start codons. We defined start codons as the most upstream ATG, GTG, CTG, or TTG codon with >1/20 the ribosome profiling read density. If no 1st position mismatches were found we searched for single position mismatches in the 2nd and 3rd positions. If no single position ATG mismatches were found, we used the resulting codon only if they matched the beginning of ribosome density and contained a LC-MS tryptic peptide not preceded by an Arg or Lys codon. Each potential start codon which fit this criterion was manually annotated to ensure accuracy. If we identified two adjacent potential start codons we selected the most upstream start codon.
To identify new CDSs we searched for intergenic regions of significant ribosome density. We considered a region a CDS if the ribosome density strictly mapped between start codons to stop codons. We also checked for CDSs that had greater antisense than sense ribosome footprints and manually corrected genes predicted on the wrong strand. We deleted hypothetical CDSs that significantly overlapped other CDSs encoded on the opposite strand or that significantly overlapped tRNA genes.
To map CDSs on leaderless mRNAs we found that the center-weighted ribosome footprints often began 12–18 nt after the start codon as the ribosome footprints were shorter. We therefore identified either 5′ PPP ends or the 5′ end of the RNA-seq read density for each potential start codon. If tryptic peptides matched the 5′ end we annotated it as a leaderless mRNA. Alternatively if no tryptic peptide was found, we mapped leaderless mRNAs if the 5′ end matched the first nucleotide of the start codon and the center-weighted ribosome footprints mapped to the 5′ end of the mRNA. We verified this signature on leaderless mRNAs dnaX and hemE [32].
Transcript mapping
The 5′ end was mapped based on the increased peak intensity of the RNA-seq data at the 5′ nucleotide resulting from partial shearing of the RNA [70] (from Dataset S4 & S5) and/or presence of a 5′ PPP site. 3′ ends were mapped based on an increased 3′ end peak intensity before a drop in RNA level if present, or estimated based on the drop in RNA reads. Non-coding RNAs were identified by examining intergenic or antisense stretches of RNA-seq density. We considered an RNA non-coding if no CDSs were detected within the transcript boundaries. 5′ UTR length distribution was calculated using mapped 5′ RNA ends identified within 300 nt upstream of the start codons or within the last 30% of the upstream CDS, whichever is the shorter distance. 5′UTRs longer than 300 nt were curated manually. To identify known riboswitch elements we searched the 5′ UTR sequences in the Rfam database.
Operon identification
Using the predicted NA1000 operon predictions [71] we appended new CDSs to operons using the following criteria: 1) CDSs that overlap or were less than 40 nt away with the upstream operon or CDS were annotated as either part of the previous operon or as a new operon if overlapping with an upstream single CDS. 2) CDSs less than 260 nt from an upstream CDS were manually inspected and annotated. To use the new CDS map to refine operon predictions we split predicted operons at sites between individual CDSs if they met the following criteria: 1) Intergenic region between CDSs must be >40 nt, 2) Reads per nucleotide must be >20, and 3) a >10 fold difference in RNA-seq read density between the CDS and intergenic region must be observed.
SD site prediction
SD sites were calculated using the Free2Bind package [16]. To identify SD affinity for a translation initiation site, we calculated the annealing affinity of 5′-CACCUCCU-3′ sequence of the rRNA with a 1 nt sliding window from −100 to +100 nt of the translation initiation site. Presence of a SD motif was determined if the lowest predicted ΔG° of annealing between the rRNA and mRNA was less than −4.4 kcal/mol [13] in a window between −20 and −5 nt upstream of the translation initiation site [53]. To estimate the background SD affinity encoded by a random sequence of nucleotides at the GC% of the C. crescentus genome we calculated the SD affinity on 10,000 randomized sequences. 19.2% of random sequences contained our criteria for a SD motif.
Ribosome pausing analysis
Global ribosome pausing analysis was performed as in [10] on genes with average read coverage >10 reads per codon in M2G medium. The average normalized cross-correlation function of sequence elements relative to pause sites was calculated on genes greater than 160 nt long and >10 reads per codon.
mRNA folding prediction
Predicted ΔG° of RNA structures were calculated using the RNAFold program in the Vienna RNA package [72] as in [27]. The minimum free energy was calculated in a 50 nt sliding window moving in 1 nt increments from 100 nt before to 100 nt after the start codon.
Calculation of RNA-seq and ribosome profiling expression levels between media
Levels of gene expression were calculated using the reads per kilobase per million mapped reads (R.P.K.M.) [73] between samples. Ribosome profiling data were corrected for initiating and terminating ribosomes by removing the first 10 codons and the last 5 codons from the R.P.K.M. calculation.
After removing genes with less than 30 reads in a given sample, genes were classified as differentially translated between M2G and PYE if they had a greater than 2-fold change in the translation efficiency = .
Light and fluorescence microscopy
Images were collected as described in [74] on M2G 1.5% agarose pads using a Leica DM6000B microscope. For image analysis MicrobeTracker software [75] was used to determine cell outlines and measure the cell length.
Swarmer assay
Cells were grown to mid-log phase, normalized to OD600 0.3, and spotted on PYE/0.3%-Bacto-Agar/0.3%-xylose/kanamycin plates. Cells were grown for 2–4 days in a humid 28°C chamber, and imaged on a gel imager. Colony size was calculated using imageJ.
Western blotting
Whole cell lysates were generated by growing 1 mL cultures to mid-log, resuspending the cells in 1× Laemmli sample buffer, and boiling at 95°C. Lysates were run on TRIS-Gly SDS-PAGE gels (Bio-Rad 4–15% or 10% acrylamide) and transferred to PVDF membranes (Millipore). Immunoblotting was performed using anti-GFP (Roche) or anti-FtsA sera followed by detection using chemiluminescent substrate (PerkinElmer). Band intensity was calculated using ImageJ.
Strains
A list of all strains can be found in Table 2. To generate all replicating plasmid containing strains, C. crescentus NA1000 was transformed with the following plasmids and selected using standard procedures on PYE plates supplemented with antibiotics. All plasmids were sequence verified.

To generate pBXSPA small CDS overexpression plasmids, an SPA tag was inserted into pBXMCS-2 between the EcoRI and SacI sites. Then, ftsWs, sidA, and CCNA_03934 were inserted between NdeI and EcoRI.
To generate pftsWs, ftsW was inserted into pRVYFPC-6 between HindIII and KpnI, removing any promoter for ftsW and blocking full length expression with two 5′ transcription terminators.
To generate YFP integrating strains, 500 bp of DNA upstream of the stop codon was cloned in frame with YFP in pYFPC-4 using Gibson assembly. Resulting integrating plasmids were transformed into NA1000 and selected on PYE gentamycin.
To generate pBX-ftsA, ftsA was inserted into pBXMCS-2 [76] between the NdeI and PstI sites.
To generate ftsA::ftsAΔC PxylX-ftsA, ftsA1–375 was inserted into pXMCS-2 [76] between the NdeI and PstI sites. The resulting plasmid (pXMCS-2 ftsAΔC) was subsequently transformed into NA1000 resulting in a single integration event at the ftsA locus that simultaneously truncated the native ftsA gene while introducing Pxyl-ftsA. Transformants were selected on PYE kanamycin and xylose.
pBX - ftsAΔN1-18 was a gift from Erin Goley.
Supporting Information
Zdroje
1. McAdamsHH, ShapiroL (2011) The architecture and conservation pattern of whole-cell control circuitry. J Mol Biol 409 : 28–35.
2. CurtisPD, BrunYV (2010) Getting in the loop: regulation of development in Caulobacter crescentus. Microbiology and molecular biology reviews: MMBR 74 : 13–41.
3. NiermanWC, FeldblyumTV, LaubMT, PaulsenIT, NelsonKE, et al. (2001) Complete genome sequence of Caulobacter crescentus. Proc Natl Acad Sci U S A 98 : 4136–4141.
4. LandtSG, AbeliukE, McGrathPT, LesleyJA, McAdamsHH, et al. (2008) Small non-coding RNAs in Caulobacter crescentus. Mol Microbiol 68 : 600–614.
5. McGrathPT, LeeH, ZhangL, IniestaAA, HottesAK, et al. (2007) High-throughput identification of transcription start sites, conserved promoter motifs and predicted regulons. Nat Biotechnol 25 : 584–592.
6. WangZ, GersteinM, SnyderM (2009) RNA-Seq: a revolutionary tool for transcriptomics. Nat Rev Genet 10 : 57–63.
7. BritosL, AbeliukE, TavernerT, LiptonM, McAdamsH, et al. (2011) Regulatory response to carbon starvation in Caulobacter crescentus. PLoS One 6: e18179.
8. IngoliaNT, GhaemmaghamiS, NewmanJRS, WeissmanJS (2009) Genome-wide analysis in vivo of translation with nucleotide resolution using ribosome profiling. Science 324 : 218–223.
9. LeeS, LiuB, HuangSX, ShenB, QianSB (2012) Global mapping of translation initiation sites in mammalian cells at single-nucleotide resolution. Proc Natl Acad Sci U S A 109: E2424–2432.
10. LiG-W, OhE, WeissmanJS (2012) The anti-Shine-Dalgarno sequence drives translational pausing and codon choice in bacteria. Nature 484 : 538–541.
11. LiuX, JiangH, GuZ, RobertsJW (2013) High-resolution view of bacteriophage lambda gene expression by ribosome profiling. Proc Natl Acad Sci U S A 110 : 11928–11933.
12. SubramaniamAR, DelougheryA, BradshawN, ChenY, O'SheaE, et al. (2013) A serine sensor for multicellularity in a bacterium. eLife 2: e01501.
13. MaJ, CampbellA, KarlinS (2002) Correlations between Shine-Dalgarno sequences and gene features such as predicted expression levels and operon structures. J Bacteriol 184 : 5733–5745.
14. NakagawaS, NiimuraY, MiuraK-i, GojoboriT (2010) Dynamic evolution of translation initiation mechanisms in prokaryotes. Proc Natl Acad Sci U S A 107 : 6382–6387.
15. ChangB, HalgamugeS, TangS-L (2006) Analysis of SD sequences in completed microbial genomes: non-SD-led genes are as common as SD-led genes. Gene 373 : 90–99.
16. StarmerJ, StompA, VoukM, BitzerD (2006) Predicting Shine-Dalgarno sequence locations exposes genome annotation errors. PLoS Comput Biol 2: e57.
17. OhE, BeckerAH, SandikciA, HuberD, ChabaR, et al. (2011) Selective ribosome profiling reveals the cotranslational chaperone action of trigger factor in vivo. Cell 147 : 1295–1308.
18. HottesAK, MeewanM, YangD, AranaN, RomeroP, et al. (2004) Transcriptional profiling of Caulobacter crescentus during growth on complex and minimal media. J Bacteriol 186 : 1448–1461.
19. SauerRT, BolonDN, BurtonBM, BurtonRE, FlynnJM, et al. (2004) Sculpting the proteome with AAA(+) proteases and disassembly machines. Cell 119 : 9–18.
20. ModellJW, HopkinsAC, LaubMT (2011) A DNA damage checkpoint in Caulobacter crescentus inhibits cell division through a direct interaction with FtsW. Genes Dev 25 : 1328–1343.
21. BiondiEG, ReisingerSJ, SkerkerJM, ArifM, PerchukBS, et al. (2006) Regulation of the bacterial cell cycle by an integrated genetic circuit. Nature 444 : 899–904.
22. ChristenB, AbeliukE, CollierJM, KalogerakiVS, PassarelliB, et al. (2011) The essential genome of a bacterium. Mol Syst Biol 7 : 528.
23. OhtaN, NinfaAJ, AllaireA, KulickL, NewtonA (1997) Identification, characterization, and chromosomal organization of cell division cycle genes in Caulobacter crescentus. J Bacteriol 179 : 2169–2180.
24. MartinME, TrimbleMJ, BrunYV (2004) Cell cycle-dependent abundance, stability and localization of FtsA and FtsQ in Caulobacter crescentus. Mol Microbiol 54 : 60–74.
25. GoleyED, YehYC, HongSH, FeroMJ, AbeliukE, et al. (2011) Assembly of the Caulobacter cell division machine. Mol Microbiol 80 : 1680–1698.
26. YanofskyC (1981) Attenuation in the control of expression of bacterial operons. Nature 289 : 751–758.
27. ScharffLB, ChildsL, WaltherD, BockR (2011) Local absence of secondary structure permits translation of mRNAs that lack ribosome-binding sites. PLoS Genet 7: e1002155.
28. GrillS, GualerziCO, LondeiP, BlasiU (2000) Selective stimulation of translation of leaderless mRNA by initiation factor 2: evolutionary implications for translation. EMBO J 19 : 4101–4110.
29. KrogerC, DillonSC, CameronAD, PapenfortK, SivasankaranSK, et al. (2012) The transcriptional landscape and small RNAs of Salmonella enterica serovar Typhimurium. Proc Natl Acad Sci U S A 109: E1277–1286.
30. WurtzelO, SestoN, MellinJR, KarunkerI, EdelheitS, et al. (2012) Comparative transcriptomics of pathogenic and non-pathogenic Listeria species. Mol Syst Biol 8 : 583.
31. SharmaCM, HoffmannS, DarfeuilleF, ReignierJ, FindeissS, et al. (2010) The primary transcriptome of the major human pathogen Helicobacter pylori. Nature 464 : 250–255.
32. WinzelerE, ShapiroL (1997) Translation of the leaderless Caulobacter dnaX mRNA. J Bacteriol 179 : 3981–3988.
33. SchluterJP, ReinkensmeierJ, BarnettMJ, LangC, KrolE, et al. (2013) Global mapping of transcription start sites and promoter motifs in the symbiotic alpha-proteobacterium Sinorhizobium meliloti 1021. BMC Genomics 14 : 156.
34. ChengL, KeilerKC (2009) Correct timing of dnaA transcription and initiation of DNA replication requires trans translation. J Bacteriol 191 : 4268–4275.
35. GardnerPP, DaubJ, TateJ, MooreBL, OsuchIH, et al. (2011) Rfam: Wikipedia, clans and the “decimal” release. Nucleic Acids Res 39: D141–145.
36. MalakootiJ, ElyB (1995) Principal sigma subunit of the Caulobacter crescentus RNA polymerase. J Bacteriol 177 : 6854–6860.
37. ChaoY, PapenfortK, ReinhardtR, SharmaCM, VogelJ (2012) An atlas of Hfq-bound transcripts reveals 3′ UTRs as a genomic reservoir of regulatory small RNAs. EMBO J 31 : 4005–4019.
38. SkerkerJM, ShapiroL (2000) Identification and cell cycle control of a novel pilus system in Caulobacter crescentus. EMBO J 19 : 3223–3234.
39. GuellM, van NoortV, YusE, ChenWH, Leigh-BellJ, et al. (2009) Transcriptome complexity in a genome-reduced bacterium. Science 326 : 1268–1271.
40. SalgadoH, Moreno-HagelsiebG, SmithTF, Collado-VidesJ (2000) Operons in Escherichia coli: genomic analyses and predictions. Proc Natl Acad Sci U S A 97 : 6652–6657.
41. TarletonJC, MalakootiJ, ElyB (1994) Regulation of Caulobacter crescentus ilvBN gene expression. J Bacteriol 176 : 3765–3774.
42. HobbsEC, FontaineF, YinX, StorzG (2011) An expanding universe of small proteins. Curr Opin Microbiol 14 : 167–173.
43. KondoT, PlazaS, ZanetJ, BenrabahE, ValentiP, et al. (2010) Small peptides switch the transcriptional activity of Shavenbaby during Drosophila embryogenesis. Science 329 : 336–339.
44. LandtSG, LesleyJA, BritosL, ShapiroL (2010) CrfA, a small noncoding RNA regulator of adaptation to carbon starvation in Caulobacter crescentus. J Bacteriol 192 : 4763–4775.
45. VogelJ, LuisiBF (2011) Hfq and its constellation of RNA. Nat Rev Microbiol 9 : 578–589.
46. GottesmanS, StorzG (2011) Bacterial small RNA regulators: versatile roles and rapidly evolving variations. Cold Spring Harb Perspect Biol 3: a003798.
47. PorrasP, PadillaCA, KraylM, VoosW, BárcenaJA (2006) One single in-frame AUG codon is responsible for a diversity of subcellular localizations of glutaredoxin 2 in Saccharomyces cerevisiae. J Biol Chem 281 : 16551–16562.
48. LinFT, MacDougaldOA, DiehlAM, LaneMD (1993) A 30-kDa alternative translation product of the CCAAT/enhancer binding protein alpha message: transcriptional activator lacking antimitotic activity. Proc Natl Acad Sci U S A 90 : 9606–9610.
49. IngoliaNT, LareauLF, WeissmanJS (2011) Ribosome profiling of mouse embryonic stem cells reveals the complexity and dynamics of mammalian proteomes. Cell 147 : 789–802.
50. QiuY, ChoBK, ParkYS, LovleyD, PalssonBO, et al. (2010) Structural and operational complexity of the Geobacter sulfurreducens genome. Genome Res 20 : 1304–1311.
51. SteitzJA, JakesK (1975) How ribosomes select initiator regions in mRNA: base pair formation between the 3′terminus of 16S rRNA and the mRNA during initiation of protein synthesis in Escherichia coli. Proc Natl Acad Sci U S A 72 : 4734–4738.
52. HuiA, de BoerHA (1987) Specialized ribosome system: preferential translation of a single mRNA species by a subpopulation of mutated ribosomes in Escherichia coli. Proc Natl Acad Sci U S A 84 : 4762–4766.
53. ChenH, BjerknesM, KumarR, JayE (1994) Determination of the optimal aligned spacing between the Shine-Dalgarno sequence and the translation initiation codon of Escherichia coli mRNAs. Nucleic Acids Res 22 : 4953–4957.
54. MilonP, RodninaMV (2012) Kinetic control of translation initiation in bacteria. Crit Rev Biochem Mol Biol 47 : 334–348.
55. BarendtPA, ShahNA, BarendtGA, KothariPA, SarkarCA (2013) Evidence for context-dependent complementarity of non-Shine-Dalgarno ribosome binding sites to Escherichia coli rRNA. ACS Chem Biol 8 : 958–966.
56. BarendtPA, ShahNA, BarendtGA, SarkarCA (2012) Broad-specificity mRNA-rRNA complementarity in efficient protein translation. PLoS Genet 8: e1002598.
57. UdagawaT, ShimizuY, UedaT (2004) Evidence for the translation initiation of leaderless mRNAs by the intact 70 S ribosome without its dissociation into subunits in eubacteria. J Biol Chem 279 : 8539–8546.
58. O'DonnellSM, JanssenGR (2002) Leaderless mRNAs bind 70S ribosomes more strongly than 30S ribosomal subunits in Escherichia coli. J Bacteriol 184 : 6730–6733.
59. CortesT, Schubert OlgaT, RoseG, Arnvig KristineB, ComasI, et al. (2013) Genome-wide Mapping of Transcriptional Start Sites Defines an Extensive Leaderless Transcriptome in Mycobacterium tuberculosis. Cell Reports 5 : 1121–31.
60. VesperO, AmitaiS, BelitskyM, ByrgazovK, KaberdinaAC, et al. (2011) Selective translation of leaderless mRNAs by specialized ribosomes generated by MazF in Escherichia coli. Cell 147 : 147–157.
61. ZhengX, HuGQ, SheZS, ZhuH (2011) Leaderless genes in bacteria: clue to the evolution of translation initiation mechanisms in prokaryotes. BMC Genomics 12 : 361.
62. LefflerS, SzerW (1974) Purification and properties of initiation factor IF-3 from Caulobacter crescentus. J Biol Chem 249 : 1458–1464.
63. SzerW, LefflerS (1974) Interaction of Escherichia coli 30S ribosomal subunits with MS2 phage RNA in the absence of initiation factors. Proc Natl Acad Sci U S A 71 : 3611–3615.
64. ElfJ, NilssonD, TensonT, EhrenbergM (2003) Selective charging of tRNA isoacceptors explains patterns of codon usage. Science 300 : 1718–1722.
65. WenJD, LancasterL, HodgesC, ZeriAC, YoshimuraSH, et al. (2008) Following translation by single ribosomes one codon at a time. Nature 452 : 598–603.
66. FarabaughPJ (1996) Programmed translational frameshifting. Microbiol Rev 60 : 103–134.
67. WeissRB, DunnDM, DahlbergAE, AtkinsJF, GestelandRF (1988) Reading frame switch caused by base-pair formation between the 3′ end of 16S rRNA and the mRNA during elongation of protein synthesis in Escherichia coli. EMBO J 7 : 1503–1507.
68. ZhangG, HubalewskaM, IgnatovaZ (2009) Transient ribosomal attenuation coordinates protein synthesis and co-translational folding. Nat Struct Mol Biol 16 : 274–280.
69. LangmeadB, TrapnellC, PopM, SalzbergSL (2009) Ultrafast and memory-efficient alignment of short DNA sequences to the human genome. Genome Biol 10: R25.
70. Stern-GinossarN, WeisburdB, MichalskiA, LeVT, HeinMY, et al. (2012) Decoding human cytomegalovirus. Science 338 : 1088–1093.
71. TaboadaB, CiriaR, Martinez-GuerreroCE, MerinoE (2012) ProOpDB: Prokaryotic operon database. Nucleic Acids Res 40: D627–631.
72. LorenzR, BernhartSH, Zu SiederdissenCH, TaferH, FlammC, et al. (2011) ViennaRNA package 2.0. Algorithms Mol Biol 6 : 26.
73. MortazaviA, WilliamsBA, McCueK, SchaefferL, WoldB (2008) Mapping and quantifying mammalian transcriptomes by RNA-Seq. Nat Meth 5 : 621–628.
74. BowmanGR, PerezAM, PtacinJL, IghodaroE, Folta-StogniewE, et al. (2013) Oligomerization and higher-order assembly contribute to sub-cellular localization of a bacterial scaffold. Mol Microbiol 90 : 776–795.
75. SliusarenkoO, HeinritzJ, EmonetT, Jacobs-WagnerC (2011) High-throughput, subpixel precision analysis of bacterial morphogenesis and intracellular spatio-temporal dynamics. Mol Microbiol 80 : 612–627.
76. ThanbichlerM, IniestaAA, ShapiroL (2007) A comprehensive set of plasmids for vanillate - and xylose-inducible gene expression in Caulobacter crescentus. Nucleic Acids Res 35: e137.
77. BaileyTL, BodenM, BuskeFA, FrithM, GrantCE, et al. (2009) MEME SUITE: tools for motif discovery and searching. Nucleic Acids Res 37: W202–208.
78. GrunenfelderB, TawfilisS, GehrigS, MOS, EglinD, et al. (2004) Identification of the protease and the turnover signal responsible for cell cycle-dependent degradation of the Caulobacter FliF motor protein. J Bacteriol 186 : 4960–4971.
79. WilliamsB, BhatN, ChienP, ShapiroL (2014) ClpXP and ClpAP proteolytic activity on divisome substrates is differentially regulated following the Caulobacter asymmetric cell division. Mol Microbiol In Press.
Štítky
Genetika Reprodukční medicínaČlánek vyšel v časopise
PLOS Genetics
2014 Číslo 7
- Kazuistika – Perspektivy využití precizované medicíny v rámci personalizované specifické terapie onkologických pacientů
- Nobelova cena za chemii pro genetické nůžky: Objev, který změní naši budoucnost?
- Technologie na bázi RNA v klinické praxi: od přebarvených petúnií k terapii vzácných a dosud jen obtížně léčitelných chorob u lidí
- „Nepředstavovali jsme si, že náš výzkum povede přímo ke vzniku nových léků, dokonce ještě za našeho života“
- Bezplatné služby pro diagnostiku ATTRv amyloidózy pro kardiology
Nejčtenější v tomto čísle
- Wnt Signaling Interacts with Bmp and Edn1 to Regulate Dorsal-Ventral Patterning and Growth of the Craniofacial Skeleton
- Novel Approach Identifies SNPs in and with Evidence for Parent-of-Origin Effect on Body Mass Index
- Hypoxia Adaptations in the Grey Wolf () from Qinghai-Tibet Plateau
- DNA Topoisomerase 1α Promotes Transcriptional Silencing of Transposable Elements through DNA Methylation and Histone Lysine 9 Dimethylation in
Zvyšte si kvalifikaci online z pohodlí domova
Mazová zátka a její řešení
nový kurzVšechny kurzy