
A Loss of Function Screen of Identified Genome-Wide Association Study Loci Reveals New Genes Controlling Hematopoiesis
In this manuscript we report on a follow-up study of the GWAS loci associated with the platelet size and number. A GWAS meta-analysis identified 68 genetic loci controlling platelet size and number. Only a quarter of those genes, however, are known regulators of hematopoiesis. To determine function of the remaining genes we performed a medium-throughput genetic screen in zebrafish using morpholinos (MOs) to knock down selected candidate genes. Here, we report on two major findings. First we identified 15 genes (corresponding to 12 human genes) required for distinct stages of specification or differentiation of HSCs in zebrafish. A detailed review of databases and literature revealed limited knowledge about the functional role of Satb1, Rcor1 and Brd3 in hematopoiesis and for the remaining nine genes our work represents the first study on their putative role in hematopoiesis. And secondly, we demonstrate that brd3a is critical for establishing, but not maintaining thrombopoietic compartment. Importantly, our study introduces zebrafish as a model system for functional follow-up of GWAS loci and generates a valuable resource for prioritization of platelet size and number associated genes for future in-depth mechanistic analyses. Following this route of investigation new regulatory molecules of hematopoiesis will be added to critical pathways.
Published in the journal:
. PLoS Genet 10(7): e32767. doi:10.1371/journal.pgen.1004450
Category:
Research Article
doi:
https://doi.org/10.1371/journal.pgen.1004450
Summary
In this manuscript we report on a follow-up study of the GWAS loci associated with the platelet size and number. A GWAS meta-analysis identified 68 genetic loci controlling platelet size and number. Only a quarter of those genes, however, are known regulators of hematopoiesis. To determine function of the remaining genes we performed a medium-throughput genetic screen in zebrafish using morpholinos (MOs) to knock down selected candidate genes. Here, we report on two major findings. First we identified 15 genes (corresponding to 12 human genes) required for distinct stages of specification or differentiation of HSCs in zebrafish. A detailed review of databases and literature revealed limited knowledge about the functional role of Satb1, Rcor1 and Brd3 in hematopoiesis and for the remaining nine genes our work represents the first study on their putative role in hematopoiesis. And secondly, we demonstrate that brd3a is critical for establishing, but not maintaining thrombopoietic compartment. Importantly, our study introduces zebrafish as a model system for functional follow-up of GWAS loci and generates a valuable resource for prioritization of platelet size and number associated genes for future in-depth mechanistic analyses. Following this route of investigation new regulatory molecules of hematopoiesis will be added to critical pathways.
Introduction
Erythrocytes and platelets (thrombocytes in zebrafish) are the most abundant cells in blood. In an individual, the number and volume of both erythrocytes and platelets are highly heritable and tightly regulated within narrow ranges, but there is a wide variation of these parameters in the population [1], [2]. The 80% heritability of blood cell indices provided the foundation for our recently completed GWAS meta-analysis in ∼68,000 healthy individuals for both cell types. We identified 68 genetic loci that control the mass (volume x count) of platelets [3] and another 75 for red cell indices [4]. About a quarter of the genes proximal to the platelet GWAS association single nucleotide polymorphisms (SNPs) encode well studied and generally pivotal regulators of hematopoiesis but the function of the remaining ones is unknown, demonstrating the power of GWAS to identify novel regulators of hematopoiesis. We have recently reported functional validation of six genes in which the sentinel SNP was localized within a gene and silenced ak3, rnf145, arhgef3, tpm1, jmjd1c and ehd3 in zebrafish by MO injections. Profound effects on thrombopoiesis were observed for all but ehd3 [3]. Furthermore, our detailed studies of the arhgef3 gene, which encodes one of the ∼70 Rho guanine nucleotide exchange factors, showed its important role in iron uptake and transferrin receptor internalisation in erythrocytes [5]. Based on these preliminary data, we hypothesized that the majority of genes identified in our recent genomics efforts are important and rate-limiting regulators of hematopoiesis and therefore worthwhile of further investigation.
The zebrafish model has distinct advantages over other animal models for screening large numbers of genes. Zebrafish development occurs rapidly over the course of a few days with thrombocytes, erythroid - and myeloid - blood cells being fully formed and functional by 3 days post fertilisation (dpf). External fertilisation and transparency of zebrafish embryos allow easy visualisation of early blood-related phenotypes giving them the advantage over mice, where development occurs in utero. Importantly, transcriptional mechanisms and signalling pathways in hematopoiesis are well conserved between zebrafish and mammals [6].
Herein, we performed a MO injection screen of 15 genes identified in GWAS for platelet size and number to uncover novel pathways essential in thrombopoiesis and hematopoiesis in general. From this screen, we identified 12 new genes required for normal hematopoiesis and ordered them on a hematopoietic lineage tree based on their presumed function during hematopoiesis. Further analysis of the hematopoietic lineage tree revealed a distinct pattern of gene distribution suggesting two main gene clusters. One cluster of genes appears to work at the level of HSCs affecting all derived blood cell types and the second cluster appears to be limited to controlling the specification of the thrombocyte-erythroid progenitors. Additionally, we show that one of the novel candidate genes, brd3a, is essential in differentiation of thrombocytes from HSCs but is dispensable for their maintenance.
Results
Gene selection
To interrogate the large number of novel hematopoietic genes identified in the GWAS for platelet size and number we developed an in vivo functional genomics screen in zebrafish (Figure S1). The first step was selection of the most suitable candidate genes and initially we selected a single gene, closest to the sentinel SNP, from each GWAS locus [3] (Table S1). Distance from the nearest gene was calculated as the absolute distance between SNP and transcription start site of the gene or 3′ end of last exon [3] (Table S1). We further eliminated genes with a known function in hematopoiesis and identified a putative zebrafish ortholog, with over 38% identity, on the protein level, with its human counterpart for 40 genes. Finally, we excluded all genes that would require the use of more than two MOs, resulting in a list of 33 genes. Nearly 80% of these genes had a sentinel SNPs localized within 10 kb. In the last step, we selected 19 genes of which 16 had a sentinel SNP within 10 kb and three genes had a sentinel SNP >10 kb. Five of the selected genes were duplicated in zebrafish, resulting in a total of 24 genes to be further investigated aiming to define their function in blood cell formation by a MO knockdown approach in zebrafish.
We designed splice-blocking MOs for each gene and validated their efficacy with RT-PCR and sequencing. Of the 24 MOs tested five MOs had no effect on the target RNA and these MOs were excluded from further analysis (Figure S2). We then assayed the remaining 19 functional MOs for their effect on overall development, morphology and hematopoiesis during the first 72 hours post fertilisation (hpf) and selected the optimal dose of MO to be injected (Figure S3). Of note, based on the information available at the ZFIN at the time and our in situ hybridization data (Figure S4) none of the selected genes had hematopoietic specific gene expression. For all genes, except grtp1a, the optimal dose of MO was selected that resulted in a specific phenotype but without gross lethality or defects in body shape or size, vasculature, heart and circulation. We found that grtp1a MO injected embryos died by 15 hpf even when injected with 0.8 ng of MO, thus we excluded grtp1a from further analysis.
A reverse genetic screen identified genes essential in hematopoiesis
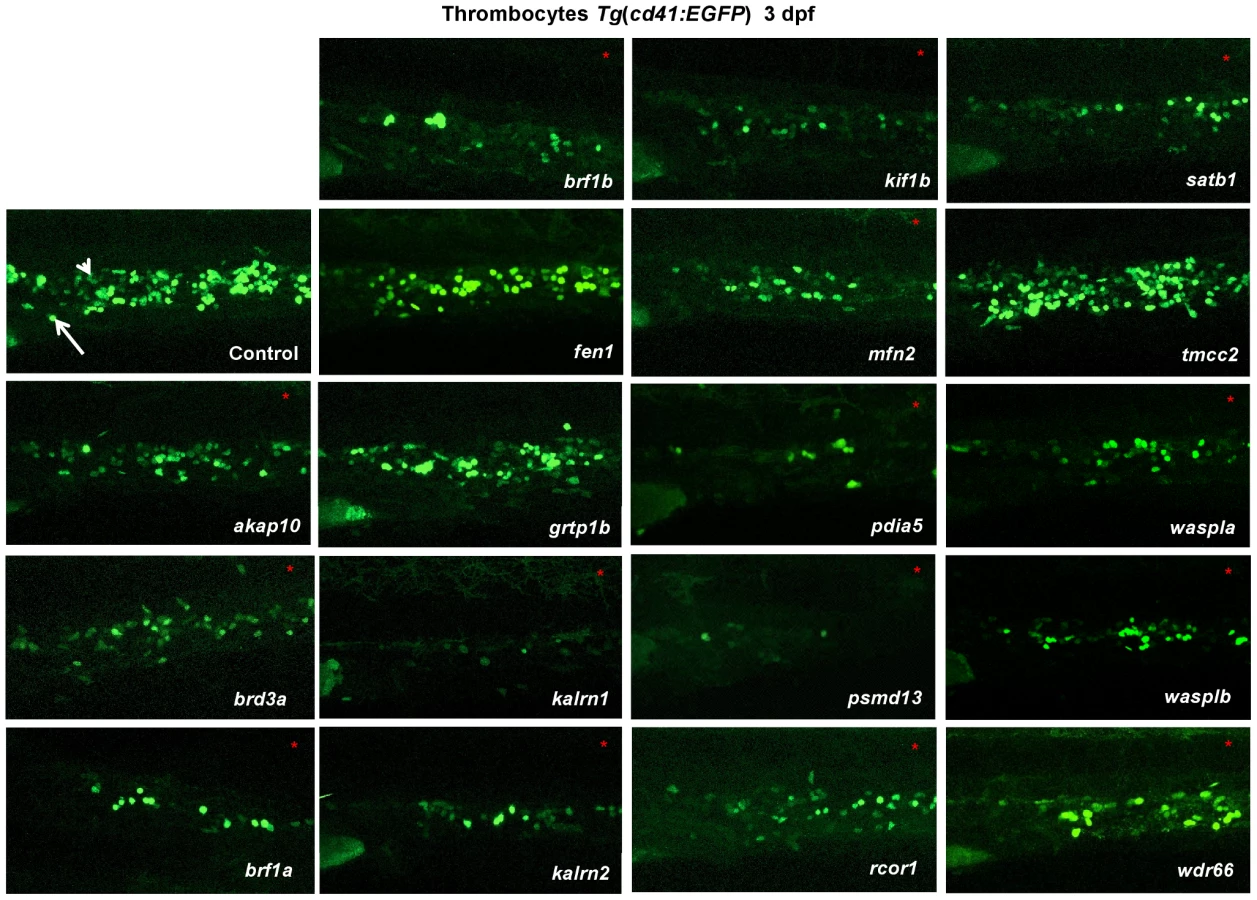
Although morphological examination can detect defects with great sensitivity, some specific defects in hematopoiesis can be missed, and as a result information obtained from the initial analysis might be limited. Thus, we carried out a second level of analysis by performing in situ hybridisation with several hematopoietic markers, specifically, c-myb, ae1 globin, mpeg and rag1. These were complemented with the use of the Tg(cd41:EGFP) line and two histochemical stains, o-Dianisidine and Sudan black. The hematopoietic markers used for phenotyping were carefully chosen to distinguish between early and late stages of hematopoiesis as well as thrombocytes, erythrocytes, neutrophils, macrophages and lymphocytes (Figures S5).
We initiated screening by taking advantage of the Tg(cd41:EGFP) reporter line, which labels thrombocytes, to identify genes in zebrafish that, when disrupted, affect thrombocyte number. We found that knock down of 15 of the 18 genes resulted in 30–95% reduction in thrombocyte number (Figure 1, Figure S6). Importantly, where the functional second MO was available, the observed phenotype was comparable to the one observed with the first MO (Figure S7, S8, Table S2). Furthermore, concurrent knock down of p53 with gene specific MOs did not attenuate the thrombocyte phenotype induced by gene specific MOs, confirming that the observed decrease in the number of thrombocytes was not induced by p53 mediated off target effects of MO injection (Figure S9). For one of the “phenotypic” genes, brf1b, we have obtained the mutant through ZMP. To test if brf1b mutants have a decreased number of thrombocytes, the offspring were subjected to the “clotting time assay” at 5 dpf [7]. Clotting time in brf1b mutant larvae was significantly longer than in the wild type fish, suggesting a defect in thrombopoiesis (Figure S10 A). To further confirm the specificity of the phenotype observed in MO injected embryos and in the absence of available mutants we performed the rescue of rcor1 MO injected embryos using full-length zebrafish rcor1 RNA (Figure S10 B, C). We focused our further analysis on the 15 “phenotypic” genes and their paralogs.
To maintain the population of differentiated blood cells within normal ranges, HSCs need to continuously maintain the balance between self-renewal and differentiation. We reasoned that decreased number of thrombocytes in MO injected embryos could be the result of either reduced numbers of HSCs or altered HSC differentiation. To assess which stage of hematopoiesis was affected in each MO injected embryo, we performed in situ hybridization at 3 dpf and looked for alterations in expression of definitive hematopoiesis marker c-myb (Figure 2). Although more than half of the MOs tested had no effect on the number of HSCs, depletion of rcor1 resulted in an increased number of HSCs and depletion of kalrn (1 and 2), mfn2, pdia5, psmd13 and wasplb resulted in decreased numbers of HSCs in caudal hematopoietic tissue (CHT) at 3 dpf. This reduction in the number of HSCs was not evident at 30 hpf in kalrn1, mfn2, pdia5, psmd13 and wasplb MO injected embryos (Figure S11) suggesting that the number of HSCs at 3 dpf was most probably adversely affected by either their homing to or survival/proliferation in CHT. However, kalrn2 and rcor1 depleted embryos had a marked decrease in the number of HSCs at 30 hpf, implying the important role of these genes in specification of HSCs in the aorta-gonad-mesonephros (AGM) (Figure S11). Importantly, analysis of vascular development by injecting candidate gene MOs into Tg(fli1:EGFP) embryos, which express EGFP in endothelial cells, demonstrated no major abnormalities in vascular morphogenesis or remodeling that would preclude circulation, indicating that the hematopoietic defects were not secondary to a vascular phenotype (Figure S12). Thus, our screen effectively defined a set of nine genes required for differentiation of HSCs to thrombocytes and possibly other blood lineages.

Hematopoiesis is often depicted by a hierarchical differentiation tree, with HSCs at the root and the mature blood cells as the branches. One of the intermediate cellular states is the common myeloid progenitor (CMP), which can proliferate and differentiate into megakaryocyte-erythrocyte progenitors (MEP) and granulocyte-monocyte (GM) progenitors, which further give rise to megakaryocytes, erythrocytes, granulocytes, monocytes and other cell types. To investigate lineage-specific effects of the candidate genes, we assessed the status of definitive erythropoiesis in MO injected embryos at 4 dpf. As αe1-globin RNA was reported to be expressed in definitive erythrocytes at 4 dpf [8], a detailed analysis of the expression pattern of αe1-globin transcript was exploited to reveal the initiation of definitive erythropoiesis after gene silencing. Profound effects on definitive erythropoiesis were observed for all but brd3a, brf1b, waspla and wdr66 (Figure S13). However, silencing of brf1a and wasplb resulted in diminished definitive erythropoiesis, reflecting functional divergence of duplicated genes (brf1 and waspl) (Figure S13). Furthermore, an extensive analysis of hemoglobin levels in primitive erythroid cells at 2 dpf showed that, with the exception of brd3a, kalrn2 and kif1b, primitive erythropoiesis was largely unaffected following MO knock down of candidate genes (Figure S14). These results are consistent with the notion that the majority of candidate genes are dispensable for specification and differentiation of primitive erythrocytes and that fundamentally different molecular mechanisms regulate primitive and definitive erythropoiesis.
To establish the role of candidate genes in differentiation of the myeloid lineage, that is neutrophils and macrophages, we performed Sudan Black staining (for neutrophils) and in situ hybridization using mpeg riboprobe (for macrophages) in control and candidate gene depleted zebrafish embryos at 3 dpf. Out of 15 genes tested, depletion of nine resulted in reduced numbers of Sudan Black positive cells and two (kif1b, waspla) had an effect on the number of macrophages (Figures S15, S16, and S18). Reduction in the number of Sudan Black positive cells could reflect the absence of granules rather than neutrophils. We have, therefore, performed in situ hybridization using mpx riboprobe for all genes for which the knockdown resulted in a decrease in the number of Sudan Black positive cells. For all the tested genes the observed phenotype was comparable to the one we reported following Sudan Black staining (Figure S17).
Finally, we analyzed the impact of loss of candidate gene function on lymphoid development. Differentiated thymic T-cells are exclusively derived from definitive HSCs and can be readily identified by rag1 expression when examined at 4 dpf (Figure S19). Not surprisingly, a significant decrease in rag1 staining was mostly observed in the same set of genes in which we observed a decrease in c-myb staining (a marker for HSCs), namely kalrn1, kalrn2, mfn2, pdia5 and psmd13. In addition, injection of akap10 MO and rcor1 MO, which had no negative impact on the number of c-myb positive cells, resulted in a significant decrease in the number of T lymphocytes.
Analysis of expression patterns for phenotype classification
The large number of genes analyzed and the resultant volume of data acquired can present challenge in understanding and interpreting the results. Hence, we used the information gained from the initial MO knockdown screen to generate a heat-map of phenotype profiles (Figure 3) and cluster genes with similar phenotypic profiles. We then hierarchically positioned candidate genes on the hematopoietic lineage tree and assigned each of them a potential role during hematopoietic differentiation (Figure 4).


Our analysis of the hematopoietic lineage tree revealed a distinct pattern of gene distribution, suggesting two main gene clusters. The first cluster represents a set of genes, namely kalrn1 and -2, mfn2, pdia5, psmd13, rcor1 and wasplb, which upon depletion affect the number of HSCs. The second major cluster represents a set of genes, namely akap10, brf1a, kif1b, satb1 and wasplb, which appear to be essential further down the hematopoietic tree and affect differentiation of both definitive erythrocytes and thrombocytes. These genes have presumed role in HSC fate decisions prior to specification of the thrombocyte and erythrocyte progenitors.
Although the frequency of blood defects observed in our screen was high, the screen was not as well suited for the identification of knockdown phenotypes that result in subtle differences in myeloid lineage cell production or skewing of myeloid lineage differentiation. This is mainly because changes in the number of neutrophils and macrophages arising from HSCs may be undetectable using markers and the developmental time point outlined here. Previous studies have shown that erythroid-myeloid progenitor cells (EMPs) are capable of generating both macrophages and neutrophils and that these blood cells appear in mib zebrafish despite the absence of HSCs [9]. However, even with these caveats, we believe the screening procedure used has proven effective for extracting functional information from a GWAS dataset in a medium-throughput manner.
brd3a is a rate limiting regulator of thrombopoiesis
To gain an additional insight into mechanisms by which these newly discovered genes affect thrombopoiesis, we performed a more extensive analysis of the function of brd3a in hematopoiesis. The bromodomain and extra terminal domain (BET) family of proteins, including BRD2, BRD3, and BRD4, are evolutionally conserved and play a key role in many cellular processes by controlling the assembly of histone acetylation-dependent chromatin complexes [10]. To further confirm that the defects observed in the brd3a depleted embryos resulted from loss of brd3a, in vitro–transcribed RNA encoding human BRD3 (hBRD3) was injected into 1-cell stage embryos. Live confocal imaging of zebrafish embryos injected with hBRD3-GFP confirmed that hBRD3 binds to mitotic chromosomes (Figure 5A), a feature previously reported for BET family proteins i.e. BRD2, BRD3 and BRD4 [11]–[13]. Expression of hBRD3 in brd3a MO injected embryos resulted in partial but statistically significant rescue of the number of thrombocytes demonstrating that brd3a MO used in this study exerted a specific effect (Figure 5B, C).

brd3a is essential for differentiation and not maintenance of thrombocytes
Morpholinos do not allow gene-specific perturbation to be carried out with temporal resolution, which is a disadvantage when dissecting the precise role of a selected gene in hematopoiesis. A number of studies reported that compounds targeting BET proteins might be used to manipulate hematopoietic development for exploratory or therapeutic purposes [14]–[16]. The BET family inhibitor, thieno-triazolo-1,4-diazepine ((+)-JQ1 in short) is a potent, highly specific inhibitor which displaces BET proteins from chromatin by competitively binding to the acetyl-lysine recognition pocket of BET bromodomains [17], [18]. Thus, we evaluated the pharmacological impact of (+)-JQ1 on zebrafish development and thrombopoiesis. Exposure of zebrafish embryos to (+)-JQ1 disrupted the chromatin occupancy of hBRD3-GFP confirming the efficacy of the inhibitor (Figure S20 A–C).
We next incubated embryos from 6 hpf in various concentrations of (+)-JQ1 and (−)-JQ1 (stereoisomer which has no appreciable affinity to BET bromodomains) [17] as a control (Figure S21). Exposure of zebrafish embryos to 1 µg/ml (+)-JQ1 resulted in complete mortality by 24 hpf whereas the (−)-JQ1 enantiomer showed no observable effect on embryo development (Figure S21). This early embryonic death of zebrafish embryos was not surprising considering that knockout of Brd2 or Brd4 in mice results in embryonic lethality, indicating an important role of these two proteins in embryonic development [19], [20]. When treated, however, with (+)-JQ1 from 24 hpf, embryos exhibited overall normal development even at the higher concentration (1 µg/ml) of (+)-JQ1 (Figure S21). Although morphologically normal, thrombopoiesis was completely abolished in these embryos (Figure 6 A). Interestingly, the decrease in the number of thrombocytes appeared more prominent in the presence of (+)-JQ1 inhibitor compared to brd3a MO knock down. This opened the possibility that other members of the BET family might be contributing to the observed phenotype. To investigate this further, we performed MO knock down of zebrafish brd2a, brd2b and brd4 and assessed the number of thrombocytes at 3 dpf. Single MO knock down of all three genes resulted in a severe decrease in the number of thrombocytes. These data strongly suggested that, indeed, other members of BET family of proteins (i.e. brd2 and brd4) play an important role in thrombopoiesis (Figure S22 A–C).

Both MO knock down and treatment with (+)-JQ1 inhibitor from 24 hpf resulted in a severe reduction in the number of thrombocytes at 3 dpf, suggesting an essential role for brd3a in the differentiation of thrombocytes as opposed to a requirement for their maintenance and survival. To address this question we incubated Tg(cd41:EGFP) embryos with (+)-JQ1 inhibitor starting from 3 dpf, when there is already a considerable number of thrombocytes in CHT, and assessed their number 24 hours later, at 4 dpf. We found that in untreated and (−)-JQ1 treated embryos the number of thrombocytes markedly increased between 3 and 4 dpf. However, in (+)-JQ1 treated embryos we observed no change in the number of thrombocytes (Figure 6C). Moreover we found that (+)-JQ1 had no adverse effect on the number of HSCs during this 24 h period of treatment (Figure 6D). Taken together this strongly suggests that brd3a is important in differentiation of thrombocytes from HSCs, however, once differentiated, brd3a was dispensable for their maintenance and survival.
Discussion
GWAS meta-analysis of platelet size and number has been successful in identifying SNPs associated with the mass (volume x count) of platelets. In contrast with the results of GWAS in common diseases, more than 80% of SNPs associated with hematological traits are localized within 10 Kb of genes providing a sound argument to infer biologically relevant candidate genes [3], [4]. Canonical pathway analyses detected a highly significant over-representation of “core genes” (the sentinel SNP is within the gene or within 10 kb from the gene) in relevant biological functions such as hematological disease, cancer and cell cycle [3]. However, three quarters of regions proximal to the platelet GWAS SNPs harbor unfamiliar genes or known genes not previously implicated in hematopoiesis that merit extensive follow-up analysis. Therefore, this study was set up to address the need for a medium-throughput method in zebrafish to dissect the functional roles of these assumed novel regulators of hematopoiesis.
In total, our screen identified 15 genes (corresponding to 12 human genes) required for distinct stages of specification or differentiation of HSCs in zebrafish. A detailed review of the content of databases and literature revealed limited knowledge about the functional role of Satb1, Rcor1 and Brd3 [21]–[24] in hematopoiesis and for the remaining nine genes our work represents the first study on their putative role in hematopoiesis. Importantly, our results are well in line with some of the findings reported by others. One example is RCOR1 - lineage-restricted deployment of RCOR1 and LSD1 cofactors, through interaction with Gfi proteins, controls hematopoietic differentiation [23]. Knock down of rcor1 in zebrafish resulted in completely blocked differentiation of erythroid, thrombocytic, myeloid and lymphoid lineages. These findings strongly support the hypothesis that the published platelet GWAS [3] enriched for functional regulators of the hematopoiesis and further support previous assumptions that a large proportion of the genes uncovered by the aforementioned GWAS also have a conserved role in zebrafish.
In this study, we followed a two step screening approach: in the first instance, we used the Tg(cd41:EGFP) line in conjunction with a panel of hematopoietic in situ hybridization probes and histochemical staining to create a heat map with distinct “phenotype signatures” of each gene knock-down. We then positioned the candidate genes on the hematopoietic cell lineage tree and assigned them a potential role in hematopoietic differentiation. Interestingly, our screen revealed that, although initially selected based on their effect on the platelet size and/or number, none of the candidates exerted a thrombocyte specific effect. These results should be interpreted within the context of several major differences between the effect of the SNPs and whole embryo MO knock down on hematological traits.
First, the majority of associated SNPs identified in platelet GWAS are in non-transcribed regions and it is likely that the underlying mechanism linking them to the phenotype is regulatory. Thus, the functional effects of SNPs are subtler compared to the knock down of transcripts achieved by MOs in our screening. Secondly, although GWAS provided a list of SNPs associated with the platelet size and number, there is no evidence about the biological processes that link the associated SNP to the phenotype. Indeed, it has been shown that in most cases the reported SNP is not the functional SNP itself but is in linkage disequilibrium with the SNP overlapping a functional region [25]. Experimental evidence shows that open chromatin profiles of megakaryocytes and erythroblasts differ and thus cell type-restricted regions of open chromatin could influence the penetrability of the functional SNP [26], [27] in a lineage specific manner. In contrast, MO knock down in zebrafish is not spatially restricted and thus offers the opportunity to determine the functional role of candidate genes in all blood lineages.
To further verify the hematopoietic role of genes identified in GWAS, we performed a more extensive evaluation of the effect of brd3a on thrombopoiesis. It has been shown that BRD3 interacts with acetylated GATA1 and stabilizes its chromatin occupancy [21]. A pharmacologic compound, JQ1, that occupies the acetyl-lysine binding pockets of Brd3 bromodomains disrupts the BRD3-GATA1 interaction, diminishes the chromatin occupancy of both proteins, and inhibits erythroid maturation [21]. Although GATA1 and BRD3 co-occupancy on GATA1 target genes was also observed in a megakaryocytic cell line [21], the biological relevance of this binding was never confirmed. Here we report on the important role of brd3a in thrombopoiesis. Indeed, knock-down of brd3a with two independent MOs as well as treatment of zebrafish embryos with the JQ1 inhibitor starting from 24 hpf severely reduced the number of thrombocytes in 3 days old embryos. Interestingly, incubation of embryos with JQ1 inhibitor between 3 - and 4 dpf, that is after the onset of thrombopoiesis, did not have any effect on the already differentiated thrombocytes. However, the number of thrombocytes failed to increase compared to control embryos within this 24-hour period. These results strongly support the idea that brd3a is critical for establishing but not maintaining thrombopoietic compartment. Some previous studies suggest that BRD3, as well as some other mitotically retained factors, functions as a molecular “bookmark” by enabling post-mitotic transcription re-initiation of its target genes [13], [28]. It is plausible to assume that a similar mechanism is employed during thrombopoiesis. In that scenario, retention of Brd3 on chromatin during mitosis of thrombocyte precursors or erythroid-thrombocyte progenitor cells would contribute to the maintenance of transcription patterns necessary for establishment of thrombocyte identity. However, further work will be necessary to identify the precise molecular mechanisms by which brd3a exerts its effect on thrombopoiesis. Taken together, our study provides a paradigm of the usefulness of zebrafish for efficient translation of GWAS findings into relevant biological information in an objective and unbiased manner. GWAS have mapped many novel, convincingly associated loci in the proximity of genes where functional significance is expected. So far, functional validation of such genes has remained confined to single gene approaches. Here we utilized the powerful genetics and translucency of zebrafish larvae to undertake a medium-throughput screen of genes implicated in human hematopoietic variation. The results of this screen will help us to tentatively place novel genes in molecular pathways and thus close the ever-increasing knowledge gap on the biological function of gene candidates identified by genomic technologies.
Materials and Methods
Ethics statement
The maintenance, embryo collection and staging of the wild type (Tubingen Long Fin) and transgenic zebrafish lines (Tg(cd41:GFP), Tg(fli1:GFP), Tg(c-myb:EGFP) were performed in accordance with EU regulations on laboratory animals, as previously described [29], [30].
Embryo injections
Morpholinos (GeneTools, LLC) were re-suspended in sterile water and diluted to chosen concentration. Approximately 1 nl was injected into embryos at 1 - to 2-cell stage. MOs used are summarized in Table S2.
Plasmid with full-length human hBRD3 cDNA was purchased from Source Bioscience (Nottingham, UK). hBRD3 was cloned into pCS2 expression vector using gene-specific primers: AATTACATCGATACCATGTCCACCGCCACGACAGT (forward) and CCCGAGTCTAGACTATTCTGAGTCACTGCTGTCAGA (reverse) and AAATTAGAATTCACCATGTCCACCGCCACGACAGT (forward) and ATGTTAACCGGTAGTTCTGAGTCACTGCTGTCAGA (reverse) for cloning into the pCS2-EGFP vector. Restriction enzyme sites (ClaI/XbaI and EcoRI/AgeI respectively) used for cloning are underlined. Zebrafish full-length rcor1 cDNA was cloned into pCS2 vector using gene-specific primers: GTTATAGAATTCATGCCCGCAATGTTAGAGAAG (forward) and AGGCGCCTCGAGTCAGGAAACCGAAGGGTTCTG (reverse). Restriction enzyme sites (EcoRI and XhoI, respectively) are underlined.
hBRD3, hBRD3-GFP and rcor1 mRNA was synthesized with mMESSAGE mMACHINE kit (Ambion), according to the manufacturer's protocol. In the rescue experiment, 100 pg of hBRD3 mRNA or 125 pg rcor1 RNA was injected into the one cell stage control and MO-injected Tg(cd41:EGFP) embryos. In the hBRD3 localization experiment, 300 pg of hBRD3-GFP mRNA was injected into Tubingen Long Fin embryos at 1-cell stage.
Reverse Transcription-Polymerase Chain Reaction (RT-PCR)
In order to verify the effectiveness of MOs in affecting their target transcripts, RT-PCR was performed. RNA was subjected to reverse transcription using Superscript II Reverse Transcriptase (Invitrogen). PCR was performed using gene-specific primers (listed in Table S2) and KOD Hot Start DNA Polymerase (Novagen).
Whole mount in situ hybridisation
In situ hybridization was performed with riboprobes specific for c-myb, αe1-globin, mpx, mpeg and rag1 as previously described [31], as well as for brd3a, brf1b, kalrn1, waspla and wdr66. Primers used for PCR amplification of candidate genes for probe synthesis are listed in Table S3. Photomicrographs were taken with a Zeiss camera AxioCam HRC attached to a LeicaMZ16 FA dissecting microscope (Leica Microsystems, Germany) using the AxioVision software.
O-dianisidine staining
O-dianisidine staining was performed as previously described [32].
Sudan Black staining
Sudan Black staining was performed as previously described [33].
Clotting time assay
Clotting time assay was performed as previously described [7]. In short, 5 dpf larvae were anaesthetized in 0.02% tricaine solution in embryonic water and transferred onto a Petri dish in a small drop of liquid. Caudal veins of the larvae were wounded with the tip of a Microlance needle (0.4 mm×13 mm, Becton Dickinson) in the anal area. For each larva the time passing between inflicting the wound and the stop of bleeding was recorded.
Genotyping
Genomic DNA was isolated from 5 dpf larvae, which were individually loaded into wells of a 96-well plate. Fish were incubated in 25 µl of lysis buffer (25 mM NaOH with 0.2 mM EDTA) at 95°C for 30 min. Afterwards 25 µl of neutralization buffer (40 mM Tris-HCl) was added. Genotyping was carried out using the KASP genotyping assays (KBioscience). Each reaction consisted of 4 µl of genomic DNA and 5 µl of PCR mix, according to the manufacturer's protocol (KBioscience). PCR products were analyzed using PHERAstar plus (BMGlabtech) and KlusterCaller software (KBioscience).
Imaging
Images were captured with the use of a Leica TCS SP5 confocal microscope with Leica LAS AF software (Leica Microsystems), using a 40× immersion lens or with Axio Zoom.V16 fluorescent microscope with AxioCam MRm camera using 260× magnification.
BET protein inhibitor
Selective inhibitor of human BET family of bromodomain-containing proteins, thieno-triazolo-1,4-diazepine, named JQ1, was kindly provided by Dr Chas Bountra, Structural Genomics Consortium, University of Oxford, Oxford, UK. Both the active inhibitor, (+)-JQ1, and its inactive stereoisomer, (−)-JQ1, were dissolved in dimethylsulfoxide (DMSO) to 10 mg/ml and stored in aliquots at −20°C. For zebrafish embryo treatment, (+)-JQ1 and (−)-JQ1 were diluted in egg water to desired concentration and added to the embryos at ∼6 hpf, 24 hpf or 3 dpf and afterwards replaced daily. Control embryos were incubated in the equal concentration of DMSO in egg water as inhibitor-treated embryos.
Supporting Information
Zdroje
1. EvansDM, FrazerIH, MartinNG (1999) Genetic and environmental causes of variation in basal levels of blood cells. Twin Res 2 : 250–257.
2. GarnerC, TatuT, ReittieJE, LittlewoodT, DarleyJ, et al. (2000) Genetic influences on F cells and other hematologic variables: a twin heritability study. Blood 95 : 342–346.
3. GiegerC, RadhakrishnanA, CvejicA, TangW, PorcuE, et al. (2011) New gene functions in megakaryopoiesis and platelet formation. Nature 480 : 201–208.
4. van der HarstP, ZhangW, Mateo LeachI, RendonA, VerweijN, et al. (2012) Seventy-five genetic loci influencing the human red blood cell. Nature 492 : 369–375.
5. Serbanovic-CanicJ, CvejicA, SoranzoN, StempleDL, OuwehandWH, et al. (2011) Silencing of RhoA nucleotide exchange factor, ARHGEF3, reveals its unexpected role in iron uptake. Blood 118 : 4967–4976.
6. Stachura DL, Traver D (2009) Cellular Dissection of Zebrafish Hematopoiesis. In Essential Zebrafish Methods: Cell and Developmental Biology. Edited by Westerfield M. Elsevier, Inc.
7. JagadeeswaranP, LiuY (1997) A hemophilia model in zebrafish: analysis of hemostasis. Blood Cells Mol Dis 23(1): 52–7.
8. BrownlieA, HerseyC, OatesAC, PawBH, FalickAM, et al. (2003) Characterization of embryonic globin genes of the zebrafish. Dev Biol 255 : 48–61.
9. BertrandJY, CissonJL, StachuraDL, TraverD (2010) Notch signaling distinguishes 2 waves of definitive hematopoiesis in the zebrafish embryo. Blood 115 : 2777–2783.
10. ZengL, ZhouMM (2002) Bromodomain: an acetyl-lysine binding domain. FEBS Lett 513 : 124–128.
11. KannoT, KannoY, SiegelRM, JangMK, LenardoMJ, et al. (2004) Selective recognition of acetylated histones by bromodomain proteins visualized in living cells. Mol Cell 13 : 33–43.
12. DeyA (2003) The double bromodomain protein Brd4 binds to acetylated chromatin during interphase and mitosis. Proc Natl Acad Sci U S A 100 : 8758–8763.
13. KadaukeS, BlobelGA (2012) “Remembering” tissue-specific transcription patterns through mitosis. Cell Cycle 11 : 3911–3912.
14. BelkinaAC, NikolajczykBS, DenisGV (2013) BET Protein Function Is Required for Inflammation: Brd2 Genetic Disruption and BET Inhibitor JQ1 Impair Mouse Macrophage Inflammatory Responses. J Immunol 190 : 3670–3678.
15. ChungC-W, CosteH, WhiteJH, MirguetO, WildeJ, et al. (2011) Discovery and Characterization of Small Molecule Inhibitors of the BET Family Bromodomains. J Med Chem 54 : 3827–3838.
16. OttCJ, KoppN, BirdL, ParanalRM, QiJ, et al. (2012) BET bromodomain inhibition targets both c-Myc and IL7R in high-risk acute lymphoblastic leukemia. Blood 120 : 2843–2852.
17. FilippakopoulosP, QiJ, PicaudS, ShenY, SmithWB, et al. (2010) Selective inhibition of BET bromodomains. Nature 468 : 1067–1073.
18. FilippakopoulosP, PicaudS, FedorovO, KellerM, WrobelM, et al. (2012) Benzodiazepines and benzotriazepines as protein interaction inhibitors targeting bromodomains of the BET family. Bioorgan Med Chem 20 : 1878–1886.
19. HouzelsteinD, BullockSL, LynchDE, GrigorievaEF, WilsonVA, et al. (2002) Growth and Early Postimplantation Defects in Mice Deficient for the Bromodomain-Containing Protein Brd4. Mol Cell Biol 22 : 3794–3802.
20. ShangE, WangX, WenD, GreenbergDA, WolgemuthDJ (2009) Double bromodomain-containing gene Brd2 is essential for embryonic development in mouse. Dev Dyn 2009 238 : 908–917.
21. LamonicaJM, DengW, KadaukeS, CampbellAE, GamsjaegerR, et al. (2011) Bromodomain protein Brd3 associates with acetylated GATA1 to promote its chromatin occupancy at erythroid target genes. Proc Natl Acad Sci U S A 108 : 159–168.
22. NotaniD, GottimukkalaKP, JayaniRS, LimayeAS, DamleMV, et al. (2010) Global Regulator SATB1 Recruits β-Catenin and Regulates TH2 Differentiation in Wnt-Dependent Manner. PLoS Biol 8: e1000296.
23. SalequeS, KimJ, RookeHM, OrkinSH (2007) Epigenetic Regulation of Hematopoietic Differentiation by Gfi-1 and Gfi-1b Is Mediated by the Cofactors CoREST and LSD1. Mol Cell 27 : 562–572.
24. YaoH, GoldmanDC, NechiporukT, KawaneS, McWeeneySK, et al. (2014) The co-repressor Rcor1 is essential for murine erythropoiesis. Blood 123(20): 3175–84.
25. NurnbergST, RendonA, SmethurstPA, PaulDS, VossK, et al. (2012) A GWAS sequence variant for platelet volume marks an alternative DNM3 promoter in megakaryocytes near a MEIS1 binding site. Blood 120(24): 4859–68.
26. PaulDS, NisbetJP, YangT-P, MeachamS, RendonA, et al. (2011) Maps of Open Chromatin Guide the Functional Follow-Up of Genome-Wide Association Signals: Application to Hematological Traits. PLoS Genet 7: e1002139.
27. PaulDS, AlbersCA, RendonA, VossK, StephensJ, et al. (2013) Maps of open chromatin highlight cell type-restricted patterns of regulatory sequence variation at hematological trait loci. Gen Res 23 : 1130–41.
28. KadaukeS, UdugamaMI, PawlickiJM, AchtmanJC, JainDP, et al. (2012) Tissue-Specific Mitotic Bookmarking by Hematopoietic Transcription Factor GATA1. Cell 150 : 725–737.
29. KimmelCB, BallardWW, KimmelSR, UllmannB, SchillingTF (1995) Stages of embryonic development of the zebrafish. Dev Dyn 203 : 253–310.
30. Westerfield M (2000) The zebrafish book. A guide for the laboratory use of zebrafish (Danio rerio). Eugene: University of Oregon Press.
31. ThisseC, ThisseB (2008) High-resolution in situ hybridization to whole-mount zebrafish embryos. Nat Protoc 3 : 59–69.
32. DetrichHW, KieranMW, ChanFY, BaroneLM, YeeK, et al. (1995) Intraembryonic hematopoietic cell migration during vertebrate development. Proc Natl Acad Sci U S A 92 : 10713–10717.
33. SheehanHL, StoreyGW (1947) An improved method of staining leucocyte granules with Sudan Black B. J Pathol Bacteriol 59 : 336–337.
Štítky
Genetika Reprodukční medicínaČlánek vyšel v časopise
PLOS Genetics
2014 Číslo 7
- Kazuistika – Perspektivy využití precizované medicíny v rámci personalizované specifické terapie onkologických pacientů
- Nobelova cena za chemii pro genetické nůžky: Objev, který změní naši budoucnost?
- Technologie na bázi RNA v klinické praxi: od přebarvených petúnií k terapii vzácných a dosud jen obtížně léčitelných chorob u lidí
- „Nepředstavovali jsme si, že náš výzkum povede přímo ke vzniku nových léků, dokonce ještě za našeho života“
- Bezplatné služby pro diagnostiku ATTRv amyloidózy pro kardiology
Nejčtenější v tomto čísle
- Wnt Signaling Interacts with Bmp and Edn1 to Regulate Dorsal-Ventral Patterning and Growth of the Craniofacial Skeleton
- Novel Approach Identifies SNPs in and with Evidence for Parent-of-Origin Effect on Body Mass Index
- Hypoxia Adaptations in the Grey Wolf () from Qinghai-Tibet Plateau
- DNA Topoisomerase 1α Promotes Transcriptional Silencing of Transposable Elements through DNA Methylation and Histone Lysine 9 Dimethylation in
Zvyšte si kvalifikaci online z pohodlí domova
Mazová zátka a její řešení
nový kurzVšechny kurzy