
The Genomic Landscape of the Ewing Sarcoma Family of Tumors Reveals Recurrent Mutation
The Ewing sarcoma family of tumors is a group of aggressive cancers that primarily affects the pediatric and young adult population. Increasingly, genomics are being used to better define the disease biology and to identify targets for therapy in many cancer types. Here, we report one of the first and largest genomic studies to date in the Ewing sarcoma family of tumors. Using a combination of modern sequencing techniques in >100 samples, we discover that Ewing sarcomas have a genome that is less complex compared to most cancer types previously surveyed. We find that this cancer is frequently affected by mutations in STAG2, a gene that has recently gained attention due to its importance in the biology of several cancer types. We show that Ewing sarcoma patients whose tumors are affected by STAG2 loss may have a worse prognosis. Additionally, we identify a subset of tumors that were diagnosed as Ewing sarcoma that appear to be distinct from the majority based on genetic and molecular characteristics. Our findings help to define the genetic landscape of Ewing sarcoma and provide a starting point for improving individualization of diagnosis, prognosis and treatment in this cancer.
Published in the journal:
. PLoS Genet 10(7): e32767. doi:10.1371/journal.pgen.1004475
Category:
Research Article
doi:
https://doi.org/10.1371/journal.pgen.1004475
Summary
The Ewing sarcoma family of tumors is a group of aggressive cancers that primarily affects the pediatric and young adult population. Increasingly, genomics are being used to better define the disease biology and to identify targets for therapy in many cancer types. Here, we report one of the first and largest genomic studies to date in the Ewing sarcoma family of tumors. Using a combination of modern sequencing techniques in >100 samples, we discover that Ewing sarcomas have a genome that is less complex compared to most cancer types previously surveyed. We find that this cancer is frequently affected by mutations in STAG2, a gene that has recently gained attention due to its importance in the biology of several cancer types. We show that Ewing sarcoma patients whose tumors are affected by STAG2 loss may have a worse prognosis. Additionally, we identify a subset of tumors that were diagnosed as Ewing sarcoma that appear to be distinct from the majority based on genetic and molecular characteristics. Our findings help to define the genetic landscape of Ewing sarcoma and provide a starting point for improving individualization of diagnosis, prognosis and treatment in this cancer.
Introduction
The Ewing sarcoma family of tumors (EFT) is a group of malignant small round blue cell tumors that arise in bone or soft tissue. Ewing sarcoma (ES) is the second most common type of primary bone tumor to affect children and adolescents and accounts for 2.9% of all childhood cancers [1]. Despite advances in multidisciplinary treatment leading to improved outcomes over time for localized disease, long term survival remains poor for patients with metastatic or relapsed disease [2], [3]. The pathological diagnosis of Ewing sarcoma is based on the finding of a small round blue cell tumor (SRBCT) that stains for MIC2 (CD99) but has absence of markers that characterize the other pathologically defined SRBCT variants. In larger centers an EWSR1 break-apart probe is used to detect a fusion event involving this gene, but in most cases this test is not required for a diagnosis of Ewing sarcoma. In previous case series, most EFT cases express one of several reciprocal translocations, most commonly t(11;22)(q24;q12) between the amino terminus of the EWSR1 gene and the carboxy terminus of the FLI1 gene found in 85–90% of cases [4], [5]. A number of variant translocations between an alternate member of the TET family of RNA-binding proteins and/or an alternate member of the ETS family of transcription factors have also been described [6]. Additional structural chromosomal changes are frequently found in EFT, including gain of chromosome 1q, 2, 8, and 12, and losses of 9p and 16q [7]–[9]. Recurrent mutations in known tumor suppressor genes have also been described, though with lower frequency. Most notably, homozygous deletions of CDKN2A (which encodes p16INK4a) have been detected in 10 to 30 percent of cases and TP53 mutations in 3 to 14 percent of cases [10]–[19]. Unfortunately, increased understanding of these molecular alterations has yet to produce successful targeted therapies. We therefore performed next generation sequencing on a panel of Ewing sarcoma family tumors and cell lines to identify additional molecular alterations associated with this aggressive cancer.
Results
To gain insight into the genetic landscape of EFT, we first performed whole genome paired-end sequencing of six Ewing sarcoma family tumors and paired constitutional DNA purified from peripheral blood. Sequencing generated an average of 375 Gb of mapped reads per sample to a mean depth of 119X, which allowed for high quality calls covering 97.7% of the genome. Additional sequencing statistics verified that the coverage and parameters used were sufficient to detect most of the sequencing variants in these samples (Table S1). To extend our findings from the whole-genome sequencing cohort, we performed targeted genomic sequencing and/or whole-transcriptome sequencing on a total of 101 EFT samples including 65 tumors and 36 cell lines, with both technologies being utilized in the majority of samples (Table S2).
Ewing sarcoma family tumors have a low density of somatic mutation and structural variation
In the whole genome sequenced samples, we detected an average of 361 somatic mutations per tumor in non-repetitive regions and an average of 6 somatic mutations per tumor in protein coding regions (0.15 mutations/Mb of coding sequence), placing EFT at the low end of the mutation rate spectrum compared to previously reported malignancies [20]. There were no recurrent somatic small variants at the gene level within the 6 samples (Table S3). Somatic structural variants in this cohort were assessed using analysis of paired-end clones with discordant ends plus sequence coverage data from the whole genome sequencing data. Structural variants that involved a copy number change were verified using high-density SNP arrays with high degree of concordance (33/35 = 94.3%). Significant findings include previously reported alterations such as the characteristic EWSR1-FLI1 gene fusion detected in all 6 samples, CDKN2A homozygous deletion in 2 samples, and frequent chromosomal gains and losses. Novel findings include multiple focal areas of loss of heterozygosity, several out-of-frame gene fusions, and a tandem-duplication within the STAG2 gene in one sample (Table S4). There was an average of 17 structural variations per sample and no areas containing a high-density of structural variations (i.e. chromothripsis) were discovered. This number of structural variants is comparatively low relative to other pediatric tumors that have been evaluated by similar methods [21], [22]. In summary, WGS of 6 EFTs revealed the characteristic EWSR1 fusion genes, low mutational burden and structural variations, but two tumors had loss of STAG2 (frameshift variant in EWS2017 and focal tandem duplication in EWS2020), and two had deletion of CDKN2A (EWS2009 and EWS2020) (Figure 1, Figure S1).

Tumors lacking a EWSR1-ETS fusion have distinct molecular characteristics from the remaining majority Ewing sarcoma family tumors
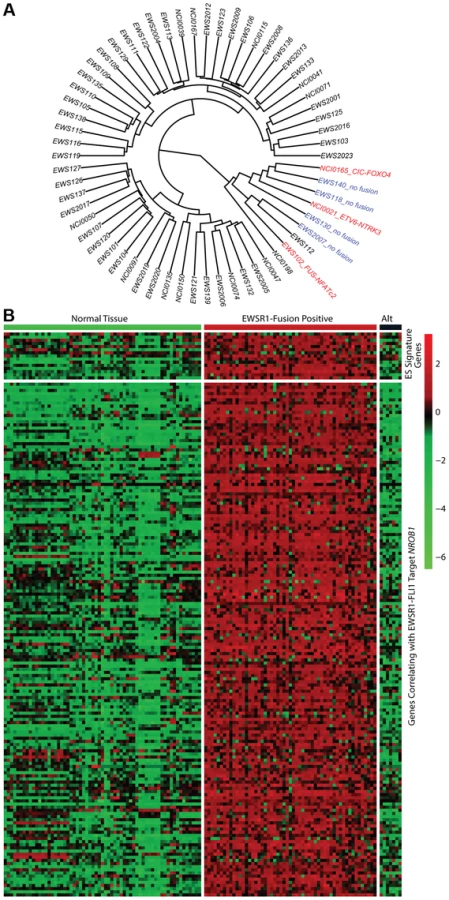
In all 31 cell lines in which RNA sequencing was performed, an EWSR1-ETS family fusion transcript was detected (Table S5). In 62 tumor samples analyzed by RNA sequencing, 55 contained an EWSR1-ETS family fusion including 28 EWSR1-FLI1 type I (51%), 11 EWSR1-FLI1 type II (20%), 11 other EWSR1-FLI1 variants (20%), 3 EWSR1-ERG (5%), and 2 EWSR1-FEV fusions (4%) (Table S5). Of the 7 tumors remaining without a EWSR1-ETS fusion, one sample was found to have a novel FUS-NCATc2 fusion (Figure S2A). Another EWSR1-ETS negative sample contained a novel CIC-FOXO4 fusion (Figure S2B). Both of these novel fusions are in-frame and contain the functional domains of the associated genes important for oncogenic potential. A third sample contained an ETV6-NTRK3 fusion (Figure S2C), an alteration previously reported in association with infantile fibrosarcoma, congenital mesoblastic nephromas, secretory carcinoma of breast, mammary analogue secretory carcinoma of salivary gland, and radiation-associated thyroid cancer [23]–[27]. Hierarchical clustering based on RNA expression show that the 7 tumor samples without a TET-ETS fusion, including the 3 with the above alternate fusions, cluster separately from the vast majority of EWS-ETS fusion-positive samples (Figure 2A). Additionally, these 7 samples show low expression of a collection of EWSR1-FLI1 target genes as well as low expression of a Ewing sarcoma gene signature previously reported by our group [28] (Figure 2B, Figure S3). We therefore consider these samples to be molecularly distinct from EFT and omitted them for the purposes of mutational frequency calculation. The patients with alternate fusions were noted to be clinically aggressive and to have slightly atypical histologic features, also suggesting a difference from classic Ewing sarcoma (Text S1).
Recurrent mutation in tumor suppressor genes STAG2, CDKN2A, and TP53
Through WGS and targeted sequencing we identified recurrent inactivating mutations of STAG2. To extend our genomic analysis we performed capillary sequencing of the 33 coding exons of STAG2 in our tumor panel and in an expanded cell line panel to confirm our sequencing findings and to evaluate for additional mutations. In total, we discovered STAG2 alterations in 30 of 101 (29.7%) of EFT samples including 14 of 65 (21.5%) clinical tumor samples and 16 of 36 (44.4%) cell lines (Table 1, Table S5). Four of these cell lines had previously been reported to harbor STAG2 mutations [29]. Mutations were confirmed to be somatic in all tumor samples in which germline DNA from the same patient was available for comparison (7 tumors). The vast majority of the STAG2 variants are loss of function mutations, including 10 nonsense, 8 frameshift, 3 splice-site, and 5 structural variants, as well as a 5′ deletion previously found to cause absent protein expression (Figure 3A, Table S5) [29]. The remaining three mutations of unclear functional consequence include a tumor with point mutation in the 3′ untranslated (UTR) region, a cell line with a missense mutation, and a cell line with a complex in-frame insertion (1 bp deletion replaced by a 7 bp insertion). Interestingly, 5 samples (4 tumors and 1 cell line) contained the same nonsense mutation, R216X. Mutations of STAG2 (located on the X chromosome) were always heterozygous in samples with female genotype. In all STAG2 mutated cell lines in which RNA sequencing data was available, the altered allele was exclusively expressed (15 cell lines), indicating in the case of female samples that the X chromosome harboring the wild type STAG2 allele was silenced. In tumor samples, all evaluable STAG2 mutated samples showed preferential RNA expression of the mutant allele with varying amounts of wild type allele (median variant allele frequency 0.78), likely due to varying amounts of normal tissue contamination. STAG2 mRNA expression was significantly lower in samples with truncating mutations, likely due to nonsense-mediated decay (Figure S4). Seven additional EFT samples (five tumors and two cell lines) in which STAG2 mutation was not identified by our methods also had very low STAG2 expression comparable to samples with a truncating mutation in STAG2 (Figure S4). Immunohistochemistry (IHC) analysis with an antibody that binds to an epitope at the C-terminus of the STAG2 protein confirmed that EFT tumors with truncating STAG2 mutations have absent STAG2 protein expression, while the admixed non-neoplastic stromal and endothelial cells had robust expression (Figure 4). Tumors with wild-type STAG2 had robust expression of STAG2 protein specifically in cell nuclei as expected (Figure 4). Tissue microarrays (TMA) from an independent cohort of genetically confirmed Ewing sarcoma cases [30] were evaluated for STAG2 expression by IHC. In 210 evaluable cases, loss of STAG2 expression was found in 30 tumors (14.3%), 28 of which demonstrated complete absence of STAG2 protein and 2 of which demonstrated mosaic loss of STAG2 (Figure S5). Western blots performed on the EFT cell line panel demonstrated complete absence of STAG2 protein in 13 cell lines and altered protein in 3 cell lines, concordant with all 14 samples with inactivating mutations and the 2 samples with low RNA expression but no identified mutation (Figure 5, Table S6).


We identified TP53 mutation in 4 of 65 (6.2%) EFT tumor samples and in 23 of 32 (71.9%) EFT cell lines tested. Almost all of the TP53 mutations we discovered are previously reported pathologic variants and/or are truncating mutations (nonsense, splice site, or frameshift) (Figure 3B, Table S5). RNA expression analysis showed that there were 4 additional EFT samples (2 tumors, 2 cell lines) in which TP53 mutation was not identified but had low TP53 expression similar to those with a truncating mutation (Figure S6).
CDKN2A deletion was detected in 9 of 65 (13.8%) EFT tumors and in 16 of 32 (50%) EFT cell lines tested based on DNA and/or RNA sequencing coverage (Figure S7, Figure S8A). The semi-quantitative nature of the PCR reactions combined with varying amounts of normal contamination potentially results in a decreased sensitivity to detect this finding in our tumor samples. Western blots performed on the EFT cell lines demonstrated complete absence of p16INK4A expression in all cell lines in which deletion was detected (Figure 5, Table S6).
In summary, we found that STAG2, TP53 or CDKN2A was altered in 57 of 97 (58.7%) of EFT samples (excluding tumors lacking an EWSR1-ETS fusion) in which these 3 genes were sequenced by at least one technology (Figure 6). This count includes 26 of 65 (40.0%) clinical tumor samples and 31 of 32 (96.9%) cell lines. In the clinical tumor samples, these alterations were typically mutually exclusive in 19 of 26 (65.5%) although several samples had STAG2 mutations in association with TP53 mutations or CDKN2A deletions (Figure 6).

High prevalence of the BRCA2 K3326X polymorphism
In addition to the targeted gene panel that was sequenced, we examined variants in all genes from our RNA sequencing data to look for other potentially oncogenic mutations (Table S7). We discovered several well-established cancer mutations in single samples, including a BRAF V600E mutation (cell line A673), a PI3KCA mutation (cell line ES4) that has been recurrently found in multiple cancer types, and a RAD51 alteration (tumor EWS101) associated with familial breast cancer [31]. In addition we discovered the BRCA2 K3326X polymorphism in 5 samples, 4 from patient tumors and one in a cell line (TC-106). The patient frequency of 4 of 55 (7.3%) EFT tumor samples tested with this finding is statistically higher than expected given the population frequency of 12 of 1094 controls having this polymorphism in the 1000 genomes database (OR 7.1, p = 0.006). In our tumor samples, this polymorphism was mutually exclusive with STAG2, CDKN2A, and TP53 mutations, though overlapped with STAG2 expression loss in one case (Figure 6, Table S5). Germline material was not available to assess whether these findings represent germline or somatic changes in our patients. We discovered one additional BRCA2 missense mutation (S2186T) that is previously unreported in dbSNP and is of uncertain clinical significance (Table S7). We did not identify additional altered genes in our sequencing that were predicted driver mutations.
STAG2 mutation is associated with alterations in the TP53 signaling pathway
A significant relationship was noted between STAG2 loss and TP53 mutational status in the EFT cell lines. In the 16 cell lines with deleterious STAG2 alterations (inactivating mutation or loss of expression), there were 14 (87.5%) with TP53 mutations, all missense. In the 20 remaining cell lines with intact STAG2, only 9 of the 16 (56.3%) evaluated by sequencing contained a TP53 mutation, 5 of which were truncating and 4 of which were missense. Western blots demonstrated that 11 of 16 cell lines with deleterious STAG2 alteration had overexpression of p53 protein (Figure 5, Table S6). Conversely, only 2 of 20 STAG2-intact cell lines had detectable p53. Congruent with these findings, TP53 transcript levels from RNA sequencing were approximately 4-fold higher in cell lines with deleterious STAG2 alteration (log2 FPKM 5.26 vs. 3.47, p = 0.0023) (Figure S9A). To assess the functional consequence of TP53 overexpression related to STAG2 mutation, we assessed the RNA expression levels of CDKN1A (which encodes p21WAF1/CIP1) as a marker of p53 activity. As expected, cell lines with TP53 mutation or expression loss showed lower levels of CDKN1A transcript than TP53 wild type cell lines (log2 FPKM 0.09 vs 4.85, p = 0.0005). STAG2 mutation in the EFT cell lines similarly predicted for decreased CDKN1A transcript expression compared to samples without a detected mutation (log2 FPKM −0.20 vs 2.31, p = 0.018) (Figure S9B). Despite a much lower rate of concordant TP53 mutation, there was also a significant association between STAG2 mutation and decreased CDKN1A transcript expression in the tumor cohort (log2 FPKM 4.08 vs 5.18, p = 0.039) (Figure S9C) and a trend towards increased TP53 expression (log2 FPKM 5.51 vs. 5.38, p = 0.19). In summary, STAG2 mutation was associated with higher TP53 and lower CDKN1A expression in both tumors and cell lines and associated with more frequent missense TP53 mutations in cell lines.
STAG2 loss and clinical outcome in EFT patients
Clinical characteristics of the tissue microarray cohort were evaluated in relation to STAG2 IHC status. The 210 evaluable cases included 154 primary tumors, 46 recurrent/metastatic samples, and 10 tumors with limited clinical information (Table S8). STAG2 expression loss was more common in recurrent/metastatic samples than primary samples, though this difference did not reach statistical significance (21.7% vs. 12.3%, p = 0.15). In 110 primary tumor samples in which clinical outcomes data was available, there was a trend towards a modest decrease in overall survival in patients whose tumors had STAG2 loss (p = 0.10); this evaluation was limited, however, by small numbers of patients with STAG2 negative tumors in the analysis (Figure S10). Clinical information from the sequencing cohort was also analyzed, though survival information was not available. We found no significant differences in age, gender, stage, or primary tumor site (extremity vs. non-extremity) between STAG2 mutated and wild-type samples, though numbers were small in these comparisons (Table S9).
Discussion
To our knowledge, this is the first and largest report to utilize next-generation sequencing technology to characterize the genomic landscape of Ewing sarcoma family of tumors and evaluate for recurrent mutations. We find a very low somatic mutational rate in EFT compared to most previously reported tumor types. We hypothesize this to be the case for multiple reasons. First, it appears that a number of pediatric tumor subtypes tend to have lower mutation rates than those reported in adult cancer [21], [32]–[34]. This may be due in part to the shorter amount of time that the precursor cell has to accumulate passenger mutations during normal cell division but may also represent a fundamental difference common to pediatric cancers. For example, it is possible that pediatric cancers may be more epigenetically driven compared to adult cancers and therefore require a lesser genetic-level contribution to oncogenesis. Second, the low mutation rate of Ewing sarcoma even amongst several reported pediatric cancer types may reflect a fundamental characteristic of fusion-driven cancers. This is in keeping with differences noted between fusion-positive and fusion-negative rhabdomyosarcomas reported by our group and others [22], [35].
Interestingly, we found by RNA sequencing that a significant number (11%) of our tumor samples that were pathologically diagnosed as Ewing sarcoma family tumors lacked a characteristic TET-ETS fusion and appeared to be molecularly distinct from EFT by expression profile. Within this group, we report two novel fusions, FUS-NCATc2 and CIC-FOXO4, that are in-frame and may be oncogenic based on available literature regarding the function of the genes involved. NCATc2 is a non-ETS family transcription factor that has recently been described as an alternate fusion partner to EWSR1 in a small series of “Ewing sarcoma-like” tumors [36], but has not previously been reported to partner with the alternate TET family member FUS. CIC gene rearrangements, particularly CIC-DUX4 fusions, have been described in a group of aggressive undifferentiated small blue round cell sarcomas thought to be distinct from Ewing sarcoma [37]. FOXO4, a forkhead family transcription factor, has been described as an uncommon fusion partner to MLL in acute leukemias [38] and as a rare PAX-gene fusion partner in rhabdomyosarcoma [39]. We discovered one additional fusion, ETV6-NTRK3, which has been reported in other cancer types but not in EFT [23]–[27]. Whether these tumors should be considered as a variant of EFT or a distinct entity is debatable. Our RNA data suggests that these alternate fusion samples, as well as the other TET-ETS fusion negative samples, have a distinct expression pattern from the other EFT tumors and do not match well to a previously reported EFT expression signature [28]. Practically, the rarity of these variants amongst an already uncommon disease will make clinical distinction difficult.
In our survey for genetic alterations, we discovered STAG2 mutations in 21.5% of Ewing sarcoma family tumor samples and 44.4% of EFT cell lines tested, the vast majority of which are inactivating mutations. STAG2 protein detection by IHC in an independent tumor cohort showed STAG2 loss in 14.3% of tumors. While immunohistochemistry will identify all tumors with homozygous deletions and truncating mutations, it will not detect tumors harboring missense mutations, in-frame insertions or deletions, or duplication events. This may help to explain the small discrepancy between our sequencing and immunohistochemical analyses. STAG2 mutation has previously been reported in one Ewing sarcoma tumor and in multiple EFT cell lines [29] and has additionally been reported as a recurrently mutated tumor suppressor gene in other tumor types including glioblastoma, urothelial carcinoma, and acute myeloid leukemia [29], [40]–[44].
Mutations in TP53 and CDKN2A were found in frequencies similar to that previously reported [10]–[19]. In total we found that 40% of EFT clinical tumors and 97% of EFT cell lines have disruption of STAG2, TP53 or CDKN2A. The striking difference in mutational frequencies between tumors and cell lines, particularly in TP53, may be a result of culture conditions and the process of immortalization. Despite these frequency differences, the increased molecular characterization of a large selection of EFT cell lines evaluated in this study provides an invaluable resource for further study.
In addition to the recurrent mutations in STAG2, TP53 and CDKN2A, we found a high prevalence of the BRCA2 K3326X polymorphism, seen in 7.3% of our clinical tumor samples. Occurring in approximately 1% of the general population, this premature stop codon has not been shown to confer an increased risk of breast or ovarian cancer [45] and is classified as a benign variant by the International Agency for Research on Cancer Unclassified Genetic Variants Working Group [46]. In contrast, groups studying lung [47], pancreatic [48], and squamous esophageal cancers [49] have all reported a significantly increased rate of this polymorphism in the germline DNA of patients with these cancer types. In our cohort, as only tumor material was evaluated for this finding, we could not distinguish whether this was a germline or somatic change. Further study is warranted to clarify this aspect and to confirm the association.
STAG2 encodes a subunit of cohesin, a structural protein complex involved in chromosomal organization and so named due to its function of creating “cohesion” between sister chromatids after DNA replication. In addition to STAG2, other recurrent alterations in subunits of this complex have been reported across a number of cancer types [42], [50], [51]. Potentially, the oncologic mechanism for cohesin mutation is disrupted chromosomal segregation during mitosis leading to accumulation of structural mutations and aneuploidy [29]. Though we find EFT to have a low rate of aneuploidy overall in our comprehensively characterized WGS cohort, further work is indicated to clarify whether or not a STAG2 mutation is linked to increased aneuploidy in this tumor histology. Cohesin is also known to play a regulatory role in transcription [52] and is essential for recombinant-based DNA repair mechanisms [53], though it remains to be seen if and how much each of these essential cellular processes are responsible for the oncologic transformation resulting from cohesin deficit. In our evaluation of the cellular impact of STAG2 in EFT, we note a significant intersection of STAG2 mutation with alteration of the TP53 pathway. We find a strong correlation between STAG2 loss and overexpression of p53 in EFT cell lines. We note that this overexpressed p53 protein very frequently contains a pathogenic missense mutation. STAG2 mutated samples also had low RNA expressional levels of CDKN1A (encoding p21WAF1/CIP1), a well-established mediator of p53 tumor suppressor activity [54]. Taken together these data suggest that transcriptional dysregulation of the p53-p21 axis may play a role in STAG2-mediated oncogenesis, at least in EFT cell lines. Though there was less overlap between STAG2 mutation and TP53 mutation in the sequenced tumor cohort, we noted the same pattern of decreased CDKN1A expression in STAG2 mutant samples.
We found STAG2 loss to be more common in cell lines than tumors, more frequent in metastatic or recurrent disease than primary tumors, and to be associated with a trend towards modestly decreased survival. Given the significant percentage of tumors harboring a STAG2 mutation in this cancer type, further investigation into the oncogenic mechanism, clinical consequence, as well as strategies for directed therapy are warranted. For example, preclinical data suggest that cohesin deficiency may increase sensitivity to poly(ADP–ribose) polymerase (PARP) inhibition [55], a drug class that has also been identified by systematic screening to be effective in Ewing sarcoma cell lines [56], and that is undergoing clinical testing in this tumor type. Additionally, future sequencing efforts should be extended to evaluate for alternate routes to cohesin deficiency in EFT.
This study demonstrates that at least a subset of Ewing's sarcoma is not a single hit disease driven solely by a EWS-ETS fusion gene, but rather is a genetically complex disease which harbors additional recurrent genetic alterations that likely contribute to the pathogenesis of EFT. Further studies will be needed to determine if the presence of these additional genetic aberrations will impact the sensitivity/resistance to small molecule inhibitors of EWS-FLI1 or PARP that are currently in development and early phase clinical trials.
Materials and Methods
Tissue processing
All specimens for sequencing were obtained from patients with appropriate consent from the local institutional review board in accordance with the Children's Oncology Group and the National Cancer Institute. Clinical samples were obtained from collaborations with the Cooperative Human Tissue Network, the Children's Hospital of Westmead, Australia, the Children's Oncology Group, and the National Institutes of Health Clinical Center. Tumors were classified as a Ewing sarcoma family tumor by a sarcoma pathologist and the host institution using standing histological techniques. Fifty-two tumors were from the primary disease site and had not been exposed to previous treatment. Fifteen tumors were from recurrent/metastatic sites and for five tumors we lacked this clinical information. Clinical and pathological data for the sequencing cohort are summarized in Table S9. Tumor samples were evaluated by a pathologist for the presence of more than 70% tumor content before DNA/RNA extraction and sequencing. DNA was extracted from qualifying tumor samples and matched blood using either AllPrep Mini (Qiagen) or Agencourt Genefind v2 (Beckman Coulter) DNA extraction kits. RNA was extracted using the RNeasy Micro Kits according to the manufacturer's protocol (Quiagen). Genotyping confirmed independence of these samples.
EFT cell lines
All EFT cell lines used in the study underwent short tandem repeat (STR) profiling for independence testing and all were confirmed to have a unique profile. This characterization is described in detail in Table S10.
EFT tissue microarray
Tissue microarrays were obtained from an independent cohort of genetically confirmed Ewing sarcoma cases [30]. The associated clinical information is summarized in Table S8.
Whole genome sequencing
Whole genome paired-end sequencing was performed using the Complete Genomics platform. Data analysis was accomplished using the CGA tools package v2.0 [57], ANNOVAR v2012-05-25 [58], and Circos v0.52 [59] in build hg19. Somatic variants were determined first by comparison to the matched normal DNA. To remove artifacts specific to the sequencing platform, we eliminated any somatic variants also found in normal samples [50 in-house samples and 69 Complete Genomics samples (http://www.completegenomics.com/public-data/69-Genomes/)]. The Somatic Score (http://media.completegenomics.com/documents/DataFileFormats+Cancer+Pipeline+2.0.pdf) is based on a Bayesian model and takes account of read depth, base call quality, mapping/alignment probabilities, and measured priors on sequencing error rate for both the germline and tumor variants. Verification by Sanger sequencing was performed on all high-confidence somatic variant calls (by default Somatic Score> = −10) affecting protein coding or a splice site (SNVs, substitutions, insertions, deletions), including 55 SNVs. We determined that more stringent somatic score cut-off was required in our cohort to achieve adequate positive predictive value of variants calls, likely due to the low mutation rate in our tumor type. Relative to all high-confidence variant calls we established a sensitivity of 86.7% and specificity of 90.7% for a Somatic Score cut-off of 3. Somatic mutations at or above this score and all verified mutations with lower scores were used for further analysis.
The Complete Genomics somatic copy number segmentation is based on 2-kb windows and utilizes coverage in the matched germline sample for normalization of the tumor sample coverage. Lesser allele fraction (LAF) calculations are based on allele read counts in the tumor at loci that are called heterozygous in the matched germline sample. In addition to default filtering done by the Complete Genomics segmentation algorithm, copy number variants were considered high-confidence if they were either large (> = 10 kb AND containing > = 10 heterozygous SNPs for LAF calculation) OR highly altered (homozygous deletions and focal amplifications > = 5 copies) OR supported by somatic junction(s) (ex: junction detected spanning both ends of a region of LOH). Somatic junctions were called using CGAtools and junctions were filtered by footprints smaller than 70 bases, less than 10 discordant mate pairs, under-represented repeats, and presence in the baseline set of 69 Complete Genomics genomes. We additionally filtered junctions that were present in 50 in-house germline DNA samples that were sequenced on the same platform.
Targeted genomic sequencing
Genomic sequencing was performed using a custom multiplex PCR designed to include the entire coding sequence of the majority of altered genes in the whole-genome sequencing discovery cohort as well as TP53 and in total encompassing 106.3 kB of target region (Table S11). Primers for the targeted sequencing were designed using the Ion Ampliseq designer (Life Technologies) and sequencing was performed on the IonTorrent PGM (Life Technologies). PGM sequencing data was analyzed using Torrent Suite software v3.2 (Life Technologies) and ANNOVAR. Genomic sequencing was performed to an average mean coverage of 311× and variants were called using high-confidence thresholds and filtered to include only those that are protein altering and unreported or rare (population allele frequency <0.005) in the dbSNP and 1000 genomes databases. Mutations of interest were verified by capillary sequencing with a <5% false positive rate. Sequence coverage data was calculated at a position, exon and gene levels to look for structural alterations of the recurrently mutated genes (Figure S8). Coverage data was visualized using the Integrated Genomics Viewer.
RNA sequencing
PolyA selected RNA libraries were prepared for sequencing on the Illumina HiSeq2000 using TruSeq v3 chemistry according to the manufacturer's protocol (Illumina). RNA sequencing was performed with an average yield of 18.6 Gb per sample. Raw reads were mapped using to ENSEMBL reference (hg19) using TopHat2.0 [60]. Fusion analysis was done using TopHat 2.0 and DeFuse 0.6 [61]. The 3 alternated fusions described were confirmed using RT-PCR using flanking primers and Sanger sequencing of the resultant product.
Expression FPKM results were obtained at both gene and transcript level using CuffLinks 2.1 [62]. The log2 FPKM expression results from TopHat mapping were median-normalized using in-house data from 63 normal tissue samples. Exon level expression was calculated using the formula RPKM = (r * 109)/(f * R), with r being the number of reads mapped to an exon, f being the exon length, and R being the total read count of the sample. Hierarchical clustering was performed on normalized log2 FPKM expression values at the gene level using Euclidean distance and Ward agglomeration method.
For variant detection, samtools (http://samtools.sourceforge.net/) is used to count the number of reads uniquely mapped to a position found as variant in DNA sequencing of the same sample or a position of interest based on a mutation being present in the TCGA (http://cancergenome.nih.gov/) or compared to the reference genome hg19 in genes of interest. If there are reads supporting a variant base then the total reads supporting it are counted and variant allele frequency is calculated.
SNP array
SNP arrays were performed on the 6 tumor whole genome sequencing cohort to confirm copy number findings. SNP array analysis was conducted on HumanOmni2.5 or HumanOmni5 arrays (Illumina) and the data were analyzed with GenomeStudio (Illumina) and Nexus Copy Number v7 (Biodiscovery Inc.). Copy number state and allelic ratio was manually assessed in all areas of copy number variation and structural variation predicted by WGS and was concordant with WGS prediction in 33/35 (94%).
Sanger sequencing of STAG2 gene
Individual exons of STAG2 were PCR amplified from genomic DNA using the conditions and primer pairs previously described [29]. PCR products were purified using the Exo/SAP method followed by a Sephadex spin column. Sequencing reactions were performed using BigDye v3.1 (Applied Biosystems) using an M13F primer and were analyzed on an Applied Biosystems 3730×l capillary sequencer. Sequences were analyzed using Mutation Surveyor (SoftGenetics). Traces with putative mutations were reamplified and sequenced from both tumor and matched normal DNA from blood when available.
STAG2 immunohistochemistry
A mouse monoclonal antibody to STAG2 from Santa Cruz Biotechnology (clone J-12, sc-81852) was used at a dilution of 1∶100. Immunostaining was performed in an automated immunostainer (Leica Bond-Max) following heat-induced antigen retrieval for 30 min in high pH epitope retrieval buffer (Bond-Max). Primary antibody was applied for 30 min, and Bond-Max polymer was applied for 15 min. Diaminobenzidine was used as the chromogen, and samples were counterstained with hematoxylin. Samples in which both the tumor and normal cells failed to stain for STAG2 were considered antigenically non-viable and were excluded from the analysis.
Western blot analysis
Primary antibodies used were STAG2 clone J-12 (Santa Cruz Biotechnology), p53 clone 7F5 (Cell Signaling), p16 (BD Pharmingen #554079), p21 clone DCS60 (Cell Signaling), and α-tubulin Ab-2 clone DM1A (Neomarkers). Protein was isolated from EFT cell lines in RIPA buffer, resolved by SDS-PAGE, and immunoblotted following standard biochemical techniques.
Statistical testing
For the BRCA2 K3326X polymorphism, a two-tailed Fisher Exact Test was used to calculate p-value for the Odds Ratio significantly different from 1. For RNA expressional analysis, a two-tailed student T Test assuming unequal variances was used to calculate a p-value for difference in population means. For tissue microarrays, the p-value for differences in frequency of STAG2 mutation in primary and recurrent/metastatic samples was calculated using two-tailed Fischer Exact Test. P-value for association of STAG2 expression with overall survival was calculated using univariate analysis.
Supporting Information
Zdroje
1. Howlader N, Noone A, Krapcho M, Garshell J, Neyman N, et al.. (2013) SEER Cancer Statistics Review (1975–2010). Available: http://seer.cancer.gov/csr/1975_2010/. Accessed 11 June 2014.
2. BarkerLM, PendergrassTW, SandersJE, HawkinsDS (2005) Survival after recurrence of Ewing's sarcoma family of tumors. J Clin Oncol 23 : 4354–4362.
3. EsiashviliN, GoodmanM, MarcusRBJr (2008) Changes in incidence and survival of Ewing sarcoma patients over the past 3 decades: Surveillance Epidemiology and End Results data. J Pediatr Hematol Oncol 30 : 425–430.
4. DelattreO, ZucmanJ, MelotT, GarauXS, ZuckerJM, et al. (1994) The Ewing family of tumors–a subgroup of small-round-cell tumors defined by specific chimeric transcripts. N Engl J Med 331 : 294–299.
5. Turc-CarelC, AuriasA, MugneretF, LizardS, SidanerI, et al. (1988) Chromosomes in Ewing's sarcoma. I. An evaluation of 85 cases of remarkable consistency of t(11;22)(q24;q12). Cancer Genet Cytogenet 32 : 229–238.
6. SankarS, LessnickSL (2011) Promiscuous partnerships in Ewing's sarcoma. Cancer Genet 204 : 351–365.
7. ArmengolG, TarkkanenM, VirolainenM, ForusA, ValleJ, et al. (1997) Recurrent gains of 1q, 8 and 12 in the Ewing family of tumours by comparative genomic hybridization. Br J Cancer 75 : 1403–1409.
8. SavolaS, KlamiA, TripathiA, NiiniT, SerraM, et al. (2009) Combined use of expression and CGH arrays pinpoints novel candidate genes in Ewing sarcoma family of tumors. BMC Cancer 9 : 17.
9. HattingerCM, RumplerS, StrehlS, AmbrosIM, ZoubekA, et al. (1999) Prognostic impact of deletions at 1p36 and numerical aberrations in Ewing tumors. Genes Chromosomes Cancer 24 : 243–254.
10. HamelinR, ZucmanJ, MelotT, DelattreO, ThomasG (1994) p53 mutations in human tumors with chimeric EWS/FLI-1 genes. Int J Cancer 57 : 336–340.
11. KovarH, AuingerA, JugG, AryeeD, ZoubekA, et al. (1993) Narrow spectrum of infrequent p53 mutations and absence of MDM2 amplification in Ewing tumours. Oncogene 8 : 2683–2690.
12. KovarH, JugG, AryeeDN, ZoubekA, AmbrosP, et al. (1997) Among genes involved in the RB dependent cell cycle regulatory cascade, the p16 tumor suppressor gene is frequently lost in the Ewing family of tumors. Oncogene 15 : 2225–2232.
13. BrownhillSC, TaylorC, BurchillSA (2007) Chromosome 9p21 gene copy number and prognostic significance of p16 in ESFT. Br J Cancer 96 : 1914–1923.
14. HuangHY, IlleiPB, ZhaoZ, MazumdarM, HuvosAG, et al. (2005) Ewing sarcomas with p53 mutation or p16/p14ARF homozygous deletion: a highly lethal subset associated with poor chemoresponse. J Clin Oncol 23 : 548–558.
15. Lopez-GuerreroJA, PellinA, NogueraR, CardaC, Llombart-BoschA (2001) Molecular analysis of the 9p21 locus and p53 genes in Ewing family tumors. Lab Invest 81 : 803–814.
16. WeiG, AntonescuCR, de AlavaE, LeungD, HuvosAG, et al. (2000) Prognostic impact of INK4A deletion in Ewing sarcoma. Cancer 89 : 793–799.
17. TsuchiyaT, SekineK, HinoharaS, NamikiT, NoboriT, et al. (2000) Analysis of the p16INK4, p14ARF, p15, TP53, and MDM2 genes and their prognostic implications in osteosarcoma and Ewing sarcoma. Cancer Genet Cytogenet 120 : 91–98.
18. ParkYK, ChiSG, KimYW, ParkHR, UnniKK (2001) P53 mutations in Ewing's sarcoma. Oncol Rep 8 : 533–537.
19. KomuroH, HayashiY, KawamuraM, HayashiK, KanekoY, et al. (1993) Mutations of the p53 gene are involved in Ewing's sarcomas but not in neuroblastomas. Cancer Res 53 : 5284–5288.
20. KanZ, JaiswalBS, StinsonJ, JanakiramanV, BhattD, et al. (2010) Diverse somatic mutation patterns and pathway alterations in human cancers. Nature 466 : 869–873.
21. MolenaarJJ, KosterJ, ZwijnenburgDA, van SluisP, ValentijnLJ, et al. (2012) Sequencing of neuroblastoma identifies chromothripsis and defects in neuritogenesis genes. Nature 483 : 589–593.
22. ShernJF, ChenL, ChmieleckiJ, WeiJS, PatidarR, et al. (2014) Comprehensive genomic analysis of rhabdomyosarcoma reveals a landscape of alterations affecting a common genetic axis in fusion-positive and fusion-negative tumors. Cancer Discov 4 : 216–231.
23. KnezevichSR, McFaddenDE, TaoW, LimJF, SorensenPH (1998) A novel ETV6-NTRK3 gene fusion in congenital fibrosarcoma. Nat Genet 18 : 184–187.
24. RubinBP, ChenCJ, MorganTW, XiaoS, GrierHE, et al. (1998) Congenital mesoblastic nephroma t(12;15) is associated with ETV6-NTRK3 gene fusion: cytogenetic and molecular relationship to congenital (infantile) fibrosarcoma. Am J Pathol 153 : 1451–1458.
25. TognonC, KnezevichSR, HuntsmanD, RoskelleyCD, MelnykN, et al. (2002) Expression of the ETV6-NTRK3 gene fusion as a primary event in human secretory breast carcinoma. Cancer Cell 2 : 367–376.
26. SkalovaA, VanecekT, SimaR, LacoJ, WeinrebI, et al. (2010) Mammary analogue secretory carcinoma of salivary glands, containing the ETV6-NTRK3 fusion gene: a hitherto undescribed salivary gland tumor entity. Am J Surg Pathol 34 : 599–608.
27. Leeman-NeillRJ, KellyLM, LiuP, BrennerAV, LittleMP, et al. (2013) ETV6-NTRK3 is a common chromosomal rearrangement in radiation-associated thyroid cancer. Cancer 120 : 799–807.
28. ChenQR, VansantG, OadesK, PickeringM, WeiJS, et al. (2007) Diagnosis of the small round blue cell tumors using multiplex polymerase chain reaction. J Mol Diagn 9 : 80–88.
29. SolomonDA, KimT, Diaz-MartinezLA, FairJ, ElkahlounAG, et al. (2011) Mutational inactivation of STAG2 causes aneuploidy in human cancer. Science 333 : 1039–1043.
30. Lopez-GuerreroJA, MachadoI, ScotlandiK, NogueraR, PellinA, et al. (2011) Clinicopathological significance of cell cycle regulation markers in a large series of genetically confirmed Ewing's sarcoma family of tumors. Int J Cancer 128 : 1139–1150.
31. KatoM, YanoK, MatsuoF, SaitoH, KatagiriT, et al. (2000) Identification of Rad51 alteration in patients with bilateral breast cancer. J Hum Genet 45 : 133–137.
32. ZhangJ, BenaventeCA, McEvoyJ, Flores-OteroJ, DingL, et al. (2012) A novel retinoblastoma therapy from genomic and epigenetic analyses. Nature 481 : 329–334.
33. LeeRS, StewartC, CarterSL, AmbrogioL, CibulskisK, et al. (2012) A remarkably simple genome underlies highly malignant pediatric rhabdoid cancers. J Clin Invest 122 : 2983–2988.
34. HasselblattM, IskenS, LingeA, EikmeierK, JeibmannA, et al. (2013) High-resolution genomic analysis suggests the absence of recurrent genomic alterations other than SMARCB1 aberrations in atypical teratoid/rhabdoid tumors. Genes Chromosomes Cancer 52 : 185–190.
35. ChenX, StewartE, ShelatAA, QuC, BahramiA, et al. (2013) Targeting oxidative stress in embryonal rhabdomyosarcoma. Cancer Cell 24 : 710–724.
36. SzuhaiK, IjszengaM, de JongD, KarseladzeA, TankeHJ, et al. (2009) The NFATc2 gene is involved in a novel cloned translocation in a Ewing sarcoma variant that couples its function in immunology to oncology. Clin Cancer Res 15 : 2259–2268.
37. ItalianoA, SungYS, ZhangL, SingerS, MakiRG, et al. (2012) High prevalence of CIC fusion with double-homeobox (DUX4) transcription factors in EWSR1-negative undifferentiated small blue round cell sarcomas. Genes Chromosomes Cancer 51 : 207–218.
38. BorkhardtA, ReppR, HaasOA, LeisT, HarbottJ, et al. (1997) Cloning and characterization of AFX, the gene that fuses to MLL in acute leukemias with a t(X;11)(q13;q23). Oncogene 14 : 195–202.
39. BarrFG, QualmanSJ, MacrisMH, MelnykN, LawlorER, et al. (2002) Genetic heterogeneity in the alveolar rhabdomyosarcoma subset without typical gene fusions. Cancer Res 62 : 4704–4710.
40. WalterMJ, ShenD, ShaoJ, DingL, WhiteBS, et al. (2013) Clonal diversity of recurrently mutated genes in myelodysplastic syndromes. Leukemia 27 : 1275–1282.
41. SolomonDA, KimJS, BondarukJ, ShariatSF, WangZF, et al. (2013) Frequent truncating mutations of STAG2 in bladder cancer. Nat Genet 45 : 1428–1430.
42. KonA, ShihLY, MinaminoM, SanadaM, ShiraishiY, et al. (2013) Recurrent mutations in multiple components of the cohesin complex in myeloid neoplasms. Nat Genet 45 : 1232–1237.
43. Balbas-MartinezC, SagreraA, Carrillo-de-Santa-PauE, EarlJ, MarquezM, et al. (2013) Recurrent inactivation of STAG2 in bladder cancer is not associated with aneuploidy. Nat Genet 45 : 1464–1469.
44. GuoG, SunX, ChenC, WuS, HuangP, et al. (2013) Whole-genome and whole-exome sequencing of bladder cancer identifies frequent alterations in genes involved in sister chromatid cohesion and segregation. Nat Genet 45 : 1459–1463.
45. MazoyerS, DunningAM, SerovaO, DeardenJ, PugetN, et al. (1996) A polymorphic stop codon in BRCA2. Nat Genet 14 : 253–254.
46. PlonSE, EcclesDM, EastonD, FoulkesWD, GenuardiM, et al. (2008) Sequence variant classification and reporting: recommendations for improving the interpretation of cancer susceptibility genetic test results. Hum Mutat 29 : 1282–1291.
47. RuddMF, WebbEL, MatakidouA, SellickGS, WilliamsRD, et al. (2006) Variants in the GH-IGF axis confer susceptibility to lung cancer. Genome Res 16 : 693–701.
48. MartinST, MatsubayashiH, RogersCD, PhilipsJ, CouchFJ, et al. (2005) Increased prevalence of the BRCA2 polymorphic stop codon K3326X among individuals with familial pancreatic cancer. Oncogene 24 : 3652–3656.
49. AkbariMR, MalekzadehR, NasrollahzadehD, AmanianD, IslamiF, et al. (2008) Germline BRCA2 mutations and the risk of esophageal squamous cell carcinoma. Oncogene 27 : 1290–1296.
50. Cancer Genome Atlas Research N (2013) Genomic and epigenomic landscapes of adult de novo acute myeloid leukemia. N Engl J Med 368 : 2059–2074.
51. KimMS, AnCH, YooNJ, LeeSH (2013) Frameshift mutations of chromosome cohesion-related genes SGOL1 and PDS5B in gastric and colorectal cancers with high microsatellite instability. Hum Pathol 44 : 2234–2240.
52. CuadradoA, RemeseiroS, Gomez-LopezG, PisanoDG, LosadaA (2012) The specific contributions of cohesin-SA1 to cohesion and gene expression: implications for cancer and development. Cell Cycle 11 : 2233–2238.
53. BauerschmidtC, ArrichielloC, Burdak-RothkammS, WoodcockM, HillMA, et al. (2010) Cohesin promotes the repair of ionizing radiation-induced DNA double-strand breaks in replicated chromatin. Nucleic Acids Res 38 : 477–487.
54. el-DeiryWS, TokinoT, VelculescuVE, LevyDB, ParsonsR, et al. (1993) WAF1, a potential mediator of p53 tumor suppression. Cell 75 : 817–825.
55. McLellanJL, O'NeilNJ, BarrettI, FerreeE, van PelDM, et al. (2012) Synthetic lethality of cohesins with PARPs and replication fork mediators. PLoS Genet 8: e1002574.
56. GarnettMJ, EdelmanEJ, HeidornSJ, GreenmanCD, DasturA, et al. (2012) Systematic identification of genomic markers of drug sensitivity in cancer cells. Nature 483 : 570–575.
57. DrmanacR, SparksAB, CallowMJ, HalpernAL, BurnsNL, et al. (2010) Human genome sequencing using unchained base reads on self-assembling DNA nanoarrays. Science 327 : 78–81.
58. WangK, LiM, HakonarsonH (2010) ANNOVAR: functional annotation of genetic variants from high-throughput sequencing data. Nucleic Acids Res 38: e164.
59. KrzywinskiM, ScheinJ, BirolI, ConnorsJ, GascoyneR, et al. (2009) Circos: an information aesthetic for comparative genomics. Genome Res 19 : 1639–1645.
60. KimD, SalzbergSL (2011) TopHat-Fusion: an algorithm for discovery of novel fusion transcripts. Genome Biol 12: R72.
61. McPhersonA, HormozdiariF, ZayedA, GiulianyR, HaG, et al. (2011) deFuse: an algorithm for gene fusion discovery in tumor RNA-Seq data. PLoS Comput Biol 7: e1001138.
62. TrapnellC, WilliamsBA, PerteaG, MortazaviA, KwanG, et al. (2010) Transcript assembly and quantification by RNA-Seq reveals unannotated transcripts and isoform switching during cell differentiation. Nat Biotechnol 28 : 511–515.
Štítky
Genetika Reprodukční medicínaČlánek vyšel v časopise
PLOS Genetics
2014 Číslo 7
- Kazuistika – Perspektivy využití precizované medicíny v rámci personalizované specifické terapie onkologických pacientů
- Nobelova cena za chemii pro genetické nůžky: Objev, který změní naši budoucnost?
- Technologie na bázi RNA v klinické praxi: od přebarvených petúnií k terapii vzácných a dosud jen obtížně léčitelných chorob u lidí
- „Nepředstavovali jsme si, že náš výzkum povede přímo ke vzniku nových léků, dokonce ještě za našeho života“
- Bezplatné služby pro diagnostiku ATTRv amyloidózy pro kardiology
Nejčtenější v tomto čísle
- Wnt Signaling Interacts with Bmp and Edn1 to Regulate Dorsal-Ventral Patterning and Growth of the Craniofacial Skeleton
- Novel Approach Identifies SNPs in and with Evidence for Parent-of-Origin Effect on Body Mass Index
- Hypoxia Adaptations in the Grey Wolf () from Qinghai-Tibet Plateau
- DNA Topoisomerase 1α Promotes Transcriptional Silencing of Transposable Elements through DNA Methylation and Histone Lysine 9 Dimethylation in
Zvyšte si kvalifikaci online z pohodlí domova
Mazová zátka a její řešení
nový kurzVšechny kurzy