
Distinct Translational Control in CD4 T Cell Subsets
Regulatory T cells expressing the transcription factor Foxp3 play indispensable roles for the induction and maintenance of immunological self-tolerance and immune homeostasis. Genome-wide mRNA expression studies have defined canonical signatures of T cell subsets. Changes in steady-state mRNA levels, however, often do not reflect those of corresponding proteins due to post-transcriptional mechanisms including mRNA translation. Here, we unveil a unique translational signature, contrasting CD4+Foxp3+ regulatory T (TFoxp3+) and CD4+Foxp3− non-regulatory T (TFoxp3−) cells, which imprints subset-specific protein expression. We further show that translation of eukaryotic translation initiation factor 4E (eIF4E) is induced during T cell activation and, in turn, regulates translation of cell cycle related mRNAs and proliferation in both TFoxp3− and TFoxp3+ cells. Unexpectedly, eIF4E also affects Foxp3 expression and thereby lineage identity. Thus, mRNA–specific translational control directs both common and distinct cellular processes in CD4+ T cell subsets.
Published in the journal:
. PLoS Genet 9(5): e32767. doi:10.1371/journal.pgen.1003494
Category:
Research Article
doi:
https://doi.org/10.1371/journal.pgen.1003494
Summary
Regulatory T cells expressing the transcription factor Foxp3 play indispensable roles for the induction and maintenance of immunological self-tolerance and immune homeostasis. Genome-wide mRNA expression studies have defined canonical signatures of T cell subsets. Changes in steady-state mRNA levels, however, often do not reflect those of corresponding proteins due to post-transcriptional mechanisms including mRNA translation. Here, we unveil a unique translational signature, contrasting CD4+Foxp3+ regulatory T (TFoxp3+) and CD4+Foxp3− non-regulatory T (TFoxp3−) cells, which imprints subset-specific protein expression. We further show that translation of eukaryotic translation initiation factor 4E (eIF4E) is induced during T cell activation and, in turn, regulates translation of cell cycle related mRNAs and proliferation in both TFoxp3− and TFoxp3+ cells. Unexpectedly, eIF4E also affects Foxp3 expression and thereby lineage identity. Thus, mRNA–specific translational control directs both common and distinct cellular processes in CD4+ T cell subsets.
Introduction
Regulation of gene expression is a multi-step process involving transcriptional, post-transcriptional and post-translational mechanisms. Recent studies have revealed that only 30–40% of steady state protein levels correspond to steady-state mRNA levels and identified mRNA translation as the principal post-transcriptional mechanism [1], [2]. Furthermore, several studies have documented that changes in steady-state mRNA expression-profiles frequently do not correspond to changes in the proteome [3]–[6]. Thus, studies of the translatome (i.e. those mRNAs that are being translated) can potentially help to explain biological processes beyond standard profiling of mRNA levels.
CD4+ T helper (Th)-cell lineage differentiation is defined by expression of specific transcription factors required for subset identity [7]. Foxp3 is a master-switch transcription factor impacting lineage commitment by driving the intra-thymic differentiation of natural CD4+Foxp3+ regulatory T (TFoxp3+) cells, a critical mediator of immune self-tolerance and prevention of excessive inflammatory responses [8], [9]. In the absence of Foxp3, CD4+ T cells can differentiate into a spectrum of inflammatory effector subsets. Furthermore, Foxp3 expression can be up-regulated in CD4+ T cells to generate induced TFoxp3+ (iTFoxp3+) cells [10] in vitro and in vivo. Genome-wide expression profiles using steady-state mRNA samples have defined canonical “TFoxp3+ gene expression signatures” that distinguish primary resting or activated TFoxp3+ from CD4+Foxp3− non-regulatory T (TFoxp3−) cells [11]–[15]. In contrast, studies of mRNA translation in T cells are limited but suggest that T cells augment mRNA-translation and induce translation of specific mRNAs upon activation [16]–[18]. However, such studies compared non-activated to activated total CD4+ T cells, used non genome-wide approaches and/or immortalized cell lines and are thus limited in scope. Hence, the contribution of mRNA translation to establishment of the proteome in different T cell subsets is still largely unknown. We therefore asked whether translational control contributes to establishment of the proteomes in TFoxp3+ and/or TFoxp3− cells.
Here, we report the first genome-wide study on translational control in primary CD4+ TFoxp3+ and TFoxp3− cell subsets directly ex vivo and post-activation in vitro. We reveal substantial mRNA specific quantitative and qualitative differences in the translatome between primary CD4+ T cell subsets. Remarkably, these translationally regulated genes were not previously identified in genome-wide studies of steady-state mRNA and therefore provide hereto unknown information on gene expression programs in T cell subsets. We further identified distinct translational control of the eIF4E-mRNA as a mechanism regulating proliferation in both TFoxp3+ and TFoxp3− cells. Surprisingly, modulation of eIF4E activity also affects T cell lineage identity. Thus, CD4+ T cell subsets exhibit common and specific translational programs that orchestrate expression of genes that direct fundamental cellular processes.
Results
Genome-wide analysis of CD4+ T cell subset translation
Translation is mainly regulated at the initiation step, during which ribosomes are recruited to the mRNA [19]. Efficiently translated mRNAs are therefore associated with a larger number of ribosomes than poorly translated mRNAs. Consequently, an approach to enrich for mRNAs being translated is based on poly(ribo)some preparations where mRNAs from cytoplasmic extracts are sedimented according to the number of ribosomes they bind (Figure 1a).

To determine whether CD4+ T cell subsets regulate gene expression at the level of mRNA translation, we prepared cytosolic and polysome-associated (with ≥3 ribosomes) mRNA from either primary TFoxp3+ or TFoxp3− CD4+ cells (i.e. CD4+ and GFP+ or GFP− cells from Foxp3-GFP reporter knock-in mice) directly ex vivo or 36 h post in vitro activation. Isolation of polysome-associated mRNA in sufficient quantities was technically challenging because TFoxp3+ cells represent a scarce population (5–10% of total CD4+ T cells), and TFoxp3+ and TFoxp3− cells are relatively inactive transcriptionally and translationally ex vivo. Consequently, the UV-absorption profiles of polysomes from TFoxp3+ cells and ex vivo TFoxp3− cells were below the detection limit except for the 80S ribosome peak (Figure 1b). The 80S peak was therefore used to align all polysome RNA preparations to assure that fractions with mRNAs carrying the same number of ribosomes (≥3) were pooled for each sample. Affymetrix GeneChips were then used to quantify genome-wide cytoplasmic and polysome-associated mRNA levels. We assessed the reproducibility of the procedure by comparing gene expression data across all genes and samples using Pearson correlations (Figure 1c). The replicates clustered according to activation state followed by cell type and RNA origin indicating that, despite low mRNA amounts, high quality, reproducible data were obtained.
Translatomes of Foxp3− and Foxp3+ CD4+ T cells are distinct
To assess whether studies of polysome-associated mRNAs provide new information regarding gene expression in CD4+ T cells, we compared polysome-associated to cytosolic mRNA levels in TFoxp3− cells directly ex vivo or post activation in vitro. While polysome-associated mRNA levels largely resembled those of cytosolic mRNAs in the ex vivo condition (although many mRNAs showed moderate differences [2–3-fold]), abundant and dramatic differences (>3-fold) were observed in activated TFoxp3− cells (Figure 2a). Similarly, in TFoxp3+ cells (Figure 2b) differences between levels of polysome-associated and cytosolic mRNAs occurred primarily in the activated condition. Thus, polysome-associated and cytosolic mRNA profiles differ indicating that steady-state mRNA signatures may not faithfully reflect corresponding protein levels for many genes.

As TFoxp3+ and TFoxp3− cells were isolated and treated identically, we expected comparable levels of polysome-associated mRNAs after correcting for differences in cytosolic mRNA levels (i.e. that translation would be regulated uniformly across T cell subsets). To examine this we first compared data from polysome-associated mRNA between TFoxp3+ and TFoxp3− cells (Figure 2c). This analysis showed that TFoxp3+ and TFoxp3− cells vary substantially in terms of which mRNAs are more abundant in polysomes, particularly in activated cells. However, to identify those mRNAs that show differential translational activity, data from polysome-associated mRNAs must be corrected for cytosolic mRNA data to exclude a contribution from e.g. transcription or RNA-stability. We performed such correction using anota [20], [21] and, unexpectedly, found large differences in translational activity of specific mRNAs, especially between activated T cell subsets (Figure 2d). After adjusting the p-values for multiple testing, we found that while differences in translation were modest ex vivo (∼20 mRNAs with a Benjamini-Hochberg false discovery rate [FDR] <30%, corresponding to a nominal p-value<0.004), there were substantial differences in translation between activated T cell subsets (∼200 and 500 mRNAs were translationally activated or suppressed, respectively, in activated TFoxp3+ as compared to TFoxp3− cells [FDR<15%]). These data strongly suggest that translational control plays an important role in regulating gene expression programs in TFoxp3+ and TFoxp3− cell lineages.
A unique translational signature discriminates activated CD4+ T cell subsets
Although we identified specific mRNAs that showed both qualitative and quantitative differences in translational activity between activated T cell subsets, this signature may overlap with previously described steady-state mRNA signatures and hence not shed light into unknown aspects of T cell gene expression. This possibility arises because while we used cytosolic mRNA levels to correct levels of polysome-associated mRNAs, previous studies measured whole cell steady-state mRNA levels (which also reflect nuclear mRNA levels). We therefore compared the activated T cell translational signature to data from 5 independent studies of steady-state mRNA levels [11]–[15], and focused our analysis on comparisons between TFoxp3+ and TFoxp3− cells isolated ex vivo or activated in vitro (Figures S1, S2). Although iTFoxp3+ cells only partially recapitulate the TFoxp3+ steady-state mRNA signature, we also determined whether this signature overlapped with the translation signature (Figure S2) [11], [15], [22]. To assess the overlap with steady-state mRNA signatures we calculated the percentage of mRNAs that were translationally regulated and exhibited differential mRNA levels in any of the studies of steady-state mRNA levels. Only 11% of the mRNAs were shared (Figure S1) and only 5% were identified in at least two steady-state mRNA signatures (7 additional comparisons confirmed this pattern, Figure S2). Although we expect that there will be differences between cytosolic (present study) and whole-cell (previous studies) steady-state mRNA signatures we wanted to validate that the observed distinct translational signature was not entirely driven by a very small overlap between these. We therefore performed the same analysis but compared our signature from cytosolic mRNA to previous datasets on steady-state mRNA. In contrast to the translational signature the signature from cytosolic mRNA showed a considerable overlap (47% or 32% were shared between the present cytosolic and at least one or two steady-state mRNA signatures, respectively) – indicating that the lack of overlap between the translational signature and previous steady-state signatures is not due to that we studied cytoplasmic mRNA. Similar comparisons to the translational signature from ex vivo cells were hampered by that few genes were differentially translated (Figure S3). Thus, the newly identified translational signature discriminating activated CD4+ T cell subsets is unique.
A modular organization of translation in activated CD4+ T cell subsets
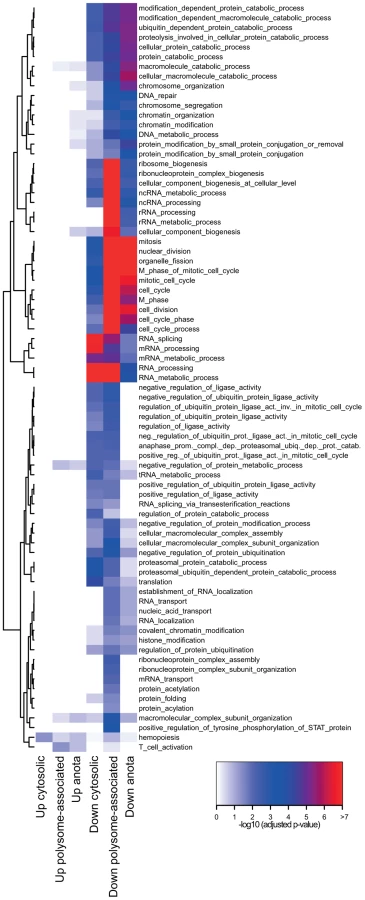
Gene expression programs are commonly viewed as being “modular” where each module consists of several co-regulated genes that control specific cellular functions and several studies indicate the existence of such modules at the post-transcriptional level [23]–[25]. We therefore determined the functional relationship between mRNAs that are translationally regulated in a T cell subset-specific manner. To assess whether there was an overlap of cellular functions targeted by differential translation or cytosolic mRNA levels, we also identified mRNAs that were differentially expressed using data obtained from cytosolic mRNA. As a control, we studied mRNAs that were differentially expressed using data obtained from polysome-associated mRNA (functions regulated at the translational level [significant after anota analysis] should also be regulated using data from polysome-associated mRNA). We separated the resulting mRNAs into those that were activated or suppressed in TFoxp3+ cells as compared to TFoxp3− cells and sought for significantly enriched biological functions in each subset (Figure 3). Few functions were enriched among mRNAs that were translationally more active in activated TFoxp3+ cells, whereas translationally suppressed mRNAs were highly functionally related. When comparing to the enrichment analysis for cytosolic mRNA data, several functions were primarily regulated at the level of translation including ubiquitination, chromatin modification and cell cycle. Such functions were also identified as regulated by translation (FDR<0.05) using an alternative gene set enrichment approach (GAGE) [26]. To further examine these functions, we collected all differentially translated mRNAs annotated to the identified cellular functions and compared their translational activity across all studied conditions (Figure 4a–4c). For each function there was a strong signature regarding both the number of mRNAs involved and the magnitude of differential translation between activated TFoxp3+ and TFoxp3− cells. For the cell cycle cluster, the profile was uniform as most mRNAs were translationally suppressed in activated TFoxp3+ cells as compared to activated TFoxp3− cells. The chromatin modification and ubiquitination clusters contained both translationally activated and suppressed mRNAs in activated TFoxp3+ cells as compared to activated TFoxp3− cells, indicating complex regulation of these functions via translational control. Thus, the translational signature contrasting activated T cell subsets is enriched for mRNAs whose encoded proteins participate in distinct cellular processes.

Differential translation of the eIF4E-mRNA in activated TFoxp3+ and TFoxp3− cells contributes to establishment of their proteomes
Surprisingly, we identified eIF4E as translationally suppressed in activated TFoxp3+ cells as compared to activated TFoxp3− cells. eIF4E is the rate-limiting translation initiation factor that binds to the mRNA 5′-cap structure to recruit mRNA to the ribosome [19]. Activated TFoxp3+ cells showed a 5-fold translational suppression of eIF4E as compared to activated TFoxp3− cells (Figure 5a). Consistently, the levels of eIF4E protein were higher in activated TFoxp3− than in activated TFoxp3+ cells (Figure 5b). eIF4E dramatically regulates translation of mRNAs which encode proteins participating in various cellular processes including cell cycle [27]–[29], apoptosis [30] and innate immunity [31] but only modestly affects global protein synthesis. Thus, parts of the activated T cell translational signature could be mediated by an activation-induced disparity in eIF4E levels between TFoxp3+ and TFoxp3− cells.

eIF4E activity is repressed by the eIF4E-binding proteins (4E-BPs) which compete with eIF4G for binding to eIF4E. Kim et al. recently measured genome-wide translational activity in lungs from wild type (WT) and 4E-BP1/2 double-knockout mice (4E-BPdko) [32]. 4E-BPdko mice would hence be expected to show increased eIF4E activity as compared to WT. Although the impact of increased eIF4E activity likely differs between T cells and lungs, the eIF4E translational signature could nonetheless be partly conserved, reflecting the central role of eIF4E in cellular function. We therefore compared the translational signature contrasting activated CD4+ T cell subsets to the signature contrasting 4E-BPdko and WT lung to determine if part of the activated translational signature could be accounted for by differences in eIF4E activity. Strikingly, more mRNAs showed similar regulation between the two studies than distinct regulation (Figure 5c, binomial test p-value = 1.7e-13). Notably, differential eIF4E levels, as observed between TFoxp3+ and TFoxp3− cells, had larger impact on translation as compared to presence or absence of 4E-BPs (compare log2 fold changes in Figure 5c between T cells and lungs). Thus, a part of the translational signature from activated T cell subsets can be explained by differences in eIF4E levels.
Whereas 87 of the similarly regulated mRNAs were translationally regulated in a manner that paralleled the activity of eIF4E (eIF4E-sensitive), 19 mRNAs showed translational suppression following eIF4E activation. These 19 mRNAs could either represent the noise in the comparison or reflect a phenomenon observed in several studies of translational control downstream of eIF4E that is likely caused by secondary effects [27], [28]. To assess the phenotypic consequence of increased eIF4E levels, we identified enriched functions among the 87 encoded proteins whose translation paralleled eIF4E activity, and identified 17 biological functions, including cell cycle and ubiquitination (Table S1). Further analysis revealed that 25% of the mRNAs in the eIF4E signature were related to the cell cycle and that ubiquitination partly overlapped with the cell cycle cluster as close to one fourth (22%) of the cell cycle genes were annotated also to the ubiquitination system. Indeed, proteins translated from eIF4E-sensitive cell cycle related mRNAs were more highly expressed in activated TFoxp3− cells as compared to activated TFoxp3+ cells (Figure 5b; cyclin E1 is part of the translational signature; translation of Anapc4 paralleled eIF4E activity also in mouse lungs; and cyclin-D3 is eIF4E sensitive [29]). Thus, the translational signature differentiating activated CD4+ T cell subsets exhibits functional and mechanistic modularity.
IL-2 mediated induction of eIF4E and proliferation in TFoxp3+ cells
Although TFoxp3+ cells are suppressive following in vitro activation they are, unlike TFoxp3− cells, anergic to T cell receptor (TCR)-induced proliferation. However, despite their anergy in vitro, TFoxp3+ cells can expand under homeostatic or inflammatory settings in vivo [33]. Because our translational signature from in vitro activated T cells compared suppressive and anergic TFoxp3+ cells to non-suppressive and proliferating TFoxp3− cells the signature will reflect both suppressive activity and anergy. Consistently, although we identified an enrichment of cell cycle related genes as translationally suppressed in TFoxp3+ cells activated in vitro these only represented ∼11% of the mRNAs that were translationally suppressed and only a minute fraction of the ∼200 genes that were translationally activated (Figure 4c) – indicating that most of the translational signature is related to other biological processes differentiating activated TFoxp3− and TFoxp3+ cells. Nevertheless, the correlation between eIF4E level, translational activation of proliferation-related genes (Figure 5c, Table S1) and proliferation raises the possibility that eIF4E may control proliferation in both TFoxp3+ and TFoxp3− cells. To assess the relationship between eIF4E level and TFoxp3+ cell proliferation, we used a condition where the in vitro anergy of TFoxp3+ cells to TCR signals is rescued by relatively higher doses of exogenous IL-2 [34]. A higher concentration of IL-2 induced proliferation of TFoxp3+ cells to a level similar to that observed for TFoxp3− cells (Figure 5d) and strikingly also induced higher eIF4E protein levels (Figure 5e). The increase in eIF4E level was accompanied by increased synthesis of cell cycle related proteins from eIF4E sensitive mRNAs (Figure 5e). Thus, IL-2 abrogates the anergy in TFoxp3+ cells, which is associated with increased eIF4E levels and translation of eIF4E sensitive mRNAs. In aggregate, these data indicate that eIF4E may control expansion of both TFoxp3+ and TFoxp3− subsets.
eIF4E induced proliferation in T cell subsets is independent of 4E-BPs
It was therefore important to examine whether increased eIF4E activity is necessary for induction of TFoxp3+ and/or TFoxp3− cell proliferation in vitro. To this end, we used an eIF4E inhibitor – the pro-nucleotide 4ei-1 (Figure S4), which inhibits binding of eIF4E to the mRNA cap structure and thereby selectively reduces eIF4E activity and eIF4E sensitive translation. 4ei-1 is a stable, non-toxic, pro-nucleotide that, when activated intracellularly by HINT, binds to eIF4E with a Kd of 0.80 µM [35]. Strikingly, 4ei-1 suppressed proliferation and accumulation of activated TFoxp3− and TFoxp3+ cells in a dose-dependent manner (Figure 6a–6b) without affecting viability or IL-2R expression (Figure S5a–S5b). To assess the selectivity of the drug response, we treated cells with a structurally-related eIF4E inhibitor, 4ei-4 (Figure S4), that has a 10-fold lower affinity for eIF4E (Kd = 7.5 µM) as compared to 4ei-1. The inhibitory effect of 4ei-4 on TFoxp3+ and TFoxp3− cell proliferation was substantially lower as compared to 4ei-1 (Figure 6c–6d). The apparent increased anti-proliferative effects of eIF4E inhibition in TFoxp3+ cells compared to TFoxp3− cells (Figure 6a–6b) could be related to the differential eIF4E protein levels in these T cell-subsets (Figure 5e) and/or differential uptake of 4ei-1. Thus induced eIF4E activity is necessary for proliferation in both TFoxp3+ and TFoxp3− cells in vitro.

Although our data indicated that modulation eIF4E activity occurs through translational activation of the eIF4E mRNA leading to induced eIF4E protein levels (Figure 5a–5b), regulation of eIF4E also occurs via 4E-BPs. The 4E-BPs are inhibitors of eIF4E downstream of mTORC1 and are inactivated by mTOR signalling [19]. To examine whether signalling through the 4E-BPs was also necessary for induction of proliferation, we TCR-activated TFoxp3+ or TFoxp3− cells from 4E-BPdko/Foxp3-GFP mice in the presence of low or high IL-2 concentrations. High IL-2 concentration augmented proliferation and correlated with increased expression of the eIF4E protein also in TFoxp3+ cells from 4E-BPdko mice (Figure 6e). Moreover, the proliferative potential of TFoxp3+ and TFoxp3− cells of either genotype was comparable under similar conditions (compare Figure 5d and Figure 6e). The lack of contribution from the 4E-BPs could be explained by their sustained inactive state following in vitro activation-induced signalling through the mTOR pathway. Consequently, 4E-BP deficiency will not further affect eIF4E activity. Thus, translational activation of the eIF4E-mRNA, independent of signalling via the 4E-BPs, is necessary for proliferation of TFoxp3+ or TFoxp3− cells.
Next, we sought to validate that eIF4E levels are also associated with proliferation of TFoxp3+ and TFoxp3− cells in vivo. For this we first established a flow cytometric approach to quantify eIF4E levels during T cell subset proliferative responses and evaluated it in vitro. Such analysis confirmed that in vitro proliferation of both TFoxp3+ and TFoxp3− cells is associated with higher expression of eIF4E and indicated that TFoxp3+ and TFoxp3− cells proliferate and induce eIF4E expression with different kinetics (Figure S6). Flow cytometric analysis of cells isolated ex vivo confirmed that proliferating (Ki-67+) CD4+ T cells exhibit higher eIF4E expression as compared to non-proliferating (Ki-67−) cells (Figure 6f left panel), irrespective of T cell subset (Figure 6f right panel). Finally we examined the relationship between eIF4E expression and proliferation in vivo. To this end, TFoxp3+ or TFoxp3− cells were adoptively transferred into TCRβ−/− recipient mice and isolated from mesenteric (mes) or peripheral (per) lymph nodes (LN) 4 days post-transfer. Both proliferating (eFluor670low) TFoxp3+ and TFoxp3− cells expressed higher eIF4E levels than non-proliferating (eFluor670high) cells (Figure 6g). Intriguingly, and consistent with our findings in vitro (Figure S6), the eIF4E level was higher in proliferating (eFluor670low) TFoxp3− cells as compared to TFoxp3+ cells in mesLN but not in perLN (Figure 6h). This suggests that microenvironmental factors such as the inflammation in mesenteric sites may selectively enhance eIF4E-induced T cell subset expansion. Thus eIF4E level correlates with TFoxp3+ and TFoxp3− cell proliferation in vivo.
eIF4E mediated control of T cell subset identity
Whereas mTOR deficiency blocks differentiation into Th1, Th2 or Th17 cells under respective polarizing conditions, in vitro activation of mTOR deficient TFoxp3− cells induces Foxp3 expression and a suppressive phenotype [36]. Furthermore, inhibition of mTOR in TFoxp3− cells induces Foxp3 expression accompanied by TFoxp3+-like steady-state mRNA and microRNA expression profiles [37]. Given that we identified eIF4E as a component responding to in vitro activation, we asked whether eIF4E activity affects subset identity. To this end, TCR-activated TFoxp3− cells from Foxp3-GFP mice were treated with 4ei-1 and Foxp3 expression was measured by GFP fluorescence. Strikingly, there was a dose-dependent induction of Foxp3 expression in activated TFoxp3− cells upon inhibition of eIF4E activity using 4ei-1 under undifferentiating conditions (Figure 7a). A similar experiment using 4ei-4 resulted in substantially less Foxp3 induction suggesting that strong inhibition of eIF4E activity is required for TFoxp3+ cell differentiation (Figure 7b). Collectively, these data pinpoint to the modulation of eIF4E activity as a key component that affects T cell subset identity.

Discussion
A functional immune system relies on controlled and coordinated induction, and rapid termination of immune responses to avoid erroneous or excessive triggering of pro-inflammatory responses. In this regard, translational control of gene expression appears advantageous as compared to transcriptional control as it provides a fast mode of action that does not require de novo mRNA synthesis. Accordingly, a number of individual mRNAs encoding proteins involved in both innate and adaptive immunity are regulated at the translation step. Expression of IRF7 is normally translationally suppressed to avoid faulty activation of the interferon response [31]; T cell production of the chemokine RANTES/CCL5 is dependent on the transcription factor RFLAT-1 whose expression is translationally regulated [38]; translational suppression of cytokine production is a key mechanism by which self-reactive T cells are kept anergic [39]. Here we show that regulation of mRNA translation plays a central role in the orchestration of genetic programs in TFoxp3+ and TFoxp3− lineages. Activation of TFoxp3+ and TFoxp3− cells leads to selective qualitative and quantitative changes in translational activity of specific mRNAs. Notably, genes in the newly identified translational signature have not been uncovered in previous comparisons of TFoxp3+ and TFoxp3− cells using steady-state mRNA and therefore represent hereto unknown aspects of CD4+ T cell biology. Qualitative and quantitative changes in translation are more pronounced upon T cell activation, in agreement with the notion that translation is often regulated during cellular responses that require rapid and coordinated control of protein expression. However, this does not exclude that individual mRNAs are translationally regulated in the resting state, although the number of these mRNAs appears to be modest as compared to that observed upon activation.
Coordinated regulation of groups of functionally related mRNAs has been postulated to be a common mechanism by which cellular functions are regulated [23]. Here we identified eIF4E as a target for post-transcriptional regulation which, in a modular fashion, activates translation of a set of cell cycle related genes - thereby further exemplifying the complexity of how post-transcriptional circuits affect cellular functions [23]. While the T cell activation-associated dramatic increase in translation was previously suggested to be linked to eIF4E activity [40], we show that eIF4E induction is necessary for proliferation of both TFoxp3+ and TFoxp3− cells in vitro and that eIF4E level correlates with cell proliferation in vivo. We thereby provide important insights into regulation of proliferation of T cell subsets. The translational signature also involved individual genes which may be part of yet undefined post-transcriptional modules but with previously established functions in T cell biology. Foxo1 and Foxo3 [41], [42], both have essential roles in the stability of Foxp3-dependent TFoxp3+ cell lineage commitment [43]. Interestingly, we found translational activation of the Foxo3 mRNA (4-fold) in TFoxp3+ as compared to TFoxp3− cells in the activated condition (Figure S7) indicating that translational control of specific mRNAs may be important for expression of proteins regulating T cell lineage commitment.
A developmental relationship exists between various Th cell effector lineages, suggesting a high degree of functional plasticity which enables cells to switch from one lineage to another [44]. Cytokines including IL-2, TGF-β1 and IL-10 influence the induction or stability of Foxp3 expression in iTFoxp3+ or natural (n) TFoxp3+ cells thereby influencing TFoxp3+ cell fate and the type of immune response. Surprisingly but in agreement with previous studies on mTOR signalling, we identified eIF4E, a downstream target of mTOR signalling, as affecting T cell lineage identity. However, our data do not exclude that other downstream targets of mTOR also contribute to cell lineage identity or that the effects are indirect (e.g. as a result of inhibition of proliferation during cell activation). Thus, further studies will be needed to address whether the effects of eIF4E on cell lineage identity are direct or indirect.
Collectively our data favour a model whereby eIF4E levels could be dynamically regulated in response to changes in the local inflammatory environment thereby providing a direct link between the extracellular micro-environment, gene expression and biological responses.
Materials and Methods
Mice
GFP-Foxp3 knock-in (ki) mice have been described previously [13] and were kindly provided by A. Y. Rudensky (now at Memorial Sloan-Kettering Cancer Centre, NY). For the experiments with 4E-BP deficient T cells, GFP-Foxp3ki mice were crossed to 4E-BPdko mice. TCRβ−/ − mice are αβT cell deficient due to the absence of the gene encoding the TCR βchain. Mice were housed and bred under specific pathogen free conditions according to Canadian Council on Animal Care (CCAC)-approved institutional guidelines at the animal facility of the Department of Microbiology and Immunology; McGill University. Female mice 6–12 weeks old were used for the study.
Isolation of CD4+ T cell subsets and preparation of cytosolic and polysome-associated RNA
Cells isolated from lymph nodes and spleens were stained with PE conjugated CD4 antibody (GK1.5, eBioscience, San Diego, CA) and MACS purified. Thereafter TFoxp3+ and TFoxp3− cells were sorted based on CD4 and GFP-Foxp3 expression using a FACSAria to obtain cell populations of high purity (>97%). For the naïve cells all buffers and media were supplemented with cycloheximide (Sigma, St. Louis, MO) (100 µg/ml). Cycloheximide immobilizes ribosomes on the mRNA and enables separation of polysome-associated RNA. For the activated samples cells were activated for 36 h with plate bound CD3 and CD28 antibodies (BD Bioscience) (5 µg/ml) in the presence of recombinant hIL-2 ([100 U/ml]: a kind gift from the Surgery Brach, NCI/NIH). Cycloheximide (100 µg/ml) was added to the medium at the end of the culture. Cytosolic and polysome-associated RNA were prepared directly ex vivo or post-activation in vitro as described previously [27] and labelled for probing with microarrays using the Ovation Pico WTA system (NuGEN) according to the manufacturer's instructions. All experiments were performed in biological duplicates. For cells isolated directly ex vivo, RNA from two experiments was pooled for each sample.
Data analysis
Data were extracted and normalized using rma implemented in the R package “affy” (www.r-project.org) using updated probe set definitions (ENTREZ_GENE) [45]. Integrity of samples was assessed using 5′ to 3′ ratios and the comparability of the arrays by scaling factors. The reproducibility was assessed by correlation analysis using both Spearman and Pearson correlations in R and visualized using the hclust function in R. All these analyses confirmed good data quality. We used anota-RVM [20] to identify differential translation and applied the following stringent filtering for gene selection to assure correct linear models in anota: slopeP = 0.05; maxSlope = 1.5; minSlope = (−0.5); deltaP = 1; deltaPT = 1 (as defined in the anotaPlotSigGenes function in anota [21]). We used Benjamini-Hochberg multiple testing adjusted p-values (false discovery rates [FDR]) as a cut off for differential translation (FDR<30% for ex vivo cells and FDR<15% for activated cells). RVM was also applied to identify differentially expressed mRNAs between TFoxp3+ and TFoxp3− cells using data from polysome-associated mRNAs and cytosolic mRNA data from the activated condition. The resulting p-values were corrected using the Benjamini-Hochberg multiple testing adjustment method and an FDR <15% was used as cut off. We used GO::Termfinder [46] to identify enriched cellular functions within subsets of differentially regulated mRNAs that were upregulated in TFoxp3+ cells (123 unique mRNAs from the cytosolic mRNA analysis; 226 unique mRNAs from the polysome-associated mRNA analysis; and 251 unique mRNAs that were translationally regulated from anota) or upregulated in TFoxp3− cells (404 unique mRNAs from the cytosolic mRNA analysis; 666 unique mRNAs from the polysome-associated mRNA analysis; and 504 unique mRNAs that were translationally regulated from anota) and collected those functions that showed: >2-fold enrichment; at least 10 annotated and regulated mRNAs; and a FDR <1%. For identification of the eIF4E signature we down-loaded the data set with the accession number GSE17406 from the Gene Expression Omnibus (GEO) and used anota to identify differential translation. mRNAs that were differentially translated in the TFoxp3+ vs. TFoxp3− comparison and showed >1.3-fold difference in the GSE17406 data set were collected and compared to identify an overlapping eIF4E translational signature (the analysis was robust at more restrictive fold changes). The binomial p-value for rejecting the NULL hypothesis (no eIF4E signature) was calculated in R. This dataset has been deposited at the Gene Expression Omnibus (GEO) accession GSE45401.
T cell proliferation
TFoxp3+ and TFoxp3− cells were activated for 72 h with plate-bound anti-CD3 and -CD28 antibodies in the presence of 100 U/ml or 1000 U/ml of recombinant human IL-2 (rhIL-2). Cells were counted before plating and at the end of the culture to determine the fold-increase in cell number. Cell viability was assessed either using a trypan blue or eFluor780 Fixable Viability Dye (eBioscience, San Diego, CA) exclusion assays. For the inhibition of eIF4E activity in vitro, TFoxp3+ and TFoxp3− cells were stained with the Cell Proliferation Dye eFluor 670 (eBioscience, San Diego, CA) and activated as described above in the presence of rhIL-2 (1000 U/ml) and in the presence or absence of selective inhibitors of mRNA cap structure-binding to eIF4E: 4ei-1, a prodrug (pronucleotide phosphoramidate) of 7Bn-GMP (Kd of 0.80 µM), or its control 4ei-4, a prodrug of 7Me-GMP, which has a 10 - fold lower affinity for eIF4E than 7-Bn-GMP (Kd = 7.5 µM). When assaying T cell proliferation in vivo total CD4+ T cells, isolated from LNs of GFP-Foxp3 ki mice, were stained directly ex vivo with a V450-conjugated Ki-67 antibody (B56, BD Biosciences, Missisauga, ON) and a primary eIF4E antibody or an isotype control (Abcam, Cambridge, MA) followed by staining with a PE-conjugated secondary antibody (Abcam, Cambridge, MA). ΔMFI for eIF4E was calculated by subtracting the MFI value for the isotype control from that obtained with the eIF4E antibody. For the experiments involving TCRβ−/ − mice, congenic (Ly5.1+) TFoxp3− (CD4+CD25−) and TFoxp3+ (CD4+CD25+) cells were MACS purified from GFP-Foxp3 ki mice based on CD4 and CD25 expression, subsequently stained with the eFluor 670 Cell Proliferation Dye and adoptively transferred into separate TCRβ−/ − recipient mice. Four days post adoptive transfer donor T cells from perLN and mesLN were stained with eIF4E or isotype control antibodies as described above. TFoxp3− (CD4+GFP−) and TFoxp3+ (CD4+GFP+) cells were analyzed for eIF4E expression and eFluor 670 levels by FACS.
Western blot analysis
Cell lysates were prepared from activated TFoxp3+ and TFoxp3− cells, and western blotting was carried out as previously described [28] using 25 µg of protein per sample. Antibodies against eIF4E (BD Biosciences, Mississauga, ON) and β-actin (AC-15, Sigma, St. Louis, MO) were used at a 1∶1000 and 1∶5000 dilutions, respectively. Antibodies against Anapc4 (Bethyl Laboratories, Montgomery, TX), cyclin-E1 (Abcam, Cambridge, MA), and cyclin-D3 (Cell Signaling Technology, Danvers, MA) were used at 1∶1000 dilution.
Supporting Information
Zdroje
1. SchwanhausserB, BusseD, LiN, DittmarG, SchuchhardtJ, et al. (2011) Global quantification of mammalian gene expression control. Nature 473 : 337–342.
2. VogelC, Abreu RdeS, KoD, LeSY, ShapiroBA, et al. (2010) Sequence signatures and mRNA concentration can explain two-thirds of protein abundance variation in a human cell line. Mol Syst Biol 6 : 400.
3. GygiSP, RochonY, FranzaBR, AebersoldR (1999) Correlation between protein and mRNA abundance in yeast. Mol Cell Biol 19 : 1720–1730.
4. LuR, MarkowetzF, UnwinRD, LeekJT, AiroldiEM, et al. (2009) Systems-level dynamic analyses of fate change in murine embryonic stem cells. Nature 462 : 358–362.
5. PerssonO, BrynnelU, LevanderF, WidegrenB, SalfordLG, et al. (2009) Proteomic expression analysis and comparison of protein and mRNA expression profiles in human malignant gliomas. Proteomics Clin Appl 3 : 83–94.
6. WashburnMP, KollerA, OshiroG, UlaszekRR, PlouffeD, et al. (2003) Protein pathway and complex clustering of correlated mRNA and protein expression analyses in Saccharomyces cerevisiae. Proc Natl Acad Sci U S A 100 : 3107–3112.
7. WongWF, KohuK, ChibaT, SatoT, SatakeM (2011) Interplay of transcription factors in T cell differentiation and function: the role of Runx. Immunology 132 : 157–164.
8. SakaguchiS, OnoM, SetoguchiR, YagiH, HoriS, et al. (2006) Foxp3+ CD25+ CD4+ natural regulatory T cells in dominant self-tolerance and autoimmune disease. Immunol Rev 212 : 8–27.
9. SakaguchiS, YamaguchiT, NomuraT, OnoM (2008) Regulatory T cells and immune tolerance. Cell 133 : 775–787.
10. ZhuJ, PaulWE (2008) CD4 T cells: fates, functions, and faults. Blood 112 : 1557–1569.
11. FeuererM, HillJA, KretschmerK, von BoehmerH, MathisD, et al. (2010) Genomic definition of multiple ex vivo regulatory T cell subphenotypes. Proc Natl Acad Sci U S A 107 : 5919–5924.
12. FontenotJD, RasmussenJP, GavinMA, RudenskyAY (2005) A function for interleukin 2 in Foxp3-expressing regulatory T cells. Nat Immunol 6 : 1142–1151.
13. FontenotJD, RasmussenJP, WilliamsLM, DooleyJL, FarrAG, et al. (2005) Regulatory T cell lineage specification by the forkhead transcription factor foxp3. Immunity 22 : 329–341.
14. GavinMA, RasmussenJP, FontenotJD, VastaV, ManganielloVC, et al. (2007) Foxp3-dependent programme of regulatory T cell differentiation. Nature 445 : 771–775.
15. HillJA, FeuererM, TashK, HaxhinastoS, PerezJ, et al. (2007) Foxp3 transcription-factor-dependent and -independent regulation of the regulatory T cell transcriptional signature. Immunity 27 : 786–800.
16. GrolleauA, BowmanJ, Pradet-BaladeB, PuravsE, HanashS, et al. (2002) Global and specific translational control by rapamycin in T cells uncovered by microarrays and proteomics. J Biol Chem 277 : 22175–22184.
17. Garcia-SanzJA, MikulitsW, LivingstoneA, LefkovitsI, MullnerEW (1998) Translational control: a general mechanism for gene regulation during T cell activation. FASEB J 12 : 299–306.
18. MikulitsW, Pradet-BaladeB, HabermannB, BeugH, Garcia-SanzJA, et al. (2000) Isolation of translationally controlled mRNAs by differential screening. FASEB J 14 : 1641–1652.
19. SonenbergN, HinnebuschAG (2009) Regulation of translation initiation in eukaryotes: mechanisms and biological targets. Cell 136 : 731–745.
20. LarssonO, SonenbergN, NadonR (2010) Identification of differential translation in genome wide studies. Proc Natl Acad Sci U S A 107(50): 21487–21492.
21. LarssonO, SonenbergN, NadonR (2011) anota: analysis of differential translation in genome wide studies. Bioinformatics 27(10): 1440–1.
22. FeuererM, HillJA, MathisD, BenoistC (2009) Foxp3+ regulatory T cells: differentiation, specification, subphenotypes. Nat Immunol 10 : 689–695.
23. KeeneJD (2007) RNA regulons: coordination of post-transcriptional events. Nat Rev Genet 8 : 533–543.
24. MukherjeeN, LagerPJ, FriedersdorfMB, ThompsonMA, KeeneJD (2009) Coordinated posttranscriptional mRNA population dynamics during T cell activation. Mol Syst Biol 5 : 288.
25. HoganDJ, RiordanDP, GerberAP, HerschlagD, BrownPO (2008) Diverse RNA-binding proteins interact with functionally related sets of RNAs, suggesting an extensive regulatory system. PLoS Biol 6: e255 doi:10.1371/journal.pbio.0060255.
26. LuoW, FriedmanMS, SheddenK, HankensonKD, WoolfPJ (2009) GAGE: generally applicable gene set enrichment for pathway analysis. BMC Bioinformatics 10 : 161.
27. LarssonO, LiS, IssaenkoOA, AvdulovS, PetersonM, et al. (2007) Eukaryotic translation initiation factor 4E induced progression of primary human mammary epithelial cells along the cancer pathway is associated with targeted translational deregulation of oncogenic drivers and inhibitors. Cancer Res 67 : 6814–6824.
28. MamaneY, PetroulakisE, MartineauY, SatoTA, LarssonO, et al. (2007) Epigenetic activation of a subset of mRNAs by eIF4E explains its effects on cell proliferation. PLoS ONE 2: e242 doi:10.1371/journal.pone.0000242.
29. DowlingRJ, TopisirovicI, AlainT, BidinostiM, FonsecaBD, et al. (2010) mTORC1-mediated cell proliferation, but not cell growth, controlled by the 4E-BPs. Science 328 : 1172–1176.
30. LarssonO, PerlmanDM, FanD, ReillyCS, PetersonM, et al. (2006) Apoptosis resistance downstream of eIF4E: posttranscriptional activation of an anti-apoptotic transcript carrying a consensus hairpin structure. Nucleic Acids Res 34 : 4375–4386.
31. ColinaR, Costa-MattioliM, DowlingRJ, JaramilloM, TaiLH, et al. (2008) Translational control of the innate immune response through IRF-7. Nature 452 : 323–328.
32. KimYY, Von WeymarnL, LarssonO, FanD, UnderwoodJM, et al. (2009) Eukaryotic initiation factor 4E binding protein family of proteins: sentinels at a translational control checkpoint in lung tumor defense. Cancer Res 69 : 8455–8462.
33. Bour-JordanH, BluestoneJA (2009) Regulating the regulators: costimulatory signals control the homeostasis and function of regulatory T cells. Immunol Rev 229 : 41–66.
34. ThorntonAM, ShevachEM (1998) CD4+CD25+ immunoregulatory T cells suppress polyclonal T cell activation in vitro by inhibiting interleukin 2 production. J Exp Med 188 : 287–296.
35. GhoshB, BenyumovAO, GhoshP, JiaY, AvdulovS, et al. (2009) Nontoxic chemical interdiction of the epithelial-to-mesenchymal transition by targeting cap-dependent translation. ACS Chem Biol 4 : 367–377.
36. DelgoffeGM, KoleTP, ZhengY, ZarekPE, MatthewsKL, et al. (2009) The mTOR kinase differentially regulates effector and regulatory T cell lineage commitment. Immunity 30 : 832–844.
37. SauerS, BrunoL, HertweckA, FinlayD, LeleuM, et al. (2008) T cell receptor signaling controls Foxp3 expression via PI3K, Akt, and mTOR. Proc Natl Acad Sci U S A 105 : 7797–7802.
38. NikolchevaT, PyronnetS, ChouSY, SonenbergN, SongA, et al. (2002) A translational rheostat for RFLAT-1 regulates RANTES expression in T lymphocytes. J Clin Invest 110 : 119–126.
39. VillarinoAV, KatzmanSD, GalloE, MillerO, JiangS, et al. (2011) Posttranscriptional silencing of effector cytokine mRNA underlies the anergic phenotype of self-reactive T cells. Immunity 34 : 50–60.
40. MaoX, GreenJM, SaferB, LindstenT, FredericksonRM, et al. (1992) Regulation of translation initiation factor gene expression during human T cell activation. J Biol Chem 267 : 20444–20450.
41. FangL, WangH, ZhouL, YuD (2011) FOXO3a reactivation mediates the synergistic cytotoxic effects of rapamycin and cisplatin in oral squamous cell carcinoma cells. Toxicol Appl Pharmacol 251 : 8–15.
42. HuangH, ReganKM, WangF, WangD, SmithDI, et al. (2005) Skp2 inhibits FOXO1 in tumor suppression through ubiquitin-mediated degradation. Proc Natl Acad Sci U S A 102 : 1649–1654.
43. OuyangW, BeckettO, MaQ, PaikJH, DePinhoRA, et al. (2010) Foxo proteins cooperatively control the differentiation of Foxp3+ regulatory T cells. Nat Immunol 11 : 618–627.
44. ZhouL, ChongMM, LittmanDR (2009) Plasticity of CD4+ T cell lineage differentiation. Immunity 30 : 646–655.
45. DaiM, WangP, BoydAD, KostovG, AtheyB, et al. (2005) Evolving gene/transcript definitions significantly alter the interpretation of GeneChip data. Nucleic Acids Res 33: e175.
46. BoyleEI, WengS, GollubJ, JinH, BotsteinD, et al. (2004) TermFinder–open source software for accessing Gene Ontology information and finding significantly enriched Gene Ontology terms associated with a list of genes. Bioinformatics 20 : 3710–3715.
Štítky
Genetika Reprodukční medicínaČlánek vyšel v časopise
PLOS Genetics
2013 Číslo 5
- Kazuistika – Perspektivy využití precizované medicíny v rámci personalizované specifické terapie onkologických pacientů
- Nobelova cena za chemii pro genetické nůžky: Objev, který změní naši budoucnost?
- Technologie na bázi RNA v klinické praxi: od přebarvených petúnií k terapii vzácných a dosud jen obtížně léčitelných chorob u lidí
- „Nepředstavovali jsme si, že náš výzkum povede přímo ke vzniku nových léků, dokonce ještě za našeho života“
- Bezplatné služby pro diagnostiku ATTRv amyloidózy pro kardiology
Nejčtenější v tomto čísle
- Using Extended Genealogy to Estimate Components of Heritability for 23 Quantitative and Dichotomous Traits
- Encodes CDF Transporters That Excrete Zinc from Intestinal Cells of and Act in a Parallel Negative Feedback Circuit That Promotes Homeostasis
- HDAC7 Is a Repressor of Myeloid Genes Whose Downregulation Is Required for Transdifferentiation of Pre-B Cells into Macrophages
- Female Bias in and Regulation by the Histone Demethylase KDM6A
Zvyšte si kvalifikaci online z pohodlí domova
Mazová zátka a její řešení
nový kurzVšechny kurzy