
Cellular Variability of RpoS Expression Underlies Subpopulation Activation of an Integrative and Conjugative Element
Conjugative transfer of the integrative and conjugative element ICEclc in the bacterium Pseudomonas knackmussii is the consequence of a bistable decision taken in some 3% of cells in a population during stationary phase. Here we study the possible control exerted by the stationary phase sigma factor RpoS on the bistability decision. The gene for RpoS in P. knackmussii B13 was characterized, and a loss-of-function mutant was produced and complemented. We found that, in absence of RpoS, ICEclc transfer rates and activation of two key ICEclc promoters (Pint and PinR) decrease significantly in cells during stationary phase. Microarray and gene reporter analysis indicated that the most direct effect of RpoS is on PinR, whereas one of the gene products from the PinR-controlled operon (InrR) transmits activation to Pint and other ICEclc core genes. Addition of a second rpoS copy under control of its native promoter resulted in an increase of the proportion of cells expressing the Pint and PinR promoters to 18%. Strains in which rpoS was replaced by an rpoS-mcherry fusion showed high mCherry fluorescence of individual cells that had activated Pint and PinR, whereas a double-copy rpoS-mcherry–containing strain displayed twice as much mCherry fluorescence. This suggested that high RpoS levels are a prerequisite for an individual cell to activate PinR and thus ICEclc transfer. Double promoter–reporter fusions confirmed that expression of PinR is dominated by extrinsic noise, such as being the result of cellular variability in RpoS. In contrast, expression from Pint is dominated by intrinsic noise, indicating it is specific to the ICEclc transmission cascade. Our results demonstrate how stochastic noise levels of global transcription factors can be transduced to a precise signaling cascade in a subpopulation of cells leading to ICE activation.
Published in the journal:
. PLoS Genet 8(7): e32767. doi:10.1371/journal.pgen.1002818
Category:
Research Article
doi:
https://doi.org/10.1371/journal.pgen.1002818
Summary
Conjugative transfer of the integrative and conjugative element ICEclc in the bacterium Pseudomonas knackmussii is the consequence of a bistable decision taken in some 3% of cells in a population during stationary phase. Here we study the possible control exerted by the stationary phase sigma factor RpoS on the bistability decision. The gene for RpoS in P. knackmussii B13 was characterized, and a loss-of-function mutant was produced and complemented. We found that, in absence of RpoS, ICEclc transfer rates and activation of two key ICEclc promoters (Pint and PinR) decrease significantly in cells during stationary phase. Microarray and gene reporter analysis indicated that the most direct effect of RpoS is on PinR, whereas one of the gene products from the PinR-controlled operon (InrR) transmits activation to Pint and other ICEclc core genes. Addition of a second rpoS copy under control of its native promoter resulted in an increase of the proportion of cells expressing the Pint and PinR promoters to 18%. Strains in which rpoS was replaced by an rpoS-mcherry fusion showed high mCherry fluorescence of individual cells that had activated Pint and PinR, whereas a double-copy rpoS-mcherry–containing strain displayed twice as much mCherry fluorescence. This suggested that high RpoS levels are a prerequisite for an individual cell to activate PinR and thus ICEclc transfer. Double promoter–reporter fusions confirmed that expression of PinR is dominated by extrinsic noise, such as being the result of cellular variability in RpoS. In contrast, expression from Pint is dominated by intrinsic noise, indicating it is specific to the ICEclc transmission cascade. Our results demonstrate how stochastic noise levels of global transcription factors can be transduced to a precise signaling cascade in a subpopulation of cells leading to ICE activation.
Introduction
Integrative and conjugative elements (ICE) are a newly recognized class of mobile DNA elements in prokaryotes [1]–[4]. ICE come in different families, represented by the host cell range and gene similarities, but all have a similar mechanistic ‘life-style’ [2]. Under most circumstances the ICE resides in one or more positions in the host chromosome like a prophage [5]. At frequencies of typically less than 10−2 per cell and under particular growth conditions or environmental signals ICE excise by recombination between short direct repeats at either end (within the attachment sites attL and attR) [6]–[8]. The double-stranded excised ICE can undergo DNA processing as for plasmid conjugation [9], and transfers a single-stranded ICE-DNA to a new host cell. In the new host cell the ICE-DNA is replicated and integrates by site-specific recombination between the ICE-located attP-site and the chromosomal attachment site attB [1], [2]. Interestingly, many ICE integrate in genes for tRNA [10] and ICE integrase sequences suggest phage ancestry [11].
ICE have attracted broad interest because, similar to plasmids, they can carry a large number of auxiliary genes in addition to the genes necessary for their basic functioning, which can provide selective advantages to the host cell. For example, several ICE carry genes for antibiotic resistance [12]–[14], for iron scavenging [15], [16], for diguanylate cyclases that can enhance host survival [17], for plant symbiosis [18] or for metabolism of chloro - and aminoaromatic compounds [19]–[21]. Although some ICE have been detected by their self-transferability, a large number of ICE-related elements with unknown mobility has been discovered through genome comparisons [22]–[24]. Some of those may be mobilized with help of other elements [25], but others may represent elements in retrograde evolution that once were capable of initiating conjugation, but which are now rendered immobile [23]. In more general terms one therefore often speaks of ‘genomic islands’ [1] or ‘regions of genomic plasticity’ [24], which include both ICE and ICE-like elements. Genome comparisons among closely related strains have suggested that a significant fraction (perhaps as much as 20%) of strain-to-strain variation may be due to the presence of different types of genomic islands [24], [26], [27]. Such comparisons have further implied that genomic islands are largely responsible for the adaptive capacities of prokaryotic species [28].
Although several ICE have been genetically and functionally characterized, and their general importance for bacterial evolution and adaptation is now widely appreciated, still very little is known about their cell biology [2]. One of the most intriguing aspects of the functioning of an ICE is its low frequency of conjugation (e.g., 1% or less of a population of cells), which suggests that in only very few individual cells in a clonal population a decision is made to activate the ICE. The types of mechanisms and regulatory control that can achieve such low frequency differentiation are still widely unexplored. Some ICE bear regulatory systems controlling excision that involve phage-type repressors [29]–[31], which therefore may behave similar as the phage lambda bistable lysogenic/lytic switch [32]. Other ICE-classes, however, bear no gene functions with significant homologies to known phage lytic switches. Previously, we showed that excision and transfer of the element ICEclc in Pseudomonas knackmussii B13 must be the consequence of a bistable switch that culminates in the activation of the intB13 integrase promoter (hereafter named Pint) in 3% of cells during stationary phase [33]. ICEclc is a 103-kb sized element with strong homologies to a large number of genomic islands in Beta- and Gammaproteobacteria, and is named after its propensity to provide the host cell with the capacity to metabolize chlorinated catechols, encoded by the clc genes [21]. Two identical ICEclc copies reside in the chromosome of strain B13, which are interspaced by 340 kb (Miyazaki, unpublished). Activation of the intB13 integrase leads to excision and formation of a closed circular ICEclc intermediate [33]. Transfer of the circular intermediate is dependent on a DNA relaxase, which makes a single-stranded break, but, exceptionally, can initiate transfer at two origins of transfer (oriT) on ICEclc [9]. Single cell studies using fluorescent reporter fusions showed that Pint activation was preceded by and dependent on expression of a protein named InrR (for INtegRase Regulator) in the same individual cell (Figure 1). InrR is encoded in a small four-gene operon on ICEclc under control of another bistably expressed promoter (PinR) [33]. This suggested that ICE excision and activation in general may be the consequence of a bistable switch, and that the frequency of ON-setting is a determining factor for the frequency of ICE conjugation. Bistability as a phenomenon is most well-known from competence development and sporulation in Bacillus subtilis, which lead to phenotypically differentiated cells [32], [34], [35]. Although bistability is thought to originate from stochastic expression noise, this in itself is not sufficient to ‘lock’ cells in different phenotypic behaviour, but rather needs to be amplified and stabilized by regulatory mechanisms that include double positive feedback loops or double negative loops [32]. On the other hand, it is conceivable that the noisiness sets the threshold for the proportion of cells that display the bistable trait.

The goal of the underlying work was to explore whether noisiness may lay at the basis of determining the proportion of cells in which ICEclc becomes active. We focused our attention on both Pint and PinR promoters, which are expressed during stationary phase and only in a subpopulation of cells [8], [33], [36]. Initiation of ICEclc transfer in stationary phase cells further suggested involvement of a specific sigma factor such as RpoS (σs). RpoS is the stress-starvation sigma factor that in P. aeruginosa controls the expression of some 772 genes at the onset of stationary phase [37], 40% of which have also been identified as quorum-sensing controlled. Deletion of rpoS in P. aeruginosa does not result in a dramatically changed phenotype, although such mutants survive 50-fold less well to heat and salt shocks than wild-type, and produce less extracellular proteins such as elastase, exotoxin A, and alginate [38]. In order to establish the role of a stationary phase sigma factor in activation of ICEclc, we identified an rpoS-gene in P. knackmussii B13 and studied the effects of interruption and subsequent complementation using single-cell reporter gene fusions to Pint and PinR. Interestingly, a B13 wild-type equipped with a second rpoS gene copy displayed a much higher subpopulation of cells expressing both Pint and PinR promoters. To study whether actually individual cell levels of RpoS could be somehow deterministic for the activation of ICEclc we replaced native rpoS by a gene for an active RpoS-mCherry fusion protein. Finally, we measured contributions of intrinsic and extrinsic noise on Pint and PinR promoters from covariance in the expression of double gene reporters placed in single copy on different parts of the B13 chromosome [39]. Our results indicate that individual cells with the highest RpoS levels in the population are more prone to activate Pint and PinR, which suggests that the stochastic variation in RpoS levels across a population of cells is transduced into ICEclc activation and transfer in a small subpopulation.
Results
Identification of the rpoS gene from P. knackmussii strain B13
In order to identify the rpoS gene of P. knackmussii strain B13 we used PCR amplification with primers designed against conserved regions in a multiple alignment of rpoS sequences of P. aeruginosa, P. putida KT2440 and P. fluorescens (Figure S1). The nucleotide sequence of the amplified fragment from strain B13 showed high homology to a set of rpoS genes from other pseudomonads, with a percentage nucleotide identity between rpoSB13 and rpoS from different P. aeruginosa strains of 83% over 989 bp. The predicted amino acid sequence of RpoSB13 positioned most closely to that of P. aeruginosa PAO1 (Figure S2). Flanking regions of rpoSB13 were subsequently recovered from a draft genome sequence of P. knackmussii B13 (Miyazaki, unpublished data), which showed that the rpoS region of strain B13 is syntenic to that in P. aeruginosa PAO1 with a gene for a lipoprotein (nlpD) upstream of rpoS, and an rsmZ-like gene and a gene for a ferredoxin (fdxA) downstream (Figure 1). We therefore concluded that this region in B13 most likely encodes a similar stationary phase sigma factor as in P. aeruginosa.
A single crossover rpoS mutant was produced by marker insertion (strain B13-2671, Figure S3, Table 1). Despite repeated attempts we were not successful in producing a double recombinant with an internal rpoS deletion. However, it was possible to replace rpoSB13 by a gene for a RpoSB13-mCherry fusion protein (see below). Maximum specific growth rates of strain B13-2671 (rpoS) on MM with 5 mM 3CBA were similar as B13 wild-type (0.22±0.01 versus 0.26±0.01 h−1, respectively), but the onset of exponential growth was slightly delayed in B13-2671 (rpoS) (Figure S4A). Reversion to the wild-type allele occurred in less than 1% of cells in stationary phase (Figure S4B).

RpoS is implicated in expression of the bistable ICEclc promoters PinR and Pint
The fact that most of the core genes of ICEclc are solely expressed in stationary phase P. knackmussii B13 cells [36], and the presence of sequence features typical for RpoS in the PinR promoter [33] had suggested an implication of RpoS in controlling ICEclc stationary phase expression. Inactivation of rpoS in B13 indeed resulted in reduced expression of both PinR and Pint promoters. This was evident, first of all, from a reduced proportion of cells in a B13-2673 (rpoS) compared to B13 wild-type population expressing eCherry and eGFP above detection threshold from single copy transcriptional fusions to PinR and Pint, respectively (Figure 2B, Table 2). Secondly, stationary phase cells of B13-2673 (rpoS) produced a lower average reporter fluorescence signal than wild-type cells (Table 2). In most individual cells the magnitudes of eGFP and eCherry expression correlated, confirming that PinR and Pint were expressed in the same cell (Figure 2B). Both eCherry and eGFP were not visibly expressed in B13-2673 (rpoS) cells examined after 24 h in stationary phase, but after 72 h a small fraction of cells still developed eGFP and eCherry fluorescence (Figure 2B). This delay (48 h) is much longer than would be expected from the slight growth delay (5 h) of B13-2673 (rpoS) compared to B13-78 wild-type to reach stationary phase (Figure S4). Late (72 h) expression of Pint and PinR in B13-2673 (rpoS) was not due to reversion of the rpoS mutation (Figure S4B).

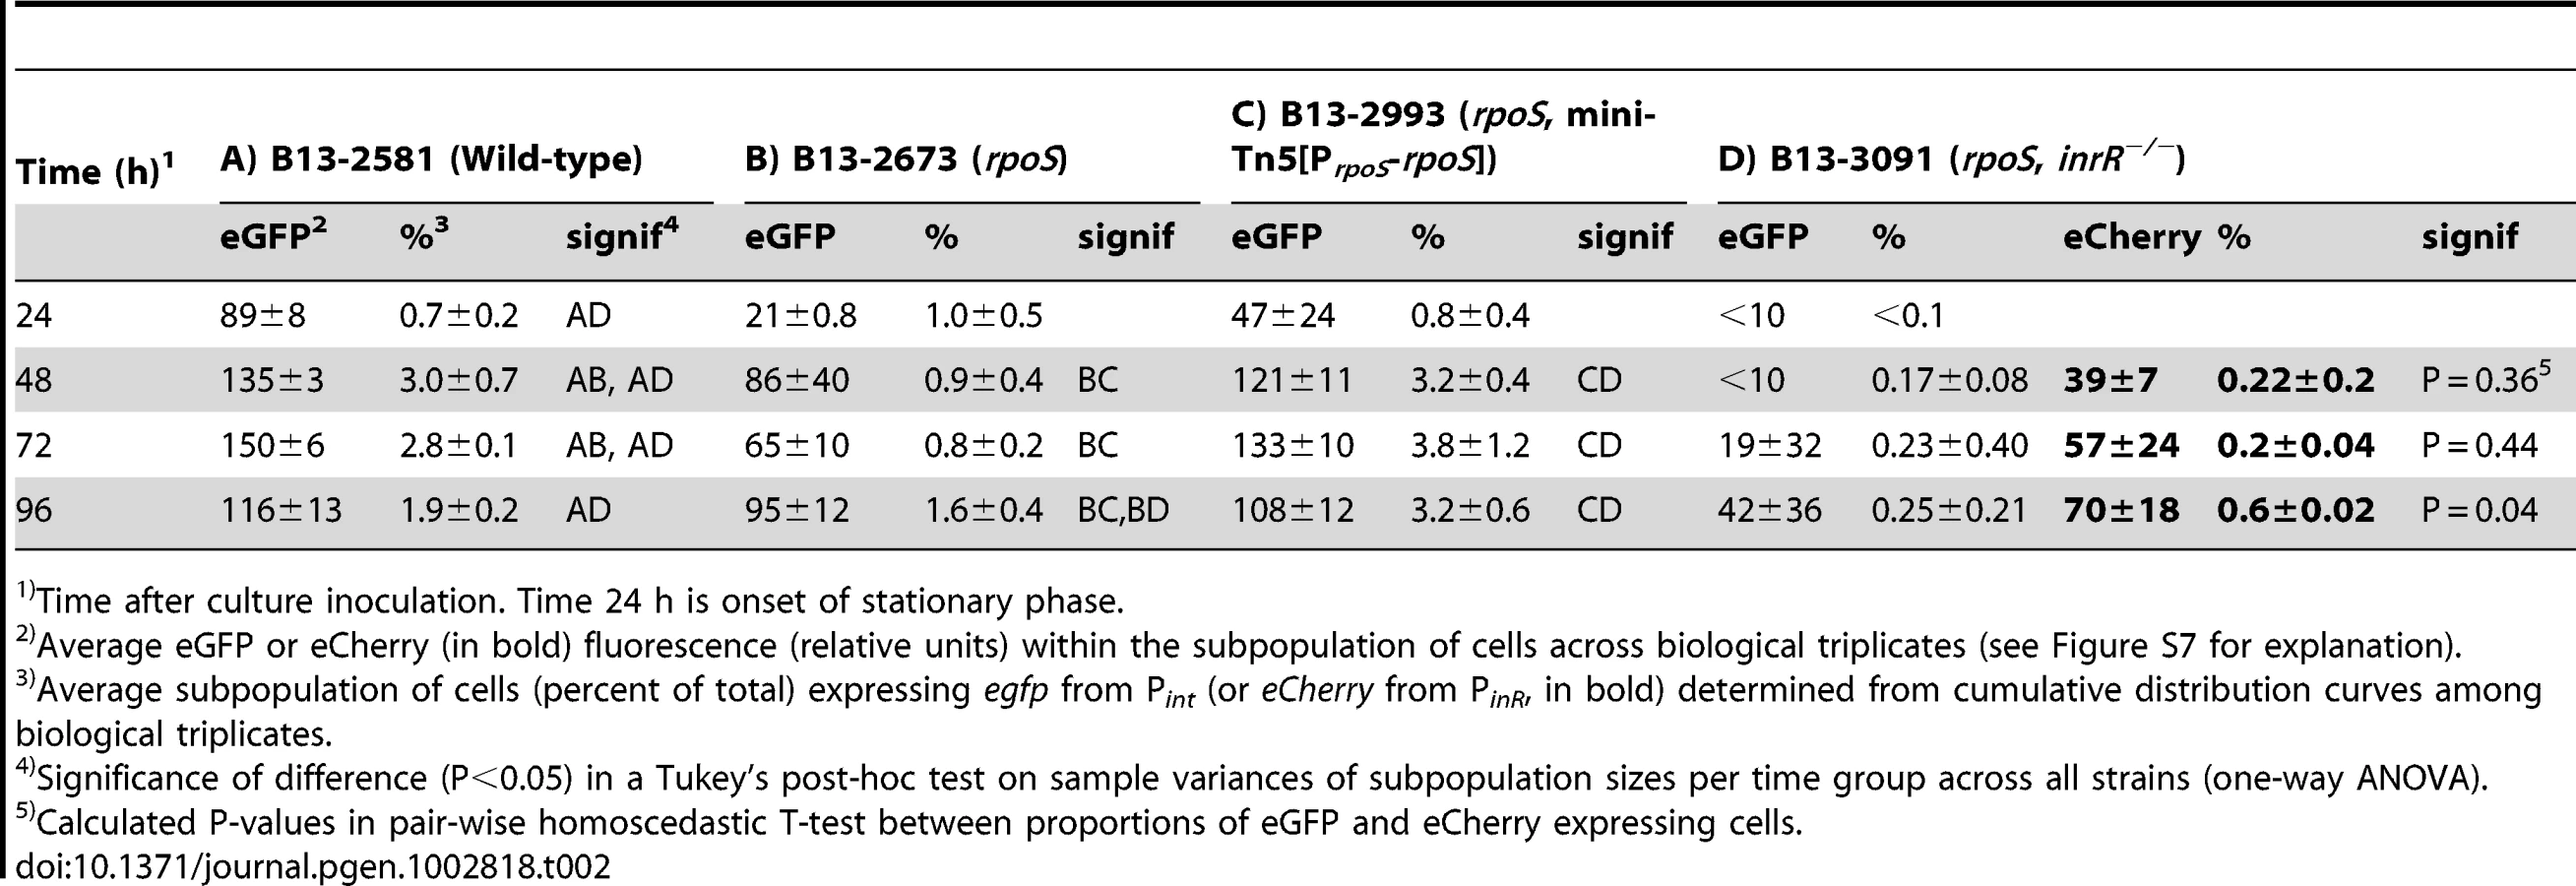
To confirm that the effect on Pint and PinR expression was caused by a disruption of rpoS, we complemented strain B13-2673 with a single copy mini-Tn5 insertion containing rpoSB13 under control of its own promoter (PrpoS, Figure 2A). Both the proportion of cells and their average fluorescence levels of both fluorescent markers from PinR and Pint were restored to wild-type levels in the rpoS-complemented strain P. knackmussii B13-2993 (Figure 2B, Table 2). The number of cells expressing autofluorescent proteins from both promoters was even slightly higher in the rpoS complemented strain than in B13 wild-type after 96 h in stationary phase, although this was not a statistically significant difference (Table 2).
We can thus conclude from this part that, because both the expression level of eGFP and eCherry in single cells and also the percentage of cells that expressed both markers in strain B13-2673 (rpoS) was significantly lower than in B13 wild-type and the rpoS-complemented strain (B13-2993), RpoS is necessary for achieving native transcription levels from the PinR promoter (i.e., within 48 h of stationary phase). On the other hand, RpoS is not absolutely essential, since cells with interrupted rpoS gene eventually (96 h) express PinR and Pint, which was not due to reversion of the rpoS mutation (Figure S4B).
Direct influence of RpoS on integrase expression
Since the observed lower expression from the integrase promoter (Pint) in the rpoS mutant could be the result of either less InrR being formed from PinR, or of a direct control by RpoS of Pint, we compared eGFP expression from a single copy Pint-egfp transcriptional fusion in B13, the B13 rpoS mutant (B13-2976) and a B13 lacking both inrR copies (B13-2979, Table 1). Interestingly, the proportion of cells expressing eGFP and their average fluorescence were much lower in a strain lacking both inrR copies than in the strain missing RpoS (Figure S5, Table 3), suggesting that the major influence of RpoS is indirectly via InrR.

Since the proportion of cells expressing eGFP from Pint in an inrR−/− background was already so low, it was not possible to detect statistically significant differences to a strain that would carry the triple rpoS and inrR−/− mutations (Table 3). For this reason, we produced the triple rpoS inrR−/− mutation in a B13 strain containing a dual reporter of Pint-egfp and PinR-echerry (B13-3091), and correlated eGFP to eCherry expression. Since this strain would be devoid of InrR-mediated expression of Pint, we expected that expression of egfp from Pint in absence of rpoS would be lower than expression of echerry from PinR. Indeed, there was a slight tendency for the mean proportion of cells expressing eGFP (from Pint) in strain B13-3091 (rpoS, inrR−/−) to be lower than that expressing eCherry (from PinR), although this was only poorly significant after 96 h (P = 0.04), again because of the very low subpopulation sizes (<0.5%, Table 2). Purified and reconstituted RpoS-RNA polymerase from E. coli bound DNA fragments encompassing Pint in in vitro electrophoretic mobility shift assays (K. Globig and J. van der Meer, unpublished data). This suggests that transcription from Pint is both indirectly (via InrR) and directly dependent on RpoS.
ICEclc transfer and core gene expression is reduced in absence of functional RpoS
Whereas expression of the reporter gene fusions was interpreted as being representative for the behaviour of the native Pint and PinR promoters on ICEclc, we also determined ICEclc core gene expression and transfer frequencies from B13 wild-type or derivatives as donor and P. putida UWC1 as recipient. Expression of the ICEclc core genes in stationary phase cells measured by microarray analysis was lower (up to 27-fold) for both B13-2671 (rpoS) and B13-2201 (inrR−/−) compared to B13 wild-type (Figure S6). Interestingly, expression of the inrR operon was not only downregulated in B13-2671 (rpoS) but also in B13-2201 (inrR−/−) (Figure S6), suggesting autoregulation by InrR.
Not only ICEclc core gene expression but also transfer frequencies were significantly lower at all time points from B13-2673 (rpoS) or B13-3091 (rpoS, inrR−/−) than from B13-2581 wild-type or the rpoS-complemented B13 rpoS mutant (B13-2993) as donor (Figure 3, Table S1). ICEclc transfer frequencies from the complemented B13 rpoS mutant were not significantly different than those from B13 wild-type. Transfer frequencies from B13-2673 (rpoS) as donor were significantly higher than from B13-3091 (rpoS, inrR−/−) as donor, but only after 96 h mating time (Table S1). These results thus corroborated that RpoS is favorable (but not essential) for expression of ICEclc core genes and thus for conjugative transfer. RpoS exerts its control mainly via its interaction with the inrR promoter, with InrR relaying the activation further to other ICEclc core genes, but also via direct interaction at Pint.

Correlation between rpoS and Pint or PinR expression
Since in the absence of RpoS the proportion of cells expressing Pint or PinR in the population diminishes but not completely disappears, we wondered whether the levels of RpoS or the magnitude of rpoS expression in individual B13 cells are a precondition for cells to become locked in the PinR - Pint bistable ‘ON’-state. Expression from PrpoS is maximal at the end of the exponential phase and in stationary phase, as shown by the appearance of mCherry fluorescence from single copy PrpoS-mcherry and rpoS-mCherry fusions in B13-3165 or B13-3564, respectively (Figure S7), which coincides with the timepoint of activation of PinR and Pint.
To correlate expression from rpoS with that of Pint or PinR in individual cells we created B13 derivatives with single copy PrpoS-mcherry and Pint-egfp or PinR-egfp fusions (B13-3183 and B13-3189, respectively). mCherry expression from PrpoS in stationary phase is normally distributed among all cells with a mean around 50 RFU (Figure 4A). In contrast, simultaneous eGFP expression from Pint-egfp or PinR-egfp in B13-3183 and B13-3189, respectively, occurs highly skewed in only 3% of cells (Figure 4A). However, there was no particular correlation between expression of mCherry and eGFP in single cells.

To better account for post-transcriptional effects on RpoS expression we repeated the experiment with B13 derivatives expressing RpoS translationally fused to mCherry at its C-terminal end (RpoS-mCherry) from the original rpoS locus. This was done by substituting the native rpoSB13 by the rpoSB13-mcherry allele. Similar as B13 wild-type RpoS also RpoS-mCherry was expressed during stationary phase in all cells with normal distribution (Figure 4B), and eGFP was again expressed in 3–6% of cells in the population from either the Pint or PinR promoter (strains B13-3564 and B13-3555, respectively). RpoS-mCherry but not an N-terminal mCherry-RpoS fusion protein complemented B13-rpoS for bistable Pint or PinR-dependent eGFP expression (data not shown). This indicated that the RpoS-mCherry fusion protein functionally replaces B13 wild-type RpoS. Significantly, only B13-3564 and B13-3555 cells expressing the highest RpoS-mCherry levels had also activated eGFP from Pint or PinR, respectively, although not all cells with high RpoS-mCherry levels expressed high levels of eGFP (Figure 4C). This suggests that the RpoS level per se is not sufficient to elicit PinR or Pint expression but is a precondition for PinR- or Pint-expression to occur.
Globally increasing RpoS levels augments the subpopulation size of cells expressing the PinR promoter
To artificially increase RpoS expression more globally across all cells in the population, with the idea that this would precondition more cells to activate PinR and Pint, an additional rpoSB13 copy under control of its own promoter was introduced by mini-Tn5 transposition (B13-3260, Figure 5A). Strikingly, ∼18% of all cells in stationary phase cultures of B13-3260 (rpoS+) expressed eGFP from Pint and eCherry from PinR compared to 5% in B13-2581 wild-type (Figure 5B–5E). ICEclc transfer from B13-3260 (rpoS+) as donor to P. putida UWC1 as recipient was twice as high as with B13 wild-type after the same mating contact time, although this was not a statistically significant difference (48 h, Table S2). In contrast, B13 with an extra copy of inrR (strain B13-3257) did not significantly differentially express both reporter genes from PinR and Pint (Figure 5B–5E). To determine whether the higher subpopulation of cells expressing both Pint and PinR-promoters was due to a generally higher level of RpoS in cells, we compared the RpoS-mCherry fluorescence levels in B13 with native rpoSB13 replaced by the rpoSB13-mcherry allele (B13-3564) and in the same strain into which another single copy of rpoSB13-mcherry was transposed (B13-3712). Indeed, the mean mCherry fluorescence in B13-3712 was almost twice as high as in B13-3564 (Figure 5F), suggesting that in double-copy rpoS strains on average more cells became permissive and could induce PinR and Pint.

One extra copy of rpoS or inrR changes noise level in gene expression
In order to further examine how variability in RpoS levels would be linked to bistable expression of PinR and Pint, we measured the contribution of intrinsic and extrinsic noise on both promoters in individual cells. Noise was deduced from intra - and intercellular variations of reporter gene expression (eGFP and eCherry) from two individual single copy transcription fusions to Pint or PinR, placed at different positions of the B13 chromosome as suggested in Elowitz et al. [39]. Fluorescence intensities from eGFP and eCherry were recorded in three independent clones with different insertion positions of the reporter fusion constructs to avoid positional effects as much as possible. Both markers essentially expressed in the same subpopulation of cells (Figure 6). Interestingly, the total noise was significantly higher on the Pint promoter than on PinR (Table 4). Moreover, Pint expression was dominated by intrinsic rather than by extrinsic noise, which suggests that the variation in expression from Pint depends more strongly on variations in small numbers of regulatory molecules in individual cells, such as would be expected when Pint is at the end of a cascade involving InrR.


Adding an extra copy of rpoS or of inrR under control of their own promoters into the double-Pint reporter strain resulted in a significant decrease of intrinsic and total noise compared to wild-type (Table 4), which was insensitive to the size of the sampled subpopulation (Table S3). This indicates that the relative contribution of the extrinsic noise on Pint expression becomes more dominant, as would be expected from the increase in a global transcription factor (since RpoS is also directly acting on Pint). Also adding an additional copy of inrR resulted in a lowering of the total noise, although the proportion of cells expressing eGFP and eCherry in the inrR+ strain was not increased compared to wild-type (Figure 6, Table 4).
Discussion
One of the mysteries in ICE gene transfer among bacteria is the mechanism that controls the (typically low) frequency by which they become excised in clonally identical populations of donor cells. ICE conjugation must start with its excision and therefore the cellular decision that determines conjugation is binary: ICE excision or not. Low transfer frequencies (e.g., below 1% per donor cell in a population) suggest that the binary ‘ON’-decision is only made in a very small proportion of donor cells. Indeed, our previous results on ICEclc in P. knackmussii B13 using stable fluorescent reporter gene fusions at single-cell level had indicated that 3% of cells in stationary phase after growth on 3-chlorobenzoate (3CBA) as sole carbon and energy source measurably express PinR and Pint [8], [33]. Moreover, single cell activation frequencies are in the same order as measured ICEclc excision and transfer at population level [33]. Our results presented here show for the first time how the expression level of the global transcription factor RpoS in individual cells across a population can modulate the frequency of cells activating excision of the ICEclc element.
By gene interruption and complementation we first establish that RpoS in P. knackmussii is a stationary phase sigma factor controlling transcription of the PinR - and Pint-promoters and thus, indirectly, transfer of ICEclc to P. putida. Addition of an extra rpoSB13 gene copy led to an increased proportion of stationary phase cells in which the PinR - and Pint-promoters are activated, which suggested that the expression level of RpoS is important for controlling the bistable switch leading to ICEclc activation. Indeed, by expressing an RpoS-mCherry fusion instead of RpoS wild-type protein in strain B13 we showed that PinR - or Pint-egfp expression in stationary phase preferably occurred in individual cells with the highest levels of RpoS-mCherry fluorescence (Figure 4C). Moreover, strains with two rpoS-mCherry gene copies produced on average twofold higher RpoS-mCherry protein fluorescence levels in cells, leading to an increase of up to 20% of cells expressing eGFP from PinR or Pint. This showed that an incidentally high RpoS level in an individual cell is a prerequisite for leading to PinR - or Pint-expression. On the contrary, having a high RpoS-level is not sufficient and an as yet unknown other ICEclc-encoded factor(s) must be responsible for the activation or derepression of PinR (Figure 7). We conclude that RpoS levels are a precondition for a cell or, in other words, a threshold, to activate the ICEclc bistable promoters during the first 2 days of stationary phase.

This conclusion is further supported by noise measurements on the PinR or Pint-promoters (Figure 6). Intrinsic noise is dominant on the Pint promoter in wild-type B13, which would be in agreement with the major role played by (a low abundant) InrR and the relatively minor role of (a widely abundant) RpoS directly on Pint-expression. This effect may actually have been overestimated by a bias introduced by the measurement technique (i.e., adding two extra Pint-copies with egfp or mcherry to two Pint from both ICEclc copies in the B13 chromosome, in the presence of two inrR copies). In contrast, and in the same ‘biased’ setting (two extra PinR-copies on a total of four), the total noise is significantly lower on the PinR-promoter and the relative contribution of the extrinsic noise is higher (Table 4), which is indicative for the more important contribution of RpoS on this promoter. Doubling the rpoS copy number resulted in a significant decrease of the total noise on Pint and a more important relative contribution of extrinsic noise (RpoS). This would make sense since individual cells would overall contain higher levels of RpoS permitting more direct interaction with Pint. Adding a third copy of inrR also reduced the level of intrinsic noise on Pint, but in this case because such cells would produce more InrR, diminishing the noise effect by ‘small numbers’ of regulatory factors (i.e., InrR). Noise in individual cell RpoS levels is thus not propagated to noise in expression of downstream regulons, as was shown recently for global transcription factors in yeast [40], but rather is ‘captured’ in those cells having high RpoS levels and transduced by ICEclc factors to a precise activation cascade leading to ICEclc excision and transfer.
Intriguingly, doubling rpoS copy number strongly increased the proportion of cells in the population expressing Pint and PinR from 3% to almost 20%, although the transfer frequency of ICEclc only doubled (Table S2). In contrast, adding a third copy of inrR to B13 did not statistically significantly increase the proportion of cells expressing Pint and PinR. To explain this, we propose the following model for ICEclc bistability generation (Figure 7). In this model cells that by chance have the highest RpoS levels are preconditioned to activate ICEclc, although another factor is needed for the actual activation mechanism. Available data suggest that activation starts at PinR, leading to synthesis of InrR, which, by an as yet unknown mechanism precisely relays activation (i.e., within the same individual cell) to Pint and other ICEclc core genes. Microarray analysis confirmed the important role of InrR for the overall activation of ICEclc core functions, and indicated a possible feedback loop on its own expression (Figure S6). Importantly, RpoS but not InrR levels determine the proportion of cells that may become ICEclc activated. The feedback loop of InrR on PinR expression may be necessary to obtain sufficiently high InrR levels to act as co-regulator for the different ICEclc core gene operons [36]. Increasing inrR copy number, therefore, can decrease the noise in the expression of the ICEclc genes downstream of PinR, but does not influence the proportion of cells in culture activating ICEclc. The fact that a double rpoS gene copy increases the number of cells expressing Pint and PinR to 20% but only doubles transfer frequency suggests that there may be another component that is not under RpoS or InrR control that further limits conjugation rates. How may RpoS be accomplishing such a ‘thresholding’ control? One hypothesis is that RpoS has a relatively poor affinity for the PinR-promoter and that, therefore, on average only cells with by chance high RpoS levels can activate PinR. The inrR promoter bears a potential RpoS-motif in the −10 box (TGTCGATCCT), although it is not highly conserved [41].
As far as we are aware, this is the first time that RpoS has been implicated in controlling horizontal gene transfer of a conjugative element. RpoS homologs are part of a large protein cluster called the σ70 family, which is widely distributed among prokaryotes, although RpoS regulons can be quite different in individual species [42]. The only other report detailing a role for RpoS dealt with stationary phase regulation of Tn4652 activity in P. putida [43]. Interestingly, in that case RpoS downregulates tnpA transposition frequency since Tn4652 becomes at least 10 times more activated in an rpoS-defective strain [43]. Study on effects of stochastic fluctuations in sigma factors at the single cell level are extremely limited. Perez-Osorio documented highly heterogeneous rpoS mRNA levels in P. aeruginosa biofilms, but this occurred rather as a consequence of physico-chemical gradients within the biofilm [44]. Stochastic stress-induced fluctuations control the rbsV-rbsW-sigB operon for the stress response sigma factor SigB in Bacillus subtilis. Interestingly, sigBp expression proceeds in a ‘burst-like’ fashion with a higher pulse frequency under stress than under normal growth condition [45]. Bursts are initiated by stress-dependent fluctuations in phosphatase levels, then first amplified and subsequently terminated by sigB operon feedback on itself and on its anti - and anti-anti-sigma factors RbsW and RbsV, respectively.
Gene expression noise is ubiquitous and plays an essential role in a variety of biological processes, triggering stochastic differentiation in clonal populations of cells [46]. Noise can provide a selective advantage by increasing phenotypic heterogeneity and increasing the chance of individuals to survive [46]. Evidence exists that more noisy systems can become selected under specific conditions [47]. In that sense, our data implicate that specific evolutionary elements such as ICEclc are wired within noise in a global transcription factor but can transduce this noise to a precise activation cascade, and thus may have been selected for their capacity to successfully exploit the noise.
Materials and Methods
Bacterial strains and plasmids
Escherichia coli DH5α (Gibco Life Technologies, Gaithersburg, Md.) was routinely used for plasmid propagation and cloning experiments. E. coli HB101 (pRK2013) was used as helper strain for conjugative delivery of mini-transposon constructs [48]. P. knackmussii strain B13 [49] is the original host of the clc element (ICEclc), of which it carries two copies [50]. All further B13 derivatives are listed in Table 1.
Media and growth conditions
Luria-Bertani (LB) medium [51] was used for cultivation of E. coli, whereas LB and type 21C mineral medium (MM) [52] were used for cultivation of P. knackmussii. 3-Chlorobenzoate (3CBA) was added to MM to a final concentration of 5 or 10 mM. When necessary, the following antibiotics were used at the indicated concentrations (µg per ml): ampicillin, 500 (for P. knackmussii) or 100 (for E. coli); kanamycin, 50 and tetracycline, 100 (for P. knackmussii strain B13 derivatives) or 12.5 (for E. coli). P. knackmussii strain B13 was grown at 30°C; E. coli was grown at 37°C.
ICEclc self-transfer
Self-transfer was tested by mixing 500 µl suspension of around 109 donor cells (P. knackmussii B13 or one of its derivatives) and 500 µl suspension of around 109 recipient cells (P. putida UWC1) on membrane filters for 24, 48, 72 or 96 h, as described earlier [53]. Transconjugants (P. putida UWC1 with ICEclc) were selected on MM plates with 5 mM 3CBA as sole carbon and energy source (to select for ICEclc) and 50 µg per ml rifampicin (resistance marker of the recipient). Transfer frequencies were expressed as number of transconjugant colony forming units (CFU) per number of donor CFU.
DNA and RNA techniques
Polymerase chain reaction (PCR), reverse transcription RT-PCR, plasmid and chromosomal DNA isolations, RNA isolation, DNA fragment recovery, DNA ligations, transformations into E. coli and restriction enzyme digestions were all carried out according to standard procedures [51] or to specific recommendations by the suppliers of the molecular biology reagents (Qiagen GmbH; Promega; Stratagene). Sanger-type DNA sequencing was performed on an automated DNA sequencer using a 3.1 Big-Dye kit (Applied Biosystems, ABI PRISM, 3100 DNA sequencer). Sequences were aligned and verified with the help of the Lasergene software package (Version 7, DNASTAR Inc., Madison, Wisc.). Sequence databases were interrogated by using the BLAST program [54].
Cloning of rpoS from P. knackmussii B13
Primers were designed for conserved regions obtained in a nucleotide sequence alignment among rpoS genes of P. aeruginosa, P. putida and P. fluorescens (Table S4, Figure S1). A single 1-kb PCR product was obtained using these primers and B13 genomic DNA as template. This fragment was cloned and sequenced on both strands by primer walking. Surrounding regions of the rpoS gene of P. knackmussii were retrieved from draft genome sequence of P. knackmussii B13 (R. Miyazaki and J. R. van der Meer, unpublished). The B13 rpoS gene region was submitted to GenBank under accession number AB696604.
RpoS disruption
An internal fragment of the rpoSB13 gene was amplified with a forward primer (080304) carrying a BamHI, and reverse primer (080303) carrying an EcoRI restriction site (Table S4). The amplified fragment was digested and cloned into the suicide plasmid vector pME3087, which carries a tetracycline resistance [55]. The plasmid was then mobilized from E. coli into P. knackmussii strain B13 via conjugation. Potential B13 transconjugants with a single recombination into rpoS were selected on MM with 5 mM 3CBA as carbon source plus 100 µg per ml tetracycline, further purified by replating and verified by PCR for accuracy of homologous recombination. In this manner a mutant of strain B13 was obtained in which rpoS was replaced by two incomplete and separated rpoS fragments (Figure S3). This mutant was named B13 rpoS (strain 2671). Separate experiments to delete rpoS by using recombination with a DNA fragment in which rpoS was fully deleted were not successful either (not shown). The same strategy was then used to produce a single recombinant disruption of rpoS in P. knackmussii strain B13 that lacked both inrR copies [33]. Reversion of the rpoS-pME3087 allele to wild-type rpoS in stationary phase cultures was tested by specific PCR (Table S4, Figure S4B).
rpoS complementation
A 2.2-kbp fragment containing the rpoS gene and its presumed promoter (PrpoS) was amplified from strain B13 purified genomic DNA using primers 091206 and 090902 (Table S4). The amplified material was first cloned into the vector pGEM-T-Easy (Promega). From here, the PrpoS-rpoS fragment was recovered by NotI digestion and inserted into the mini-Tn5 delivery plasmid pCK218, which was used to place the construction in single copy on the chromosome of strain B13-2673 (rpoS, mini-Tn[PinR-echerry-cat, Pint-egfp, Km], see below). As this strain carried a mini-Tn5 insertion already it was necessary to remove the Km gene cassette associated with it. Hereto the strain was transformed with plasmid pTS-parA [56], a temperature-sensitive replicon transiently expressing the ParA resolvase. B13 transformants were selected on LB plus ampicillin and subsequentially grown in the absence of kanamycin for twelve generations. Clones that had lost the Km cassette were screened by replica plating and the absence of the gene was verified by PCR. Finally, the temperature sensitive replicon was cured by growing the strain in LB at 37°C for 16 h and ensuring ampicillin sensitivity. The resulting strain was then used to introduce the mini-Tn5 containing the PrpoS-rpoS fragment, which was designated B13-2993 (rpoS, mini-Tn[PrpoS-rpoS, Km], mini-Tn[PinR-echerry-cat, Pint-egfp]). Three independent clones with possible different mini-transposon insertion sites were examined for ICEclc transfer and reporter gene expression.
Extra-copy of inrR and rpoS
A 1700-bp fragment containing orf95213 and inrR genes plus PinR was amplified by PCR using primers (060605+080502, Table S4) carrying EcoRI and SpeI restriction sites, respectively. The PinR-orf95213-inrR fragment was digested with EcoRI and SpeI and cloned into the mini-Tn5 delivery plasmid pBAM1 [57]. In the same way, a 2.2-kb fragment containing PrpoS-rpoS was amplified with primers (091206+090902) and cloned in pBAM1 using SphI and EcoRI. The resultant suicide plasmids were introduced into B13 or its derivatives by electroporation, from where the transposition was selected by plating on MM plus 3CBA and kanamycin. Bona fide single copy transposition was verified by PCR. At least three independent clones with possibly different insertion positions were used for further experiments.
Promoter–reporter gene fusions
Transcriptional fusions between the Pint promoter in front of intB13 and the egfp gene, or Pint and a promoterless echerry gene have been described previously [33], [58]. Transcriptional fusion between the promoter of the orf95213, inrR, ssb gene cluster (PinR) and either egfp or echerry have been detailed elsewhere [33]. To examine expression of both PinR and Pint promoters simultaneously, we used a previous construct with PinR-echerry in one and Pint-egfp in the opposite direction [33]. Fusions were inserted in single copy into the chromosome of strain B13 or its mutant derivatives via mini-Tn5 delivery using pCK218 [59]. To measure activity of the rpoS promoter (PrpoS), a 1200-bp fragment upstream of rpoS including the nlpD gene was amplified from strain B13 by PCR (Figure 1). This fragment was purified and digested with NotI and EcoRI, and unidirectionally fused to a promoterless mcherry gene in the mini-Tn5 vector pBAM1 [57]. Transposon insertion mutants were selected on MM with 3CBA plus kanamycin or tetracycline and purified, upon which the correctness of the mini-Tn5 insertion was verified by PCR. For all mini-transposon insertions at least three independent clones were purified and examined for induction.
Translational fusions of RpoS with mCherry
To produce a C-terminal fusion of RpoS to mCherry, a ∼750 bp fragment containing the mcherry open reading frame was amplified using pMQ64-mcherry (kindly obtained from Dianne Newman, CalTech) as a template and primers (101003 and 101004), in which the start codon of mcherry was replaced by a short nucleotide sequence encoding 15 amino acids (KLPENSNVTRHRSAT) as a linker peptide. The fragment was then cloned in HindIII and SpeI sites on the mini-Tn5 delivery plasmid pBAM1, resulting in pBAM-link-mCherry. A 2.1 kb region containing PrpoS and rpoS lacking its stop codon was amplified using B13 genomic DNA and primers 101001 plus 010102. This fragment was digested wtih EcoRI and HindIII, and cloned into the same sites on pBAM-link-mCherry (designated pBAM-rpoS-mcherry), After transformation in E. coli and purification, this plasmid was introduced into strain B13 or its derivatives by electroporation. Single copy transposon insertions of the rpoS-mcherry fusion construct were selected by plating cells on MM plus 3CBA and kanamycin. If required for introduction of subsequent mini-transpositions the kanamycin gene cassette was removed by ParA resolvase action (see above). At least three independent clones with possibly different insertion positions were used for further experiments.
To replace rpoS of B13 by the gene for the RpoS-mCherry fusion protein we used double recombination by crossing-over. Hereto, a ∼1 kb downstream region of rpoS was first amplified using B13 genomic DNA and primers 110524 plus 110525, which was digested using XbaI and SalI and ligated wtih pJP5603-ISceIv2 [60]. Next, the gene for the RpoS-mCherry translational fusion protein on pBAM-rpoS-mcherry was recovered by digestion with EcoRI and SpeI, an inserted upstream of the amplified fragment in pJP5603-ISceIv2 which was hereto digested with EcoRI and XbaI. After transformation in E. coli and purification, the resulting plasmid was electroporated into strain B13-78 (Table 1). Single and double recombinants were selected according to a previously described strategy [9], obtaining an allelic exchange mutant that has the gene for RpoS-mCherry instead of the original rpoS.
Fluorimeter measurements
P. knackmussii strain B13 or B13 rpoS carrying the PrpoS-mcherry fusion were grown in 96-well black microtiter plates (Greiner Bio-one) with a flat transparent bottom. Each well contained 200 µl of MM medium with 5 mM 3CBA and was inoculated with 2 µl of a bacterial preculture grown overnight in LB medium. Microtiter plates were incubated at 30°C with orbital shaking at 500 rpm. At each given time point both culture turbidity (A600) and fluorescence emission (excitation at 590 nm and emission at 620 nm) were measured from triplicate cultures using a Fluostar fluorescence microplate reader (BMG Lab Technologies). Cultures of P. knackmussii strain B13-78 wild-type served for background fluorescence correction.
Epifluorescence microscopy
To image eGFP, eCherry or mCherry expression in single cells, culture samples of 4 µl were placed on regular microscope slides, closed with a 50 mm long and 0.15 mm thick cover slip, and imaged within 1–2 minutes. Fluorescence intensities of individual cells were recorded on image fields not previously exposed to UV-light to avoid bleaching. For most imaging series, except data shown in Figure 2, a Zeiss Axioskop2 upright epifluorescence microscope was used, equipped with Spot Xplorer 1.4MPixel cooled CCD camera (Visitron Systems GmbH, Puchheim, Germany), and 100×/1.30 oil immersion Plan-Neofluar lens at an exposure time of 500 ms. Filters used for eGFP and for eCherry/mCherry were eGFP HQ470/40 and Cy3 HQ545/30, respectively (Chroma Technology Corp, VT, USA). Images were digitally recorded using VisiView software (version 2.0.4, Visitron Systems GmbH). For data shown in Figure 2 and Figure S3 a Leica DMI6000B inverted epifluorescence microscope was used, equipped with a cooled black-and-white charge-coupled device camera (DFC320, Leica Microsystems CMS GmbH, Wetzlar, Germany), a 100/1.30 oil immersion lens (HCX PL FLUOTAR; Leica), at an exposure time of 800 ms. Filters used for eGFP, and for eCherry or mCherry were GFP BP470/40 and Y3 BP535/50, respectively (Leica). Images were digitally recorded as 8-bit TIFF-files using the Leica AF6000 software. The mean pixel intensity for every individual object in an image was quantified by an automatic subroutine in the program MetaMorph (version 7.7.5; Visitron Systems GmbH) as described previously [33]. Fluorescence intensities per cell were expressed as cellular average gray values (AGVs) in which background intensities of each image were subtracted.
Subpopulation expression was determined from cumulative ranking of all objects according to their AGV. The ‘breakpoint’ between subpopulations on cumulative distribution curves (Figure S8) was determined by manually placing slope lines to the linear parts of the curve. The point where both slope lines crossed was used to determine the corresponding percentile for the largest subpopulation with lowest AGVs. The relative size of the subpopulaton with highest AGVs (indicative for bistable promoter expression of Pint and PinR) was then calculated as 100% - the percentile of the breakpoint. The average expression intensity over the highest expressing subpopulation was calculated as the mean AGV over the percentile range between that of the breakpoint and 100%. Fluorescence images for display were adjusted for brightness to a level +143, cropped to their final size and saved at 300 dpi with Adobe Photoshop (Version CS4). Corresponding phase-contrast images were ‘auto contrasted’ using Photoshop.
Noise calculation
To identify and quantify noise in expression of the Pint and PinR promoters, two identical copies were fused to distinguishable reporter genes (i.e. egfp and echerry) and integrated into separate locations on the chromosome of B13 or its derivatives using mini-Tn5 delivery. Three independent clones with different insertional positions were maintained. Stationary phase cells of such double-reporter strains grown in MM with 3CBA were examined in epifluorescence microscopy, and their eGFP and eCherry fluorescence intensities were measured as outlined above (AGVs). AGVs of both markers in each cell were scaled to subtract background AGV of digital EFM images and normalized to the highest AGV in a population (100%). Only cells belonging to the subpopulations of having higher eGFP or eCherry fluorescence than the breakpoint in the respective cumulative curves (e.g., Figure 6) were used for noise calculation. Intrinsic noise (ηint), extrinsic noise (ηext), and total noise (ηtot) were then calculated according to previous definitions given in Elowitz et al. [40] as follows:where g and c denote the normalized eGFP and eCherry AGV, respectively, observed in the nth single cell. Angled brackets denote a mean over the sample population.
Statistics
Significance of different treatments was examined by pair-wise t-test or ANOVA followed by a Tukey post hoc test. To test the effect of subpopulation size on noise calculations, data sets were randomly resampled using bootstrap procedures (1000 times), upon which the intrinsic, extrinsic and total noise were calculated and finally, averaged over all resampled populations of the same data set.
Microarray analysis
Total RNA was isolated from P. knackmussii B13-78 (wild type), B13-2671 (rpoS) and B13-2201 (inrR−/−) cultures after 48 h in stationary phase after growth on 3CBA as sole carbon and energy source, by using the procedure described previously [37]. Briefly, cDNA was synthesized from total RNA, labeled with cyanine-3, purified and hybridized to a 8×15K custom-made Agilent microarray chip (Agilent Technologies, Santa Clara, CA). Data analysis was performed as described previously [37]. Microarray data and design have been deposited in the NCBI Gene Expression Omnibus (GEO) under accession number GPL10091.
Supporting Information
Zdroje
1. JuhasMvan der MeerJRGaillardMHardingRMHoodDW 2009 Genomic islands: tools of bacterial horizontal gene transfer and evolution. FEMS Microbiol Rev 33 376 393
2. WozniakRAWaldorMK 2010 Integrative and conjugative elements: mosaic mobile genetic elements enabling dynamic lateral gene flow. Nat Rev Microbiol 8 552 563
3. BurrusVWaldorMK 2004 Shaping bacterial genomes with integrative and conjugative elements. Res Microbiol 155 376 386
4. DobrindtUHochhutBHentschelUHackerJ 2004 Genomic islands in pathogenic and environmental microorganisms. Nat Rev Microbiol 2 414 424
5. SentchiloVCzechowskaKPradervandNMinoiaMMiyazakiR 2009 Intracellular excision and reintegration dynamics of the ICEclc genomic island of Pseudomonas knackmussii sp. strain B13. Mol Microbiol 72 1293 1306
6. BeaberJWHochhutBWaldorMK 2004 SOS response promotes horizontal dissemination of antibiotic resistance genes. Nature 427 72 74
7. AuchtungJMLeeCAMonsonRELehmanAPGrossmanAD 2005 Regulation of a Bacillus subtilis mobile genetic element by intercellular signaling and the global DNA damage response. Proc Natl Acad Sci U S A 102 12554 12559
8. SentchiloVSRavatnRWerlenCZehnderAJBvan der MeerJR 2003 Unusual integrase gene expression on the clc genomic island of Pseudomonas sp. strain B13. J Bacteriol 185 4530 4538
9. MiyazakiRvan der MeerJR 2011 A dual functional origin of transfer in the ICEclc genomic island of Pseudomonas knackmussii B13. Mol Microbiol 79 743 758
10. WilliamsKP 2002 Integration sites for genetic elements in prokaryotic tRNA and tmRNA genes: sublocation preference of integrase subfamilies. Nucleic Acids Res 30 866 875
11. Nunes-DübySEKwonHJTirumalaiRSEllenbergerTLandyA 1998 Similarities and differences among 105 members of the Int family of site-specific recombinases. Nucleic Acids Res 26 391 406
12. BeaberJWHochhutBWaldorMK 2002 Genomic and functional analyses of SXT, an integrating antibiotic resistance gene transfer element derived from Vibrio cholerae. J Bacteriol 184 4259 4269
13. Mohd-ZainZTurnerSLCerdeño-TárragaAMLilleyAKInzanaTJ 2004 Transferable antibiotic resistance elements in Haemophilus influenzae share a common evolutionary origin with a diverse family of syntenic genomic islands. J Bacteriol 186 8114 8122
14. ShoemakerNBVlamakisHHayesKSalyersAA 2001 Evidence for extensive resistance gene transfer among Bacteroides spp. and among Bacteroides and other genera in the human colon. Appl Environ Microbiol 67 561 568
15. SchubertSDufkeSSorsaJHeesemannJ 2004 A novel integrative and conjugative element (ICE) of Escherichia coli: the putative progenitor of the Yersinia high-pathogenicity island. Mol Microbiol 51 837 848
16. HeJXBaldiniRLDezielESaucierMZhangQH 2004 The broad host range pathogen Pseudomonas aeruginosa strain PA14 carries two pathogenicity islands harboring plant and animal virulence genes. Proc Natl Acad Sci U S A 101 2530 2535
17. BordeleauEBrouilletteERobichaudNBurrusV 2010 Beyond antibiotic resistance: integrating conjugative elements of the SXT/R391 family that encode novel diguanylate cyclases participate to c-di-GMP signalling in Vibrio cholerae. Environ Microbiol 12 510 523
18. SullivanJTRonsonCW 1998 Evolution of rhizobia by acquisition of a 500-kb symbiosis island that integrates into a phe-tRNA gene. Proc Natl Acad Sci U S A 95 5145 5149
19. GrossRGuzmanCASebaihiaMdos SantosVAPieperDH 2008 The missing link: Bordetella petrii is endowed with both the metabolic versatility of environmental bacteria and virulence traits of pathogenic Bordetellae. BMC Genomics 9 449
20. ChainPSDenefVJKonstantinidisKTVergezLMAgulloL 2006 Burkholderia xenovorans LB400 harbors a multi-replicon, 9.73-Mbp genome shaped for versatility. Proc Natl Acad Sci U S A 103 15280 15287
21. GaillardMVallaeysTVorholterFJMinoiaMWerlenC 2006 The clc element of Pseudomonas sp. strain B13, a genomic island with various catabolic properties. J Bacteriol 188 1999 2013
22. MiyazakiRMinoiaMPradervandNSentchiloVSulserS 2011 The clc element and related genomic islands in Proteobacteria. RobertsAPMullanyP Bacterial integrative mobile genetic elements: Landes Bioscience
23. KlockgetherJWürdemannDRevaOWiehlmannLTümmlerB 2007 Diversity of the abundant pKLC102/PAGI-2 family of genomic islands in Pseudomonas aeruginosa. J Bacteriol 189 2443 2459
24. MatheeKNarasimhanGValdesCQiuXMatewishJM 2008 Dynamics of Pseudomonas aeruginosa genome evolution. Proc Natl Acad Sci U S A 105 3100 3105
25. DaccordACeccarelliDBurrusV 2010 Integrating conjugative elements of the SXT/R391 family trigger the excision and drive the mobilization of a new class of Vibrio genomic islands. Mol Microbiol 78 576 588
26. BoydEFCohenALNaughtonLMUsseryDWBinnewiesTT 2008 Molecular analysis of the emergence of pandemic Vibrio parahaemolyticus. BMC Microbiol 8 110
27. KettlerGCMartinyACHuangKZuckerJColemanML 2007 Patterns and implications of gene gain and loss in the evolution of Prochlorococcus. PLoS Genet 3 e231 doi:10.1371/journal.pgen.0030231
28. KungVLOzerEAHauserAR 2010 The accessory genome of Pseudomonas aeruginosa. Microbiol Mol Biol Rev 74 621 641
29. BeaberJWWaldorMK 2004 Identification of operators and promoters that control SXT conjugative transfer. J Bacteriol 186 5945 5949
30. BoseBAuchtungJMLeeCAGrossmanAD 2008 A conserved anti-repressor controls horizontal gene transfer by proteolysis. Mol Microbiol 70 570 582
31. BellangerXRobertsAPMorelCChouletFPavlovicG 2009 Conjugative transfer of the integrative conjugative elements ICESt1 and ICESt3 from Streptococcus thermophilus. J Bacteriol
32. LosickRDesplanC 2008 Stochasticity and cell fate. Science 320 65 68
33. MinoiaMGaillardMReinhardFStojanovMSentchiloV 2008 Stochasticity and bistability in horizontal transfer control of a genomic island in Pseudomonas. Proc Natl Acad Sci U S A 105 20792 20797
34. DubnauDLosickR 2006 Bistability in bacteria. Mol Microbiol 61 564 572
35. VeeningJWStewartEJBerngruberTWTaddeiFKuipersOP 2008 Bet-hedging and epigenetic inheritance in bacterial cell development. Proc Natl Acad Sci U S A 105 4393 4398
36. GaillardMPradervandNMinoiaMSentchiloVJohnsonDR 2010 Transcriptome analysis of the mobile genome ICEclc in Pseudomonas knackmussii B13. BMC Microbiol 10 153
37. SchusterMHawkinsACHarwoodCSGreenbergEP 2004 The Pseudomonas aeruginosa RpoS regulon and its relationship to quorum sensing. Mol Microbiol 51 973 985
38. SuhSJSilo-SuhLWoodsDEHassettDJWestSE 1999 Effect of rpoS mutation on the stress response and expression of virulence factors in Pseudomonas aeruginosa. J Bacteriol 181 3890 3897
39. ElowitzMBLevineAJSiggiaEDSwainPS 2002 Stochastic gene expression in a single cell. Science 297 1183 1186
40. Stewart-OrnsteinJWeissmanJSEl-SamadH 2012 Cellular noise regulons underlie fluctuations in Saccharomyces cerevisiae. Mol Cell 45 483 493
41. TypasABeckerGHenggeR 2007 The molecular basis of selective promoter activation by the σS subunit of RNA polymerase. Mol Microbiol 63 1296 1306
42. ChiangSMSchellhornHE 2010 Evolution of the RpoS regulon: origin of RpoS and the conservation of RpoS-dependent regulation in bacteria. J Mol Evol 70 557 571
43. IlvesHHorakRKivisaarM 2001 Involvement of σS in starvation-induced transposition of Pseudomonas putida transposon Tn4652. J Bacteriol 183 5445 5448
44. Perez-OsorioACWilliamsonKSFranklinMJ 2010 Heterogeneous rpoS and rhlR mRNA levels and 16S rRNA/rDNA (rRNA gene) ratios within Pseudomonas aeruginosa biofilms, sampled by laser capture microdissection. J Bacteriol 192 2991 3000
45. LockeJCYoungJWFontesMHernandez JimenezMJElowitzMB 2011 Stochastic pulse regulation in bacterial stress response. Science 334 366 369
46. EldarAElowitzMB 2010 Functional roles for noise in genetic circuits. Nature 467 167 173
47. ItoYToyotaHKanekoKYomoT 2009 How selection affects phenotypic fluctuation. Mol Syst Biol 5 264
48. DittaGStanfieldSCorbinDHelinskiDR 1980 Broad host range DNA cloning system for gram-negative bacteria: construction of a gene bank of Rhizobium meliloti. Proc Natl Acad Sci U S A 77 7347 7351
49. StolzABusseHJKampferP 2007 Pseudomonas knackmussii sp. nov. Int J Syst Evol Microbiol 57 572 576
50. RavatnRZehnderAJvan der MeerJR 1998 Low-frequency horizontal transfer of an element containing the chlorocatechol degradation genes from Pseudomonas sp. strain B13 to Pseudomonas putida F1 and to indigenous bacteria in laboratory-scale activated-sludge microcosms. Appl Environ Microbiol 64 2126 2132
51. SambrookJRD 2001 Molecular cloning: a laboratory manual, third edn Cold Spring Harbor Cold Spring Harbor Laboratory Press
52. Gerhardt PMRCostilowRNNesterEWWoodWAKriegNR 1981 Manual of methods for general bacteriology. American Society for Microbiology
53. GaillardMPernetNVogneCHagenbuchleOvan der MeerJR 2008 Host and invader impact of transfer of the clc genomic island into Pseudomonas aeruginosa PAO1. Proc Natl Acad Sci U S A 105 7058 7063
54. AltschulSFLipmanDJ 1990 Protein database searches for multiple alignments. Proc Natl Acad Sci U S A 87 5509 5513
55. LavilleJVoisardCKeelCMaurhoferMDefagoG 1992 Global control in Pseudomonas fluorescens mediating antibiotic synthesis and suppression of black root rot of tobacco. Proc Natl Acad Sci U S A 89 1562 1566
56. KristensenCSEberlLSanchez-RomeroJMGivskovMMolinS 1995 Site-specific deletions of chromosomally located DNA segments with the multimer resolution system of broad-host-range plasmid RP4. J Bacteriol 177 52 58
57. Martinez-GarciaECallesBArevalo-RodriguezMde LorenzoV 2011 pBAM1: an all-synthetic genetic tool for analysis and construction of complex bacterial phenotypes. BMC Microbiol 11 38
58. SentchiloVSZehnderAJBvan der MeerJR 2003 Characterization of two alternative promoters and a transcription regulator for integrase expression in the clc catabolic genomic island of Pseudomonas sp. strain B13. Mol Microbiol 49 93 104
59. KristensenCSEberlLSanchez-RomeroJMGivskovMMolinS 1995 Site-specific deletions of chromosomally located DNA segments with the multimer resolution system of broad-host-range plasmid RP4. J Bacteriol 177 52 58
60. Martinez-GarciaEde LorenzoV 2011 Engineering multiple genomic deletions in Gram-negative bacteria: analysis of the multi-resistant antibiotic profile of Pseudomonas putida KT2440. Environ Microbiol 13 2702 2716
61. McClureNCWeightmanAJFryJC 1989 Survival of Pseudomonas putida UWC1 containing cloned catabolic genes in a model activated-sludge unit. Appl Environ Microbiol 55 2627 2634
Štítky
Genetika Reprodukční medicínaČlánek vyšel v časopise
PLOS Genetics
2012 Číslo 7
- Kazuistika – Perspektivy využití precizované medicíny v rámci personalizované specifické terapie onkologických pacientů
- Nobelova cena za chemii pro genetické nůžky: Objev, který změní naši budoucnost?
- Technologie na bázi RNA v klinické praxi: od přebarvených petúnií k terapii vzácných a dosud jen obtížně léčitelných chorob u lidí
- „Nepředstavovali jsme si, že náš výzkum povede přímo ke vzniku nových léků, dokonce ještě za našeho života“
- Bezplatné služby pro diagnostiku ATTRv amyloidózy pro kardiology
Nejčtenější v tomto čísle
- Guidelines for Genome-Wide Association Studies
- The Role of Rice HEI10 in the Formation of Meiotic Crossovers
- Identification of Chromatin-Associated Regulators of MSL Complex Targeting in Dosage Compensation
- GWAS Identifies Novel Susceptibility Loci on 6p21.32 and 21q21.3 for Hepatocellular Carcinoma in Chronic Hepatitis B Virus Carriers
Zvyšte si kvalifikaci online z pohodlí domova
Mazová zátka a její řešení
nový kurzVšechny kurzy