
A Densely Interconnected Genome-Wide Network of MicroRNAs and Oncogenic Pathways Revealed Using Gene Expression Signatures
MicroRNAs (miRNAs) are important components of cellular signaling pathways, acting either as pathway regulators or pathway targets. Currently, only a limited number of miRNAs have been functionally linked to specific signaling pathways. Here, we explored if gene expression signatures could be used to represent miRNA activities and integrated with genomic signatures of oncogenic pathway activity to identify connections between miRNAs and oncogenic pathways on a high-throughput, genome-wide scale. Mapping >300 gene expression signatures to >700 primary tumor profiles, we constructed a genome-wide miRNA–pathway network predicting the associations of 276 human miRNAs to 26 oncogenic pathways. The miRNA–pathway network confirmed a host of previously reported miRNA/pathway associations and uncovered several novel associations that were subsequently experimentally validated. Globally, the miRNA–pathway network demonstrates a small-world, but not scale-free, organization characterized by multiple distinct, tightly knit modules each exhibiting a high density of connections. However, unlike genetic or metabolic networks typified by only a few highly connected nodes (“hubs”), most nodes in the miRNA–pathway network are highly connected. Sequence-based computational analysis confirmed that highly-interconnected miRNAs are likely to be regulated by common pathways to target similar sets of downstream genes, suggesting a pervasive and high level of functional redundancy among coexpressed miRNAs. We conclude that gene expression signatures can be used as surrogates of miRNA activity. Our strategy facilitates the task of discovering novel miRNA–pathway connections, since gene expression data for multiple normal and disease conditions are abundantly available.
Published in the journal:
. PLoS Genet 7(12): e32767. doi:10.1371/journal.pgen.1002415
Category:
Research Article
doi:
https://doi.org/10.1371/journal.pgen.1002415
Summary
MicroRNAs (miRNAs) are important components of cellular signaling pathways, acting either as pathway regulators or pathway targets. Currently, only a limited number of miRNAs have been functionally linked to specific signaling pathways. Here, we explored if gene expression signatures could be used to represent miRNA activities and integrated with genomic signatures of oncogenic pathway activity to identify connections between miRNAs and oncogenic pathways on a high-throughput, genome-wide scale. Mapping >300 gene expression signatures to >700 primary tumor profiles, we constructed a genome-wide miRNA–pathway network predicting the associations of 276 human miRNAs to 26 oncogenic pathways. The miRNA–pathway network confirmed a host of previously reported miRNA/pathway associations and uncovered several novel associations that were subsequently experimentally validated. Globally, the miRNA–pathway network demonstrates a small-world, but not scale-free, organization characterized by multiple distinct, tightly knit modules each exhibiting a high density of connections. However, unlike genetic or metabolic networks typified by only a few highly connected nodes (“hubs”), most nodes in the miRNA–pathway network are highly connected. Sequence-based computational analysis confirmed that highly-interconnected miRNAs are likely to be regulated by common pathways to target similar sets of downstream genes, suggesting a pervasive and high level of functional redundancy among coexpressed miRNAs. We conclude that gene expression signatures can be used as surrogates of miRNA activity. Our strategy facilitates the task of discovering novel miRNA–pathway connections, since gene expression data for multiple normal and disease conditions are abundantly available.
Introduction
MicroRNAs (miRNAs) are naturally occurring small RNA molecules of ∼22 nucleotides that negatively regulate gene expression. Current models propose that miRNAs bind to complementary sequences in the 3′ untranslated regions (UTRs) of target mRNAs, causing either target mRNA degradation or reduced protein translation [1], [2]. miRNAs play important roles in cellular differentiation, proliferation, and apoptosis, and miRNA deregulation has been implicated in cancer [1]. Emerging evidence suggests that miRNAs can also play essential roles in canonical signaling pathways, acting either as regulators of pathway output or as important pathway targets [3], [4], [5]. For example, a recent study has identified the miR-2355 cluster as a critical regulator of the TGF-β signaling pathway [6]. However, although hundreds of miRNAs have been discovered; to date only relatively few miRNAs have been linked to specific signaling pathways. Novel approaches are thus needed to accelerate the identification of miRNA–pathway connections.
Attempts have been made to identify miRNA–pathway relationships on a genome-wide scale [7], [8], [9]. However, most of these previous studies have typically relied on DNA sequence-based computational predictions, comparing lists of genes predicted to be miRNA targets against gene sets of pathway components and cellular functions (e.g. Biocarta and Gene Ontologies). While informative, studies relying primarily on miRNA target sequence predictions may suffer from the limitations of current-generation sequence-based prediction algorithms (e.g., TargetScanS, miRanda, and PITA) which have been shown to produce excessively large numbers of false positives among predicted miRNA target genes [10]. Studies purely based on computational DNA sequence predictions also rarely incorporate actual experimental transcriptomic information, and thus typically can neither determine if a particular miRNA is truly coexpressed with a target pathway component, nor with any other coexpressed miRNAs, in the same cell or tissue. Complementary methodologies are thus needed to explore the true biological diversity of miRNA–pathway relationships.
We, along with several others, have previously used gene expression signatures to predict the activity of oncogenic signaling pathways. In this approach, gene expression profiles of samples exhibiting activation or repression of a specific pathway are compared, producing a list of differentially-expressed genes as a surrogate of that pathway's activity. Once identified, this “pathway signature” can then be subsequently mapped onto independent samples from a wide diversity of disease conditions and tissues. Expression signatures of pathway activity have been used to define distinct subtypes of cancer ([11], uncover prevalently mutated cancer pathways [12], [13], and predict responses to targeted therapies [14]. However, although the concept of using gene expression signatures to predict signaling pathway activity is well-established, to our knowledge no study has investigated if similar signatures can also be used to predict patterns of miRNA activity.
In this study, we addressed this question and demonstrate that gene expression signatures can indeed be used to predict the activity status of specific miRNAs. By combining hundreds of expression signatures representing pathways and miRNAs, we created a miRNA–pathway network allowing the identification of miRNA–pathway connections on a high-throughput, genome wide scale. Notably, because our approach only requires gene expression information, it is readily applicable to the thousands of gene expression data sets currently available in the public domain.
Results
Gene Expression Signatures as Surrogates of miRNA Activity
We conceived a strategy for generating gene expression signatures representing miRNA activity (Figure 1A). First, a training dataset is established comprising biological samples for which both miRNA and mRNA gene expression profiles are known. Second, to build a gene expression signature for any given miRNA X, we chose biological samples where miRNA X was either overexpressed (“miRNA high” group; ≥ the 80th percentile of all samples) or underexpressed (“miRNA low” group; ≤20th percentile). Each miRNA was analyzed independently. Third, we used LIMMA (Linear Models for Microarray Data), a modified t-test incorporating the Benjamini Hochberg multiple hypotheses correction technique [15], to identify differentially expressed genes (mRNAs) between the “miRNA high” and the “miRNA low” groups (significance level p<0.0001). These genes form a candidate signature representing activity of that miRNA. Although this approach requires an initial training data set for which miRNA and mRNA are simultaneously available, this initial step needs only to be done once - once the gene expression signature representing the miRNA has been generated, this signature can then be subsequently mapped against any cohort comprising only mRNA expression information to infer miRNA activity in that cohort.

For clarity, we define three terms that will be used in this study. “miRNA gene expression signature” will refer to a gene expression based signature of miRNA activity. “miRNA gene expression score” will be used to represent the level of miRNA activity predicted by the miRNA gene expression signature, while the term “miRNA expression value” will refer to an actual experimentally determined level of miRNA expression (e.g., measured using an miRNA microarray).
We applied this approach on a training miRNA/mRNA expression dataset of 43 gastric cell lines where each sample had been profiled for expression of 799 miRNAs and 47,000 mRNA transcripts (see Methods). Of the 799 miRNAs, we were able to generate miRNA gene expression signatures for 516 miRNAs (64.6%) above the threshold level of significance (p<0.0001). The remaining 283 miRNAs were not analyzed further, as they were not associated with sufficient numbers of samples in either the “miRNA high” or “miRNA low” groups for meaningful statistical analysis. In this analysis, the minimum number of samples in either the “miRNA high” or “miRNA low” groups was mandated to be three, since this is the minimum number of samples required for meaningful LIMMA analysis. There was no upper limit. The 516 miRNA signatures were then subjected to a robustness test to select signatures passing a False Discovery Rate cutoff of <5% (see Methods, “Robustness of miRNA Gene Expression Signatures”). This operation resulted in a candidate set of 276 miRNA signatures. The complete gene sets and size distributions of the miRNA signatures are presented in Table S1 and Table S2.
To test the ability of the miRNA gene expression signatures to act as surrogates of miRNA expression, we used a previously-described signature mapping technique [11] (Methods and Text S1). Specifically, we mapped the 276 miRNA gene expression signatures onto an independent cohort of 31 primary gastric tumors for which both miRNA and mRNA profiles were available. In this validation analysis, a miRNA signature were deemed to be significantly correlated to actual miRNA expression if the signature was positively correlated to the miRNA (Spearman's correlation R>0) exceeding a threshold q-value of <0.25, where the q-value denotes the significance of the correlation (see Methods). Using this criterion, more than a third of the miRNA gene expression scores (101 out of 276 miRNA signatures, 36.59%) were positively correlated to their actual miRNA expression values across the tumors (Spearman's correlation R>0, q<0.25) (Figure 1B, left panel). Figure 1C shows some examples of miRNAs exhibiting good correlations between miRNA gene expression scores and actual miRNA expression values in this independent test set, such as hsa-miR-10b, hsa-miR-199b-5p, and hsa-miR-409-3p. To evaluate the likelihood that these correlations might have been obtained by chance, we performed a global permutation analysis where the miRNA labels were scrambled in the primary tumor test set 10,000 times, and the percentage of miRNAs exhibiting positive Spearman correlations (R>0, q<0.25) between miRNA gene expression scores and miRNA expression values were computed (see Methods). We found that the number of miRNAs showing positive correlations between miRNA expression values and miRNA expression scores in the actual dataset (101 miRNAs) was consistently greater than that obtainable in 10,000 randomly permuted data sets (i.e., p<0.0001, average number 42 per permutated data set) (Figure 1B, right panel) (Table S3). This result indicates that it is highly unlikely that the observed correlations between miRNA gene expression scores and miRNA expression values are obtained by chance alone.
To investigate the biological applicability of the gastric-derived miRNA signatures beyond gastric cancer, we then analyzed three additional independent validation sets for which gene expression and miRNA data were available (Figures 1D–1F). In a series of 578 ovarian cancers (http://tcga-data.nci.nih.gov/tcga/tcgaHome2.jsp), 61.96% (171 out of 276) of the gastric-derived miRNA signature expression scores were positively correlated to their actual miRNA expression values determined by a miRNA microarray (threshold R>0; q-value q<0.25). Again, this percentage was significantly greater compared to 10,000 randomly permuted data sets (ie p<0.0001) (Figure 1D and Figure S1). In a series of 99 breast tumors (GEO, GSE19783), 38.21% (94 of 246) of the miRNA signature expression scores were positively correlated to their actual miRNA expression values (p<0.0001) (Figure 1E). Finally, in a series of 418 glioblastomas (http://tcga-data.nci.nih.gov/tcga/tcgaHome2.jsp), 33.33% (53 of 159) of the miRNA expression scores were positively correlated to their actual miRNA expression values (p = 0.0059) (Figure 1F).
In a further comparison, we retrieved a signature based on genes differentially expressed in hsa-miR-155-transfected HEK-293 cells compared to control cells (p<0.0005; GSE9264) [17], used it to classify the two largest validation data sets (418 glioblastomas and 578 ovarian cancers), and compared the classification to one based on the gastric-derived hsa-miR-155 miRNA expression scores. For both validation sets, there was either a highly significant or near-significant concordance between tumors assigned as “mir-155 positive” by the HEK293 signature and those tumors assigned as “mir-155 positive” by the gastric-derived hsa-miR-155 expression signature (p = 5.8×10⁻⁷ for glioblastoma and p = 0.06 for ovarian cancer; chi-square test) (Table S4). Taken collectively, these results support the notion that miRNA gene expression signatures can indeed recapitulate actual miRNA expression patterns in a variety of tissues.
Gene Expression Signatures Identify miRNA–Pathway Connections
To identify miRNA–pathway connections, we mapped the 276 miRNA gene expression signatures against a series of cancer sample expression profiles. We then mapped onto the same profiles 174 pathway signatures representing 26 oncogenic pathways [11] (see Table S5 and Table S6 for the signatures and their pathway assignments) (Figure 2A). Integrating the two data sets, we computed correlations between the miRNA and pathway gene expression signatures, identifying miRNAs either positively or negatively correlated to the various pathways based on a preset significance threshold (see Methods for details). To focus on identifying robust miRNA–pathway connections, we repeated the miRNA and pathway signature mapping across five independent cancer cohorts – i) a panel of 39 gastric cancer cell lines, ii) a cohort of 200 primary gastric tumors, iii) a second cohort of 70 primary gastric tumors, iv) a cohort of 189 primary breast tumors, and v) another cohort of 286 primary breast tumors. We only retained those miRNA–pathway associations that a) did not show any contradictions across the cohorts, and b) also existed in the cell line cohort to facilitate subsequent in vitro validation studies (see below). There was a wide range in the numbers of miRNAs correlated to any particular pathway (5–262 miRNAs per pathway, mean ∼151 miRNAs, Table S7). Interestingly, the reproducibility of microRNA-pathway associations did not appear to be significantly influenced by the particular tissue type of the cancer cohorts (Table S8), although we emphasize that this certainly does not rule out the possibility that tissue-specific miRNA effects may, and are indeed likely, to also exist (see Discussion). A complete list of miRNA–pathway associations is available in Table S9, and Table S10 provides a list of the top miRNAs associated with the highest number of pathways.

We surveyed the identified miRNA–pathway interactions in the context of several specific pathways. Supporting the biological relevance of the predicted miRNA–pathway connections, we observed several previously reported and experimentally validated miRNA–pathway associations. A few examples are now presented:
Myc signaling
For the Myc pathway, sufficiently large numbers of Myc-associated miRNAs are known to enable statistical testing of the concordance between the miRNA–pathway connections predicted by our approach to those identified by previous studies [3], [4], . Of 10 miRNAs previously shown to be induced by Myc, all 10 miRNAs were also predicted by our approach to be positively correlated to Myc; while conversely of 8 miRNAs previously shown to be repressed by Myc, 7 were also predicted by our approach to be negatively correlated to Myc (Figure 2B, p = 0.000251, Fisher's exact test, Table S11).
IFN-signaling
IFN-γ protein secretion has been reported to be increased by hsa-miR-146a [17], while hsa-miR-25 has been reported to be repressed in airway smooth muscle cells treated with cytokines IL-1β, TNF-α, and IFN-γ [18]. Using our approach, hsa-miR-146a and hsa-miR-25 were predicted to be positively and negatively associated with IFN-signaling, respectively (Figure 2C).
STAT signaling
Two miRNAs (hsa-miR-146a and a EBV-related miRNA) were predicted by our approach to be positively associated with STAT signaling. hsa-miR-146a (Figure 2D, labeled brown) has been reported to modulate STAT3 signaling [19]. The connection of hsa-miR-146a to both the IFN and STAT pathways is not unexpected, as hsa-miR-146a has been linked to inflammatory/immune responses involving both pathways [20]. The correlation of an EBV miRNA (Figure 2D, labeled red) to the STAT3 pathway may be due to the reported effect of EBV infection on STAT3 activation [21].
P53 signaling
Our approach identified hsa-mir-29a, hsa-mir-29b, and hsa-mir-34a* as being positively correlated to p53 signaling. Supporting this interaction, miRNAs of the mir-29 family have been previously reported to activate p53 [5], and hsa-miR-34a* is the minor sequence of the miR-34a stem-loop which produces hsa-miR-34, a p53 inducible miRNA [22]. Likewise, we identified hsa-mir-18a, hsa-mir-19a, hsa-mir-20a and hsa-mir-92a-1* as being negatively correlated to p53 signaling. These four miRNAs are part of the miR-17-92 cluster, which is repressed by p53 [23] (Figure 2E).
Gene Expression Signatures Identify Novel miRNA Modulators of Wnt Signaling
We then explored if our approach could identify novel miRNA–pathway associations not previously reported in the literature. For this purpose, we focused on the Wnt signaling pathway, since few miRNAs are known to be associated with Wnt signaling. Among the 276 miRNAs analyzed, we identified 29 and 18 miRNAs positively and negatively correlated to Wnt signaling, respectively. To enrich for miRNAs acting as upstream modulators of Wnt signaling rather than downstream targets, we considered from this set only those miRNAs that were a) consistently positively associated with the Wnt pathway in all the cohorts analyzed (Figure 3A), and b) whose expression was not affected by a β-catenin knockdown experiment in AGS gastric cancer cells (see Methods and Table S12). Using these criteria, 4 miRNAs, hsa-miR-205, hsa-miR-221, hsa-miR-517c, and hsa-miR-519a (inside orange rectangle, Figure 3A) were nominated as candidate regulators of Wnt signaling.

To assess the effects of these four miRNAs on Wnt pathway activity, we transfected pri-microRNA sequences of hsa-miR-205, hsa-miR-221, hsa-miR-517c, and hsa-miR-519a into STF-3a cells, which are HEK293 embryonic kidney cells constitutively expressing a TOP-Flash reporter plasmid and overexpressing WNT-3a [24]. TOP-Flash is a luciferase expressing plasmid containing multimerized TCF/LEF binding sites, a standard reporter assay for determining Wnt/β-catenin activity [25]. Compared to control transfected cells, significantly higher TOP-Flash transcriptional activities were observed in STF-3a cells transfected with hsa-miR-205, hsa-miR-221, hsa-miR-517c, or hsa-miR-519a, ranging from 2 - to 25-fold induction (Figure 3B). To extend our analysis beyond the artificial TOP-Flash reporter, we generated gene expression profiles of STF-3a cells transfected with pri-hsa-miR-221, and explored if endogenous Wnt target genes might be regulated by this miRNA. Geneset enrichment analysis (GSEA, [26]) of genes up-regulated in hsa-mir-221 transfected STF-3a cells revealed significant enrichment of the geneset KENNY_WNT_UP (top panel, Figure 3C), corresponding to genes up-regulated in HC11 mammary epithelial cells by expression of constitutively active CTNNB1, a key component of the Wnt pathway [27]. Similarly, GSEA of hsa-miR-519a-transfected STF-3a cells showed significant enrichment of the geneset LIN_WNT_UP, comprising Wnt target genes identified by expression of the Wnt antagonist APC in APC-deficient SW480 colon cancer cells [28] (bottom panel, Figure 3C). These two Wnt-related gene sets (KENNY_WNT_UP and LIN_WNT_UP) were noted because they exhibited the highest GSEA enrichment scores among all Wnt-related genesets in the MSigDB C2 collection for hsa-mir-221 and hsa-miR-519a respectively (Tables S13 and S14). The observation that hsa-miR-221 and hsa-miR-519a transfections can activate two different Wnt-related genesets suggests that these two miRNAs may contribute to distinct Wnt-related regulatory cascades. No increases in TCF/LEF transcriptional activity were observed when the miRNA transfections were performed on STF cells not expressing WNT-3a (data not shown). These results suggest these miRNAs may modulate Wnt activity, but can only do so in the presence of an active Wnt ligand. Interestingly, while not achieving significance, several genes upregulated in the gastric-derived mir-221 signature were also upregulated in expression profiles of hsa-mir-221 transfected STF-3a cells (positive Normalized Enrichment Score (NES) = 0.84), and several genes downregulated in the gastric-derived mir-221 signature were also downregulated in the hsa-mir-221 transfected STF-3a cells (negative Normalized Enrichment Score (NES) = −1.652) (Figure S2). For mir-519a, we again found that several genes upregulated in the gastric-derived mir-519a signature were also found to be upregulated in hsa-mir-221 transfected STF-3a cells (positive Normalized Enrichment Score (NES) = 1.091). Only one gene was downregulated in the hsa-mir-519a signature, which is insufficient for GSEA analysis. These results may suggest that certain genes belonging to a miRNA signature may themselves be directly or indirectly regulated by that miRNA.
The miRNA–Pathway Network Reveals a High Level of Functional Redundancy
The availability of an extensive catalog of miRNA–pathway connections provided us with the opportunity to analyze the global properties of the miRNA–pathway network. Integrating gene expression signatures from 276 miRNAs passing the signature robustness test (see Methods) and 174 pathway signatures representing 26 oncogenic pathways, we constructed a miRNA–pathway network of 302 nodes and 12442 edges (Figure 4A, see Methods for network construction). Here, ‘node’ refers to either a pathway or miRNA signature, and edges refer to significant correlations between nodes, which can be either positive (“positive edges”) or negative (“negative edges”).
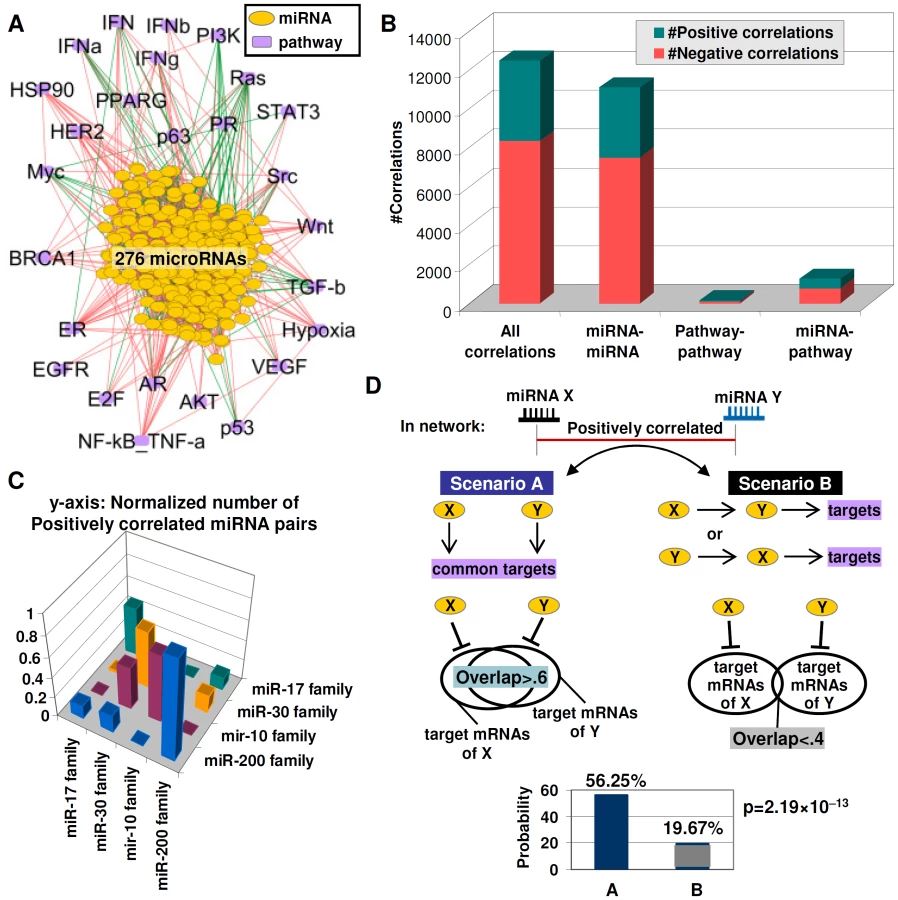
We found that the miRNA–pathway network is dominated by positive edges (8327 positive vs. 4115 negative) (Figure 4B), similar to previously reported gene co-expression networks [29]. miRNA-miRNA connections form the bulk of edges in the network, an expected result given the higher number of miRNA nodes (Figure 4B). Formally, positive edges connecting two miRNAs X and Y can reflect two different scenarios. In Scenario A, miRNAs X and Y act independently from one another to exert similar downstream effects i.e., X and Y exhibit “redundancy”. In Scenario B, miRNA X may regulate miRNA Y, with Y proceeding to exert the actual downstream effect, or vice versa (Figure 4D). We sought to determine which of these scenarios might characterize the miRNA-miRNA edges in the network. First, we tested if positive miRNA-miRNA edges in the network might be selectively enriched in members from the same miRNA family, since same family-miRNAs are known to exhibit redundant or partially redundant functions [30]. Testing four different miRNA families (miR-200 family; mir-17 family; miR-30 family; miR-10 family; Table S15) (Figure 4C), we found that that a miRNA was >5 times more likely to be positively correlated to another miRNA from the same family, rather than a miRNA from a different family (67.02% vs. 10.90%, p = 4.76×10⁻²⁹, Table S16), supporting the notion that miRNA-miRNA edges in the network are likely to identify functionally redundant miRNAs.
We extended our analysis from same-family miRNAs to all miRNAs in the network. Since functionally-redundant miRNAs are likely to share significant overlaps of predicted target mRNA sequences, we used four sequence-based prediction databases (MiRanda, PicTar, TarScan, and PITA; Table S17) to identify predicted target mRNAs for 215 miRNAs in the network (78%) (Figure 4D). We found that miRNAs with significant overlaps in target mRNAs (overlap ratio>0.6, see Methods) were >2 times more likely to be connected via positive miRNA-miRNA edges compared to miRNAs with small target mRNA overlaps (56.25% vs. 19.67%, p = 2.19×10⁻¹³, Figure 4D, Table S18). These results suggest that positive miRNA-miRNA edges in the network are likely to represent miRNA pairs with a high degree of functional redundancy, as evidenced by their targeting similar sets of downstream genes.
Oncogenic Signaling Pathways Frequently Target miRNAs Exerting Similar Downstream Effects
Previous studies have proposed that signaling pathways are frequently targeted by multiple independent miRNAs (‘miRNA cotargeting’; [7] (Figure 5A, left). The availability of the miRNA–pathway network allowed us to investigate the reciprocal possibility – that oncogenic signaling pathways might also co-ordinately regulate several miRNAs with similar downstream effects, which we refer to as “pathway cotargeting” (Figure 5A, right). To identify candidate miRNAs co-targeted by the same pathway, we nominated pairs of miRNA where both members were jointly positively or negatively correlated to the same common pathway. Of 262 miRNAs in the network significantly correlated with at least one pathway, 8020 miRNA pairs (out of >20,000 possible pairs) were candidates for pathway cotargeting, including hsa-miR-497 and hsa-miR-503 (ER, Ras, and TGF-β), hsa-miR-20a and hsa-miR-372 (EGFR and p53), and hsa-miR-192 and hsa-miR-215 (BRCA1 and HER2).

Our analysis suggests that miRNA pairs jointly correlated to the same pathway are likely to represent miRNAs commonly regulated by the pathway. Specifically, we found that miRNA pairs jointly correlated to the same pathway exhibited a strong preference to be expressed from the same chromosomal region, suggesting that they may possess common upstream regulators. Examining genomic clusters of commonly transcribed miRNAs [31], we found that miRNA pairs located in the same genomic cluster were twice as likely to be jointly correlated to the same pathway compared to miRNA pairs transcribed from different genomic clusters (80.95% vs. 38.54%, p = 8.22×10⁻⁸, chi-square test) (Figure 5B, Table S19). For example, hsa-miR-18a and hsa-miR-19a, which are transcribed at a miRNA cluster at 13q31.3, were jointly correlated to EGFR, IFN-γ, Myc, and p53. Indeed, these miRNAs have also been independently shown to be co-regulated by Myc signalling [16]. As another example, hsa-miR-154 and hsa-miR-377 located at 14q32.31 were jointly correlated to Myc, TGF-β, and VEGF pathways. The frequent occurrence of genomic co-localization (thereby assuming common upstream regulation) within miRNA pairs jointly correlated to the same pathway makes it likely that these miRNA pairs are co-regulated by the same pathway.
miRNAs exhibiting joint correlations with common pathways were also highly enriched in miRNA pairs exhibiting significant overlaps in predicted target mRNAs (overlap ratio>0.6) relative to miRNA pairs with small target mRNA overlaps (73.44% vs 35.08%, p = 1.4×10⁻¹⁰) (Figure 5C, Table S20a). This result suggests that miRNAs jointly correlated to a pathway tend to exert similar downstream effects. The high overlaps in predicted target mRNAs are unlikely to be explained by high levels of sequence similarity between miRNA pairs, since a control analysis using only miRNAs with pairwise sequence similarity scores of less than -5 (see Methods) yielded similar results (67.86% vs. 35.54%, p = 0.000357, Table S20b). Notably, some of those downstream effects may involve feedback activation or inhibition of the pathway itself.
The miRNA–Pathway Network Exhibits a Small-World Modular Organization and Is Densely Interconnected
Finally, we expanded our analysis of the miRNA–pathway network to consider its global topological and network features. The term “small-world network” has been previously used to refer to a network organization that is highly clustered with small path lengths (average lengths of the shortest path connecting any two nodes). Examples of previously known small-world networks are neural circuits of the vertebrate brain [32], the power grid of the western United States, and the collaboration graph of film actors [33]. Our topological analysis suggests that the miRNA–pathway network is also likely to exhibit a small-world organization. Comparing topological features of the miRNA–pathway network to an equivalent random graph with the same number of nodes and degree, we found that the miRNA–pathway network fulfils two key prerequisites for a small-world network [33], referred to as Ls > = Lr and that Cs>>Cr. First, the characteristic path length of the miRNA–pathway network, LmicroRNA−path, is 1.7822, which is almost equal to, but greater than the characteristic path length for an equivalent random graph network, Lrand = 1.7241±0.0008 (mean±std from 1000 permutations, see Methods). Second, the clustering coefficient of the miRNA–pathway network, CmicroRNA−path = 0.6351, is more than twice the clustering coefficient of the equivalent random graph network, Crand = 0.2705±0.0013. For networks with small node numbers of nodes (∼200–3000, miRNA–pathway network: 302 nodes), the observation that CmicroRNA−path>Crand is sufficient to demonstrate small-world properties [34].
This result also indicates that the miRNA–pathway network is more than twice as modular compared to an equivalent random graph, since the clustering coefficient Cs is a measure of potential network modularity. Analyzing the miRNA–pathway network presented in Figure 4A, we found that the miRNA–pathway network is coherently structured in a strongly modular manner, with at least two major modules and two smaller modules (Figure 6A, left panel). In comparison, a simulated hierarchical network of the same size exhibited a higher number of modules (>20) that were distinctly smaller compared to the miRNA–pathway modules (Figure 6B, right panel). An even mix of miRNAs and pathways were localized to each module (Figure 6A, left panel).

Besides being small world, genetic and metabolic networks such as protein-protein interaction and yeast transcriptional or gene regulatory networks have also been shown to be “scale-free”, where the majority of connections are dominated by a small number of nodes (“hubs”) [35], [36]. To ask if the miRNA–pathway network might obey a scale-free character, we analyzed the degree distribution plot of the miRNA–pathway network, which characterizes the probability of a node having a certain number of neighbors. Strikingly, instead of obeying a power law, most of the connections in the miRNA–pathway network are of the many-to-many type (Figure 6B, left panel). Specifically, >98% of nodes in the miRNA–pathway network have more than 10 neighbors (Figure 6B, left panel), compared to only 1.7% in a simulated network typical of gene regulatory and metabolic networks (see Methods) (Figure 6B, right panel). This result suggests that the miRNA–pathway network is not scale-free. This result may be related to the observation that the miRNA–pathway network comprises mostly miRNAs that can regulate multiple pathways, and which are in turn regulated by multiple pathways. In other words, the miRNA–pathway network is primarily comprised of regulators. This observation is further pursued in the Discussion.
Discussion
In this study, we have described a general approach for generating gene expression signatures which can be used to infer patterns of miRNA expression. Validation of this approach was demonstrated in both a training set and also an independent test set of gastric cancer samples. The member genes in the miRNA gene expression signature, while comprising genes transcriptionally altered as a consequence of miRNA activity, may not necessarily be direct miRNA target genes. This feature distinguishes our study from previous studies using sequence-predicted miRNA target genes to annotate miRNA functions. To our knowledge, our study is the first to demonstrate the ability of gene expression signatures to act as surrogates of miRNA activity. While the current analysis is limited to 276 miRNA signatures passing various quality and significance threshold cutoffs, applying this strategy to larger and more generalized training sets will undoubtedly identify more miRNA signatures. The current work should thus be regarded a proof-of-concept on the feasibility of gene expression signatures as surrogates of miRNA expression.
Using gene expression signatures to predict miRNA activity may address two major limitations currently facing miRNA–pathway discovery efforts – cost and scalability. Currently, most available experimental platforms (e.g., microarrays, deep sequencing) require the use of separate analytical assays to generate miRNA and mRNA information for a single sample (e.g., different microrarrays, or different RNA isolation techniques), increasing cost, time, and effort. Using gene expression signatures, it may be possible to analyze both miRNA and pathway activity patterns using a single common platform of gene expression. Moreover, because only gene expression information is required once the miRNA signature is known, any sample cohort for which gene expression (mRNA) data is available can be analyzed, without the requirement for companion miRNA data. This strategy thus opens up the availability of the thousands of publicly available microarray data sets for the discovery of new miRNA–pathway connections. Notably, we found that many of the miRNA signatures could recapitulate patterns of actual miRNA expression in a variety of different tumor types. This may not be too surprising, as it is conceptually similar to studies where gene expression signatures linked to pathways or drugs have been shown to exhibit broad applicability even in tissues distinct from those where the original signatures were derived (eg [14], [37]). However, we emphasize that our study does not rule out the possibility that miRNAs may exert tissue-specific effects.
One immediately useful application of miRNA gene expression signatures lies in identifying novel miRNAs linked to canonical signalling pathways. Using the miRNA–pathway network constructed in this study, we confirmed a host of previously reported miRNA pathway interactions, and identified four miRNAs as new candidate Wnt modulators (hsa-miR-205, hsa-miR-221, hsa-miR-517c, hsa-miR-519a). Experimental evidence supporting that these miRNAs are indeed Wnt regulators was also provided using cell line transfections, reporter assays, and gene expression profiling. Our study thus provides a large resource of potential pathway-modulating miRNAs for a variety of pathways which can be further tested by researchers. The information provided by this study is unlikely to be duplicated by other studies attempting to relate specific miRNAs to pathways and processes, as these previous studies have primarily relied on sequence-based miRNA target predictions, which have high false positive rates [10] and a general lack of tissue context – i.e., sequence-matches between a miRNA and a collection of mRNAs does not guarantee that the miRNA is indeed coexpressed with the target mRNA in the same cell type or tissue.
Besides miRNA interactions with individual pathways, our work reveals that co-expressed miRNAs are likely to exhibit a high degree of functional redundancy in targeting similar sets of downstream genes, and that signalling pathways may frequently cotarget multiple independent miRNAs with similar downstream effects. This observation extends previous studies [7] reporting the widespread existence of multiple pairs of miRNAs which target common genesets. Our observation that pathways frequently cotarget multiple miRNAs provides further evidence that miRNAs rarely act singly and almost always act in combinations to modulate cellular behaviour. The role of miRNAs as broad modulators may also explains the selection pressure for functional redundancies [30].
The functional role of miRNAs as broad modulators of cellular activities, rather than activators or repressors of specific genes, also explains the large modularity and non-scale-free attributes of the miRNA–pathway network, revealed by global topological analysis [1], [2]. The non-scale-free nature of the network is also likely explained by the membership of the network itself. Compared to the membership of typical scale-free genetic networks such as gene regulatory networks (GRNs) comprising a few master regulators and downstream effectors, the miRNA–pathway network is comprised entirely of regulators (miRNAs and pathways). An implication of the small-world but non-scale-free architecture is greater resilience to targeted “hits” than scale-free networks. Scale-free networks are resilient to randomly placed damage or failure, but susceptible to targeted attacks on the hubs (the few highly connected nodes), since such hits would remove a disproportionate amount of the links in the network [38]. The oncogenic miRNA–pathway network, with its small-world but non-scale-free architecture, does not rely on a few highly connected hubs, but spreads its “risk” across the many interconnected nodes (especially miRNAs). The implications of this finding on attempts to perturb cell function using miRNAs deserve further study.
In conclusion, our finding that gene expression signatures can capture miRNA activity is in general agreement with proposals that many cellular perturbations (e.g., responses to extracellular ligands, disease states, gene mutations) are likely to cause transcriptomic changes, and that these perturbations can be captured using gene expression signatures. Because functionally significant perturbations are certainly not limited to miRNAs and pathways alone, but can also include other genetic factors (SNPs, copy number variations, and mutation status) and epigenetic factors (e.g., DNA methylation and histone modification), there is in principle no reason why similar strategies could not be used to represent these other factors as well. Using gene expression signatures as a “common currency”, it may thus be possible to integrate multiple types of cellular perturbations into a common network, as we have done for miRNAs and pathways in this study. This may prove a powerful approach to identify functionally relevant relationships across a host of molecular levels that ultimately constitute the disease regulatory landscape.
Materials and Methods
Cell Lines and Primary Clinical Specimens
GC cell lines AGS, Kato III, SNU1, SNU5, SNU16, NCI-N87, and Hs746T were obtained from the American Type Culture Collection. AZ521, Ist1, TMK1, MKN1, MKN7, MKN28, MKN45, MKN74, Fu97, and IM95 cells were obtained from the Japanese Collection of Research Bioresources/Japan Health Science Research Resource Bank and cultured as recommended. SCH cells were a gift from Yoshiaki Ito (Institute of Molecular and Cell Biology, Singapore) and were grown in RPMI media. YCC1, YCC3, YCC6, YCC7, YCC10, YCC11, and YCC16 cells were a gift from Sun-Young Rha (Yonsei Cancer Center, South Korea) and were grown in MEM supplemented with 10% fetal bovine serum (FBS), 100 units/mL penicillin, 100 units/mL streptomycin, and 2 mmol/L L-glutamine (Invitrogen). In total, 39 unique GC cell lines, 2 fibroblast cell lines, and 1 normal gastric epithelial cell line (HFE145) were profiled. Wnt activity was assessed using STF-3a cells, which are HEK293 cells engineered to stably express WNT3A and a SuperTopFlash (STF) reporter gene [24]. Primary gastric tumors were obtained from the Singhealth Tissue Repository, an institutional resource of National Cancer Centre of Singapore and Singapore General Hospital. All patient samples were obtained with informed patient consent and approvals from Institutional Review Boards and Ethics Committees.
miRNA and Gene Expression Profiling
Gastric cell lines and primary tumors were profiled using Human miRNA (V2) Microarrays (Agilent) and Affymetrix Human Genome U133 plus Genechips (HG-U133 Plus 2.0, Affymetrix). Where multiple probes existed for a unique miRNA, we took the probe providing the highest variance across samples as representative of that miRNA. The miRNA and gene expression data used in this manuscript can be accessed from the Gene Expression Omnibus (GEO) under accession numbers GSE22183 (miRNA, cell lines), GSE23739 (miRNA, primary tumors), GSE15459 (mRNA, primary tumors), GSE2990 (mRNA, 189 breast tumors), and GSE2034 (mRNA, 286 breast tumors). For independent validations, we used a breast cancer data set (GSE19783, mRNA and miRNA datasets analyzed using series matrices provided at GEO), and the TCGA ovarian cancer and glioblastoma data sets (http://tcga-data.nci.nih.gov/tcga/tcgaHome2.jsp; Ovarian: Level 2 datasets (mRNA (U133A) and miRNA (Agilent V2); Glioblastoma: Level 2 datasets (mRNA (U133A) and miRNA (Agilent V1)). Only samples having both mRNA and miRNA profiles associated with the 276 miRNA gastric-derived signatures were included in analysis. We also analyzed a signature based on genes differentially expressed in hsa-miR-155-transfected HEK-293 cells (compared to control, nominal p<0.0005 using LIMMA; GSE9264) [39].
Robustness of miRNA Gene Expression Signatures
To assess the robustness of a miRNA signature, permutation tests were performed where the labels of profiles belonging to the “miRNA high group” and the “miRNA low group” were randomly shuffled 1000 times, and the number of differentially expressed genes between the two permuted groups were counted (permuted signature size). The number of times the permuted signature size exceeded the actual signature size over N = 1000 was taken as the False Discovery Rate (FDR) representing the probability that the signature is not robust (the null hypothesis). A FDR <5% threshold was used in this study to select signatures for further analysis. 276 signatures remained after the signature robustness permutation tests were performed on the original 516 miRNA signatures identified in the discovery set.
Correlations between miRNA Signature Expression Scores and Actual miRNA Expression Values
miRNA signatures were deemed to be significantly correlated to actual miRNA expression if a signature was both positively correlated to the miRNA (Spearman's correlation R>0) at a threshold q-value of <0.25, where the q-value denotes the significance of the correlation. To compute the q-value of a miRNA signature, we first obtained a nominal p-value representing the significance of the Spearman correlation coefficient between the miRNA signature score and actual miRNA expression. This nominal p-value was then corrected for multiple comparisons using the R function p.adjust, with method option set to “BH” [40], yielding a final q-value. We also used permutation tests to assess the global significance of an observed proportion of miRNA expression signatures positively correlated to actual miRNA expression in the validation data sets. Here, we randomly scrambled the miRNA labels of the miRNA expression signatures 10,000 times, and counted the number of times that percentage of randomized miRNA gene expression scores positively correlated to actual miRNA expression data exceeded the actual data. The value was used as a nominal p-value with which to accept (p>0.05) or reject the null hypothesis (p<0.05), the null hypothesis being that a random miRNA signature is able to predict the expression of a specific miRNA X as accurately as the miRNA X signature itself.
miRNA–Pathway Network Construction
miRNA and pathway gene expression signatures were mapped onto individual cancer samples using a previously-described signature mapping approach [11], where for each signature (miRNA or pathway) a rank-based, non-parametric method was used to compute a score for each sample representing the ‘activation’ state of that signature. A detailed description of this method is provided in Text S1. Gene expression signatures (n = 174) were obtained from MSigDB (Table S5 provides signature details), and further summarized into 26 major oncogenic pathways reflecting oncogenesis and the tumor microenvironment (see Table S6 for the 26 pathways and the signatures representing them). For the network construction, we only selected those MSigDB C2 signatures representing 26 pathways - This was specifically done to focus our analysis of those pathways relevant to cancer (Akt, Myc, etc), while eliminating from analysis those pathways that were either not related or peripherally related (eg signatures related to heart disease). Significant miRNA–pathway, miRNA-miRNA, and pathway-pathway associations were identified by computing Spearman correlation coefficients (either positive or negative) between the expression/activation scores of each signature pair across the cohort. Because the 26 pathways are summarized from multiple individual signatures, associations involving pathways and a second entity (e.g., a miRNA or another pathway) were only retained when they met the following criteria: at least one signature in the pathway must be significantly positively or negatively correlated with the second entity, and no significantly discordant correlations among the remaining individual signatures are observed. All p-values were corrected for multiple hypothesis testing [41]). Spearman correlations with a corresponding FDR<0.05 were considered. The network associations were iteratively applied to five cancer cohorts: 39 gastric cancer cell lines (“GCCL”, subset of the training gene expression dataset), 200 primary gastric tumors (“SG GC”), 70 primary gastric tumors (“AU GC”), 189 primary breast tumors (“Sotiriou Breast”), and 286 primary breast tumors (“Wang Breast”). Any associations observed to be discordant across any two of the five cohorts were discarded.
Experimental Validation of Wnt-Related miRNAs
To identify candidate miRNAs regulated by β-catenin knockdown after 24h or 48h β-catenin siRNA treatment, control and β-catenin siRNA treated cells (24h, 48h) were profiled on Human miRNA microarrays (V2) (Agilent). Three independent replicates were compared to identify differentially regulated miRNAs. To measure effects of hsa-miR-205, hsa-miR-221, hsa-miR-517c, and hsa-miR-519a on Wnt activity, TOPFLASH assays were conducted on STF-3A cells transfected with these miRNAs as as previously described [42]. All experiments were repeated three independent times. Gene expression profiling using Affymetrix Human Genome U133 plus Genechips (HG-U133 Plus 2.0, Affymetrix) were also performed on pri-hsa-miR-221 and pri-hsa-miR-519a transfected STF-3A cells. Expression profiles were processed using MAS5.0 (R/Bioconductor), log10 transformed, median centered, and subjected to ComBat [43] for batch effect elimination. Geneset Enrichment Analysis (GSEA) was run on the processed dataset using the C2 (curated genesets) subset of MSigDB (Release 2.5). The Wnt-related genesets with the most significant enrichments are discussed, and the complete lists of ranked genesets are provided in Tables S13 and S14.
Predicted Target mRNAs and Sequence Similarity Analysis
Predicted target mRNAs for the 276 microRNAs analyzed in this study were obtained by combining data from four prediction databases: MiRanda, PicTar, TarScan, and PITA. The final set of predicted target mRNAs for a microRNA is the union of the sets of predicted target mRNAs from all four prediction databases. Here, we chose to use the union rather than the intersect of the various target prediction programs because considering the latter would limit our analysis to only those miRNAs contained in the four databases, which would severely confine subsequent analysis. We used genes (as defined by HUGO symbols) as the basic unit of target mRNAs. Details of the sources for the predicted target mRNAs are available in Table S17. Overlap ratios between the set of target mRNAs for miRNA X, SX, and the set of target mRNAs for miRNA Y, SY, were computed as follows: Overlap ratio = |(SX ∩ SY)|/min(|SX|, |SY|). miRNA sequence information was obtained from ftp://mirbase.org/pub/mirbase/CURRENT/mature.fa.gz and sequence similarity scores between pairs of microRNAs were computed using the pairwiseAlignment function from Bioconductor package Biostrings. To eliminate microRNA pairs with close sequence similarity, we retained only microRNA pairs with pairwise sequence similarity scores of less than -5. (The sequence similarity score for an identical pair of miRNAs would be 0.)
Network Models
Random graph networks were generated using the Erdos-Renyi model [44], where all possible pairs of N = 302 nodes were connected with probability p = 1 and an initial node degree of kinitial = 44, such that the resulting random graph is equivalent to the miRNA–pathway network in terms of numbers of nodes (302) and mean degree (81.3303±0.2537 for 1000 generated random networks compared to 82.397 for the miRNA–pathway network). Each pairwise correlation was considered as a two-way interaction and no self-correlations were assumed in the microRNA-pathway network. Clustering coefficients for individual nodes i were defined as Ci = 2n/ki(ki - 1), where n denotes the number of direct links connecting the ki nearest neighbors of node i [33]. The clustering coefficient for a network S, CS, is the mean of Ci over all nodes i in the network S and is a measure of the potential modularity of S. Hierarchical scale-free networks (HSFN) were generated using a slightly modified version of a previously outlined iterative construction algorithm [45]. Briefly, a 4-level HSFN was first built using a fully connected cluster of 4 nodes as the basic construction unit. Then, a 2-level HSFN was built using a fully connected cluster of 7 nodes as the basic construction unit. The outer nodes of the outer clusters at the second level of the 2-level HSFN were then connected to the central node of the 4-level HSFN, in a manner similar to the second level of the 4-level HSFN itself to that central node. We then eliminated 3 of the outer nodes of the 2-level HSFN so that the final HSFN was exactly of the same size as the microRNA-pathway network (302 nodes). The degree of topological overlap between two nodes i and j, OT(i, j), was computed as [#Common neighbors(i, j)]/[min (ki, kj)], where ki, kj are the degrees of node i and node j, respectively.
Other Statistical Analysis and Visualization Methods
P-values denoting the significance of a corresponding Spearman correlation coefficient R between two N-element vectors were estimated from the Student t-distribution, against the null hypothesis that the observed value of t = R/√[(1−R2)/(N–2)] comes from a population in which the true correlation coefficient is zero. Hierarchical clustering and heatmap displays were conducted using BioConductor packages gplots and RColorBrewer, using default parameters, a Euclidean distance metric and complete linkage.
Supporting Information
Zdroje
1. KloostermanWPPlasterkRH 2006 The diverse functions of microRNAs in animal development and disease. Developmental Cell 11 441 450
2. BartelDP 2009 MicroRNAs: target recognition and regulatory functions. Cell 136 215 233
3. PetroccaFVecchioneACroceCM 2008 Emerging Role of miR-106b-25/miR-17-92 Clusters in the Control of Transforming Growth Factor β Signaling. Cancer Research 68 8191 8191
4. ChangTCYuDLeeYSWentzelEAArkingDE 2008 Widespread microRNA repression by Myc contributes to tumorigenesis. Nat Genet 40 43 50
5. ParkS-YLeeJHHaMNamJ-WKimVN 2008 miR-29 miRNAs activate p53 by targeting p85alpha and CDC42. Nature Structural & Molecular Biology 16 23 29
6. JimaDDZhangJJacobsCRichardsKLDunphyCH 2010 Deep sequencing of the small RNA transcriptome of normal and malignant human B cells identifies hundreds of novel microRNAs. Blood 116 e118 127
7. TsangJEbertMvan OudenaardenA 2010 Genome-wide dissection of microRNA functions and cotargeting networks using gene set signatures. Mol Cell 38 140 153
8. PapadopoulosGLAlexiouPMaragkakisMReczkoMHatzigeorgiouAG 2009 DIANA-mirPath: Integrating human and mouse microRNAs in pathways. Bioinformatics 25 1991 1993
9. WangX 2008 miRDB: a microRNA target prediction and functional annotation database with a wiki interface. RNA 14 1012 1017
10. YueDLiuHHuangY 2009 Survey of Computational Algorithms for MicroRNA Target Prediction. Curr Genomics 10 478 492
11. OoiCHIvanovaTWuJLeeMTanIB 2009 Oncogenic pathway combinations predict clinical prognosis in gastric cancer. PLoS Genet 5 e1000676 doi:10.1371/journal.pgen.1000676
12. MillerLDSmedsJGeorgeJVegaVBVergaraL 2005 An expression signature for p53 status in human breast cancer predicts mutation status, transcriptional effects, and patient survival. Proc Natl Acad Sci U S A 102 13550 13555
13. LobodaANebozhynMKlinghofferRFrazierJChastainM 2010 A gene expression signature of RAS pathway dependence predicts response to PI3K and RAS pathway inhibitors and expands the population of RAS pathway activated tumors. BMC Med Genomics 3 26
14. BildAHYaoGChangJTWangQPottiA 2006 Oncogenic pathway signatures in human cancers as a guide to targeted therapies. Nature 439 353 357
15. SmythGK 2005 Limma: linear models for microarray data. R. GentlemanVCDudoitSIrizarryRHuberW Bioinformatics and Computational Biology Solutions using R and Bioconductor New York Springer 397 420
16. O'DonnellKAWentzelEAZellerKIDangCVMendellJT 2005 c-Myc-regulated microRNAs modulate E2F1 expression. Nature 435 839 843
17. GuoMMaoXJiQLangMLiS 2010 miR-146a in PBMCs modulates Th1 function in patients with acute coronary syndrome. Immunology and Cell Biology doi:10.1038/icb.2010.16
18. KuhnASchlauchKLaoRHalaykoAGerthofferWT 2010 MicroRNA expression in human airway smooth muscle cells: role of miR-25 in regulation of airway smooth muscle phenotype. Am J Respir Cell Mol Biol 42 506 513
19. LiuXNelsonAWangXKanajiNKimM 2009 MicroRNA-146a modulates human bronchial epithelial cell survival in response to the cytokine-induced apoptosis. Biochem Biophys Res Commun 380 177 182
20. TaganovKDBoldinMPChangKJBaltimoreD 2006 NF-kappaB-dependent induction of microRNA miR-146, an inhibitor targeted to signaling proteins of innate immune responses. Proc Natl Acad Sci U S A 103 12481 12486
21. LoAKLoKWTsaoSWWongHLHuiJW 2006 Epstein-Barr virus infection alters cellular signal cascades in human nasopharyngeal epithelial cells. Neoplasia 8 173 180
22. TarasovVJungPVerdoodtBLodyginDEpanchintsevA 2007 Differential regulation of microRNAs by p53 revealed by massively parallel sequencing: miR-34a is a p53 target that induces apoptosis and G1-arrest. Cell Cycle 6 1586 1593
23. YanHLXueGMeiQWangYZDingFX 2009 Repression of the miR-17-92 cluster by p53 has an important function in hypoxia-induced apoptosis. EMBO J 28 2719 2732
24. CoombsGSYuJCanningCAVeltriCACoveyTM 2010 WLS-dependent secretion of WNT3A requires Ser209 acylation and vacuolar acidification. J Cell Sci 123 3357 3367
25. KorinekVBarkerNMorinPJvan WichenDde WegerR 1997 Constitutive transcriptional activation by a β-catenin -Tcf complex in APC-/ - colon carcinoma. Science 275 1784 1787
26. SubramanianATamayoPMoothaVKMukherjeeSEbertBL 2005 Gene set enrichment analysis: A knowledge-based approach for interpreting genome-wide expression profiles. Proc Natl Acad Sci USA 102 43 15545 15550
27. KennyPAEnverTAshworthA 2005 Receptor and secreted targets of Wnt-1/β-catenin signalling in mouse mammary epithelial cells. BMC Cancer 5 3
28. LinYMOnoKSatohSIshiguroHFujitaM 2001 Identification of AF17 as a downstream gene of the β-catenin T-cell factor pathway and its involvement in colorectal carcinogenesis. Cancer Research 61 6345 6349
29. LeeHHsuASajdakJQinJPavlidisP 2004 Coexpression analysis of human genes across many microarray data sets. Genome Res 14 1085 1094
30. BrenneckeJStarkARussellRBCohenSM 2005 Principles of MicroRNA–Target Recognition. PLoS Biol 3 e85 doi:10.1371/journal.pbio.0030085
31. YuJWangFYangG-HWangF-LMaY-N 2006 Human microRNA clusters: Genomic organization and expression profile in leukemia cell lines. Biochemical and Biophysical Research Communications 349 59 68
32. HumphriesMDGurneyKPrescottTJ 2006 The brainstem reticular formation is a small-world, not scale-free, network. Proceedings of the Royal Society B: Biological Sciences 273 503 511
33. WattsDJStrogatzSH 1998 Collective dynamics of ‘small-world’ networks. Nature 393 440 442
34. MontoyaJMSolRV 2002 Small world patterns in food webs. J Theor Biol 214 405 412
35. BarabasiALOltvaiZN 2004 Network biology: understanding the cell's functional organization. Nature Review Genetics 5 101 113
36. van NoortVSnelBHuynenMA 2004 The yeast coexpression network has a small-world, scale-free architecture and can be explained by a simple model. EMBO Reports 5 280 284
37. LambJCrawfordEDPeckDModellJWBlatIC 2006 The Connectivity Map: using gene-expression signatures to connect small molecules, genes, and disease. Science 313 5795 1929 1935
38. AlbertRBarabasiA-L 2002 Statistical mechanics of complex networks. REVIEWS OF MODERN PHYSICS 74 47 97
39. SkalskyRLSamolsMAPlaisanceKBBossIWRivaA 2007 Kaposi's sarcoma-associated herpesvirus encodes an ortholog of miR-155. J Virol 81 12836 12845
40. BenjaminiYHochbergY 1995 Controlling the false discovery rate: a practical and powerful approach to multiple testing. Journal of the Royal Statistical Society, Series B (Methodological) 57 289 300
41. StoreyJDTibshiraniR 2003 Statistical significance for genome-wide experiments. Proc Natl Acad Sci U S A 100 9440 9445
42. GanesanKIvanovaTWuYRajasegaranVWuJ 2008 Inhibition of Gastric Cancer Invasion and Metastasis by PLA2G2A, a Novel β-catenin/TCF Target Gene. Cancer Res 68 4277 4286
43. JohnsonWELiCRabinovicA 2007 Adjusting batch effects in microarray expression data using empirical Bayes methods. Biostatistics 8 118 127
44. WestDB 2001 Introduction to Graph Theory: Prentice Hall
45. RavaszEBarabásiAL 2003 Hierarchical organization in complex networks. Phys Rev E Stat Nonlin Soft Matter Phys 67 026112
Štítky
Genetika Reprodukční medicínaČlánek vyšel v časopise
PLOS Genetics
2011 Číslo 12
- Kazuistika – Perspektivy využití precizované medicíny v rámci personalizované specifické terapie onkologických pacientů
- Nobelova cena za chemii pro genetické nůžky: Objev, který změní naši budoucnost?
- Technologie na bázi RNA v klinické praxi: od přebarvených petúnií k terapii vzácných a dosud jen obtížně léčitelných chorob u lidí
- „Nepředstavovali jsme si, že náš výzkum povede přímo ke vzniku nových léků, dokonce ještě za našeho života“
- Bezplatné služby pro diagnostiku ATTRv amyloidózy pro kardiology
Nejčtenější v tomto čísle
- Targeted Proteolysis of Plectin Isoform 1a Accounts for Hemidesmosome Dysfunction in Mice Mimicking the Dominant Skin Blistering Disease EBS-Ogna
- The RNA Silencing Enzyme RNA Polymerase V Is Required for Plant Immunity
- The FGFR4-G388R Polymorphism Promotes Mitochondrial STAT3 Serine Phosphorylation to Facilitate Pituitary Growth Hormone Cell Tumorigenesis
- Target Site Recognition by a Diversity-Generating Retroelement
Zvyšte si kvalifikaci online z pohodlí domova
Mazová zátka a její řešení
nový kurzVšechny kurzy