
Intrahepatic Transcriptional Signature Associated with Response to Interferon-α Treatment in the Woodchuck Model of Chronic Hepatitis B
Approximately 250 million people are chronically infected with HBV, and over 500,000 people die every year because of associated liver diseases. IFN-α has been used to treat patients with chronic HBV infection for over 20 years, but it is not well understood why some patients respond to treatment and others do not. In large part, this is because it is not practicable to obtain liver samples to characterize the intrahepatic response to IFN-α in patients with different treatment outcomes. In this study we used the woodchuck model of chronic HBV infection to study how IFN-α changes gene expression patterns in the liver during treatment. Surprisingly, we found that the treatment response did not correlate with the expression of antiviral effector genes that have previously been shown to mediate the direct antiviral effects of IFN-α in vitro. Instead, we found that the response to IFN-α treatment was associated with the presence of select immune cells (natural killer cells and T cells) in the liver. Our work also indicates that these immune cells inhibit the virus by killing infected cells, as well as in ways that do not require killing of liver cells. Altogether, our study suggests that new therapies that stimulate these immune cells in the liver may hold promise for the treatment of chronic HBV infection.
Published in the journal:
. PLoS Pathog 11(9): e32767. doi:10.1371/journal.ppat.1005103
Category:
Research Article
doi:
https://doi.org/10.1371/journal.ppat.1005103
Summary
Approximately 250 million people are chronically infected with HBV, and over 500,000 people die every year because of associated liver diseases. IFN-α has been used to treat patients with chronic HBV infection for over 20 years, but it is not well understood why some patients respond to treatment and others do not. In large part, this is because it is not practicable to obtain liver samples to characterize the intrahepatic response to IFN-α in patients with different treatment outcomes. In this study we used the woodchuck model of chronic HBV infection to study how IFN-α changes gene expression patterns in the liver during treatment. Surprisingly, we found that the treatment response did not correlate with the expression of antiviral effector genes that have previously been shown to mediate the direct antiviral effects of IFN-α in vitro. Instead, we found that the response to IFN-α treatment was associated with the presence of select immune cells (natural killer cells and T cells) in the liver. Our work also indicates that these immune cells inhibit the virus by killing infected cells, as well as in ways that do not require killing of liver cells. Altogether, our study suggests that new therapies that stimulate these immune cells in the liver may hold promise for the treatment of chronic HBV infection.
Introduction
Approximately 250 million individuals live with chronic hepatitis B (CHB), and over half a million people are estimated to die each year due to CHB-associated liver diseases, such as cirrhosis and hepatocellular carcinoma (HCC) [1]. End-points of therapies for CHB are virological response (durable reduction in serum HBV DNA levels to a degree which varies by therapy), serological response (HBV e antigen (HBeAg) loss and seroconversion to anti-HBe in HBeAg-positive patients) and biochemical response (normalization of ALT levels). However, sustained loss of HBV surface antigen (HBsAg) off therapy is currently considered the ideal end-point. Recombinant interferon-α (IFN-α) is licensed for the treatment of CHB, but in contrast to potent nucleos(t)ides, virologic response is limited to a subset of patients [2]. Conversely, the rate of durable HBsAg loss is higher with IFN-α than with nucleos(t)ides, although still only occurs in <10% patients [2]. Despite more than two decades of clinical use, the mechanisms by which IFN-α controls HBV in responders are not well understood [3]. Defining the molecular basis for response remains an important goal, since mechanistic understanding of IFN-α activity could drive rational design of novel immunotherapeutic strategies and may lead to the identification of novel biomarkers of treatment response and/or patient stratification.
IFN-α is a pleiotropic cytokine that has both direct antiviral and immunomodulatory properties [4,5]. With regard to the former, IFN-α induces the expression of hundreds of interferon-stimulated genes (ISGs), many of which have antiviral effector functions [4]. Although the identification of key restriction factors has been challenging, various studies have indicated that IFN-α induces antiviral effectors of HBV. Most notably, the direct antiviral response to IFN-α has been demonstrated to inhibit the formation or accelerate the decay of replication-competent HBV capsids [6–9], inhibit virion secretion [10], reduce transcription from the viral genome (cccDNA; covalently closed circular DNA) [11,12], and to induce non-cytolytic degradation of cccDNA [13]. The direct antiviral activity of IFN-α is consistent with the reduction in viral antigen levels by high dose pegylated IFN-α in HBV-infected humanized mice that lack immune cells [14]. The immunomodulatory properties of IFN-α include activation of NK cells and B cells, as well as both direct and indirect activation of CD8+ T cell function [5,15]. Despite this potential to activate both innate and adaptive immunity, recent studies have revealed that IFN-α treatment boosts the number and function of NK cells in the periphery, but does not improve peripheral HBV-specific CD8+ T cells responses [16–19].
Antiviral and mechanistic studies of IFN-α treatment of HBV infection have been performed in vitro, in transgenic and immunodeficient mouse models, and in peripheral blood from CHB patients, but there is very little data regarding the intrahepatic response to IFN-α treatment in an immunocompetent host. A baseline (i.e. pre-treatment) intrahepatic transcriptional signature of response to treatment with pegylated IFN-α and adefovir (response defined as HBeAg loss, HBV DNA <2,000 IU/mL and ALT normalization) has recently been described [20]. However, due to the difficulty in obtaining multiple liver biopsy specimens from chronically infected HBV patients, longitudinal evaluation of the intrahepatic response to IFN-α treatment is only possible with an animal model. Since ethical and cost considerations limit the use of chimpanzees for biomedical research and there is no small animal model of natural HBV infection, we selected the woodchuck model for this purpose.
The Eastern woodchuck (Marmota monax) is naturally infected with WHV, a hepadnavirus which is genetically closely related to human HBV [21]. WHV infection displays a disease course similar to that in HBV-infected persons [21]. Although the woodchuck model has been used in a number of studies to characterize antiviral response to IFN-α treatment [22,23] these studies relied on adenovirus delivery of woodchuck IFN-α or utilized a recombinant human hybrid (B/D) IFN-α. Furthermore, these studies did not define the molecular basis of antiviral response. We recently described the sequencing, assembly and annotation of the woodchuck transcriptome, together with the generation of custom woodchuck microarrays. Using this new platform, we established the translational value of the woodchuck model and characterized the immune determinants of WHV clearance during self-limiting infection [24,25]. Since these studies yielded important insights into immune responses in the liver during hepadnavirus infection, in the current study we used a similar approach to characterize the intrahepatic transcriptional signature associated with antiviral response to recombinant woodchuck IFN-α treatment.
Results
Single dose IFN-α study in WHV-negative woodchucks
The amino acid sequence and in vitro antiviral activity of woodchuck IFN-α5 (wIFN-α) have previously been described [26,27]. wIFN-α was expressed, purified and biological activity confirmed as described in the Methods. The tolerability and pharmacodynamic activity of wIFN-α were then evaluated in a single dose study in WHV-negative woodchucks. Subcutaneous administration of a single dose of 2, 20 or 200 μg wIFN-α per animal (n = 3/group), induced dose-dependent increases in ISG and cytokine mRNA expression in the blood relative to the placebo group (S1 Fig). Pharmacokinetic (PK) analysis of serum wIFN-α levels was not performed due to the lack of a sufficiently sensitive quantitative method (see Methods). There was a trend towards changes in several hematological and clinical chemistry parameters at the higher doses, although these were likely due to the drawing of large blood volumes over a short time period.
IFN-α efficacy study in chronic WHV carrier woodchucks
The antiviral efficacy of wIFN-α was then evaluated in a repeat-dose study in adult woodchucks chronically infected with WHV. To model vertical transmission in humans, chronic infection in these animals was established by neonatal WHV infection. The study design is described in Fig 1. To match the frequency of non-pegylated IFN-α dosing in CHB patients, animals (n = 12/group) were dosed subcutaneously three times per week (TIW) on Monday, Wednesday and Friday with either placebo (vehicle control) or wIFN-α for a total of 15 weeks. Based on activity and safety considerations from the single dose study in WHV-negative woodchucks, the 20 μg dose was selected as the starting dose for the efficacy study. Initially wIFN-α was given for 7 weeks at a low dose of 20 μg/animal TIW. However, since an interim analysis indicated that this dose did not induce a significant decline in serum WHsAg or WHV DNA (Figs 2 and 3A), at the start of week 7 the wIFN-α dose was increased to 100 μg/animal TIW. Thus, in the wIFN-α treatment group, animals received a low dose of wIFN-α for 7 weeks (21 doses total), followed by a high dose of 100 μg/animal for another 8 weeks (24 doses total). Note that one animal in this group (M1004) was excluded from the analyses described below since it was likely naturally clearing WHV as the study initiated (Table 1).


IFN-α treatment of chronic WHV carriers induced variable suppression of serum antigenemia and viremia
In contrast to low dose (20 μg) wIFN-α, high dose (100 μg) wIFN-α treatment induced a rapid decline in serum WHsAg and WHV DNA (Figs 2 and S2), which was statistically significant relative to the placebo group (Fig 3A). The maximum reduction of serum WHsAg and WHV DNA was at week 16 in most animals, with a mean maximal reduction of 2.0 log10 for WHsAg and 3.0 log10 for viral load. Notably, wIFN-α treatment induced the complete loss of detectable (<20 ng/mL) WHsAg in one animal (F1022), although WHV DNA was still detectable (>1,000 genome equivalents (ge)/mL) at all time-points (S2 Fig). After completion of treatment there was WHsAg and WHV DNA rebound in most woodchucks, albeit not always to pre-treatment levels (Figs 2 and S2). There was a high degree of variability in the antiviral response of individual woodchucks in regard to the kinetics and magnitude of serum WHsAg and WHV DNA decline, as well to the time interval between cessation of treatment and return of these viral parameters to pre-treatment levels (S2 Fig). For correlative analyses with treatment response (see below), response groups were defined as the following: R, responder ≥1 log10 reduction in WHsAg at week 15 (end-of-treatment) and week 23 (end-of study) (n = 3 animals); PR, partial responder ≥1 log10 reduction in WHsAg at week 15 but not week 23 (n = 2 animals); NR, non-responder <1 log10 reduction in WHsAg at week 15 and week 23 (n = 2 animals) (Table 1). Notably, baseline (pre-treatment) levels of serum WHsAg and WHV DNA were comparable in these different treatment response groups (Table 1). The four animals in the wIFN-treatment group that did not survive until end-of study (see below), together with animal M1004 which was likely naturally clearing infection, were excluded from treatment response analyses (Table 1).
IFN-α treatment significantly reduced the hepatic levels of WHV nucleic acids, but induced anti-WHs antibodies in only two animals
High dose wIFN-α treatment significantly reduced intrahepatic cccDNA, WHV DNA replicative intermediate (RI) and WHV RNA levels (Figs 3B and S3). Reductions in these intrahepatic parameters typically correlated with reductions in serum WHsAg and viral load (Table 1). Only two woodchucks (M1004 and F1022) with sustained WHsAg reduction developed consistently detectable anti-WHs antibodies (S1 Table), one of which (M1004) was likely naturally clearing WHV as the study initiated (Table 1). The overall seroconversion rate was therefore 0/9 (placebo group) and 1/7 (wIFN-α group) for animals that survived until end-of-study (excluding M1004).
Tolerability of IFN-α treatment in chronic carrier woodchucks
wIFN-α treatment was well-tolerated, and there were no signs of overt toxicity based on gross observations, body weights, hematology or clinical chemistry. Although several animals died during treatment, the causes of death (e.g. HCC-related conditions, biopsy complications) were likely not treatment related (Table 1). There was a trend towards elevated serum ALT and AST levels during high dose treatment, but on a group level these overall differences were not statistically significant (Fig 3C). This is reflected in a poor temporal association between peak antiviral response and elevation of ALT, AST and SDH in some animals (Fig 4). Similarly, even though there was considerable fluctuation in liver histology scores in both placebo and wIFN-α groups (S1 Table), antiviral response was correlated temporally with an increase in liver inflammation in some (although not all) wIFN-treated animals (S4 Fig). Conversely, baseline liver enzyme levels and pre-treatment histology scores were comparable in the different treatment response groups (Figs 4 and S4).

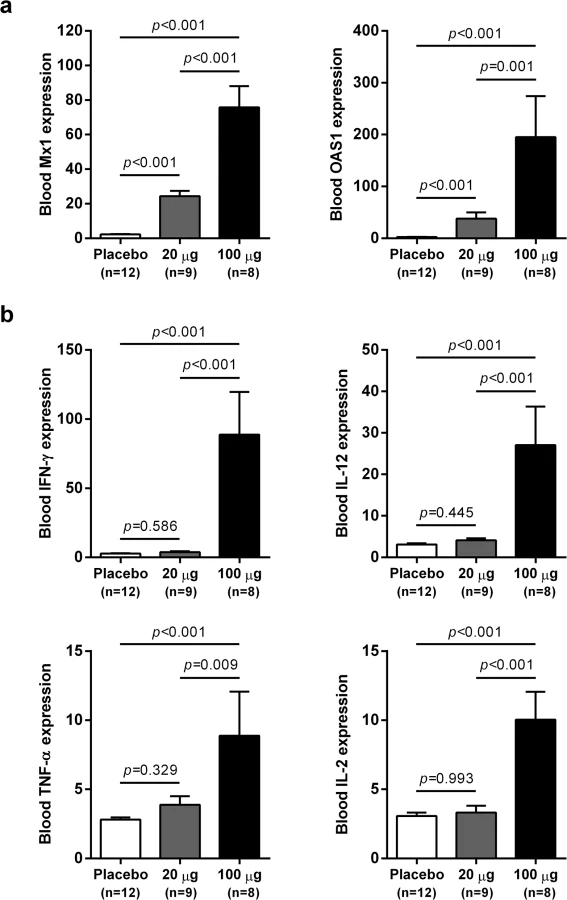
IFN-α treatment induced expression of ISGs and TH1-type cytokines in the blood of chronic WHV carriers
wIFN-α treatment induced dose-dependent increases in blood ISG mRNA expression. There was significant induction at both low and high dose levels, with a larger increase observed for the higher dose (Fig 5A). In contrast, only high dose treatment significantly induced the expression of various T helper cell type 1 (TH1)-type cytokines (Fig 5B). Given that only high dose treatment was associated with a significant antiviral response, this suggests cellular immunity (and associated cytokines) may play a role in and/or be a useful biomarker of treatment response. Although comparative analysis is limited by small animal numbers in each response group, a role for cellular immunity in antiviral response is also suggested by the significant difference in IFN-γ expression in animals with an on-treatment response (R and PR) relative to those with no treatment response (NR) (S5 Fig).
IFN-α treatment substantially altered intrahepatic gene expression in chronic WHV carrier woodchucks
As outlined in Fig 1, intrahepatic transcriptional profiles of placebo-treated and wIFN-treated animals were determined by RNA-Seq at various times during the study. RNA-Seq was performed rather than using the microarray platform from previous studies [24,25] because this method has superior concordance with qRT-PCR data [28] and also enabled generation of a more complete (version 2) woodchuck transcriptome assembly (S2 Table). Principal Component Analysis (PCA) demonstrated that wIFN-α treatment substantially altered gene expression within the liver of chronic carrier animals (S6 Fig). In contrast to the significant difference in antiviral response, there were only relatively modest differences (restricted to PC#2) between intrahepatic transcriptional changes induced by low dose (20 μg) and high dose (100 μg) wIFN-α treatment. A gene module approach [29] confirmed that there was substantial modulation of intrahepatic gene expression by wIFN-α overall, with only moderate differences between low and high dose treatment (Fig 6). The modular signature for wIFN-α treatment revealed an increase (>10% of the transcripts in each module significantly up-regulated) in the number of differentially expressed genes in the IFN response (Module, M3.1), cytotoxic cell (NK cell/CD8+ T cell) (M2.1), plasma cell (M1.1), B cell (M1.3), myeloid cell lineage (M1.5 and M2.6) and inflammation (M3.2) modules (Fig 6). Consistent with an increase in liver inflammation in many wIFN-treated animals (S4 Fig), the transcriptional data suggest that wIFN-α induced migration of immune cells into the liver and/or proliferation of intrahepatic immune cells.

Intrahepatic expression of the majority of antiviral ISGs did not correlate with the antiviral response to IFN-α treatment
In contrast to the differential antiviral response (Fig 3A and 3B) and dose-dependent ISG induction in the periphery (Fig 5A), module analysis revealed a striking increase (>80% of the transcripts significantly up-regulated) in the intrahepatic IFN response module (M3.1) at all on-treatment time-points, regardless of wIFN-α dose (Fig 6). Consistent with the modular analysis, low dose and high dose wIFN-α treatment were both associated with strong induction of a large number of intrahepatic ISGs, including many antiviral effector genes (Fig 7A, cluster 3). Furthermore, there was no apparent difference between the intrahepatic expression of these ISGs in animals with a treatment response (R and PR) and those with no treatment response (NR). Comparable induction of select ISGs in the liver by low and high dose wIFN-α treatment (regardless of treatment response) was confirmed by qRT-PCR (Fig 7B, S4 Table). Taken together, these data indicate that the antiviral response to wIFN-α does not correlate with the intrahepatic expression of the majority of ISGs, suggesting they do not play a key role in the antiviral response to treatment (see Discussion). Furthermore, pre-treatment (week -3) ISG levels were comparable in the different response groups (Fig 7A), indicating that baseline ISG expression was not an important determinant of treatment response.

In the context of defining the molecular basis of IFN-α treatment response, the APOBEC proteins are ISGs of particular interest since various family members have been reported to be restriction factors for HBV [13]. It is therefore notable that the intrahepatic expression profile of APOBEC3H (A3H) was unlike the majority of antiviral ISGs, in that it was selectively induced by high dose wIFN-α treatment (Table 2). However, the degree of A3H induction was modest (maximum 3.6-fold) relative to many other ISGs, consistent with low A3H induction by IFN-α in purified primary human hepatocytes [13]. Furthermore, intrahepatic induction of A3H was only statistically significant at end-of-treatment (week 15), suggesting that it is not likely to be a main mediator of the wIFN-α antiviral response. In contrast to A3H, A3D and A3F were not significantly modulated (FDR<0.05, FC>2) by wIFN-α treatment. Other APOBEC3 family members (including A3A) were not available in the woodchuck transcriptome assembly.

Intrahepatic NK and T cell transcriptional signatures correlate with the antiviral response to IFN-α treatment
Since there was a strong association between wIFN-α dose and antiviral response (Fig 3A and 3B), we reasoned that determining which genes were selectively induced by high dose wIFN-α would enable the identification of genes and/or pathways closely associated with treatment response. This approach identified genes that were selectively modulated during high dose wIFN-α treatment (S7 Fig, high dose n = 468), as well as genes induced only by low dose treatment (low dose n = 29) or by both low and high dose wIFN-α (low & high dose n = 775). The full gene list from each set is displayed in S8 Table. Consistent with the previous analyses, module analysis (M3.1) and Ingenuity Pathway Analysis (IPA) confirmed significant induction of an IFN-α response at both low dose and high dose wIFN-α treatment (S8 Fig). In contrast, module analysis revealed that cytotoxic cell (NK cell/CD8+ T cell) responses were selectively induced by high dose wIFN-α treatment, and hence were temporally associated with treatment response (Fig 8A). Significant enrichment of NK and T cell signatures with high dose wIFN-α treatment was confirmed by IPA (Fig 8B). To complement the approach focused on identifying genes selectively induced by high dose wIFN-α, Weighted gene coexpression network analysis (WGCNA) was used to identify modules of co-regulated treatment-induced genes that correlated most closely with antiviral response (S5 Table, Modules 1 and 2). These modules were also significantly enriched for NK and T cell associated genes (S9 Fig), consistent with the trend for induction of an NK/T cell signature in animals that had an antiviral response to treatment (M2.1, S10 Fig). Notably, these diverse analytical approaches identified common intrahepatic transcriptional signatures associated with treatment response, suggesting that NK/T cells play an important role in the antiviral response to wIFN-α treatment.

On the individual gene level, induction of T cell associated genes (CD3D, CD8A) suggests that there is migration of T cells into the liver and/or proliferation of intrahepatic T cells during high dose wIFN-α treatment (Table 2). Expression of the T cell TH1-type transcription factor T-bet (TBX21) was also significantly induced during high dose treatment (Table 2). Strikingly, qRT-PCR analysis revealed that T-bet expression was strongly induced by high dose treatment in animals with treatment response but not in animals without an antiviral response (Fig 8C and S6 Table). This is notable since it may indicate improved functionality (antigen-specific proliferation and IFN-γ production) of intrahepatic HBV-specific CD8+ T cells, particularly since high dose wIFN-α also induced IL-12 expression (Fig 5B) [30]. However, it is important to note that this transcriptional analysis cannot determine whether T-bet is expressed by virus-specific or virus non-specific CD8+ T cells, or potentially other cell types [31]. Induction of NKG2D (KLRK1; activating receptor) expression, but not NKG2A (KLRC1; inhibitory receptor), CD16 (FCGR3A) or CD56 (NCAM1) (Tables 2 and 3), is consistent with activation, but not migration or proliferation of intrahepatic NK cells.

Intrahepatic NK and/or T cells likely inhibit WHV via both cytolytic and non-cytolytic mechanisms during IFN-α treatment
As discussed previously, the peak antiviral response to treatment and elevation of liver injury biomarkers were temporally correlated in some animals (Fig 4), indicating that wIFN-α induced killing of WHV-infected hepatocytes. This biochemical evidence of liver damage is consistent with intrahepatic induction of the receptor-mediated cell death genes TRAIL (TNFSF10), Fas (FAS) and Fas ligand (FASLG) and the cytotoxic effector gene perforin (PRF1) during high dose treatment (Table 3). These genes, as well as a death receptor signaling pathway (S8 Fig), were also significantly induced (on a group level) by low dose wIFN-α, consistent with liver enzyme elevations in some animals during this treatment period (Fig 4). Notably, although there was substantial induction of TRAIL expression (>17-fold) by high dose wIFN-α in two animals with a treatment response, one responder animal had only modest intrahepatic TRAIL induction (animal F1013; maximal 6-fold induction), and an animal with no treatment response had the greatest TRAIL induction (animal F1014; 118-fold) (S6 Table). This overall poor correlation of intrahepatic TRAIL with treatment response suggests that additional antiviral mechanisms may be required to control infection.
CD8+ T cells and NK cells have the potential to inhibit HBV infection by non-cytolytic mechanisms mediated by IFN-γ and TNF-α, as well as by killing infected cells via cytotoxic effector molecules. It is therefore notable that the two genes induced to the greatest degree in the liver by high dose wIFN-α treatment, PLA2G2A and CXCL9, are IFN-γ responsive genes [24] (Table 2). Furthermore, PLA2G2A, CXCL9 and other IFN-γ inducible genes (as well as IFN-γ itself) are members of a subset of intrahepatic ISGs that correlated with wIFN-α dose (Figs 7A, Cluster 2, and S11). Strikingly, a large number of IFN-γ-regulated genes (e.g. MHC class I and II (HLA) genes, CXCL9) were also induced in the liver of chimpanzees during clearance of acute HBV infection [32]. In addition, although the on-treatment profile was not determined, MHC class I and II genes as well as CXCL9 were also up-regulated prior to treatment in the liver of CHB patients that subsequently responded to pegylated IFN-α and adefovir treatment compared to non-responder patients [20]. Consistent with the association between blood IFN-γ expression and antiviral response (S5 Fig), high dose wIFN-α significantly induced intrahepatic CXCL9 expression in animals with a treatment response, but not in those without an antiviral response (Fig 8C and S6 Table). These data indicate that IFN-γ-mediated, non-cytolytic mechanisms may play a role in the antiviral response to wIFN-α treatment. This is supported by the observation that the initial reduction in WHsAg and WHV DNA by high dose treatment in two responder animals (F1013 and F1022, weeks 7–15 and 7–11, respectively) occurred in the absence of substantial liver enzyme elevations (Fig 4). In both animals, there were subsequently modest increases in liver enzyme levels together with a further decrease in viral levels, suggesting that the antiviral response induced by high dose wIFN-α treatment is mediated by both cytolytic and non-cytolytic NK/T cell responses.
Counter-regulatory mechanisms induced by IFN-α may limit treatment response
In addition to positive effects on antiviral immunity, wIFN-α also induced various counter-regulatory mechanisms that may have limited the antiviral response to treatment. Notably, intrahepatic mRNA levels of the inhibitory T cell receptor PD-1 (PDCD1) and its ligand PD-L1 (CD274) were significantly increased during wIFN-α treatment (Tables 2 and 3). Intrahepatic expression of indoleamine 2,3-dioxygenase 1 (IDO1), which limits the availability of the essential amino acid tryptophan and produces immunosuppressive kynurenine to locally suppress T cells [33], was also significantly increased by wIFN-α treatment (Table 3). Furthermore, high dose wIFN-α modestly elevated intrahepatic FOXP3 mRNA levels (Table 2), which suggests treatment-associated migration and/or proliferation of T regulatory cells (Tregs) that may negatively regulate CD8+ T cell and NK cell function. In contrast, expression of IL-10 (IL10) and TGF-β (TGFB1), immunosuppressive cytokines produced by Tregs and various other cells, was not significantly modulated by treatment (Table 3).
Discussion
Recombinant IFN-α has been used to treat CHB for over 20 years, but the molecular basis of treatment response remains poorly understood [3]. Previous transcriptome analyses have shown there are important parallels between the immune response to WHV in woodchucks and HBV in man [24], and that self-limiting hepadnavirus infection in woodchucks and chimpanzees share key immunological features [25]. Together these studies suggest that the woodchuck is a relevant model to study the mechanisms that govern antiviral response to IFN-α. Consequently, we characterized the intrahepatic transcriptional profile of WHV chronic carrier woodchucks during treatment with recombinant woodchuck IFN-α. Treatment with wIFN-α produced variable antiviral effects, inducing multi-log reduction in serum WHV DNA and WHsAg in a subset of animals, and sustained WHsAg loss and seroconversion to anti-WHsAb in one animal, while not exerting antiviral effects in other animals. Importantly, the variability and degree of antiviral response in these animals are comparable to those observed with CHB patients treated with pegylated IFN-α [2,34]. Furthermore, viral rebound in the WHV-infected woodchucks was typically observed following cessation of wIFN-α treatment, consistent with the low rate of durable HBsAg loss in patients treated with IFN-α [2]. Together, these data reveal important parallels between the IFN-α treatment response of chronic hepadnavirus infection in woodchucks and man, establishing the translational value of the woodchuck model for characterizing the immune correlates of IFN-α treatment response.
Since various studies have demonstrated that IFN-α can directly inhibit HBV [6,11,13], a striking finding of this study was that the antiviral response to wIFN-α did not correlate with the intrahepatic induction of the majority of antiviral ISGs. Since WHV is sensitive to the direct antiviral effects of wIFN-α in vitro [23,35], our data suggest that IFN-induced antiviral effectors of WHV do not play a key role in the antiviral response to treatment in vivo. However, there are several important caveats to consider. Firstly, since there are a large number of antiviral ISGs, and not all were available in the woodchuck transcriptome (e.g. APOBEC3A), intrahepatic expression of antiviral ISGs that were not evaluated in this study may correlate with treatment response. In addition, since intrahepatic transcriptional analysis was restricted to 6 hours post-dose, it is possible that the expression of certain ISGs with slower induction kinetics may be associated with the antiviral response to IFN-α. Secondly, although low dose wIFN-α induced intrahepatic ISG expression but not a significant antiviral response, it is conceivable that prolonged ISG expression (7 weeks) by low dose treatment played an important role in the antiviral response subsequently induced by higher dose wIFN-α. Finally, transcriptional analysis of whole biopsy tissue cannot define cell-specific ISG expression, which may be important in treatment response [36]. This is also an important caveat if hepatocytes and non-parenchymal cells (e.g. Kupffer cells) display markedly different sensitivity to ISG induction, since it may preclude accurate correlation of treatment response with induction of antiviral ISGs in infected cells using whole biopsy tissue.
The significant difference in ISG induction by low and high dose wIFN-α in the blood but not the liver of woodchucks chronically infected with WHV is noteworthy considering a recent study demonstrating that HBV can inhibit IFN-α signaling in human hepatocytes [37]. This suggests that WHV may limit (although not abrogate) wIFN-α signaling in woodchuck hepatocytes. Alternatively, induction of USP18, SOCS1 and SOCS3 (Table 3) and/or other inhibitors of IFN-α/β receptor signaling may limit the intrahepatic ISG response to wIFN-α treatment. Since liver biopsies were not taken after wIFN-α treatment of WHV-negative animals, and there is currently no sensitive, quantitative wIFN-α ELISA (see Methods), additional studies will be required to determine whether there are significant differences in PK-PD responses to wIFN-α treatment in WHV-negative and WHV-infected animals.
In contrast to intrahepatic ISG expression, the expression of other gene sets showed a correlation with antiviral response. Both NK/T cell and IFN-γ transcriptional signatures in the liver were increased in animals with antiviral response to wIFN-α treatment. The peak antiviral response was also associated with liver enzyme elevations in some (although not all) animals. Collectively these data suggest that the antiviral response induced by wIFN-α treatment was mediated by both cytolytic and non-cytolytic NK/T cell responses. The correlation of liver injury biomarkers with antiviral response is notable because host-induced ALT flares are associated with IFN-α treatment response in CHB patients [38]. The association of intrahepatic NK cell and IFN-γ transcriptional signatures with antiviral response to treatment is also striking because NK cells in CHB patients have a markedly impaired capacity to produce IFN-γ [39,40]. This dysfunctional phenotype can be reversed (at least in NK cells in the periphery) by treatment with IFN-α [17], which suggests that NK cell IFN-γ production may represent a common mechanism of IFN-α antiviral response to chronic hepadnavirus infection in woodchucks and man. Clearance of acute HBV infection in chimpanzees is also characterized by an intrahepatic IFN-γ transcriptional signature [32], suggesting that there are important parallels between the immunological mechanisms of natural clearance of HBV and those induced by IFN-α treatment.
Recent studies have revealed that IFN-α treatment does not improve peripheral HBV-specific CD8+ T cell responses [16–18]. In view of the aforementioned NK cell activation by IFN-α, this failure to augment virus-specific CD8+ T cell responses may be explained, at least in part, by the observation that NK cells can directly kill HBV-specific CD8+ T cells via TRAIL and other mechanisms [41]. The induction of an intrahepatic NK signature as well as TRAIL expression suggests that WHV-specific CD8+ T cell responses may be inhibited by similar mechanisms during wIFN-α treatment. Conversely, IFN-induced protection of antiviral CD8+ T cells might limit NK regulation of T cell immunity in this setting [42,43], consistent with the induction of an intrahepatic T cell transcriptional signature coupled with significant elevation of T-bet (TBX21) mRNA during wIFN-α treatment. In addition to potentially inducing NK cell killing of virus-specific CD8+ T cells, wIFN-α treatment induced various counter-regulatory mechanisms, including intrahepatic PD-1 (PDCD1) and PD-L1 (CD274) expression, which may also have limited antiviral CD8+ T cell function in the liver. However, it is important to the note that a limitation of the woodchuck model is that it is challenging to confirm that changes in gene expression are associated with corresponding changes in protein levels and/or cellular function. This is particularly important for characterization of CD8+ T cell specificity in the context of wIFN-α treatment, since studies in HBV transgenic mice as well as CHB patients indicate that antigen-nonspecific inflammatory cells (including nonvirus-specific CD8+ T cells) can accumulate to high levels in the liver under inflammatory conditions [44,45]. Unfortunately, blood volume and biopsy material limitations precluded functional analysis of WHV-specific CD8+ T cells in the current study. In addition, the lack of woodchuck-specific immunological reagents prevented immunophenotyping of WHV-specific CD8+ T cells by flow cytometry. Attempts to develop high-quality monoclonal antibodies against woodchuck CD56 and CD8a to enable detection of NK and CD8+ T cells, respectively, by immunohistochemistry were also not successful. Therefore, additional studies in immunocompetent models of natural infection and/or CHB patient biopsies will be required in order to define the relative contribution of intrahepatic NK and virus-specific CD8+ T cells to IFN-α treatment response.
In summary, by studying recombinant IFN-α in an immunocompetent animal model of CHB, this study provided new insights into the immune mechanisms that mediate the antiviral response to treatment. In addition, various immune pathways were identified that may act to limit treatment response. These findings have important implications for the design of new therapeutics for CHB, and also provide rationale for evaluating combinations of immunotherapeutic agents currently in development.
Materials and Methods
Expression, purification and analytical characterization of woodchuck interferon
The sequence of woodchuck IFN-α5 (wIFN-α) has previously been described [26]. Recombinant wIFN-α was expressed by transient transfection of human embryonic kidney (HEK) 293F cells using the FreeStyleTM 293 expression system according to the manufacturer’s instructions (Invitrogen, Inc., Carlsbad, CA). Culture supernatant was filtered and then purified by two chromatographic steps. Firstly, after adjusting to pH 6.0 with 50 mM KH2PO4, pH 5.0, the sample was loaded on a 5 mL SP HP Hi Trap (GE Healthcare, Little Chalfont, Buckinghamshire, UK) that had been pre-equilibrated with 50 mM KH2PO4, pH 6.0. The wIFN-α was then eluted with a 17 column-volume salt gradient from 0–500 mM NaCl. Fractions were analyzed via SDS-PAGE and wIFN-containing fractions were pooled. Secondly, size exclusion chromatography on Superdex 75 (GE Healthcare, Little Chalfont, Buckinghamshire, UK) was performed in 20 mM His/HCl, 140 mM NaCl pH 6.0. The eluted wIFN-α was filtrated with a 0.22 μM syringe filter and stored at -80°C. The wIFN-α concentration was determined by measuring optical density (OD) at 280 nm. Purity and monomer content were confirmed by SDS-PAGE and SE-HPLC, respectively, and the integrity of the wIFN-α amino acid backbone was verified by Nano Electrospray QTOF mass spectrometry. The protein was kept in a storage buffer (20 mM His/HCl, 140 mM NaCl pH 6.0) prior to dosing. The endotoxin level of the wIFN-α preparation was <0.454 EU/mL. The in vitro biological activity of wIFN-α was confirmed by dose-dependent induction of mRNA levels of the interferon-stimulated genes (ISGs) Mx1 and OAS1 in woodchuck PBMCs (n = 2 animals) treated with 0.1, 1 and 10 μg/mL wIFN-α.
Ethics statement
The animal protocol and all procedures involving woodchucks were approved by the Georgetown University IACUC (Protocol Number: 11–006) and adhered to the national guidelines of the Animal Welfare Act, the Guide for the Care and Use of Laboratory Animals, and the American Veterinary Medical Association.
Single dose wIFN-α study in WHV-negative woodchucks
All woodchucks used in this study were obtained from Northeastern Wildlife. Prior to the study, male woodchucks were confirmed negative for WHV surface antigen (WHsAg) and for antibodies against WHsAg (anti-WHsAb) and WHV core antigen (anti-WHc). Animals were assigned to four groups (n = 3/group) using stratification based on body weight, clinical biochemistry and hematology. Animals received a single subcutaneous dose of 2, 20 or 200 μg wIFN-α, or a placebo control (all n = 3/group). Various measurements (body weight, body temperature, clinical serum chemistries, and CBCs) were obtained to monitor drug safety.
Repeat dose wIFN-α study in WHV carrier woodchucks
All woodchucks used in this study were obtained from Northeastern Wildlife. These woodchucks were born in captivity and were infected at 3 days of age with the cWHV7P2a inoculum containing WHV strain WHV7-11. cWHV7P2a has the same biological and virological characteristics as the cWHV7P2 inoculum as both were derived from cWHV7P1 [46]. Chronically infected animals were all anti-WHs negative, with detectable serum WHV DNA, WHsAg and anti-WHc at approximately 1 year post-infection. Absence of liver tumors in woodchucks with low GGT was confirmed by ultrasonography. Chronic WHV carrier woodchucks were assigned and stratified by gender, body weight, and by pretreatment serum markers (WHsAg and WHV DNA concentrations, serum GGT and SDH activities) into treatment and placebo groups (n = 12/group). The study design and sampling scheme are summarized in Fig 1.
Pharmacokinetics (PK) of wIFN-α
The PK of wIFN-α was not measured due to the lack of a suitable analytical method. Although a wIFN-α ELISA has previously been described [27], it was discovered during method development that one of the antibodies likely recognized the 6xHis tag of the antigen used for immunization, which was not present in our preparation of wIFN-α. Despite extensive screening of available anti-human, anti-macaque, anti-mouse and anti-pig IFN-α antibodies (PBL, Piscataway, NJ), as well as additional anti-woodchuck IFN-α antibodies (Digna Biotech, Pamplona, Spain), none were identified that robustly detected wIFN-α in an ELISA format.
WHV parameters
Serum WHV DNA was quantified by two different methods depending on concentration: dot blot hybridization or real time PCR assay on a 7500 Real Time PCR System instrument (Applied Biosystems, Foster City, CA) as described previously [47]. Serum WHsAg and anti-WHsAb were measured by WHV-specific enzyme immunoassays as described [48]. Liver WHV RNA was measured quantitatively by Northern blot hybridization as previously described [49]. Liver WHV DNA replicative intermediates (RI) and WHV cccDNA were quantitatively determined by Southern blot as previously described [50].
Woodchuck transcriptome assembly
The revised woodchuck transcriptome assembly (version 2) consists of a previous assembly (version 1), generated with Roche-454 sequencing data [24], that was merged with newly assembled contiguous transcripts (contigs) from Illumina sequencing data of the 24 animals from the current study (n = 12 placebo, n = 12 wIFN-α treated). The main improvement of version 2 over version 1 is that the sequencing depths of the Illumina data is significantly higher than that of 454 and therefore resulted in a higher dynamic range and increased number of genes as compared to assembly version 1 (S2 Table). The assembly method of transcriptome version 2 consisted of three stages: 1) initial contig assembly, 2) contig annotation and 3) contig refinement. First, Illumina RNA-Seq paired-end reads from liver samples were assembled using Trinity [51] (release 2011-08-20). The obtained contigs were further refined and merged by applying the sequence assembly algorithm PHRAP [52]. As a result, the number of contigs was reduced by about 25% and the contig lengths were increased. Second, all contigs were subjected to an in-house developed gene annotation pipeline which performs sequence homology searches within reference transcript databases from other species. First, woodchuck contigs were mapped to transcripts from RefSeq reference database containing human, mouse, and rat transcripts using BLAST [53], with a 1.e-5 E-value cutoff. Matches with the highest BLAST scores were further pair-wise aligned by applying the Needleman-Wunsch algorithm [54] in order to obtain more accurate alignments and to calculate the sequence identities (i.e. number of identical nucleotides in percentage of alignment length) between RefSeq transcripts and woodchuck contigs. If the identity difference between the two best hits exceeded 25%, then the top gene was used for contig annotation. Only contigs that could be mapped to known mouse, rat or human genes were used for further data processing. Because the assembly often contained more than one contig per gene, a final sequence refinement was then performed to remove redundancies. Contigs annotated with identical genes were subjected to the CAP3 assembler [55], and as a result, the number of contigs was further reduced and the sequence lengths of numerous contigs were increased.
RNA-Seq analysis
Sequencing libraries were created using Illumina’s TruSeq RNA sample preparation kit (San Diego, CA) according to manufacturer’s protocol. Total RNA was purified using oligo(dT) magnetic beads, fragmented, and reverse-transcribed using SuperScript II (Invitrogen, Inc., Carlsbad, CA) to synthesize first strand cDNA. After second strand synthesis, Illumina specific adapters containing unique barcodes were ligated to the ends of the double-stranded cDNA. Fragments containing adapters on both ends were then enriched and amplified with PCR, quantified with qPCR, and run on the Agilent Bioanalyzer DNA-1000 chip to estimate fragment size. Samples were then multiplexed and sequenced on the Illumina 2500. The data was demultiplexed using CASAVA and run through FastQC (http://www.bioinformatics.babraham.ac.uk/projects/fastqc/) to assess sequencing data quality. Paired-end 50 nucleotide read data from mRNA-Seq were mapped against the revised woodchuck transcriptome with Bowtie2 [56] and prioritized for concordant paired alignments with unique hits. The resulting SAM/BAM files were processed with SAMtools [57] to yield count data that was normalized and processed by DESeq [58] for differential expression analysis and subsequent pattern recognition and pathway analysis. Multiple testing correction was performed using the method of Benjamini and Hochberg [59]. Principal component analysis was performed with Partek Genomics version 6.6beta (Partek, St. Louis, MO). Heatmaps of the expression data were generated by unsupervised hierarchical clustering of least square means expression values, after z-score normalization across samples. The enrichment of differential genes relative to the gene modules described previously [29] was calculated with R version 2.13.2 (http://www.r-project.org) using the humanized gene symbols for the woodchuck genes. Gene Set Enrichment Analysis (GSEA) was performed as previously described [60], with ranks determined by the multiplicative product of the fold-change and–log(FDR) values for each gene. Weighted gene coexpression network analysis (WGCNA) [61] was performed within the R statistics environment. Pathway analysis was performed using Ingenuity Pathway Analysis (Ingenuity Systems, Redwood City, CA).
Quantitative RT-PCR
Total RNA was isolated using the RNeasy Mini Kit (Qiagen Inc., Redwood City, CA) with on-column DNase digestion using the RNase-Free DNase Set (Qiagen Inc., Redwood City, CA). Following reverse transcription into cDNA with the Transcriptor First Strand cDNA Synthesis Kit (Roche Applied Sciences, Indianapolis, IN), samples were analyzed by real time PCR on a 7500 Real Time PCR System instrument (Applied Biosystems, Inc., Foster City, CA) using EagleTaq Universal Master Mix (Roche Applied Sciences, Indianapolis, IN). Target gene expression was normalized to 18S rRNA expression. The primers and probes used in this study are displayed in S7 Table, or have previously been described [24,62–65]. Note that, although there was insufficient mRNA from biopsy samples to perform extensive qRT-PCR validation of gene expression, in contrast to microarray, RNA-Seq has high concordance with qRT-PCR data [28].
Supporting Information
Zdroje
1. Lavanchy D (2004) Hepatitis B virus epidemiology, disease burden, treatment, and current and emerging prevention and control measures. J Viral Hepat 11 : 97–107. 14996343
2. Kwon H, Lok AS (2011) Hepatitis B therapy. Nat Rev Gastroenterol Hepatol 8 : 275–284. doi: 10.1038/nrgastro.2011.33 21423260
3. Rehermann B, Bertoletti A (2015) Immunological aspects of antiviral therapy of chronic hepatitis B virus and hepatitis C virus infections. Hepatology 61 : 712–721. doi: 10.1002/hep.27323 25048716
4. Schoggins JW, Rice CM (2011) Interferon-stimulated genes and their antiviral effector functions. Curr Opin Virol 1 : 519–525. doi: 10.1016/j.coviro.2011.10.008 22328912
5. Swiecki M, Colonna M (2011) Type I interferons: diversity of sources, production pathways and effects on immune responses. Curr Opin Virol 1 : 463–475. doi: 10.1016/j.coviro.2011.10.026 22440910
6. Wieland SF, Eustaquio A, Whitten-Bauer C, Boyd B, Chisari FV (2005) Interferon prevents formation of replication-competent hepatitis B virus RNA-containing nucleocapsids. Proc Natl Acad Sci U S A 102 : 9913–9917. 15994231
7. Anderson AL, Banks KE, Pontoglio M, Yaniv M, McLachlan A (2005) Alpha/beta interferon differentially modulates the clearance of cytoplasmic encapsidated replication intermediates and nuclear covalently closed circular hepatitis B virus (HBV) DNA from the livers of hepatocyte nuclear factor 1alpha-null HBV transgenic mice. J Virol 79 : 11045–11052. 16103155
8. Xu C, Guo H, Pan XB, Mao R, Yu W, et al. (2010) Interferons accelerate decay of replication-competent nucleocapsids of hepatitis B virus. J Virol 84 : 9332–9340. doi: 10.1128/JVI.00918-10 20610715
9. Li N, Zhang L, Chen L, Feng W, Xu Y, et al. (2012) MxA inhibits hepatitis B virus replication by interaction with hepatitis B core antigen. Hepatology 56 : 803–811. doi: 10.1002/hep.25608 22271421
10. Yan R, Zhao X, Cai D, Liu Y, Block T, et al. (2015) Interferon-inducible Protein Tetherin Inhibits Hepatitis B Virus Virion Secretion. J Virol.
11. Belloni L, Allweiss L, Guerrieri F, Pediconi N, Volz T, et al. (2012) IFN-alpha inhibits HBV transcription and replication in cell culture and in humanized mice by targeting the epigenetic regulation of the nuclear cccDNA minichromosome. J Clin Invest 122 : 529–537. doi: 10.1172/JCI58847 22251702
12. Liu F, Campagna M, Qi Y, Zhao X, Guo F, et al. (2013) Alpha-interferon suppresses hepadnavirus transcription by altering epigenetic modification of cccDNA minichromosomes. PLoS Pathog 9: e1003613. doi: 10.1371/journal.ppat.1003613 24068929
13. Lucifora J, Xia Y, Reisinger F, Zhang K, Stadler D, et al. (2014) Specific and nonhepatotoxic degradation of nuclear hepatitis B virus cccDNA. Science 343 : 1221–1228. doi: 10.1126/science.1243462 24557838
14. Allweiss L, Volz T, Lutgehetmann M, Giersch K, Bornscheuer T, et al. (2014) Immune cell responses are not required to induce substantial hepatitis B virus antigen decline during pegylated interferon-alpha administration. J Hepatol 60 : 500–507. doi: 10.1016/j.jhep.2013.10.021 24398036
15. Robek MD, Garcia ML, Boyd BS, Chisari FV (2007) Role of immunoproteasome catalytic subunits in the immune response to hepatitis B virus. J Virol 81 : 483–491. 17079320
16. Penna A, Laccabue D, Libri I, Giuberti T, Schivazappa S, et al. (2012) Peginterferon-alpha does not improve early peripheral blood HBV-specific T-cell responses in HBeAg-negative chronic hepatitis. J Hepatol 56 : 1239–1246. doi: 10.1016/j.jhep.2011.12.032 22326467
17. Micco L, Peppa D, Loggi E, Schurich A, Jefferson L, et al. (2013) Differential boosting of innate and adaptive antiviral responses during pegylated-interferon-alpha therapy of chronic hepatitis B. J Hepatol 58 : 255–233.
18. Tan AT, Hoang LT, Chin D, Rasmussen E, Lopatin U, et al. (2014) Reduction of HBV replication prolongs the early immunological response to IFNalpha therapy. J Hepatol 60 : 54–61. doi: 10.1016/j.jhep.2013.08.020 23994382
19. Stelma F, de Niet A, Tempelmans Plat-Sinnige MJ, Jansen L, Takkenberg RB, et al. (2015) NK Cell Characteristics in Chronic Hepatitis B Patients are Associated with HBsAg Loss after Combination Treatment with Peg-interferon Alpha-2a and Adefovir. J Infect Dis.
20. Jansen L, de Niet A, Makowska Z, Dill MT, van Dort KA, et al. (2014) An intrahepatic transcriptional signature of enhanced immune activity predicts response to peginterferon in chronic hepatitis B. Liver Int.
21. Menne S, Cote PJ (2007) The woodchuck as an animal model for pathogenesis and therapy of chronic hepatitis B virus infection. World J Gastroenterol 13 : 104–124. 17206759
22. Korba BE, Cote P, Hornbuckle W, Schinazi R, Gangemi JD, et al. (2000) Enhanced antiviral benefit of combination therapy with lamivudine and alpha interferon against WHV replication in chronic carrier woodchucks. Antivir Ther 5 : 95–104. 10971862
23. Fiedler M, Rodicker F, Salucci V, Lu M, Aurisicchio L, et al. (2004) Helper-dependent adenoviral vector-mediated delivery of woodchuck-specific genes for alpha interferon (IFN-alpha) and IFN-gamma: IFN-alpha but not IFN-gamma reduces woodchuck hepatitis virus replication in chronic infection in vivo. J Virol 78 : 10111–10121. 15331744
24. Fletcher SP, Chin DJ, Ji Y, Iniguez AL, Taillon B, et al. (2012) Transcriptomic analysis of the woodchuck model of chronic hepatitis B. Hepatology 56 : 820–830. doi: 10.1002/hep.25730 22431061
25. Fletcher SP, Chin DJ, Cheng DT, Ravindran P, Bitter H, et al. (2013) Identification of an intrahepatic transcriptional signature associated with self-limiting infection in the woodchuck model of hepatitis B. Hepatology 57 : 13–22. doi: 10.1002/hep.25954 22806943
26. Berraondo P, Garcia-Navarro R, Gonzalez-Aseguinolaza G, Vales A, Blanco-Urgoiti B, et al. (2002) The woodchuck interferon-alpha system: Cloning, family description, and biologic activity. J Med Virol 68 : 424–432. 12226832
27. Berraondo P, Crettaz J, Ochoa L, Vales A, Ruiz J, et al. (2009) Production of recombinant woodchuck IFNalpha and development of monoclonal antibodies. J Interferon Cytokine Res 29 : 75–82. doi: 10.1089/jir.2008.0012 19014334
28. Wang C, Gong B, Bushel PR, Thierry-Mieg J, Thierry-Mieg D, et al. (2014) The concordance between RNA-seq and microarray data depends on chemical treatment and transcript abundance. Nat Biotechnol 32 : 926–932. doi: 10.1038/nbt.3001 25150839
29. Chaussabel D, Quinn C, Shen J, Patel P, Glaser C, et al. (2008) A modular analysis framework for blood genomics studies: application to systemic lupus erythematosus. Immunity 29 : 150–164. doi: 10.1016/j.immuni.2008.05.012 18631455
30. Kurktschiev PD, Raziorrouh B, Schraut W, Backmund M, Wachtler M, et al. (2014) Dysfunctional CD8+ T cells in hepatitis B and C are characterized by a lack of antigen-specific T-bet induction. J Exp Med 211 : 2047–2059. doi: 10.1084/jem.20131333 25225458
31. Knox JJ, Cosma GL, Betts MR, McLane LM (2014) Characterization of T-bet and eomes in peripheral human immune cells. Front Immunol 5 : 217. doi: 10.3389/fimmu.2014.00217 24860576
32. Wieland S, Thimme R, Purcell RH, Chisari FV (2004) Genomic analysis of the host response to hepatitis B virus infection. Proc Natl Acad Sci U S A 101 : 6669–6674. 15100412
33. Frumento G, Rotondo R, Tonetti M, Damonte G, Benatti U, et al. (2002) Tryptophan-derived catabolites are responsible for inhibition of T and natural killer cell proliferation induced by indoleamine 2,3-dioxygenase. J Exp Med 196 : 459–468. 12186838
34. Sonneveld MJ, Rijckborst V, Boucher CA, Hansen BE, Janssen HL (2010) Prediction of sustained response to peginterferon alfa-2b for hepatitis B e antigen-positive chronic hepatitis B using on-treatment hepatitis B surface antigen decline. Hepatology 52 : 1251–1257. doi: 10.1002/hep.23844 20830787
35. Salucci V, Lu M, Aurisicchio L, La Monica N, Roggendorf M, et al. (2002) Expression of a new woodchuck IFN-alpha gene by a helper-dependent adenoviral vector in woodchuck hepatitis virus-infected primary hepatocytes. J Interferon Cytokine Res 22 : 1027–1034. 12433282
36. Zhu Y, Qin B, Xiao C, Lu X, Chen L (2012) Cell-type specific interferon stimulated gene staining in liver underlies response to interferon therapy in chronic HBV infected patients. Dig Dis Sci 57 : 2355–2361. doi: 10.1007/s10620-012-2169-5 22585383
37. Lutgehetmann M, Bornscheuer T, Volz T, Allweiss L, Bockmann JH, et al. (2011) Hepatitis B virus limits response of human hepatocytes to interferon-alpha in chimeric mice. Gastroenterology 140 : 2074–2083, 2083 e2071–2072. doi: 10.1053/j.gastro.2011.02.057 21376046
38. Flink HJ, Sprengers D, Hansen BE, van Zonneveld M, de Man RA, et al. (2005) Flares in chronic hepatitis B patients induced by the host or the virus? Relation to treatment response during Peg-interferon {alpha}-2b therapy. Gut 54 : 1604–1609. 15923670
39. Peppa D, Micco L, Javaid A, Kennedy PT, Schurich A, et al. (2010) Blockade of immunosuppressive cytokines restores NK cell antiviral function in chronic hepatitis B virus infection. PLoS Pathog 6: e1001227. doi: 10.1371/journal.ppat.1001227 21187913
40. Tjwa ET, van Oord GW, Hegmans JP, Janssen HL, Woltman AM (2011) Viral load reduction improves activation and function of natural killer cells in patients with chronic hepatitis B. J Hepatol 54 : 209–218. doi: 10.1016/j.jhep.2010.07.009 21095036
41. Peppa D, Gill US, Reynolds G, Easom NJ, Pallett LJ, et al. (2013) Up-regulation of a death receptor renders antiviral T cells susceptible to NK cell-mediated deletion. J Exp Med 210 : 99–114. doi: 10.1084/jem.20121172 23254287
42. Xu HC, Grusdat M, Pandyra AA, Polz R, Huang J, et al. (2014) Type I interferon protects antiviral CD8+ T cells from NK cell cytotoxicity. Immunity 40 : 949–960. doi: 10.1016/j.immuni.2014.05.004 24909887
43. Crouse J, Bedenikovic G, Wiesel M, Ibberson M, Xenarios I, et al. (2014) Type I interferons protect T cells against NK cell attack mediated by the activating receptor NCR1. Immunity 40 : 961–973. doi: 10.1016/j.immuni.2014.05.003 24909889
44. Maini MK, Boni C, Lee CK, Larrubia JR, Reignat S, et al. (2000) The role of virus-specific CD8(+) cells in liver damage and viral control during persistent hepatitis B virus infection. J Exp Med 191 : 1269–1280. 10770795
45. Kakimi K, Lane TE, Wieland S, Asensio VC, Campbell IL, et al. (2001) Blocking chemokine responsive to gamma-2/interferon (IFN)-gamma inducible protein and monokine induced by IFN-gamma activity in vivo reduces the pathogenetic but not the antiviral potential of hepatitis B virus-specific cytotoxic T lymphocytes. J Exp Med 194 : 1755–1766. 11748277
46. Cote PJ, Korba BE, Miller RH, Jacob JR, Baldwin BH, et al. (2000) Effects of age and viral determinants on chronicity as an outcome of experimental woodchuck hepatitis virus infection. Hepatology 31 : 190–200. 10613745
47. Menne S, Butler SD, George AL, Tochkov IA, Zhu Y, et al. (2008) Antiviral effects of lamivudine, emtricitabine, adefovir dipivoxil, and tenofovir disoproxil fumarate administered orally alone and in combination to woodchucks with chronic woodchuck hepatitis virus infection. Antimicrob Agents Chemother 52 : 3617–3632. doi: 10.1128/AAC.00654-08 18676881
48. Cote PJ, Roneker C, Cass K, Schodel F, Peterson D, et al. (1993) New enzyme immunoassays for the serologic detection of woodchuck hepatitis virus infection. Viral Immunol 6 : 161–169. 8216715
49. Peek SF, Cote PJ, Jacob JR, Toshkov IA, Hornbuckle WE, et al. (2001) Antiviral activity of clevudine [L-FMAU, (1-(2-fluoro-5-methyl-beta, L-arabinofuranosyl) uracil)] against woodchuck hepatitis virus replication and gene expression in chronically infected woodchucks (Marmota monax). Hepatology 33 : 254–266. 11124844
50. Jacob JR, Korba BE, Cote PJ, Toshkov I, Delaney WEt, et al. (2004) Suppression of lamivudine-resistant B-domain mutants by adefovir dipivoxil in the woodchuck hepatitis virus model. Antiviral Res 63 : 115–121. 15302140
51. Grabherr MG, Haas BJ, Yassour M, Levin JZ, Thompson DA, et al. (2011) Full-length transcriptome assembly from RNA-Seq data without a reference genome. Nat Biotechnol 29 : 644–652. doi: 10.1038/nbt.1883 21572440
52. de la Bastide M, McCombie WR (2007) Assembling genomic DNA sequences with PHRAP. Curr Protoc Bioinformatics Chapter 11: Unit11 14.
53. Altschul SF, Gish W, Miller W, Myers EW, Lipman DJ (1990) Basic local alignment search tool. J Mol Biol 215 : 403–410. 2231712
54. Needleman SB, Wunsch CD (1970) A general method applicable to the search for similarities in the amino acid sequence of two proteins. J Mol Biol 48 : 443–453. 5420325
55. Huang X, Madan A (1999) CAP3: A DNA sequence assembly program. Genome Res 9 : 868–877. 10508846
56. Langmead B, Trapnell C, Pop M, Salzberg SL (2009) Ultrafast and memory-efficient alignment of short DNA sequences to the human genome. Genome Biol 10: R25. doi: 10.1186/gb-2009-10-3-r25 19261174
57. Li H, Handsaker B, Wysoker A, Fennell T, Ruan J, et al. (2009) The Sequence Alignment/Map format and SAMtools. Bioinformatics 25 : 2078–2079. doi: 10.1093/bioinformatics/btp352 19505943
58. Anders S, Huber W (2010) Differential expression analysis for sequence count data. Genome Biol 11: R106. doi: 10.1186/gb-2010-11-10-r106 20979621
59. Benjamini Y, Hochberg Y (1995) Controlling the false discovery rate: a practical and powerful approach to multiple testing. J Roy Statist Soc Ser B (Methodological) 57 : 289–300.
60. Subramanian A, Tamayo P, Mootha VK, Mukherjee S, Ebert BL, et al. (2005) Gene set enrichment analysis: a knowledge-based approach for interpreting genome-wide expression profiles. Proc Natl Acad Sci U S A 102 : 15545–15550. 16199517
61. Langfelder P, Horvath S (2008) WGCNA: an R package for weighted correlation network analysis. BMC Bioinformatics 9 : 559. doi: 10.1186/1471-2105-9-559 19114008
62. Menne S, Wang Y, Butler SD, Gerin JL, Cote PJ, et al. (2002) Real-time polymerase chain reaction assays for leukocyte CD and cytokine mRNAs of the Eastern woodchuck (Marmota monax). Vet Immunol Immunopathol 87 : 97–105. 12052347
63. Wang Y, Jacob JR, Menne S, Bellezza CA, Tennant BC, et al. (2004) Interferon-gamma-associated responses to woodchuck hepatitis virus infection in neonatal woodchucks and virus-infected hepatocytes. J Viral Hepat 11 : 404–417. 15357645
64. Lu Y, Xu Y, Yang D, Kemper T, Roggendorf M, et al. (2008) Molecular characterization of woodchuck type I interferons and their expression by woodchuck peripheral blood lymphocytes. Cytokine 41 : 127–135. 18096400
65. Crettaz J, Otano I, Ochoa L, Benito A, Paneda A, et al. (2009) Treatment of chronic viral hepatitis in woodchucks by prolonged intrahepatic expression of interleukin-12. J Virol 83 : 2663–2674. doi: 10.1128/JVI.02384-08 19116251
Štítky
Hygiena a epidemiologie Infekční lékařství LaboratořČlánek vyšel v časopise
PLOS Pathogens
2015 Číslo 9
- Parazitičtí červi v terapii Crohnovy choroby a dalších zánětlivých autoimunitních onemocnění
- Vakcíny proti klíšťové encefalitidě
- Kdy je nejlepší očkovat
- Možné vedlejší účinky očkování
- Imunogenita vakcín
Nejčtenější v tomto čísle
- Epicellular Apicomplexans: Parasites “On the Way In”
- Fiat Luc: Bioluminescence Imaging Reveals In Vivo Viral Replication Dynamics
- Knocking on Closed Doors: Host Interferons Dynamically Regulate Blood-Brain Barrier Function during Viral Infections of the Central Nervous System
- A KSHV microRNA Directly Targets G Protein-Coupled Receptor Kinase 2 to Promote the Migration and Invasion of Endothelial Cells by Inducing CXCR2 and Activating AKT Signaling
Zvyšte si kvalifikaci online z pohodlí domova
Mazová zátka a její řešení
nový kurzVšechny kurzy